Embed Size (px)
Citation preview
www.rarha.eu [email protected]
Helsinki 17 February 2016
Expert Meeting
What does research tell us about alcohol related health risks: RARHA work to summarize the evidence to inform the setting of low-risk drinking guidelines
www.rarha.eu
Setting guidelines and science
Setting up guidelines always includes some type of review of the science - Narrative review - Quantitative estimates of risk in various levels of alcohol
intake
Recent low-risk drinking guidelines based on sophisticated quantitative summaries of risk: Australia (2009), Canada (2012), UK (2016) - Heavy work requiring a lot of resources - Not (easily) an option for smaller and poorer countries - Could this work be done for EU countries together?
www.rarha.eu
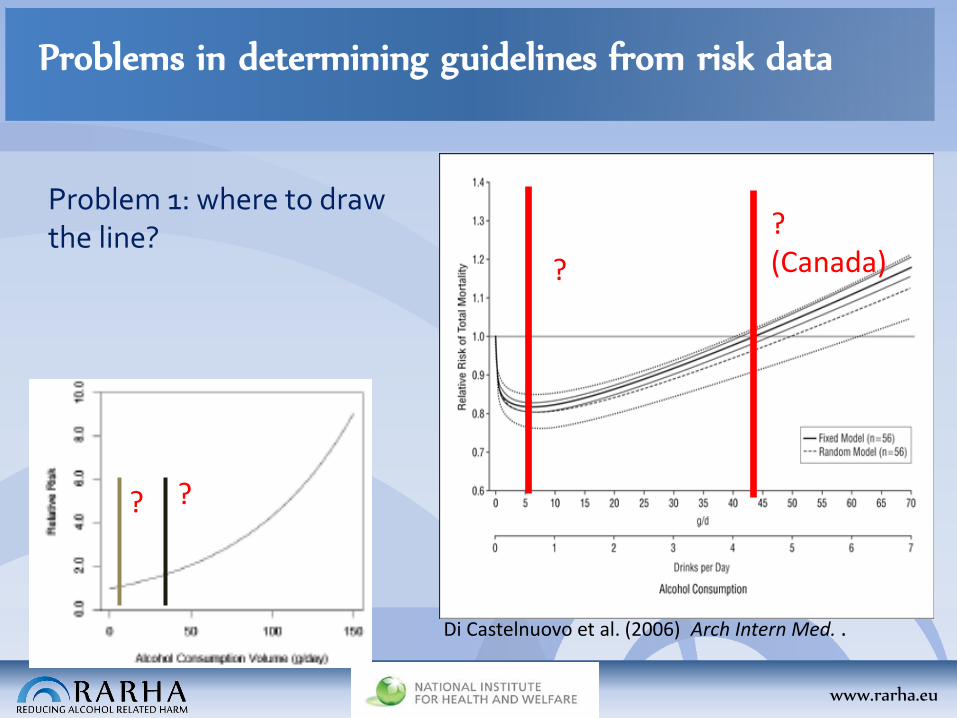
Problems in determining guidelines from risk data
Problem 1: where to draw the line? ?
(Canada) ?
Di Castelnuovo et al. (2006) Arch Intern Med. .
? ?
www.rarha.eu
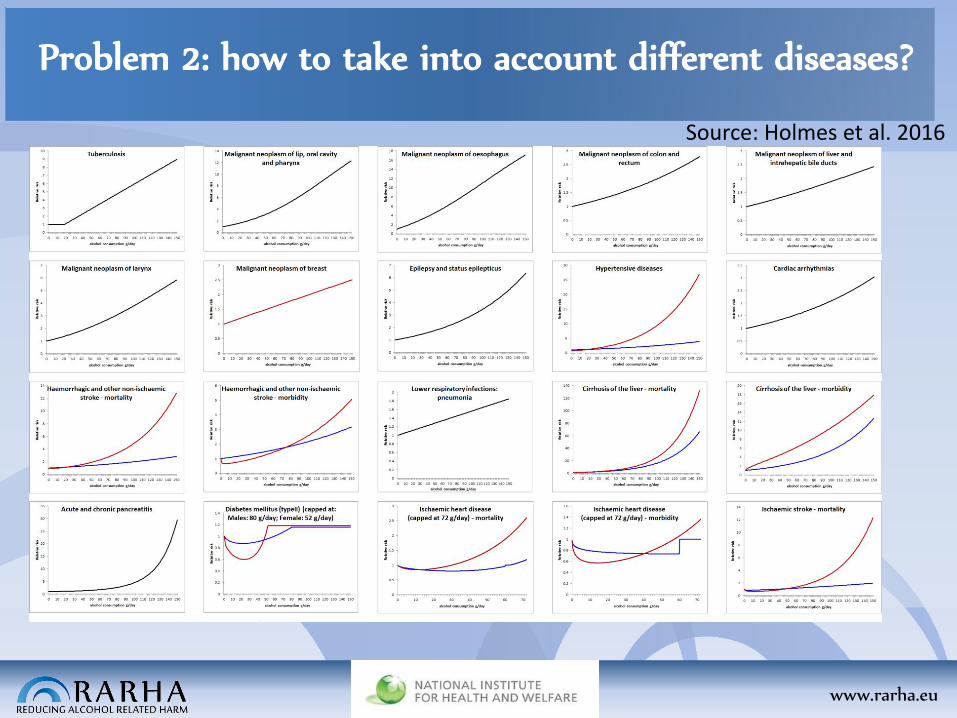
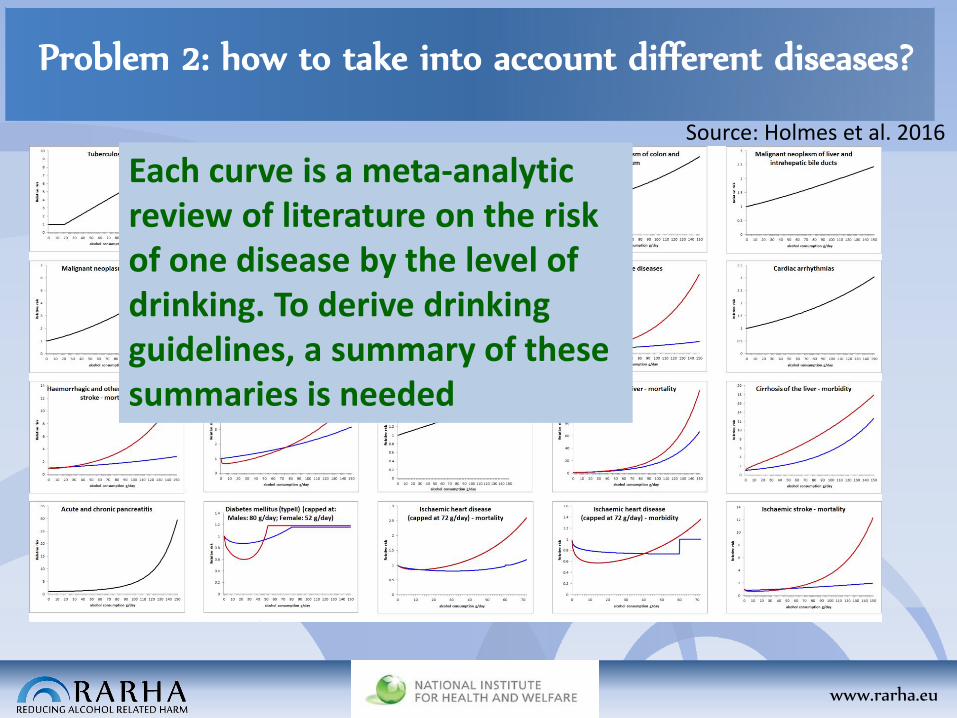
Problem 2: how to take into account different diseases?
Source: Holmes et al. 2016
www.rarha.eu
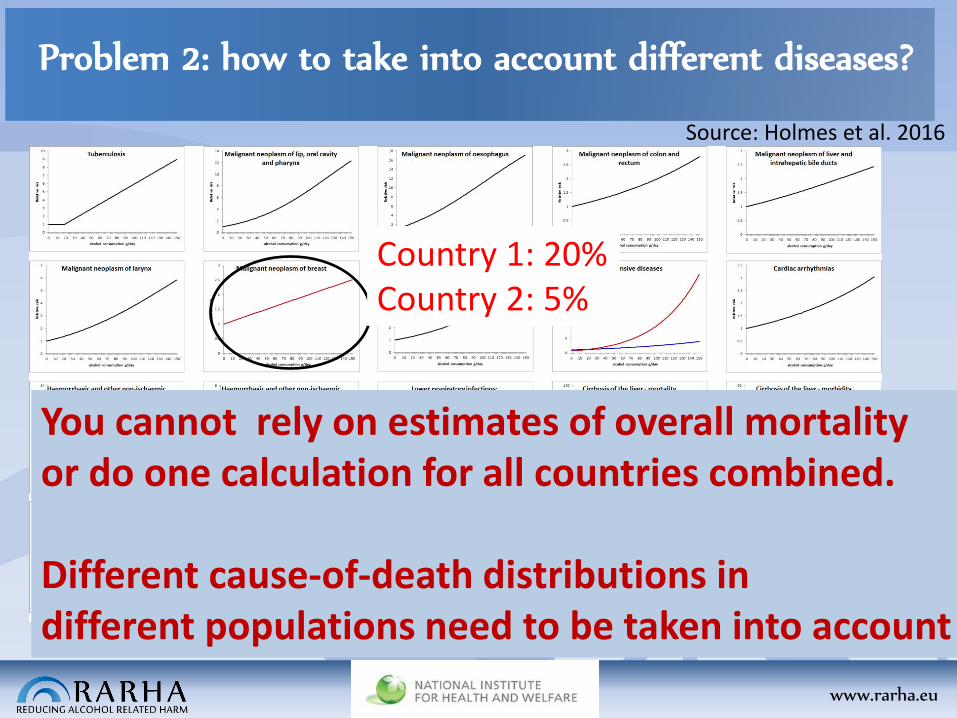
Problem 2: how to take into account different diseases?
Country 1: 20% Country 2: 5%
Source: Holmes et al. 2016
Each curve is a meta-analytic review of literature on the risk of one disease by the level of drinking. To derive drinking guidelines, a summary of these summaries is needed
www.rarha.eu
Problem 2: how to take into account different diseases?
Country 1: 20% Country 2: 5%
Country 1: 10% Country 2: 30%
You cannot rely on estimates of overall mortality or do one calculation for all countries combined. Different cause-of-death distributions in different populations need to be taken into account
Source: Holmes et al. 2016
www.rarha.eu
Work in Joint Action RARHA to summarize science
unerpinnings
- Aim: to provide this type of summarizing risk quantification for 7 countries selected to represent the variation of drinking patterns and mortality patterns in the EU.
- Estonia, Finland, Germany, Hungary, Ireland, Italy, Poland
www.rarha.eu
Work in Joint Action RARHA to summarize science
unerpinnings
Work carried out by Jürgen Rehm’s team at the Canadian Centre for Addiction and Mental Health (CAMH), also responsible for calculations for the Canadian and the Australian guidelines. http://www.camh.ca/en/research/news_and_publications/reports_and_books/Documents/Lifetime%20Risk%20of%20Alcohol-Attributable%20Mortality.pdf
www.rarha.eu
Method (problems to be solved, continued)
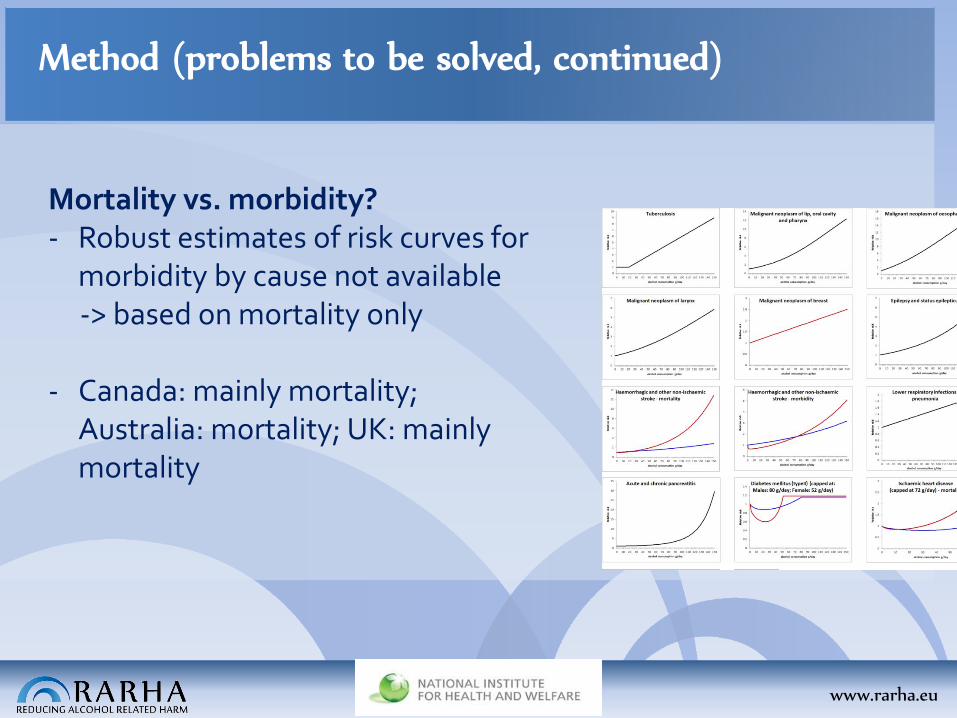
Mortality vs. morbidity? - Robust estimates of risk curves for
morbidity by cause not available -> based on mortality only
- Canada: mainly mortality;
Australia: mortality; UK: mainly mortality
www.rarha.eu
Method: what risk & “where to draw the line?”
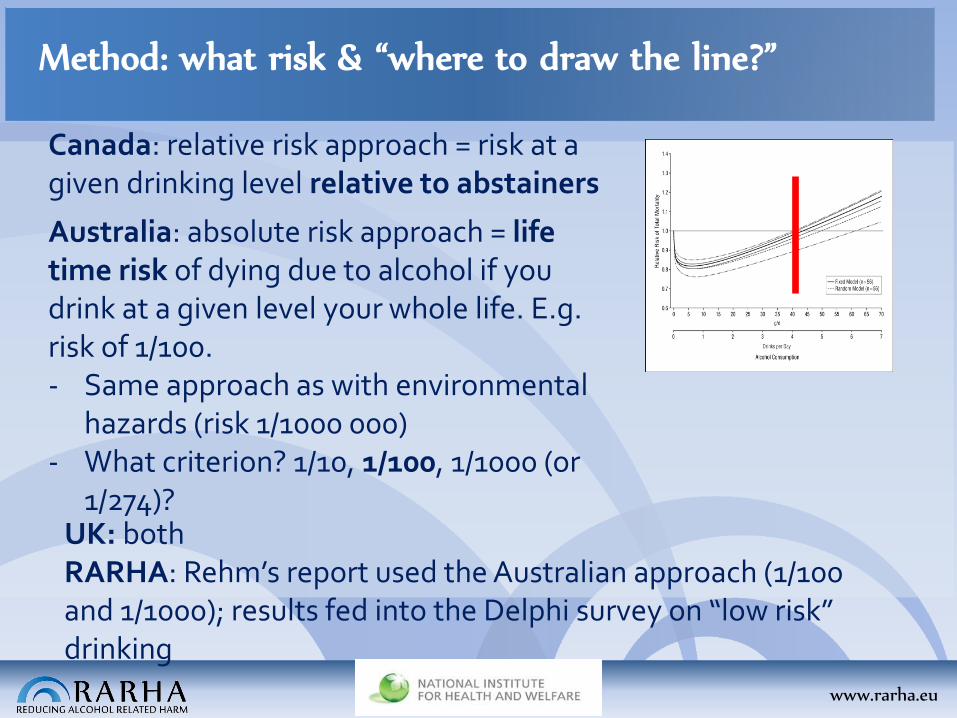
Canada: relative risk approach = risk at a given drinking level relative to abstainers
Australia: absolute risk approach = life time risk of dying due to alcohol if you drink at a given level your whole life. E.g. risk of 1/100. - Same approach as with environmental
hazards (risk 1/1000 000) - What criterion? 1/10, 1/100, 1/1000 (or
1/274)? UK: both RARHA: Rehm’s report used the Australian approach (1/100 and 1/1000); results fed into the Delphi survey on “low risk” drinking
www.rarha.eu
Method / problems to solve: men vs. women
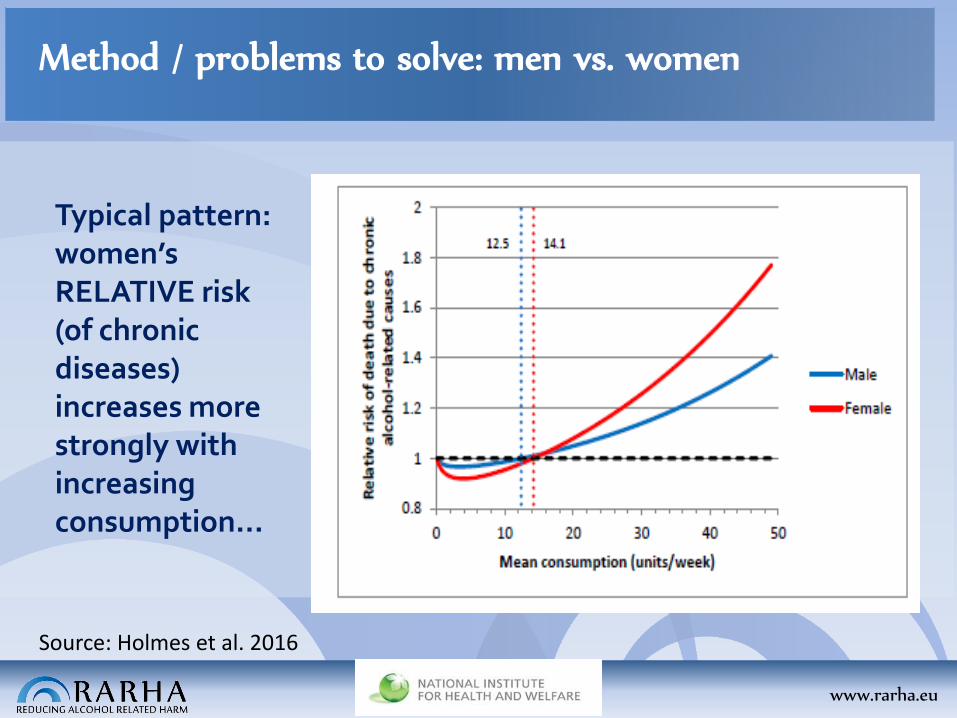
Typical pattern: women’s RELATIVE risk (of chronic diseases) increases more strongly with increasing consumption…
Source: Holmes et al. 2016
www.rarha.eu
Method / problems to solve: men vs. women
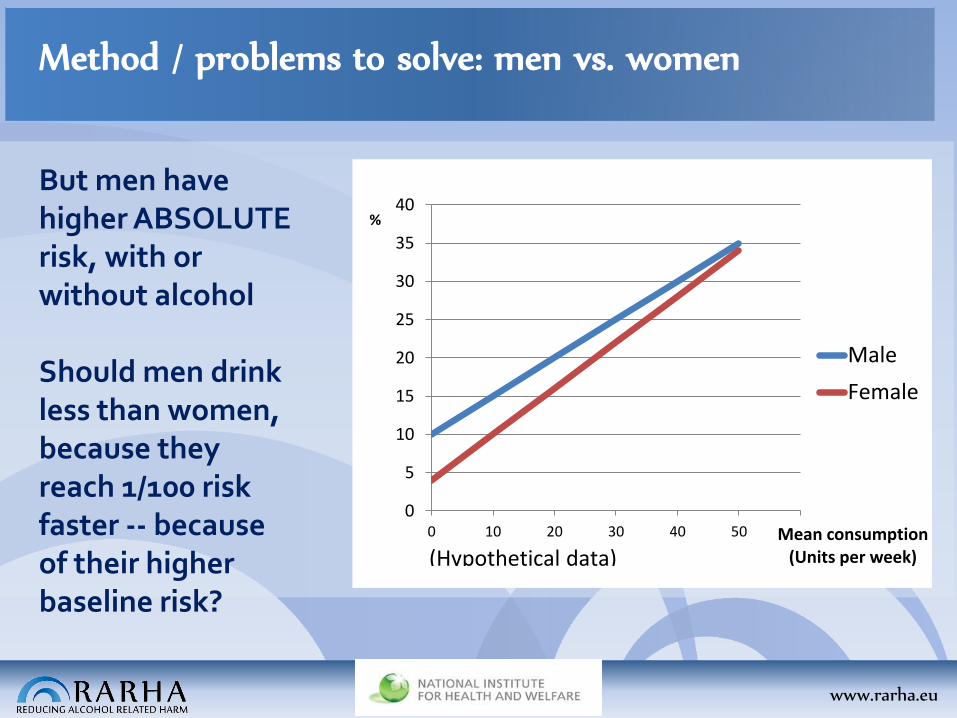
But men have higher ABSOLUTE risk, with or without alcohol Should men drink less than women, because they reach 1/100 risk faster -- because of their higher baseline risk?
0
5
10
15
20
25
30
35
40
0 10 20 30 40 50 60
%
Mean consumption (Units per week)
Male
Female
(Hypothetical data)
www.rarha.eu
Method / problems to solve: men vs. women
-> Australia & UK: same limits for men and women Calculations made for RARHA: baseline risk (risk at no alcohol consumption) assumed to be common for men and women in order to not ‘punish’ men for their higher baseline risk (+ sensitivity analysis) - Delphi survey: experts asked for their opinion
www.rarha.eu
How to decide what diseases and injuries are alcohol-
attributable & which risk functions to use?
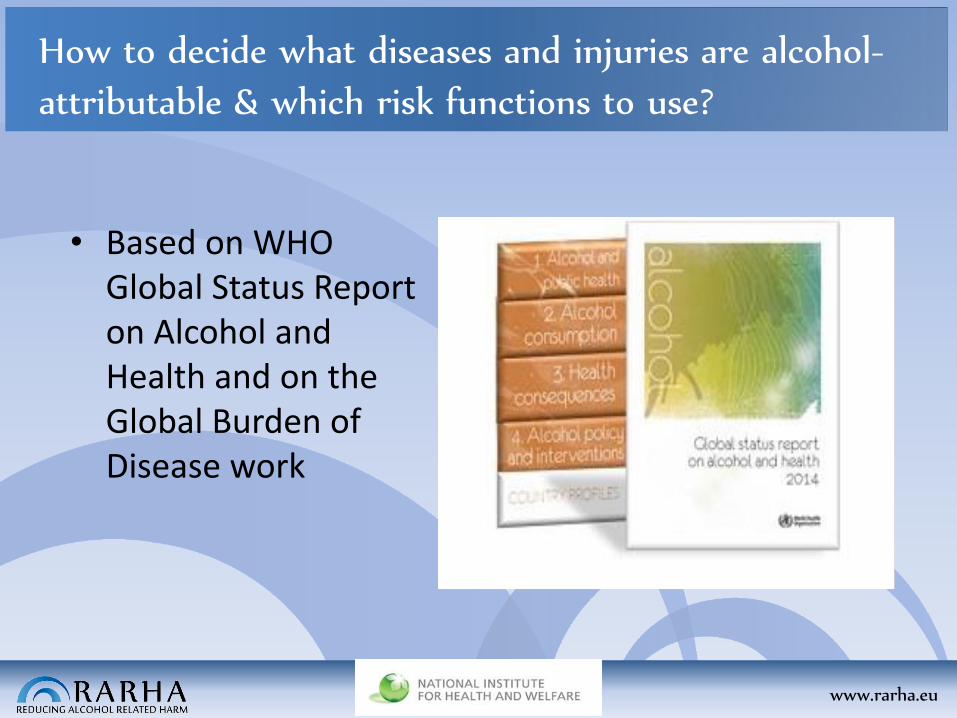
• Based on WHO Global Status Report on Alcohol and Health and on the Global Burden of Disease work
www.rarha.eu
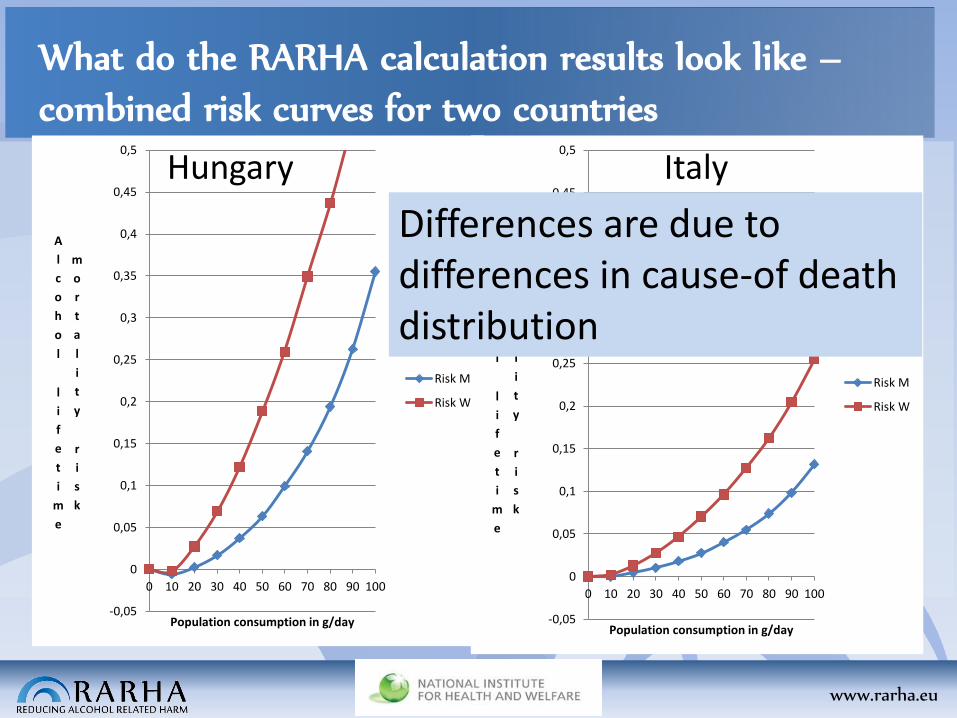
What do the RARHA calculation results look like –
combined risk curves for two countries
Xx
-0,05
0
0,05
0,1
0,15
0,2
0,25
0,3
0,35
0,4
0,45
0,5
0 10 20 30 40 50 60 70 80 90 100
A
l
c
o
h
o
l
l
i
f
e
t
i
m
e
m
o
r
t
a
l
i
t
y
r
i
s
k
Population consumption in g/day
Risk M
Risk W
-0,05
0
0,05
0,1
0,15
0,2
0,25
0,3
0,35
0,4
0,45
0,5
0 10 20 30 40 50 60 70 80 90 100
A
l
c
o
h
o
l
l
i
f
e
t
i
m
e
m
o
r
t
a
l
i
t
y
r
i
s
k
Population consumption in g/day
Risk M
Risk W
Hungary Italy
Differences are due to differences in cause-of death distribution
www.rarha.eu
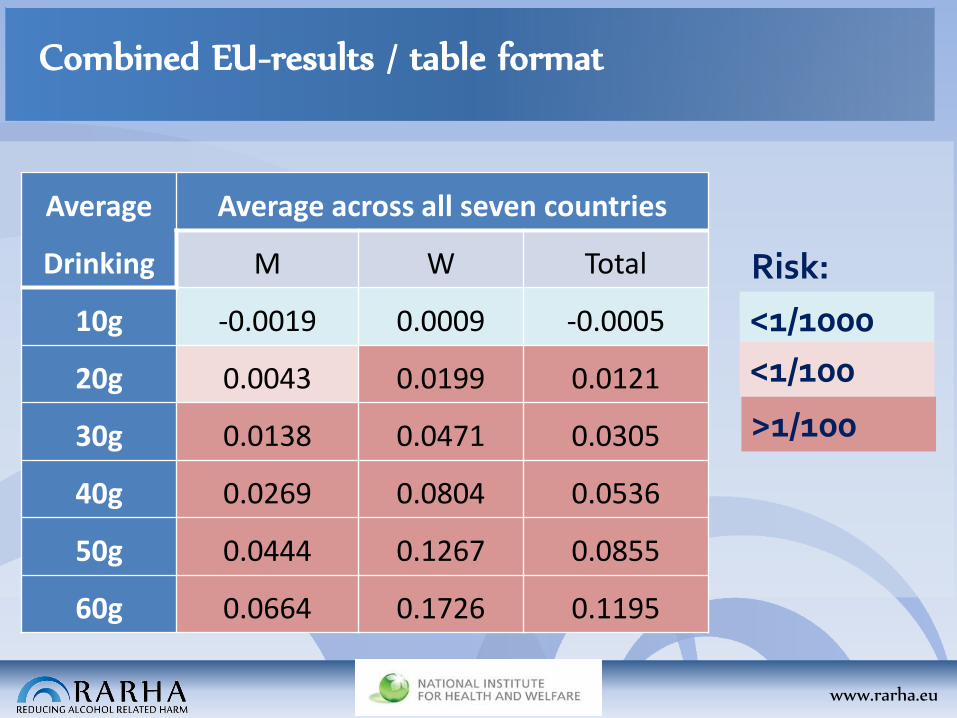
Combined EU-results / table format
Risk:
Average
Drinking
Average across all seven countries
M W Total
10g -0.0019 0.0009 -0.0005
20g 0.0043 0.0199 0.0121
30g 0.0138 0.0471 0.0305
40g 0.0269 0.0804 0.0536
50g 0.0444 0.1267 0.0855
60g 0.0664 0.1726 0.1195
<1/1000
<1/100
>1/100
www.rarha.eu
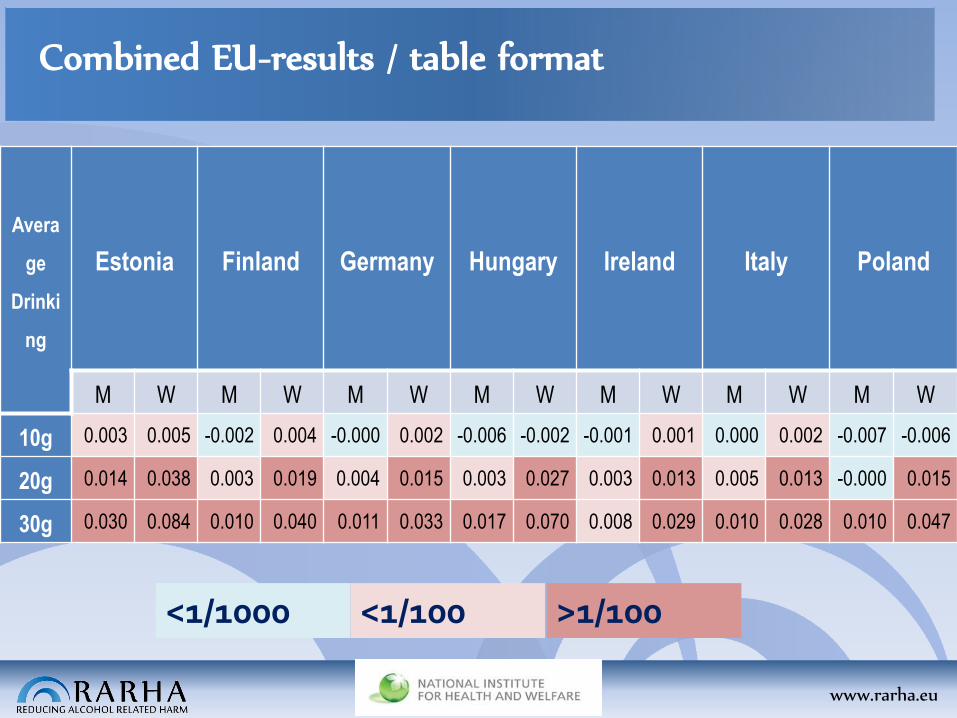
Combined EU-results / table format
Avera
ge
Drinki
ng
Estonia Finland Germany Hungary Ireland Italy Poland
M W M W M W M W M W M W M W
10g 0.003 0.005 -0.002 0.004 -0.000 0.002 -0.006 -0.002 -0.001 0.001 0.000 0.002 -0.007 -0.006
20g 0.014 0.038 0.003 0.019 0.004 0.015 0.003 0.027 0.003 0.013 0.005 0.013 -0.000 0.015
30g 0.030 0.084 0.010 0.040 0.011 0.033 0.017 0.070 0.008 0.029 0.010 0.028 0.010 0.047
<1/1000 <1/100 >1/100
www.rarha.eu
Role of these calculations?
The risk calculations might help individual countries in assessing risks and in deriving guidelines In Joint Action RARHA the risk calculations were one point of departure in the Delphi survey to explore consensus and differing views
This presentation was produced for a meeting organized within Joint Action on Reducing Alcohol Related Harm (RARHA) which has received funding from the European Union, in the framework of the
Health Programme (2008-2013).
The content of this presentation represents the views of the author/s and it is their sole responsibility; it can in no way be taken
to reflect the views of the European Commission or of the Consumers, Health, Agriculture and Food Executive Agency or any other body of the European Union. The European Commission and the Executive Agency do not accept responsibility for any use that
may be made of the information it contains.


![A life course approach to preventing drugs & alcohol risks [March 2016 Int'l Crime & Policing Conference]](https://img.pdfslide.us/doc/110x75/58a73cad1a28ab84308b5f21/a-life-course-approach-to-preventing-drugs-alcohol-risks-march-2016-intl.jpg)