Embed Size (px)
Citation preview

A Relative Value A Relative Value Calculator For Pain Calculator For Pain
ProceduresProcedures
James B. Macon, M.D.James B. Macon, M.D.Framingham NeuroSpineFramingham NeuroSpine
Framingham, MassachusettsFramingham, Massachusetts
Copyright 2010 James B. Macon, M.D.Copyright 2010 James B. Macon, M.D.

DisclosureDisclosure
James B. Macon, M.D. is a James B. Macon, M.D. is a consultant for Spine Surgical consultant for Spine Surgical
Innovations, Inc.Innovations, Inc.

Value DefinitionValue Definition
Value for patientsValue for patients ==
Health Outcomes perHealth Outcomes per
$ Cost Expended$ Cost Expended
Porter, M.E. “A Strategy for Health Porter, M.E. “A Strategy for Health Care Reform – Toward a Value-Care Reform – Toward a Value-
Based System” Based System” NEJMNEJM 361: 109- 361: 109-112, 2009112, 2009

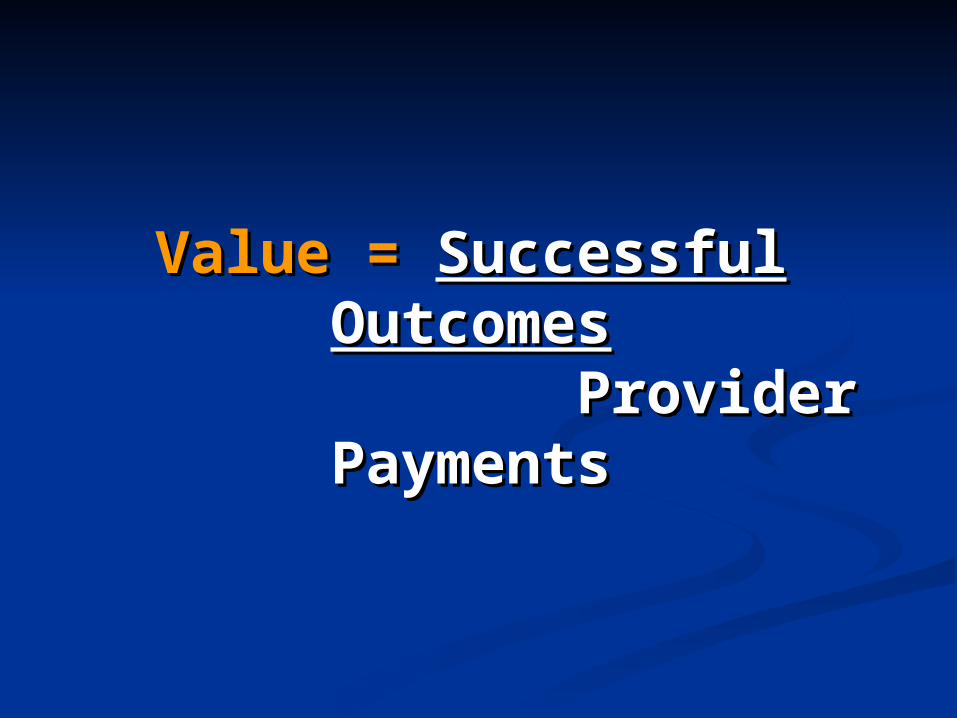
Value = Value = Successful Successful OutcomesOutcomes
Provider Provider PaymentsPayments

Outcome TiersOutcome Tiers Tier I : Tier I : primary outcome primary outcome (pain, neuro status,(pain, neuro status, return to work, disability status)return to work, disability status)
Tier II : Tier II : complicationscomplications (infections, root injury, (infections, root injury, CSF leak, delay to recovery)CSF leak, delay to recovery)
Tier III : Tier III : recurrencesrecurrences ( re-herniation, re-op, ( re-herniation, re-op, delayed adverse events- scarring)delayed adverse events- scarring)
Convert all outcomes to % recovery to baselineConvert all outcomes to % recovery to baseline
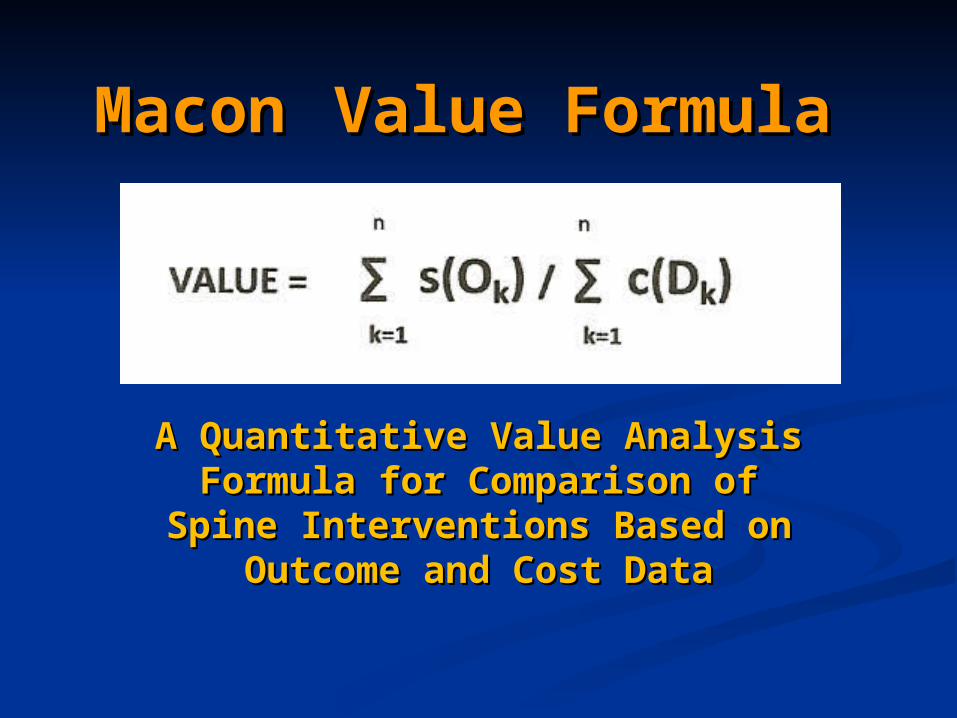
MaconMacon Value FormulaValue Formula
A Quantitative Value Analysis A Quantitative Value Analysis Formula for Comparison of Formula for Comparison of
Spine Interventions Based on Spine Interventions Based on Outcome and Cost DataOutcome and Cost Data
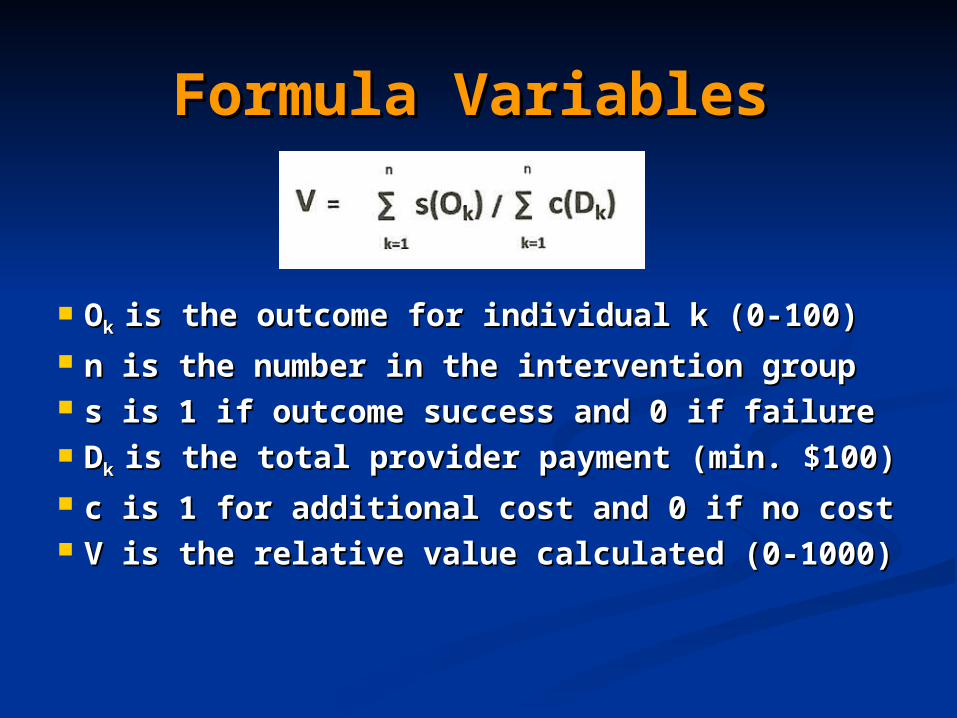
Formula VariablesFormula Variables
OOk k is the outcome for individual k (0-100)is the outcome for individual k (0-100) n is the number in the intervention groupn is the number in the intervention group s is 1 if outcome success and 0 if failures is 1 if outcome success and 0 if failure DDk k is the total provider payment (min. is the total provider payment (min.
$100)$100) c is 1 for additional cost and 0 if no costc is 1 for additional cost and 0 if no cost V is the relative value calculated (0-1000)V is the relative value calculated (0-1000)

Formula StepsFormula Steps Identify condition ICD9 codes (722.10/724.3) <4 wksIdentify condition ICD9 codes (722.10/724.3) <4 wks Identify intervention groups CPT code (62311/63030)Identify intervention groups CPT code (62311/63030) Define group size n to be studied (10)Define group size n to be studied (10) Define severity rating for the condition (8-10/10 pain)Define severity rating for the condition (8-10/10 pain) Select outcome measures to be studied ( Tiers 1-3)Select outcome measures to be studied ( Tiers 1-3) Convert outcome measure to scale (0-100% pain Convert outcome measure to scale (0-100% pain
relief)relief) Define success range for outcomes (70-100)Define success range for outcomes (70-100) Collect outcomes for study time interval (3-12 months)Collect outcomes for study time interval (3-12 months) Collect cost data = total payments to all providersCollect cost data = total payments to all providers Enter outcome and cost data into spreadsheetEnter outcome and cost data into spreadsheet Prepare formula summary table based on resultsPrepare formula summary table based on results Use table results to optimize value and successUse table results to optimize value and success Plot graph of value over study duration to compare Plot graph of value over study duration to compare
proceduresprocedures

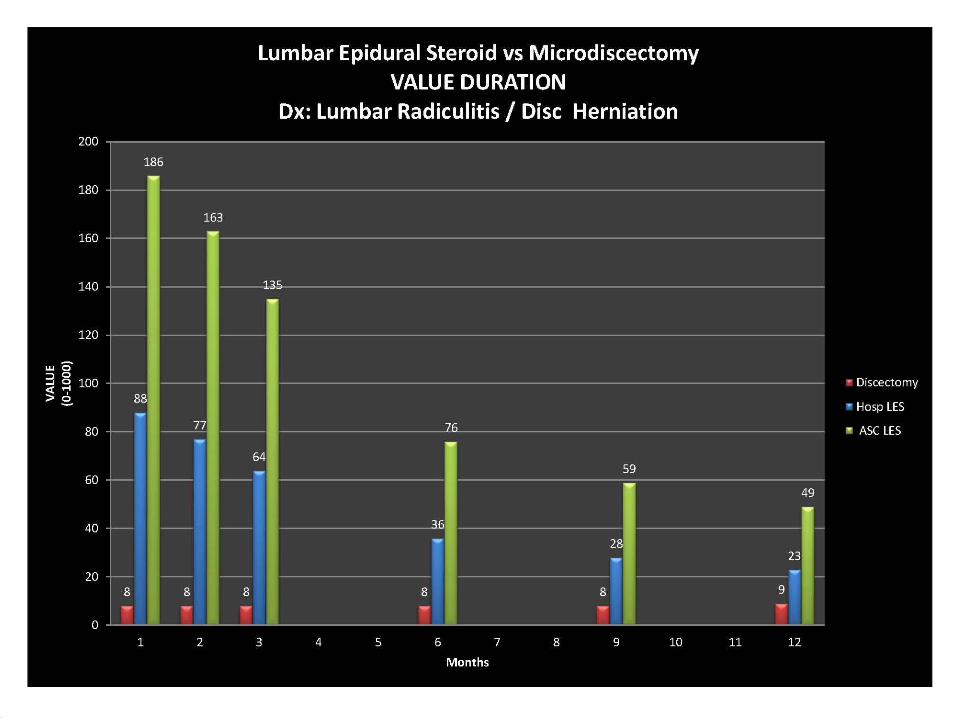
Lumbar Epidural SteroidLumbar Epidural Steroid

Lumbar DiscectomyLumbar Discectomy


Cross Over to DiscectomyCross Over to Discectomy
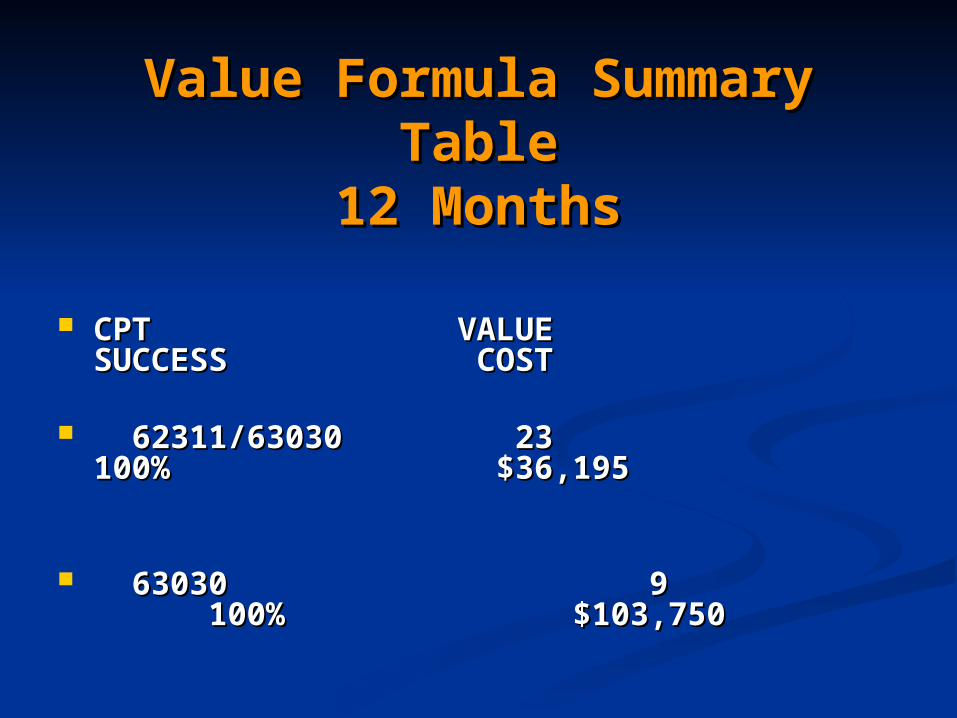
Value Formula Summary Value Formula Summary TableTable
12 Months12 Months
CPT VALUE SUCCESS CPT VALUE SUCCESS COST COST
62311/63030 23 100% 62311/63030 23 100% $36,195 $36,195
63030 9 100% 63030 9 100% $103,750 $103,750

Value-Based ConclusionsValue-Based Conclusions The goal of care is to maximize group valueThe goal of care is to maximize group value Maximum value is not always max effectivenessMaximum value is not always max effectiveness Maximum value is not always evidence-basedMaximum value is not always evidence-based Less effective procedures may have high valueLess effective procedures may have high value Sequence procedures to maximize group valueSequence procedures to maximize group value Order procedures to perform high value firstOrder procedures to perform high value first Perform high success low value procedures lastPerform high success low value procedures last Eliminate ineffective unsuccessful procedures Eliminate ineffective unsuccessful procedures


To use the Macon Value To use the Macon Value FormulaFormula
Request a copy of the spread sheet for Request a copy of the spread sheet for use in your practice to compare use in your practice to compare intervention groupsintervention groups
E-mail : E-mail : [email protected]@fnspine.com and request and request Website: www.fnspine.comWebsite: www.fnspine.com The Macon value formula is copyright The Macon value formula is copyright
protected by the U.S. Copyright Officeprotected by the U.S. Copyright Office Credit the formula to the author when Credit the formula to the author when
data is presented or published.data is presented or published.

E-mail :E-mail : [email protected]@fnspine.com ICD 9 of study ICD 9 of study CPT for all groupsCPT for all groups Group sizeGroup size Number of groups in studyNumber of groups in study Success range definitionSuccess range definition Crossover designCrossover design Return e-mail addressReturn e-mail address