Embed Size (px)
Citation preview

T2DM Achieving target challenges
Patient centered approach
By:Lobna Farag Eltoony
Head of diabetes and Endocrinology Unit
Department Of Internal Medicine
Assuit University

Topics for discussion
T2DM worldwide burden
Individualize patient approach
DPP4 I & practical facts
Insulin in T2DM
Beyond glucose control


ME & Diabetes prevalence

“increasingly complex and to some extent controversial”
nature of glycemic management for type 2 diabetes, the
“widening array of pharmacological agents now available,
mounting concerns about their potential adverse effects and
new uncertainties regarding the benefits of intensive
glycemic control on macrovascular complications,”
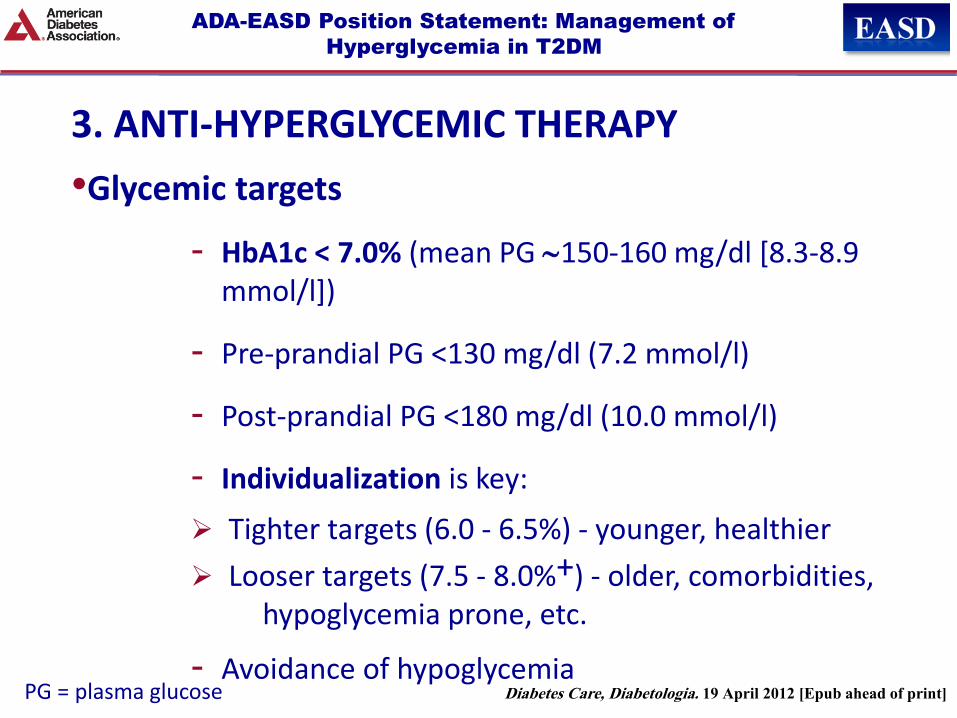
ADA-EASD Position Statement: Management of
Hyperglycemia in T2DM
3. ANTI-HYPERGLYCEMIC THERAPY
•Glycemic targets
- HbA1c < 7.0% (mean PG 150-160 mg/dl [8.3-8.9 mmol/l])
- Pre-prandial PG <130 mg/dl (7.2 mmol/l)
- Post-prandial PG <180 mg/dl (10.0 mmol/l)
- Individualization is key:
Tighter targets (6.0 - 6.5%) - younger, healthier
Looser targets (7.5 - 8.0%+) - older, comorbidities, hypoglycemia prone, etc.
- Avoidance of hypoglycemia
PG = plasma glucose Diabetes Care, Diabetologia. 19 April 2012 [Epub ahead of print]

Figure 1 Diabetes Care, Diabetologia. 19 April 2012 [Epub ahead of print]
(Adapted with permission from: Ismail-Beigi F, et al. Ann Intern Med 2011;154:554)

T2DM Anti-hyperglycemic Therapy: General Recommendations Diabetes Care, Diabetologia. 19 April 2012
]

Adapted Recommendations: When Goal is to Avoid Weight Gain Diabetes Care, Diabetologia. 19 April
2012 [Epub ahead of print]

Adapted Recommendations: When Goal is to Avoid Hypoglycemia Diabetes Care, Diabetologia. 19 April 2012
[Epub ahead of print]
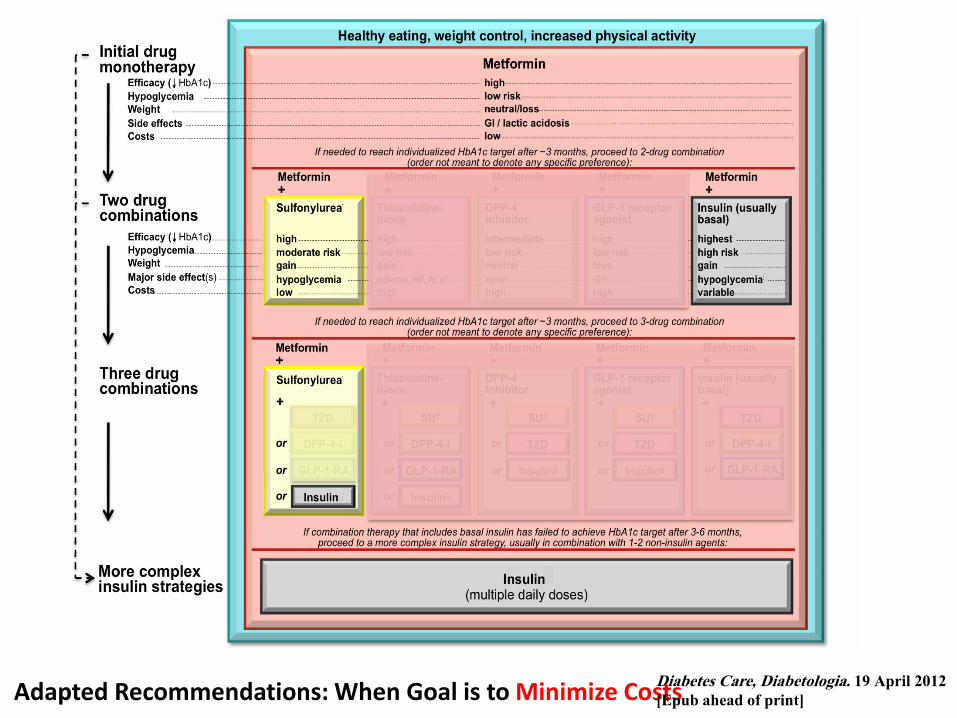
Adapted Recommendations: When Goal is to Minimize Costs Diabetes Care, Diabetologia. 19 April 2012
[Epub ahead of print]

Sitagliptin Enhances Active Incretin Levels
Through Inhibition of DPP-41–4
By increasing and prolonging active incretin levels, sitagliptin increases insulin release
and decreases glucagon levels in the circulation in a glucose-dependent manner.
Release of
active incretins
GLP-1 and GIPa
Blood glucose in
fasting and
postprandial states
Ingestion
of food
Glucagon
from alpha cells
(GLP-1)
Hepatic
glucose
production
GI tract
DPP-4
enzyme
Inactive
GLP-1
X Sitagliptin
(DPP-4
inhibitor)
Insulin from
beta cells
(GLP-1 and GIP)
Glucose-dependent
Glucose-dependent
Pancreas
Inactive
GIP
Beta cells
Alpha cells
Peripheral
glucose
uptake
DPP-4=dipeptidyl peptidase 4; GI=gastrointestinal; GIP=glucose-dependent insulinotropic peptide; GLP-1=glucagon-like peptide-1. aIncretin hormones GLP-1 and GIP are released by the intestine throughout the day, and their levels increase in response to a meal. 1. Kieffer TJ et al. Endocr Rev. 1999;20(6):876–913. 2. Ahrén B. Curr Diab Rep. 2003;3(5):365–372. 3. Drucker DJ. Diabetes Care. 2003;26(10):2929–2940, 4. Holst JJ. Diabetes Metab Res Rev. 2002;18(6):430–441.
N
N
N
N
N
N
N
O
O
NH2
Linagliptin
Vildagliptin
N
O
N
N H
O H
N
N N
N
N
O
O
Alogliptin
Sitagliptin
F
F F O
F F
F
NH2
N
N N
N
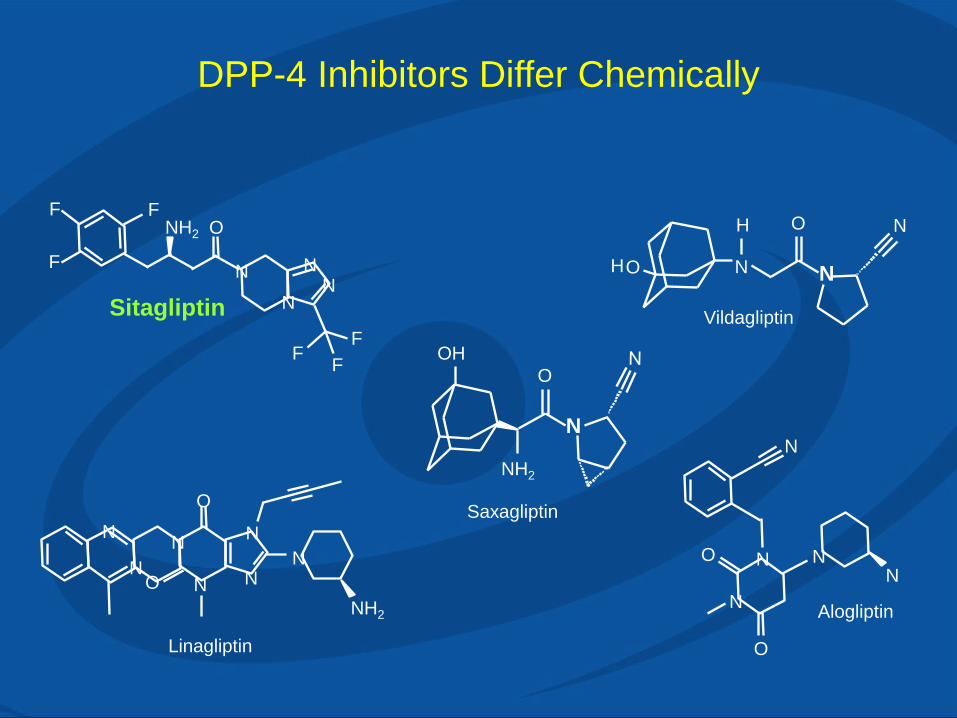
DPP-4 Inhibitors Differ Chemically
Saxagliptin
N
O
OH
NH2

Rationale for Once-Daily Dosing of
Sitagliptin Based on DPP-4 Inhibition1,a
14 DPP-4=dipeptidyl peptidase-4; qd=once daily. a97% weighted average inhibition of plasma DPP-4 activity through 24 hours postdose. bDPP-4 inhibition corrected for sample assay dilution.
1. Alba M et al. Curr Med Res Opin. 2009;25(10):2507–2514.
Single-dose study in healthy subjects (n=6)
Hours Postdose 0 1 2 4 6 8 12 16 24
DP
P-4
Inhi
bitio
n, %
b
0
20
40
60
80
100
Sitagliptin 100 mg qd

Sitagliptin is a different molecule
Sitagliptin Vildagliptin
Molecular structure
Half Life (T1/2) 12.4 hrs 2-3 hrs
DPP-4 Inhibition* post 24 hrs 100mg QD 80-97% @ 24hrs 50 mg QD: 20% @ 24 hrs
50 mg BID: >80% @ 12hrs
DPP-4 Peak Inhibition ~97% ~95%
Selectivity for DPP-IV vs. DPP-8/DPP-9* 2600 fold for DPP4 vs. DPP-8
10,000 fold for DPP4 vs. DPP-9
270 fold for DPP4 vs. DPP-8
32 fold for DPP4 vs. DPP-9
Metabolism ~16% metabolized
69% metabolized
mainly renal
(inactive metabolite)
Bioavailability ~87% 85%
Liver Monitoring NO YES
Elimination Kidney (87%)
79% mostly unchanged
Kidney (85%)
23% unchanged
Liver (15%)
FDA YES NO
* All use different proprietary assays with different dilutions and therefore % DPP-4 inhibition cannot be compared across assays
H O
N H
O
N
N C
F
F
F O N
N H 2
N N N
C F 3
Data on file, MSD

Week 30
Addition of Sitagliptin or Glimepiride in Patients
Inadequately Controlled on Metformin:
Study Design1
Continue stable dose of metformin
Single-blind Placebo Run-in
Double-blind Treatment Period
Week –2 Day 1
Patients ≥18 years of age with T2DM on stable dose of metformin (≥1500 mg/day) for ≥12 weeks and HbA1c 6.5%– 9.0%
Glimepiride (started at 1 mg qd and up-titrated until week
18 as needed up to maximum dose of 6 mg qd)
qd=once daily; R=randomization; T2DM=type 2 diabetes mellitus.
1. Arechavaleta R et al. Diabetes Obes Metab. 2011;13(2):160–168.
Sitagliptin 100 mg qd
Week –4
R
Screening Period

HbA1c-Lowering Efficacy of Sitagliptin at
Week 30 Was Noninferior to That of Glimepiride in Patients
Inadequately Controlled on Metformin1
LS=least squares; SE=standard error.
aMean dose of glimepiride (following the 18-week titration period) was 2.1 mg per day.
1. Arechavaleta R et al. Diabetes Obes Metab. 2011;13(2):160–168.
Week
LS
Mean
(±
SE
) H
bA
1c,
%
Per-Protocol Population
6.0
6.2
6.4
6.6
6.8
7.0
7.2
7.4
7.6
7.8
8.0
0 6 12 18 24 30
(95% CI)
0.07% (–0.03, 0.16)
Sitagliptin 100 mg + metformin (n=443)
Glimepiridea + metformin (n=436)
–0.47
–0.54

Addition of Sitagliptin or Glimepiride in Patients
Inadequately Controlled on Metformin: Clinical
Assessment of Hypoglycemia Over 30 Weeks1
APaT Population
APaT=all patients as treated; CI=confidence interval.
aMean dose of glimepiride (following the 18-week titration period) was 2.1 mg per day.
1. Arechavaleta R et al. Diabetes Obes Metab. 2011;13(2):160–168.
7
22
0
5
10
15
20
25
Patients
With ≥
1
Hypogly
cem
ic E
pis
ode,
%
(95% CI)
–15.0% (–19.3, –10.9)
(P<0.001)
Sitagliptin 100 mg + metformin (n=516)
Glimepiridea + metformin (n=518)

Addition of Sitagliptin or Glimepiride in Patients
Inadequately Controlled on Metformin:
Body Weight Change from Baseline1
LS
Mean C
hange (±
SE
) in
Body
Weig
ht
Fro
m B
aselin
e,
kg
Week
0 6 12 18 24 30
–1
0
1
2
APaT Population
Sitagliptin 100 mg + metformin
Glimepiridea + metformin
= –2.0 kg
(P<0.001)
–0.8 kgb
1.2 kgb
APaT=all patients as treated; LS=least squares; SE=standard error.
aMean dose of glimepiride (following the 18-week titration period) was 2.1 mg per day. bLS mean body weight change at 30 weeks.
1. Arechavaleta R et al. Diabetes Obes Metab. 2011;13(2):160–168.

Earlier and Appropriate Intervention May
Improve Patients’ Chances of Reaching Goal
OAD=oral antidiabetic agent. Adapted from Del Prato S et al. Int J Clin Pract. 2005;59(11):1345–1355. Copyright © 2005. Adapted with permission of Blackwell Publishing Ltd.
Published Conceptual Approach
Hb
A1c
Go
al
Mean HbA1c
of patients Duration of Diabetes
OAD
monotherapy
Diet and
exercise
OAD
combination
OAD
up-titration
OAD +
multiple daily
insulin
injections
OAD +
basal insulin
Conventional stepwise treatment approach
Earlier and more aggressive intervention approach
6
7
8
9
10

Initial Combination Therapy With Sitagliptin Plus Metformin
vs Metformin Monotherapy: HbA1c Results by
Mean Baseline HbA1c at Week 18
FAS=full analysis set; FDC=fixed-dose combination.
Data on file, MSD.
Hb
A1c
LS
Mea
n C
han
ge
fro
m
Bas
elin
e, %
Baseline HbA1c,% <8 ≥8 and <9 ≥9 and <10 ≥10 and <11 ≥11 FAS (Week 18)
P=0.009
P<0.001
P<0.001
Mean HbA1c,% 7.6 8.4 9.5 9.4 10.4 12.2
n=
–1.1
–1.6
–2.0
–2.9
–3.6
–2.7
–2.1
–1.7
–1.1
–0.8
–4.0
–3.5
–3.0
–2.5
–2.0
–1.5
–1.0
–0.5
0
Sitagliptin/metformin FDC 50/1000 mg bid
Metformin 1000 mg bid
99 95 99 111 87 101 124 109 150 148
P=0.158
P=0.111

ADA-EASD Position Statement: Management of
Hyperglycemia in T2DM
Long (Detemir)
Rapid (Lispro, Aspart, Glulisine)
Hours
Long (Glargine)
0 2 4 6 8 10 12 14 16 18 20 22 24
Short (Regular)
Hours after injection
Insu
lin le
vel
•Therapeutic options: Insulin
Intermediate (NPH)

Effect of Sitagliptin in
Patients With Type 2 Diabetes and Inadequate
Glycemic Control on Insulin Therapy (Alone or in
Combination With Metformin)
Diabetes, Obesity and Metabolism 2010

Addition of Sitagliptin to Insulin Therapy: Study Design
Single-blind placebo run-in
period
• Continue on a stable dose of insulin with or without metformin
• Begin single-blind run-in period
Randomization Week 24
24-Week Stable Insulin Dose Period
QD=daily.
Diabetes, Obesity and Metabolism 12: 167–177, 2010.
• Patients with type 2 diabetes
• Age >21 years
• Receiving insulin (including glargine, detemir, ultralente, NPH, lente, or premixed insulin) alone or with metformin ≥1500 mg/day
• Not receiving premeal short-acting insulin
• HbA1c ≥7.5% and ≤11%
Placebo (n=319)
Sitagliptin 100 mg QD (n=322)
R
Screening
visit Week –2

0 6 12 18 24
0.1
Addition of Sitagliptin to Insulin Therapy: HbA1c Change From Baseline
Over Time
aBaseline mean HbA1c: 8.72% for sitagliptin, 8.64% for placebo
FAS=full analysis set; LOCF=last observation carried forward; LS=least squares; SE=standard error.
Diabetes, Obesity and Metabolism 12: 167–177, 2010.
FAS Population (LOCF)
Placeboa
Sitagliptina
Difference = –0.56%
(P<0.001)
Hb
A1
c L
S M
ean
Ch
an
ge
Fro
m B
aselin
e, %
(S
E)
Weeks
0.0
–0.8
–0.7
–0.6
–0.5
–0.4
–0.3
–0.2
–0.1
–0.8
–0.03%
–0.59%
(n=305)
(n=312)

Sitagliptin
Placebo
Addition of Sitagliptin to Insulin Therapy: HbA1c Change
From Baseline by Insulin Type
FAS Population at 24 Weeks (LOCF)a
P-value for treatment by subgroup interaction = 0.949
aExcluding data after initiation of rescue therapy.
FAS=full analysis set; LOCF=last observation carried forward; LS=least squares; SE=standard error.
Diabetes, Obesity and Metabolism 12: 167–177, 2010.
Hb
A1
c L
S M
ean
Ch
an
ge
Fro
m B
aselin
e, %
(S
E)
–1.0
0.0
–0.8
–0.6
–0.4
–0.2
Receiving Premixed
Insulin
Receiving Long- or Intermediate-acting
Insulin
–0.58
–0.02
–0.61
–0.04
n=80 n=80
n=225 n=232
P<0.001 P<0.001
Mean baseline HbA1c, % 8.59 8.50 8.76 8.69

Addition of Sitagliptin to Insulin Therapy: HbA1c Change From Baseline by Metformin
Use
Not Receiving Metformin
Receiving Metformin
N=223 N=229
Sitagliptin
Placebo
P-value for treatment by subgroup interaction = 0.437
Hb
A1
c L
S M
ean
Ch
an
ge
Fro
m B
aselin
e, %
(S
E)
–1.0
0.4
–0.8
–0.6
–0.4
–0.2
0.2
0.0
–0.55
0.10
–0.66
–0.13
P<0.001 P<0.001
n=82 n=83 n=223 n=229
FAS Population at 24 Weeks (LOCF)a
aExcluding data after initiation of rescue therapy.
FAS=full analysis set; LOCF=last observation carried forward; LS=least squares; SE=standard error.
Diabetes, Obesity and Metabolism 12: 167–177, 2010.
Mean baseline HbA1c, % 8.68 8.76 8.73 8.60

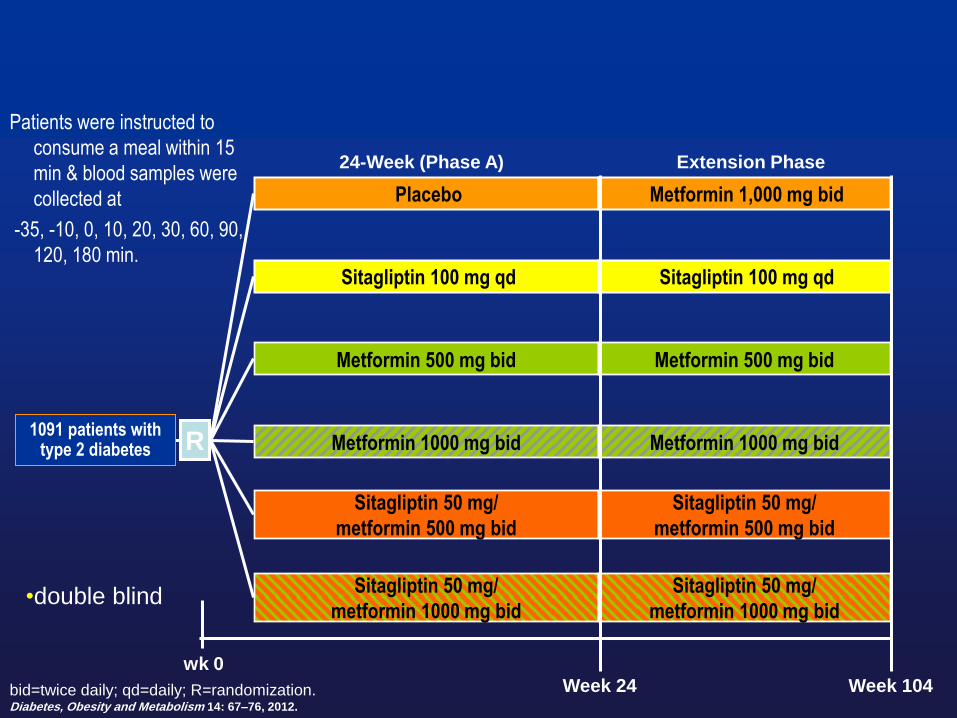
bid=twice daily; qd=daily; R=randomization. Diabetes, Obesity and Metabolism 14: 67–76, 2012.
wk 0
1091 patients with type 2 diabetes
Week 24
Placebo
Sitagliptin 100 mg qd
Metformin 500 mg bid
Metformin 1000 mg bid
Sitagliptin 50 mg/
metformin 500 mg bid
Sitagliptin 50 mg/
metformin 1000 mg bid
R
Week 104
Metformin 1,000 mg bid
Sitagliptin 100 mg qd
Metformin 500 mg bid
Metformin 1000 mg bid
Sitagliptin 50 mg/
metformin 500 mg bid
Sitagliptin 50 mg/
metformin 1000 mg bid
24-Week (Phase A) Extension Phase
Patients were instructed to
consume a meal within 15
min & blood samples were
collected at
-35, -10, 0, 10, 20, 30, 60, 90,
120, 180 min.
•double blind

Conclusions
Initial combination of Sitagliptin & Metformin enhanced the responsiveness of pancreatic B cells to glucose in both fasting & post-prandial states.
Initial combination therapy demonstrated greater improvements in B cell function than individual monotherapies.
Improvements in B cell function were maintained over 2 years treatment period.
Diabetes, Obesity and Metabolism 14: 67–76, 2012.

32
CHD=coronary heart disease.
1. Centers for Disease Control and Prevention. National diabetes fact sheet: national estimates and general information on diabetes and prediabetes in the
United States, 2011. Atlanta, GA: U.S. Department of Health and Human Services, Centers for Disease Control and Prevention, 2011.
Most Patients With Diabetes Die of
Cardiovascular Disease1
National Diabetes Fact Sheet 2011: among people ≥65
years of age
– Heart disease was noted on 68% of diabetes-related death
certificates.
– Risk of stroke is 2 to 4 times greater among people with diabetes
compared with those without diabetes.
– Stroke was noted on 16% of diabetes-related death certificates.
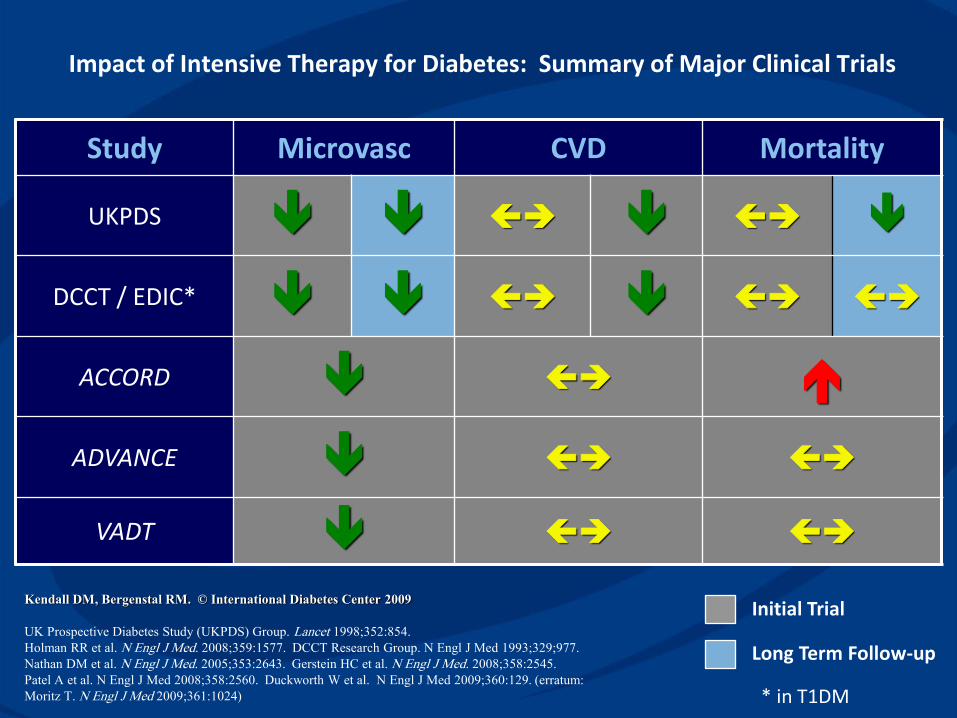
Impact of Intensive Therapy for Diabetes: Summary of Major Clinical Trials
Study Microvasc CVD Mortality
UKPDS
DCCT / EDIC*
ACCORD
ADVANCE
VADT
Long Term Follow-up
Initial Trial
* in T1DM
Kendall DM, Bergenstal RM. © International Diabetes Center 2009
UK Prospective Diabetes Study (UKPDS) Group. Lancet 1998;352:854.
Holman RR et al. N Engl J Med. 2008;359:1577. DCCT Research Group. N Engl J Med 1993;329;977.
Nathan DM et al. N Engl J Med. 2005;353:2643. Gerstein HC et al. N Engl J Med. 2008;358:2545.
Patel A et al. N Engl J Med 2008;358:2560. Duckworth W et al. N Engl J Med 2009;360:129. (erratum:
Moritz T. N Engl J Med 2009;361:1024)

34

The DPP -4 I in Cardiovascular
Disease
DPP4i compared with placebo or other treatment, were associated with a reduced risk of MACE (MH-OR 0.689[0.528; 0.899], p=0.006),irrespective of
trial duration, type of DDP4i, or comparator.
0,0
1
0,1
0
1,0
0
10
,00
10
0,0
0
Figure 4
Drugs MH-OR (95%, CI) p # Trials MH-OR (95%, CI) p # Trials
Alogliptin 1.240 [0.059;26.016] 0.890 1 0.630 [0.012;33.048] 0.819 2
Saxagliptin 1.440 [0.498; 4.203] 0.505 6 0.655 [0.382; 1.123] 0.124 8
Sitagliptin 1.047 [0.705; 1.555] 0.820 18 0.740 [0.479; 1.147] 0.173 18
Vildaglptin 0.818 [0.434; 1.543] 0.536 9 0.666 [0.428; 1.036] 0.072 12
Trial duration
< 52 weeks 1.252 [0.778; 2.016] 0.355 24 0.626 [0.444; 0.884] 0.008 30
≥ 52 weeks 0.855 [0.557; 1.312] 0.473 10 0.831 [0.523; 1.321] 0.157 10
Comparator
Acarbose 1.505 [0.061; 37.098] 0.803 1 1.000 [0.090; 11.090] 1.000 1
Liraglutide 1.486[0.217; 10.184] 0.687 2 2.376 [0.291; 19.390] 0.419 2
Metformin 0.526[0.147; 1.883] 0.323 3 0.697[0.291; 1.666] 0.417 5
Sulfonylureas 1.118 [0.624; 2.001] 0.708 4 0.718[0.410; 1.100] 0.098 5
Thiazolidinediones 0.832[0.141; 4.914] 0.839 3 0.411[0.070; 2.428] 0.327 3
Placebo 1.009[0.657; 1.550] 0.968 22 0.705[0.500; 0.993] 0.045 26
OVERALL 1.020[0.742; 1.402] 0.904 35 0.689 [0.528; 0.899] 0.006 43
Figure 2
Malignancies Major Cardiovascular Events
0.001 0.1
Mantel Haenzel Odd Ratio, 95% Confidential Intervals
1.0 10 100
0,0
1
0,1
0
1,0
0
10
,00
10
0,0
0
0.001 0.1 1.0 10 100
Figure 4
0,0
1
0,1
0
1,0
0
10
,00
10
0,0
0
Figure 4
Drugs MH-OR (95%, CI) p # Trials MH-OR (95%, CI) p # Trials
Alogliptin 1.240 [0.059;26.016] 0.890 1 0.630 [0.012;33.048] 0.819 2
Saxagliptin 1.440 [0.498; 4.203] 0.505 6 0.655 [0.382; 1.123] 0.124 8
Sitagliptin 1.047 [0.705; 1.555] 0.820 18 0.740 [0.479; 1.147] 0.173 18
Vildaglptin 0.818 [0.434; 1.543] 0.536 9 0.666 [0.428; 1.036] 0.072 12
Trial duration
< 52 weeks 1.252 [0.778; 2.016] 0.355 24 0.626 [0.444; 0.884] 0.008 30
≥ 52 weeks 0.855 [0.557; 1.312] 0.473 10 0.831 [0.523; 1.321] 0.157 10
Comparator
Acarbose 1.505 [0.061; 37.098] 0.803 1 1.000 [0.090; 11.090] 1.000 1
Liraglutide 1.486[0.217; 10.184] 0.687 2 2.376 [0.291; 19.390] 0.419 2
Metformin 0.526[0.147; 1.883] 0.323 3 0.697[0.291; 1.666] 0.417 5
Sulfonylureas 1.118 [0.624; 2.001] 0.708 4 0.718[0.410; 1.100] 0.098 5
Thiazolidinediones 0.832[0.141; 4.914] 0.839 3 0.411[0.070; 2.428] 0.327 3
Placebo 1.009[0.657; 1.550] 0.968 22 0.705[0.500; 0.993] 0.045 26
OVERALL 1.020[0.742; 1.402] 0.904 35 0.689 [0.528; 0.899] 0.006 43
Figure 2
Malignancies Major Cardiovascular Events
0.001 0.1
Mantel Haenzel Odd Ratio, 95% Confidential Intervals
1.0 10 1000
,01
0,1
0
1,0
0
10
,00
10
0,0
0
0.001 0.1 1.0 10 100
Figure 4

Sitagliptin
N=3415
n (%)
Nonexposed
N=2724
n (%)
Between-Groups
Difference,
% (95% CI)a
Serious clinical adverse experiences ≥0.2% in any group
Coronary artery disease 5 (0.1) 7 (0.3) –0.1 (–0.4, 0.1)
Myocardial infarction 4 (0.1) 5 (0.2) –0.1 (–0.3, 0.1)
Noncardiac chest pain 4 (0.1) 9 (0.3) –0.2 (–0.5, 0.0)
Cholelithiasis 6 (0.2) 2 (0.1) 0.1 (–0.1, 0.3)
Pneumonia 4 (0.1) 5 (0.2) –0.1 (–0.3, 0.1)
aPositive differences indicate that the proportion for the sitagliptin group is higher than the
proportion for the nonexposed group.
“0.0” represents rounding for values that are slightly greater than zero.
Williams-Herman D et al. BMC Endocr Disord. 2008;8:14. Copyright BioMed Central.
Incidences of Serious Adverse Events Were Generally Similar Between Treatment Groups With or Without
Sitagliptin
Sitagliptin pooled safety and tolerability analysis

TECOS is a double-blind randomized, placebo controlled, multi-national trial in patients with Type 2 Diabetes coordinated by the Duke Clinical Research Institute (DCRI) and the University of Oxford Diabetes Trial Unit (DTU).
It is being conducted in around 40 countries, across Australasia, Asia, Europe, North America, South America, India and South Africa, and commenced in 2008.
TECOS aims to compare the impact of adding sitagliptin as part of usual care versus usual care without sitagliptin on cardiovascular outcomes. 14,000 patients will be followed for a minimum of 3 years with the results expected in 2015.

Key Points …. Diabetes is rapidly growing worldwide especially in Egypt
Glycemic targets and glucose-lowering therapies must be individualized.
DPP4I Sitagliptin have a major role in glycemic control without hypoglycemia and with no increase in body weight.
Combination therapy with a DPP-4 inhibitor and metformin offers opportunity for improved glycemic efficacy, complementary mechanisms of action, and a low risk of hypoglycemia without weight gain
Sitagliptin is approved to be add on insulin
Based on studies they can preserve or enhance B cell function
Ability to use in cardiovascular disease markedly increases therapeutic options for our patients

THANK YOU