Embed Size (px)
Citation preview
Legal and Regulatory
Consequences of New
PM 2.5 Exposure
Research
Greg Nichols, MPH, CPHTennessee Environmental Conference
March 13, 2013
Kingsport, TN
Outline
• Introduction
• Sources
• Regulations
• Emerging Issues
• Litigation Implications
• Exposure Mitigation
• Summary
2

INTRODUCTION
3
Particulate Matter
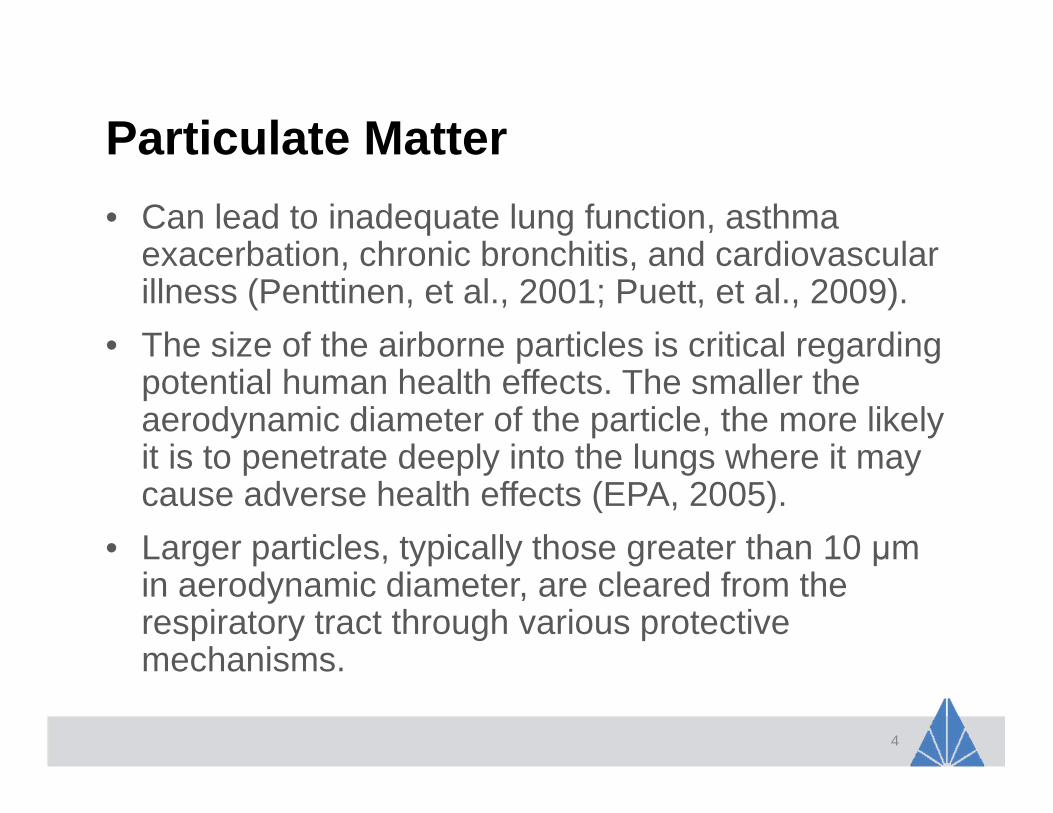
• Can lead to inadequate lung function, asthma exacerbation, chronic bronchitis, and cardiovascular illness (Penttinen, et al., 2001; Puett, et al., 2009).
• The size of the airborne particles is critical regarding potential human health effects. The smaller the aerodynamic diameter of the particle, the more likely it is to penetrate deeply into the lungs where it may cause adverse health effects (EPA, 2005).
• Larger particles, typically those greater than 10 µmin aerodynamic diameter, are cleared from the respiratory tract through various protective mechanisms.
4
Description of PM 2.5
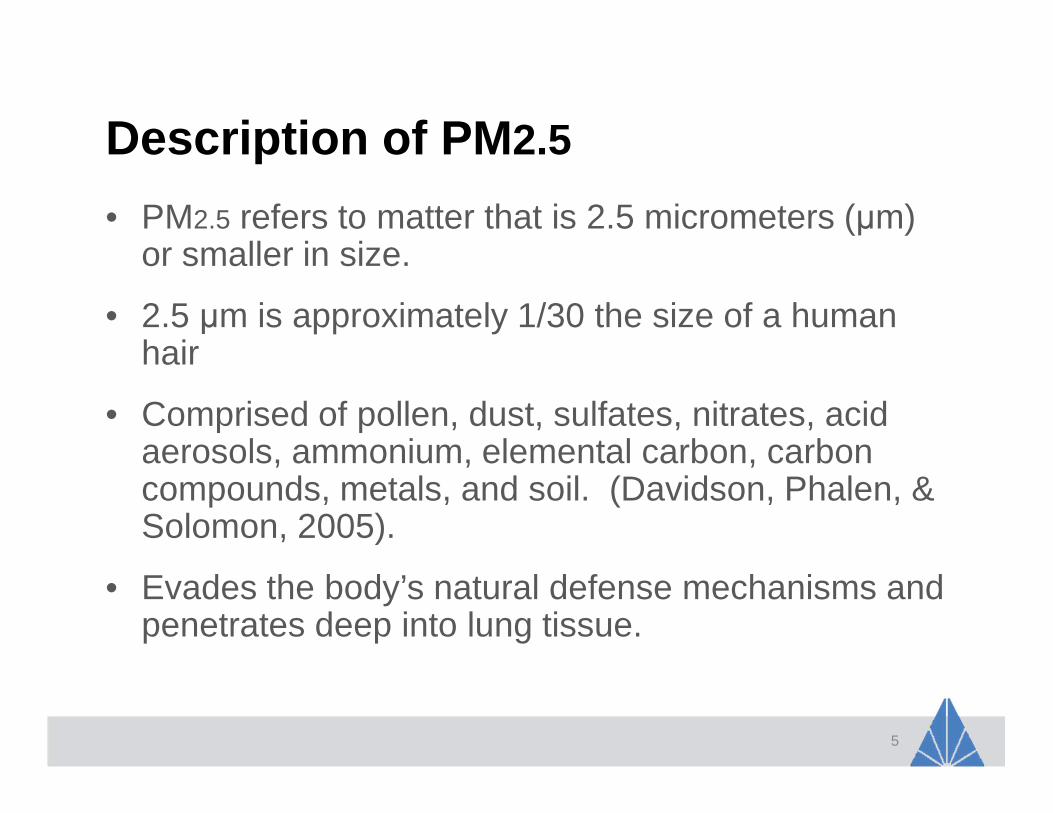
• PM2.5 refers to matter that is 2.5 micrometers (µm) or smaller in size.
• 2.5 µm is approximately 1/30 the size of a human hair
• Comprised of pollen, dust, sulfates, nitrates, acid aerosols, ammonium, elemental carbon, carbon compounds, metals, and soil. (Davidson, Phalen, & Solomon, 2005).
• Evades the body’s natural defense mechanisms and penetrates deep into lung tissue.
5
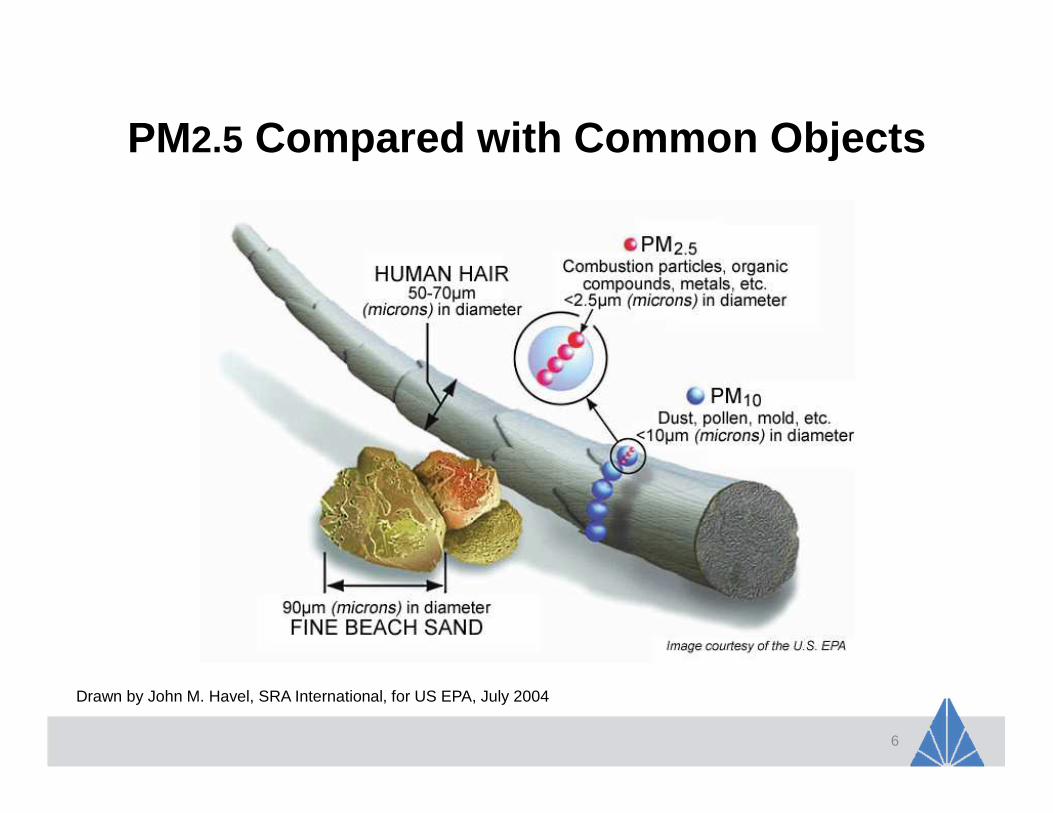
PM2.5 Compared with Common Objects
6
Drawn by John M. Havel, SRA International, for US EPA, July 2004
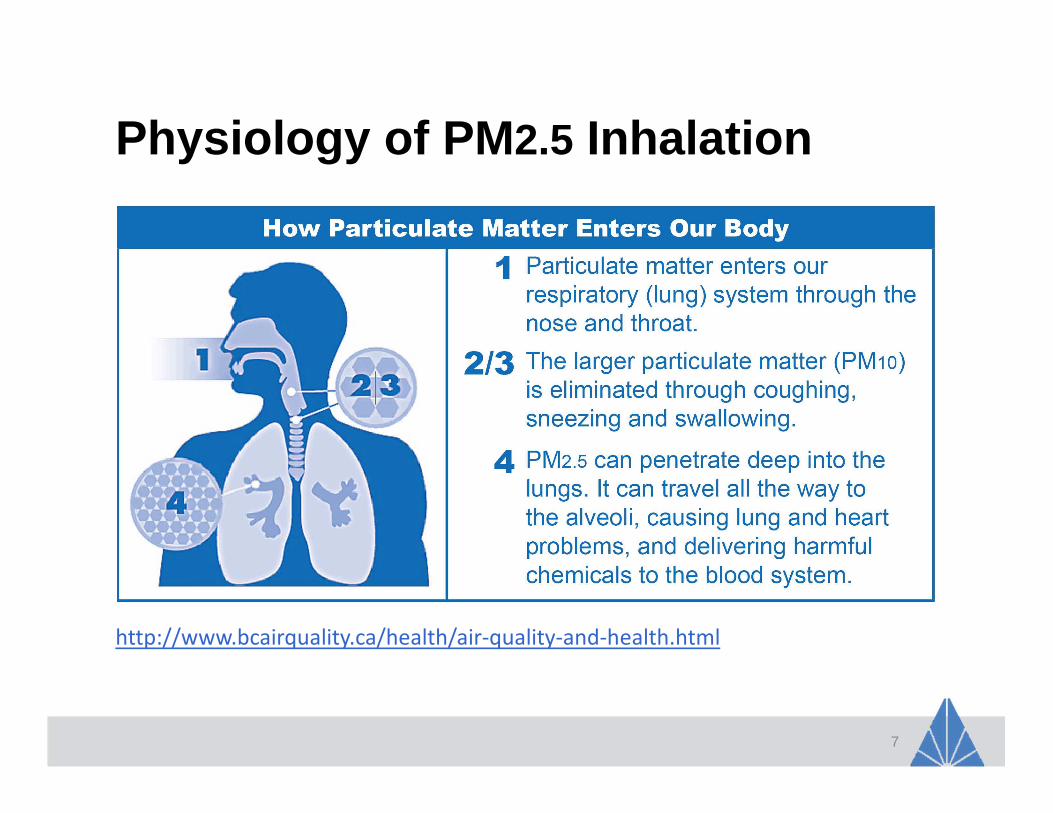
Physiology of PM 2.5 Inhalation
7
http://www.bcairquality.ca/health/air-quality-and-health.html
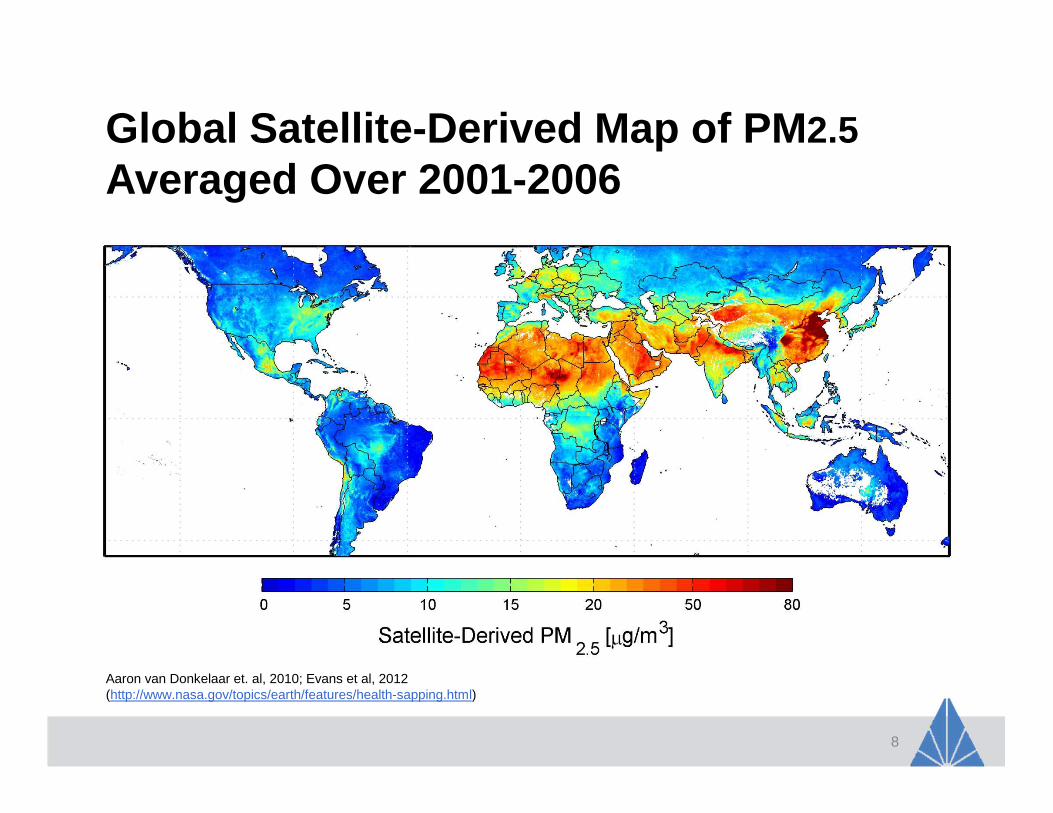
Global Satellite-Derived Map of PM 2.5Averaged Over 2001-2006
8
Aaron van Donkelaar et. al, 2010; Evans et al, 2012 (http://www.nasa.gov/topics/earth/features/health-sapping.html)
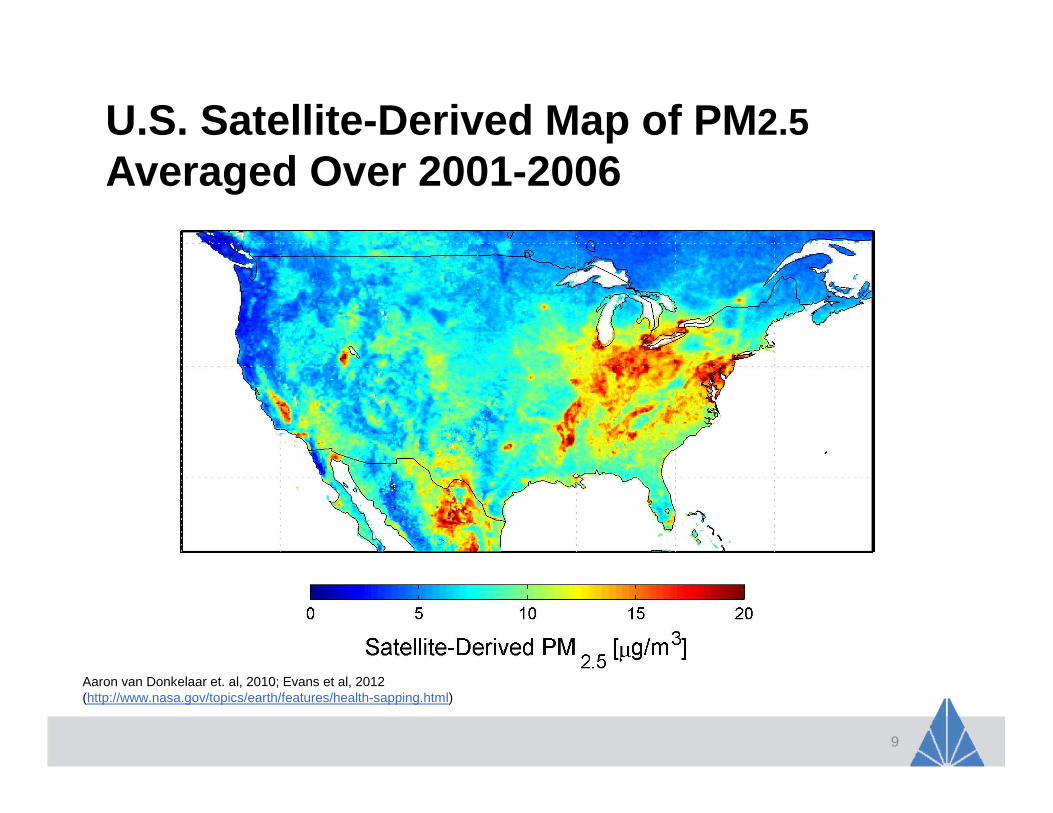
U.S. Satellite-Derived Map of PM 2.5Averaged Over 2001-2006
9
Aaron van Donkelaar et. al, 2010; Evans et al, 2012 (http://www.nasa.gov/topics/earth/features/health-sapping.html)

SOURCES
10
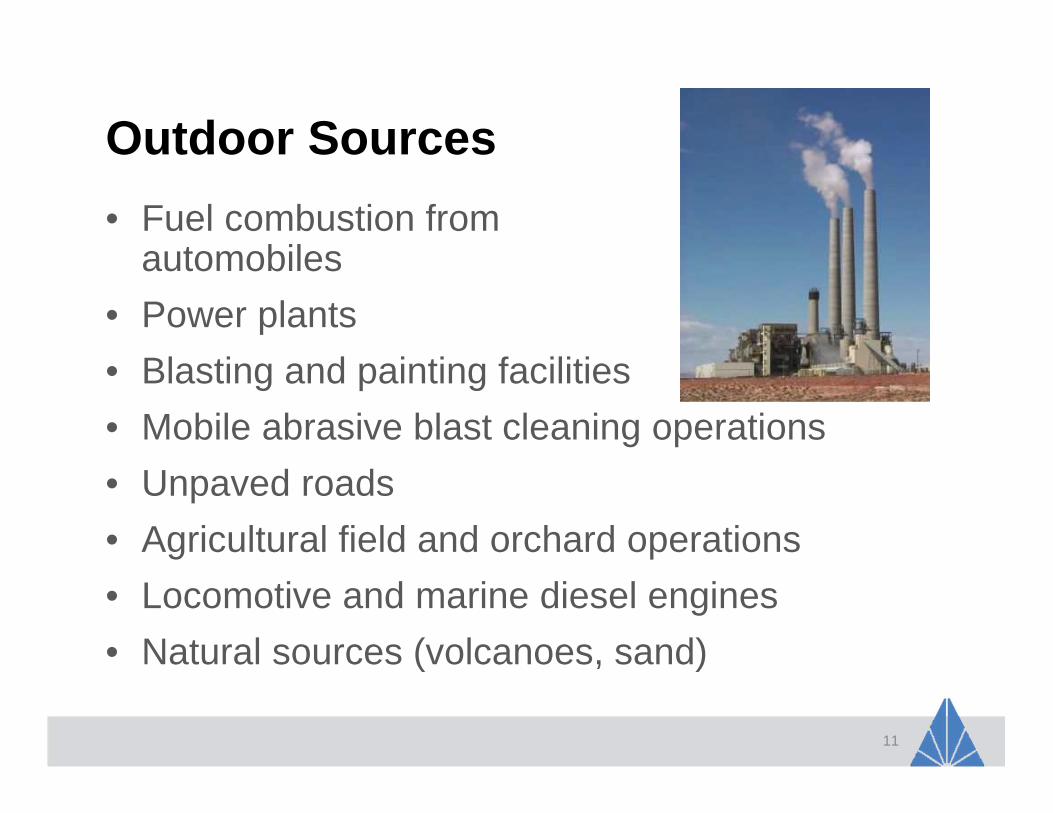
Outdoor Sources
• Fuel combustion from automobiles
• Power plants
• Blasting and painting facilities
• Mobile abrasive blast cleaning operations
• Unpaved roads
• Agricultural field and orchard operations
• Locomotive and marine diesel engines
• Natural sources (volcanoes, sand)
11
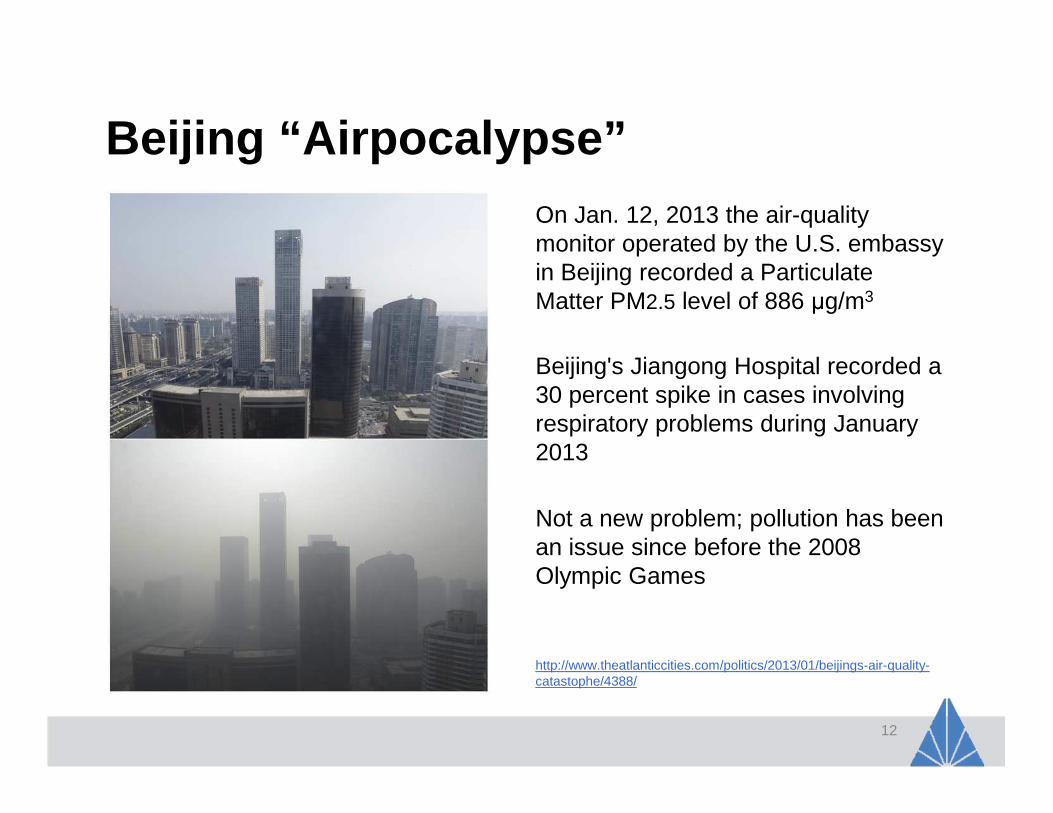
Beijing “Airpocalypse”
12
On Jan. 12, 2013 the air-quality monitor operated by the U.S. embassy in Beijing recorded a Particulate Matter PM2.5 level of 886 µg/m3
Beijing's Jiangong Hospital recorded a 30 percent spike in cases involving respiratory problems during January 2013
http://www.theatlanticcities.com/politics/2013/01/beijings-air-quality-catastophe/4388/
Not a new problem; pollution has been an issue since before the 2008 Olympic Games
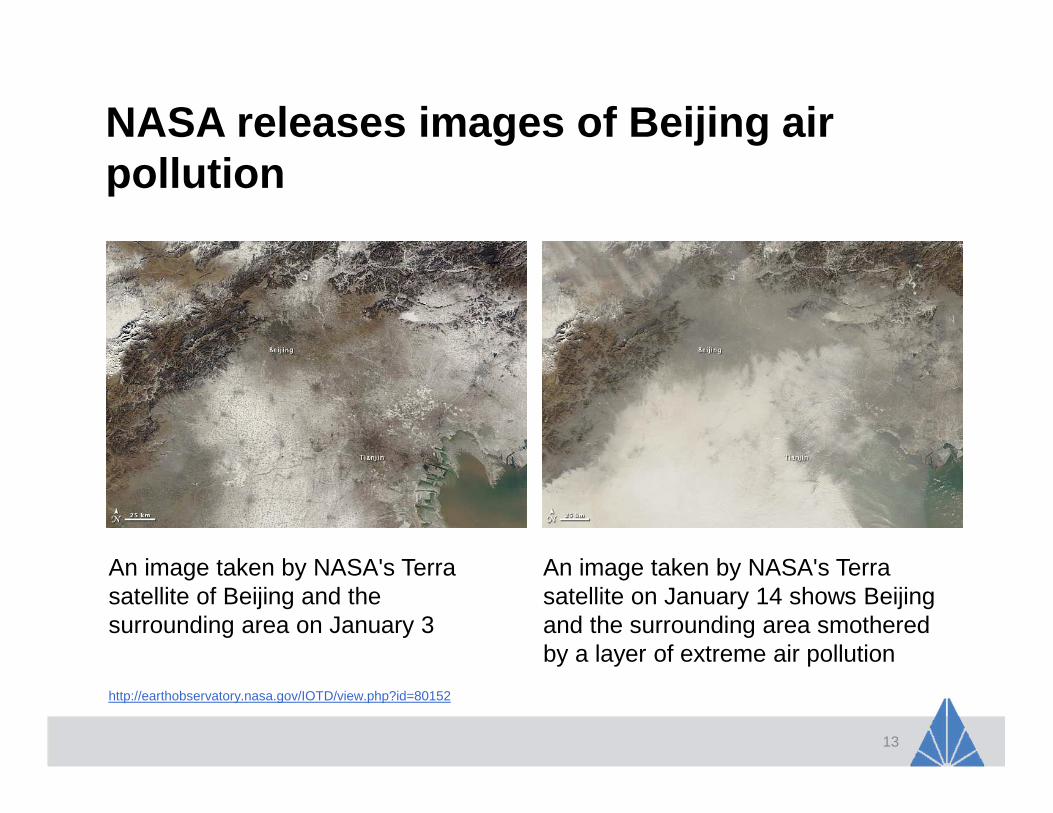
NASA releases images of Beijing air pollution
13
An image taken by NASA's Terra satellite on January 14 shows Beijing and the surrounding area smothered by a layer of extreme air pollution
An image taken by NASA's Terra satellite of Beijing and the surrounding area on January 3
http://earthobservatory.nasa.gov/IOTD/view.php?id=80152
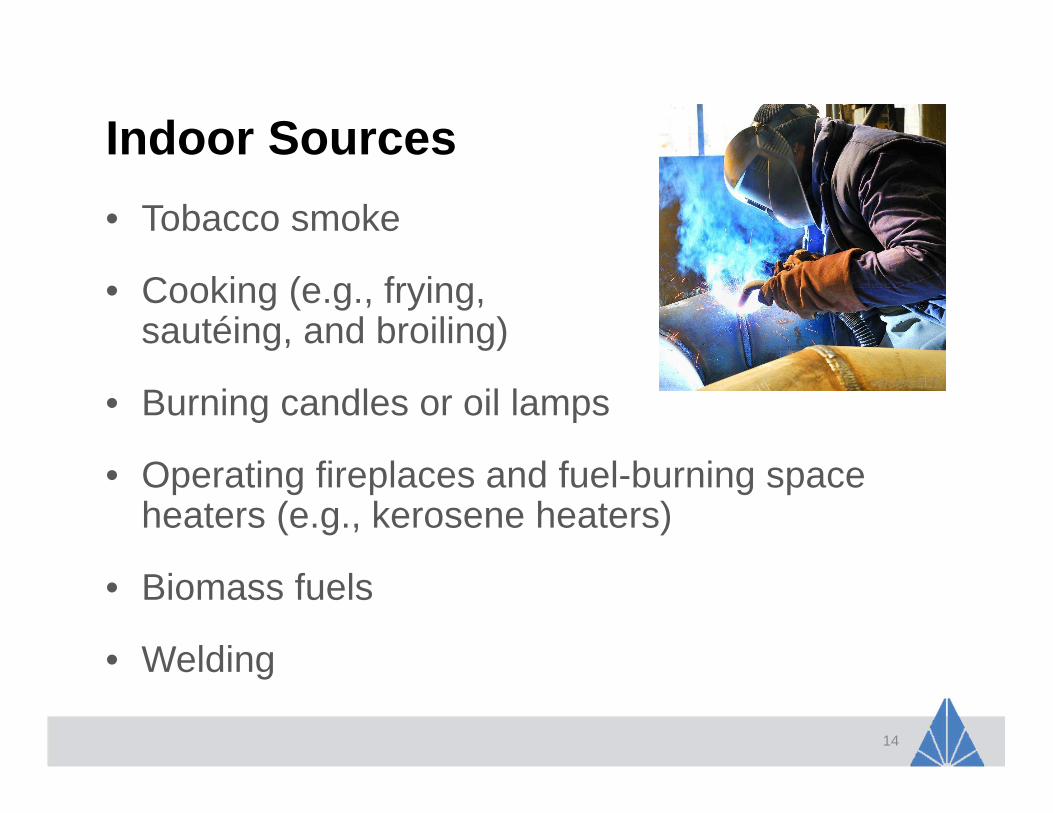
Indoor Sources
• Tobacco smoke
• Cooking (e.g., frying, sautéing, and broiling)
• Burning candles or oil lamps
• Operating fireplaces and fuel-burning space heaters (e.g., kerosene heaters)
• Biomass fuels
• Welding
14

REGULATIONS
15
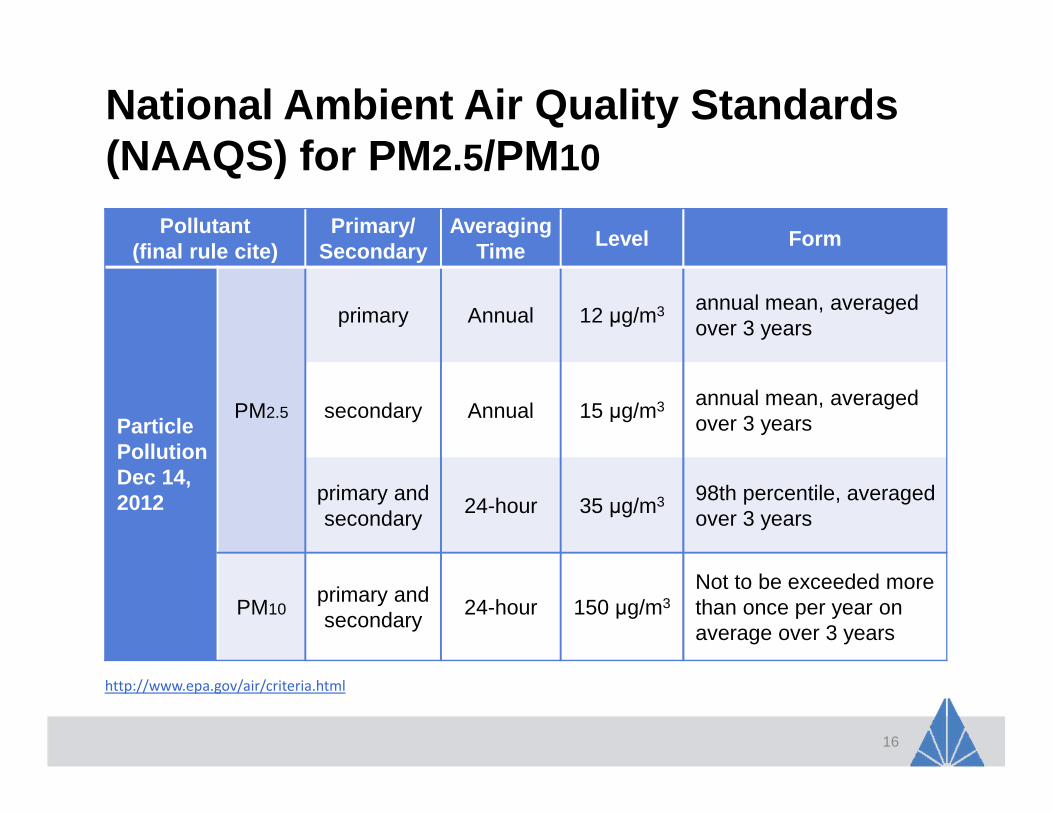
National Ambient Air Quality Standards (NAAQS) for PM 2.5/PM10
16
http://www.epa.gov/air/criteria.html
Pollutant(final rule cite)
Primary/ Secondary
Averaging Time
Level Form
Particle PollutionDec 14, 2012
PM2.5
primary Annual 12 µg/m3 annual mean, averaged over 3 years
secondary Annual 15 µg/m3 annual mean, averaged over 3 years
primary and secondary
24-hour 35 µg/m3 98th percentile, averaged over 3 years
PM10primary andsecondary
24-hour 150 µg/m3Not to be exceeded more than once per year on average over 3 years
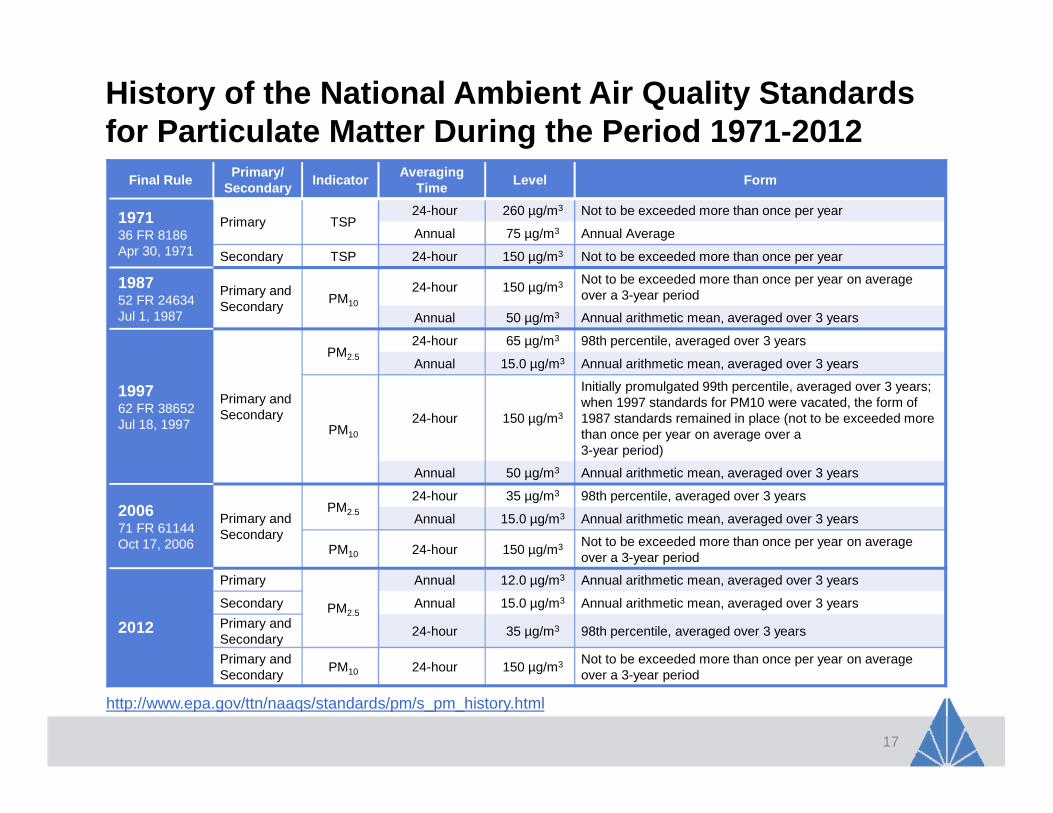
History of the National Ambient Air Quality Standar ds for Particulate Matter During the Period 1971-2012
17
Final RulePrimary/
SecondaryIndicator
Averaging Time
Level Form
1971 36 FR 8186 Apr 30, 1971
Primary TSP 24-hour 260 µg/m3 Not to be exceeded more than once per year
Annual 75 µg/m3 Annual Average
Secondary TSP 24-hour 150 µg/m3 Not to be exceeded more than once per year
1987 52 FR 24634 Jul 1, 1987
Primary and Secondary
PM10
24-hour 150 µg/m3 Not to be exceeded more than once per year on average over a 3-year period
Annual 50 µg/m3 Annual arithmetic mean, averaged over 3 years
199762 FR 38652 Jul 18, 1997
Primary and Secondary
PM2.5
24-hour 65 µg/m3 98th percentile, averaged over 3 years
Annual 15.0 µg/m3 Annual arithmetic mean, averaged over 3 years
PM10
24-hour 150 µg/m3
Initially promulgated 99th percentile, averaged over 3 years; when 1997 standards for PM10 were vacated, the form of 1987 standards remained in place (not to be exceeded more than once per year on average over a 3-year period)
Annual 50 µg/m3 Annual arithmetic mean, averaged over 3 years
2006 71 FR 61144 Oct 17, 2006
Primary and Secondary
PM2.5
24-hour 35 µg/m3 98th percentile, averaged over 3 years
Annual 15.0 µg/m3 Annual arithmetic mean, averaged over 3 years
PM10 24-hour 150 µg/m3 Not to be exceeded more than once per year on average over a 3-year period
2012
Primary
PM2.5
Annual 12.0 µg/m3 Annual arithmetic mean, averaged over 3 years
Secondary Annual 15.0 µg/m3 Annual arithmetic mean, averaged over 3 years
Primary and Secondary
24-hour 35 µg/m3 98th percentile, averaged over 3 years
Primary and Secondary
PM10 24-hour 150 µg/m3 Not to be exceeded more than once per year on average over a 3-year period
http://www.epa.gov/ttn/naaqs/standards/pm/s_pm_history.html
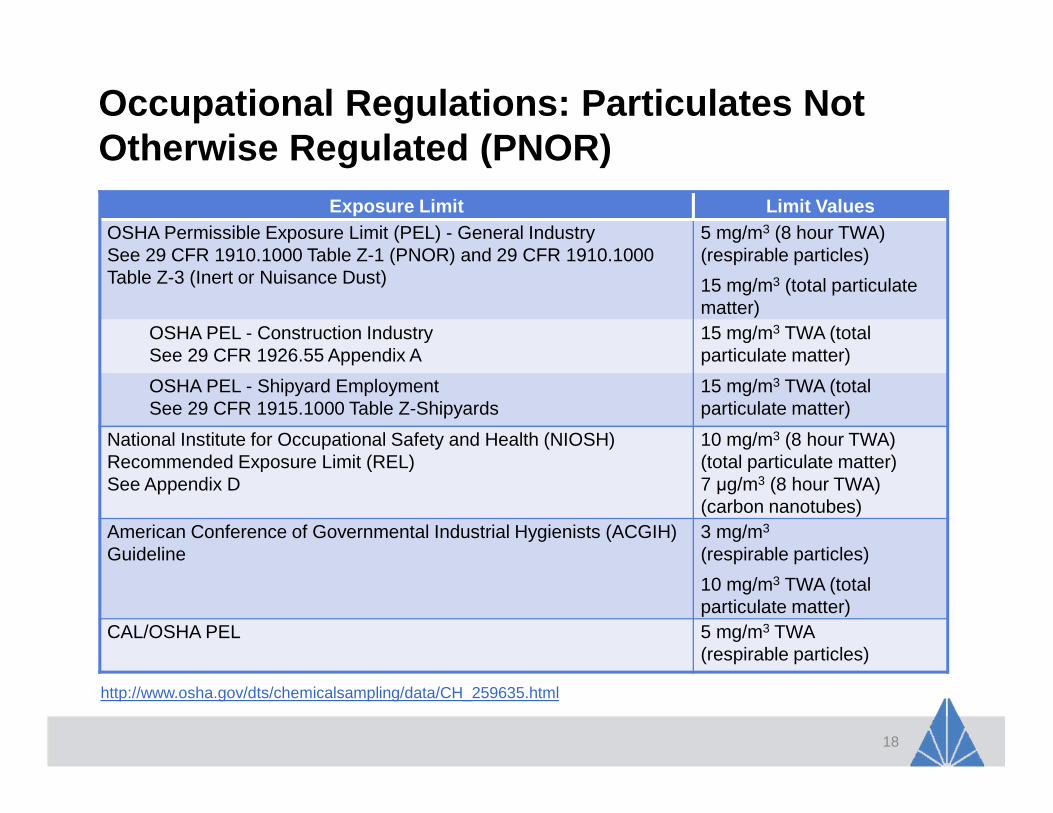
Occupational Regulations: Particulates Not Otherwise Regulated (PNOR)
18
Exposure Limit Limit Values OSHA Permissible Exposure Limit (PEL) - General Industry See 29 CFR 1910.1000 Table Z-1 (PNOR) and 29 CFR 1910.1000 Table Z-3 (Inert or Nuisance Dust)
5 mg/m3 (8 hour TWA)(respirable particles)
15 mg/m3 (total particulate matter)
OSHA PEL - Construction Industry See 29 CFR 1926.55 Appendix A
15 mg/m3 TWA (totalparticulate matter)
OSHA PEL - Shipyard Employment See 29 CFR 1915.1000 Table Z-Shipyards
15 mg/m3 TWA (totalparticulate matter)
National Institute for Occupational Safety and Health (NIOSH) Recommended Exposure Limit (REL)See Appendix D
10 mg/m3 (8 hour TWA) (total particulate matter)7 µg/m3 (8 hour TWA)(carbon nanotubes)
American Conference of Governmental Industrial Hygienists (ACGIH) Guideline
3 mg/m3
(respirable particles)
10 mg/m3 TWA (total particulate matter)
CAL/OSHA PEL 5 mg/m3 TWA(respirable particles)
http://www.osha.gov/dts/chemicalsampling/data/CH_259635.html
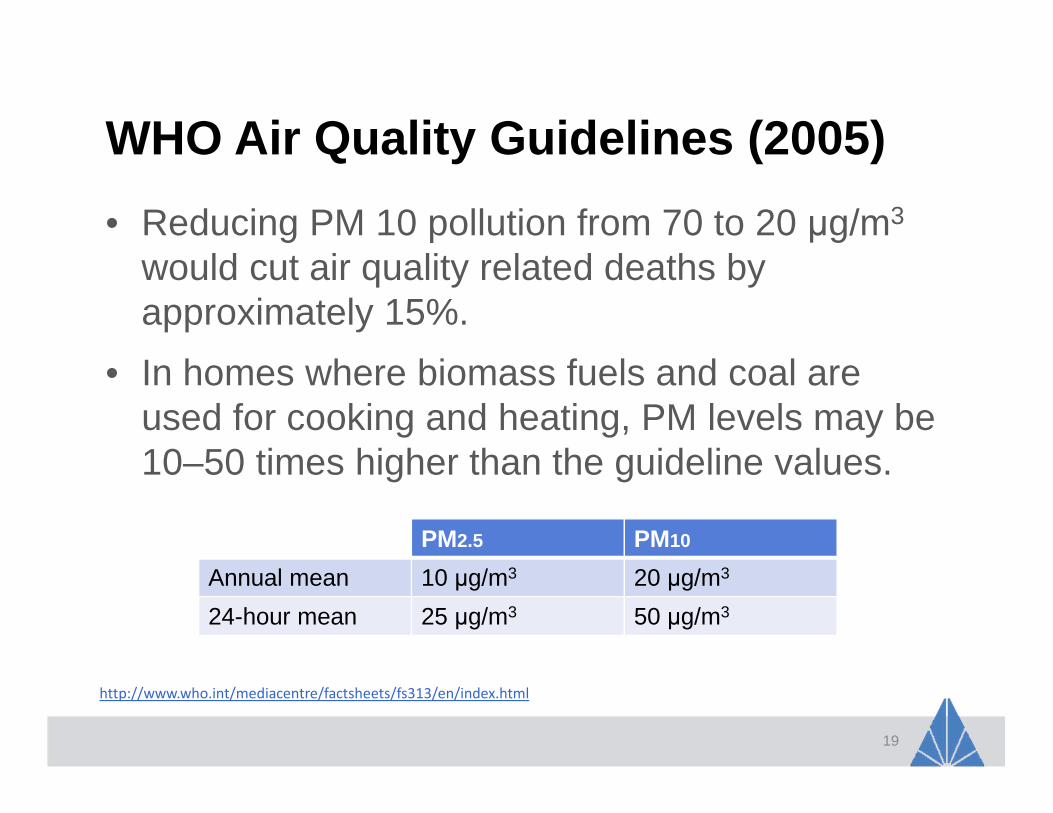
WHO Air Quality Guidelines (2005)
• Reducing PM 10 pollution from 70 to 20 µg/m3
would cut air quality related deaths by approximately 15%.
• In homes where biomass fuels and coal are used for cooking and heating, PM levels may be 10–50 times higher than the guideline values.
19
http://www.who.int/mediacentre/factsheets/fs313/en/index.html
PM2.5 PM10
Annual mean 10 µg/m3 20 µg/m3
24-hour mean 25 µg/m3 50 µg/m3
EMERGING ISSUES – AREAS
OF CONSIDERATION
20
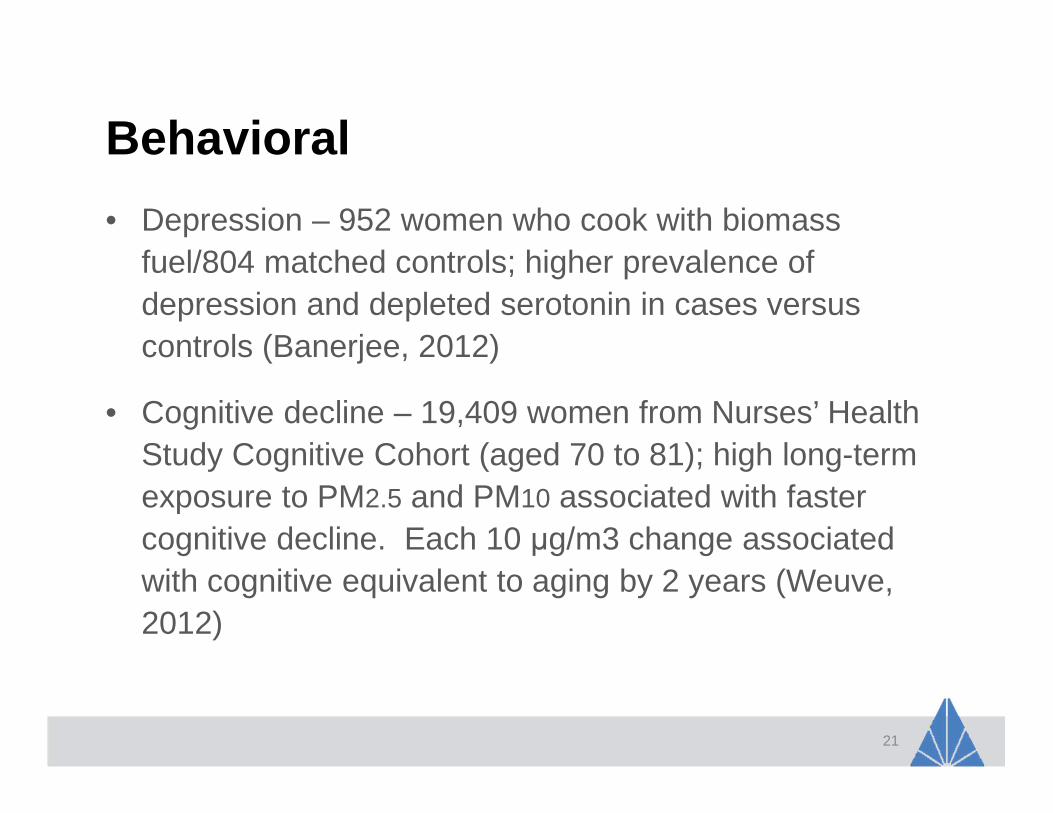
Behavioral
• Depression – 952 women who cook with biomass fuel/804 matched controls; higher prevalence of depression and depleted serotonin in cases versus controls (Banerjee, 2012)
• Cognitive decline – 19,409 women from Nurses’ Health Study Cognitive Cohort (aged 70 to 81); high long-term exposure to PM2.5 and PM10 associated with faster cognitive decline. Each 10 µg/m3 change associated with cognitive equivalent to aging by 2 years (Weuve, 2012)
21
Hospital Admission/ER Visits• Hospital admissions for respiratory disease across hospitals in New
England increased by 0.7% for short-term and 4.22% for long-term exposure for every 10 µg/m3 increase of PM2.5 (Kloog, 2012)
• Cardiovascular admissions in Adelaide, Australia, between 2001-2007 increased by 8.36% for every 10 µg/m3 increase of PM2.5
(Hansen, 2012)
• Ambient PM2.5 associated with increased ER visits for hypertension in Edmonton, Canada from 1992-2002 (Szyszkowicz, 2012)
• Myocardial Ischaemia National Audit Project (MINAP); studied 154,204 patients admitted for ACS; increased mortality in survivors associated with increase in PM2.5 exposure (Tonne, 2013)
22
Cardiovascular Disease
• PM2.5 associated with general cardiovascular effects (Wu, 2012)
• Increased stroke risk – even in levels of PM2.5below EPA standards (OR 1.1) (Wellenius, 2012); slight increased risk of daily stroke attack in time-series study (Li, 2012); possible association (Johnson, 2011)
• Increased blood pressure – (Wellenius, 2012; Sughis, 2012; Hoffman, 2012)
23
Cardiovascular Disease (cont.)
• Cardiovascular morbidity – 500,000 respondents in over 2,000 counties; positive association between PM 2.5 exposure and cardiovascular disease (Feng, 2012)
• Increased risk of cardiac arrest (Ensor, 2013)
• Heart rate variability – meta-analysis of over 18,000 subjects (Heart, 2012)
24
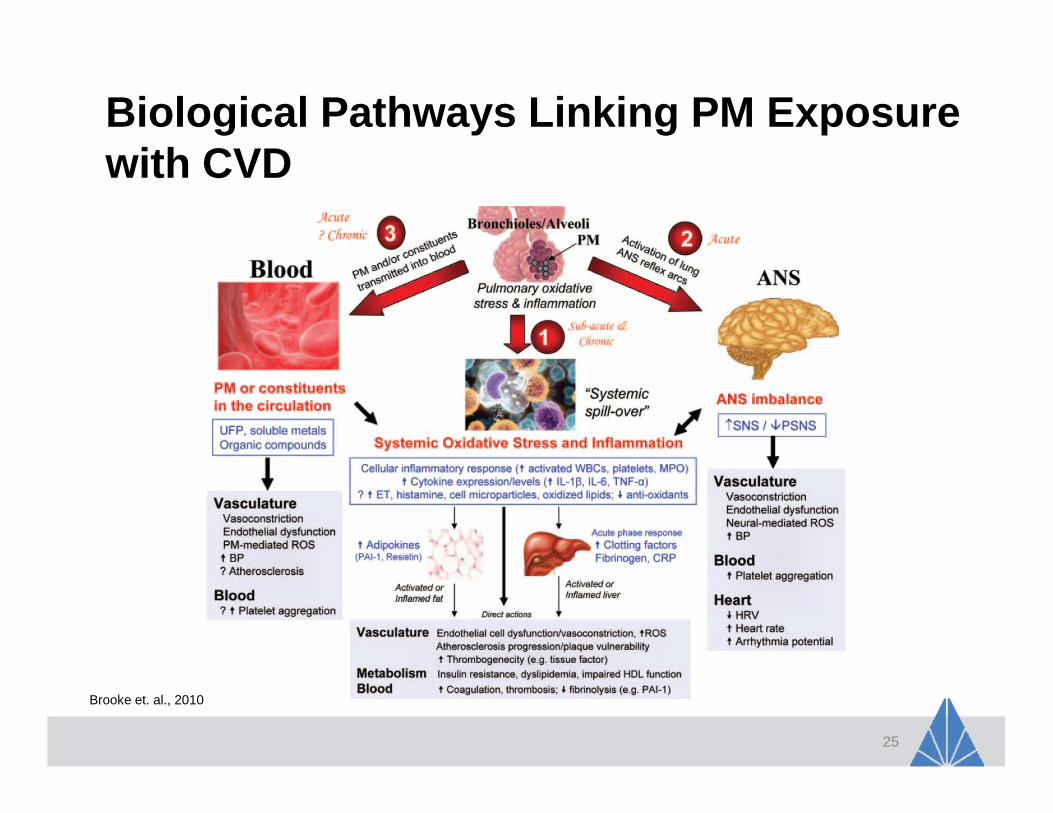
Biological Pathways Linking PM Exposure with CVD
25
Brooke et. al., 2010
Diabetes
• Genetic predisposition in diabetics/those with impaired glucose tolerance increases susceptibility to air pollutants (PM2.5) (Hampel, 2012)
• Increased RR for hypertension (1.48) and diabetes (1.63) with PM2.5 exposure (Coogan, 2012)
• Low-level PM2.5 exposure reduces metabolic insulin sensitivity (Brook, 2012)
26
Diabetes (cont.)
• Pearson et al, 2010
– Diabetes prevalence increases with increasing PM2.5concentrations, with a 1% increase in diabetes prevalence seen with a 10 µg/m3 increase in PM2.5exposure
– Even for counties within guidelines for EPA PM2.5exposure limits, those with highest compared to lowest levels of PM2.5 exposure showed >20% increase in diabetes prevalence, an association that persisted after controlling for diabetes risk factors.
27
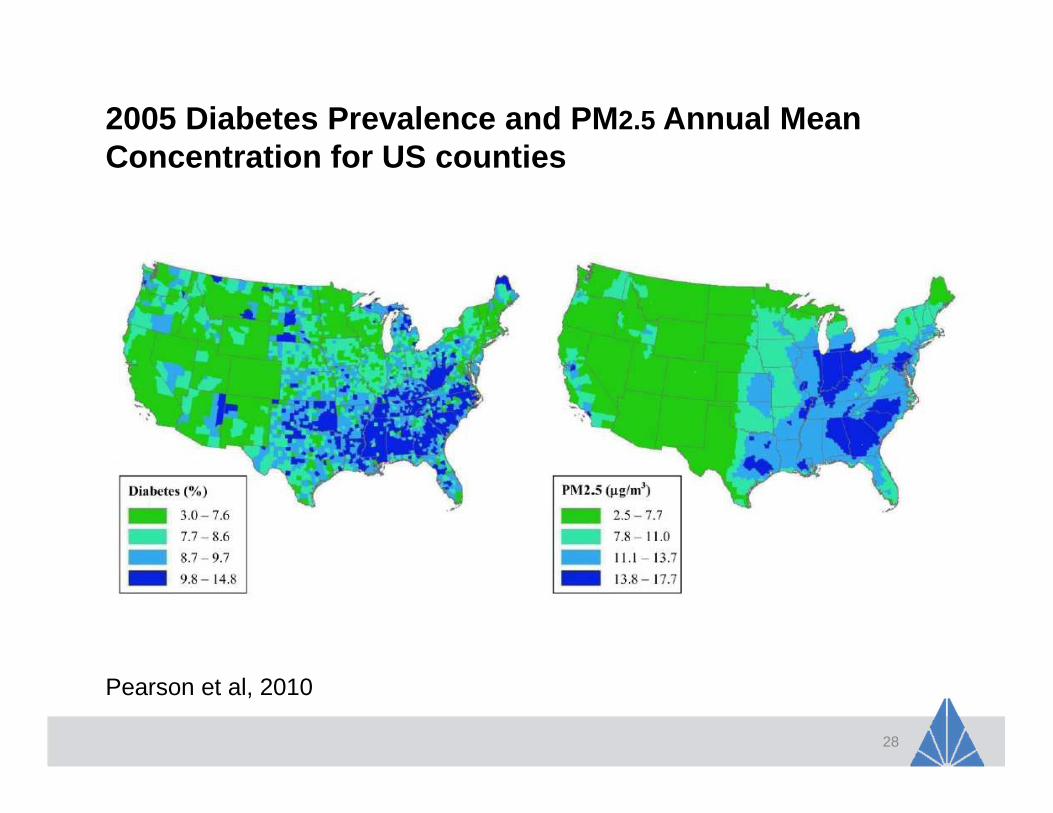
2005 Diabetes Prevalence and PM 2.5 Annual Mean Concentration for US counties
28
Pearson et al, 2010
Birth Outcomes
• 34,705 births in Allegheny County, PA from 1997-2002 were studied; PM2.5 associated with increased risk of developing preeclampsia, gestational hypertension, preterm birth, and small-for-gestational age (SGA) infants (Lee, 2012)
• Preterm birth – increased risk of preterm birth with PM2.5 exposure (Chang, 2012)
• Gestational hypertension – (Vinikoor-Imler, 2012)
29
Birth Outcomes (cont.)
• 222,359 births from Kids Inpatient Database linked with EPA Aerometric Information Retrieval System; 9.3% and 7.2% increase in odds of low birth weight and very low birth weight for each 1 µg/m3 increase in PM2.5
(Trasande, 2013)
• 400,000 live births in Chicago MSA from 2000-2004 studied; low birth weight associated with PM2.5 exposure
• Low birth weight – (Stieb, 2012)
30
Respiratory
• Lung cancer
– 188,699 never-smokers taken from 1.2 million Cancer Prevention Study; each 10 µg/m3 increase in PM2.5 associated with 15-27% increase in lung CA mortality (Turner, 2011)
– Case-control study in Taiyuan, China; 399 lung cancer cases and 466 controls; each 10 µg/m3 increase in indoor PM1 levels associated with 45% increased risk of lung CA (Mu, 2013)
• Higher PM concentrations associated with reduced lung function (FEV-1/PEFR)(Kesavachandran, 2013); new wheeze in children (Jung, 2012)
31
Inflammatory and Epigentic Effects
• 12 US Forest Service firefighters exposed to PM2.5 tested for biomarkers before and after shift; increased levels of IL-8, CRP, and ICAM-1 in 50% (Hejl, 2013)
• Inflammatory biomarkers tested in 110 traffic policemen in Shanghai; PM2.5 exposure associated with an increase in hs-CRP, IgG, IgM, and IgE (Zhao, 2013)
32
Inflammatory and Epigentic Effects (cont.)
• 940 participants in the Children’s Health Study; short-term PM2.5 exposure had a significant effect on DNA methylation (Salam, 2012)
• Various biomarkers measured in 704 veterans in the Veterans Administration Normative Aging Study; PM 2.5 exposure associated with an increase in ICAM-1 and VCAM-1; effects of traffic pollutants were stronger in subjects with certain underlying genetic factors or lower levels of certain immunity factors (Bind, 2012)
33
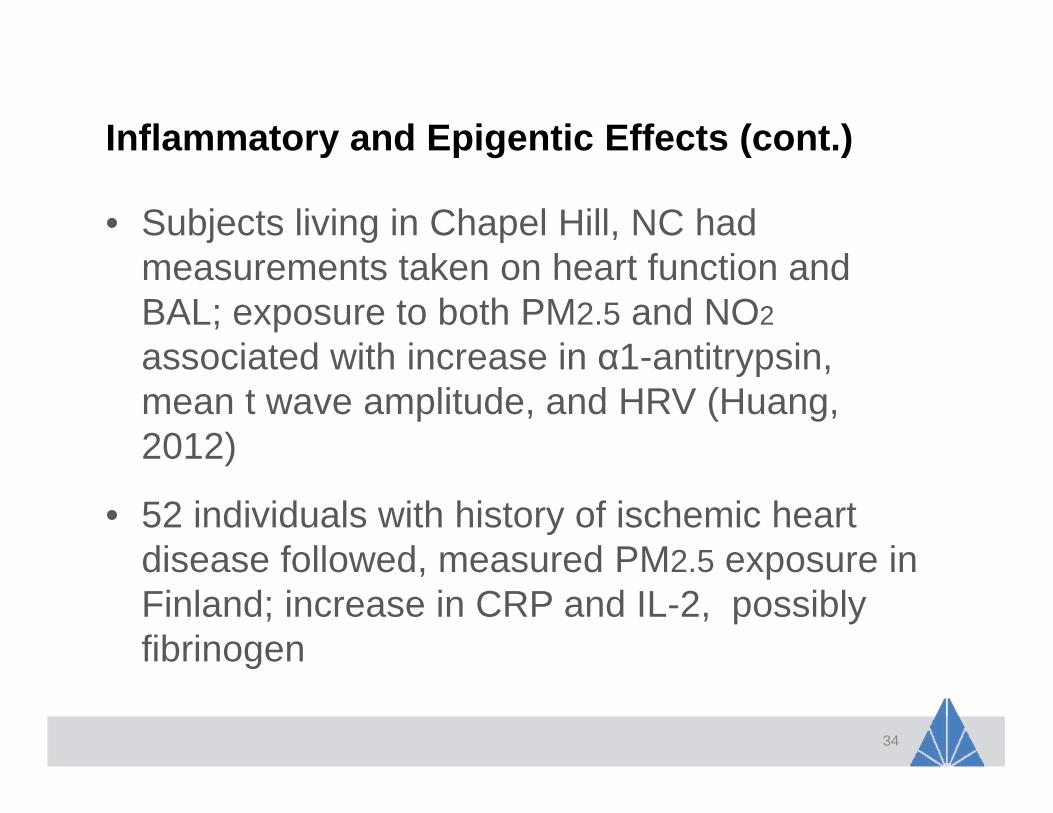
Inflammatory and Epigentic Effects (cont.)
• Subjects living in Chapel Hill, NC had measurements taken on heart function and BAL; exposure to both PM2.5 and NO2
associated with increase in α1-antitrypsin, mean t wave amplitude, and HRV (Huang, 2012)
• 52 individuals with history of ischemic heart disease followed, measured PM2.5 exposure in Finland; increase in CRP and IL-2, possibly fibrinogen
34
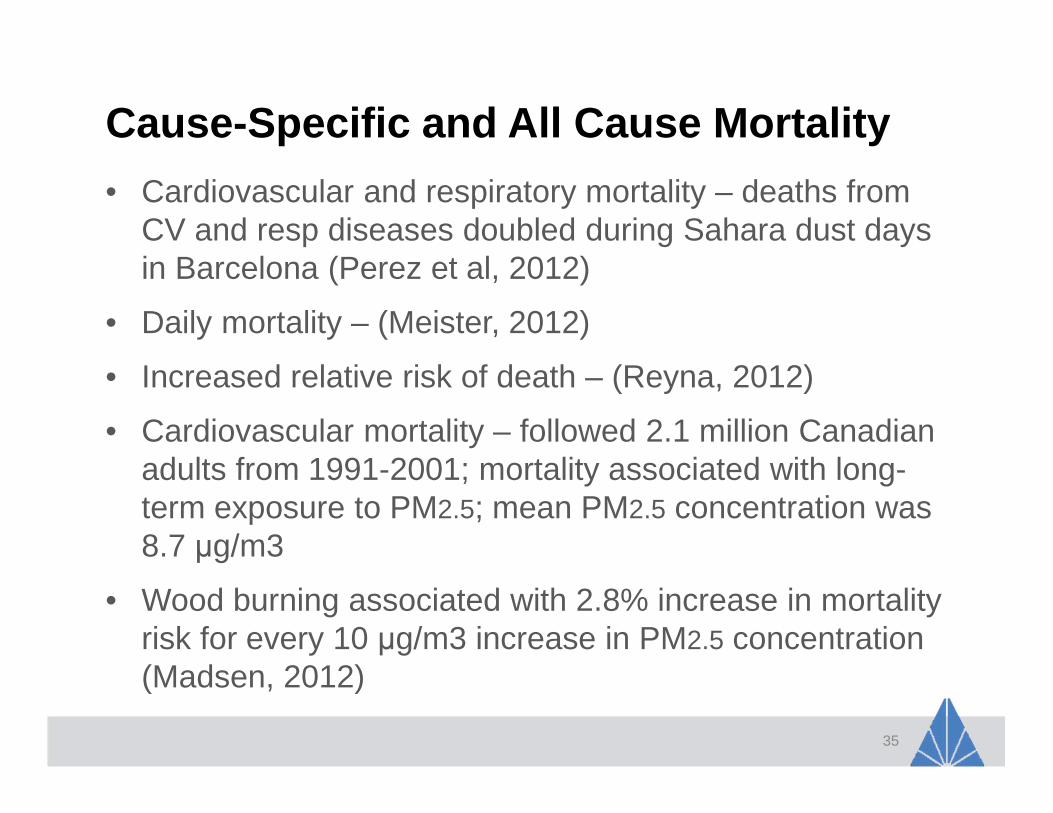
Cause-Specific and All Cause Mortality
• Cardiovascular and respiratory mortality – deaths from CV and resp diseases doubled during Sahara dust days in Barcelona (Perez et al, 2012)
• Daily mortality – (Meister, 2012)
• Increased relative risk of death – (Reyna, 2012)
• Cardiovascular mortality – followed 2.1 million Canadian adults from 1991-2001; mortality associated with long-term exposure to PM2.5; mean PM2.5 concentration was 8.7 µg/m3
• Wood burning associated with 2.8% increase in mortality risk for every 10 µg/m3 increase in PM2.5 concentration (Madsen, 2012)
35
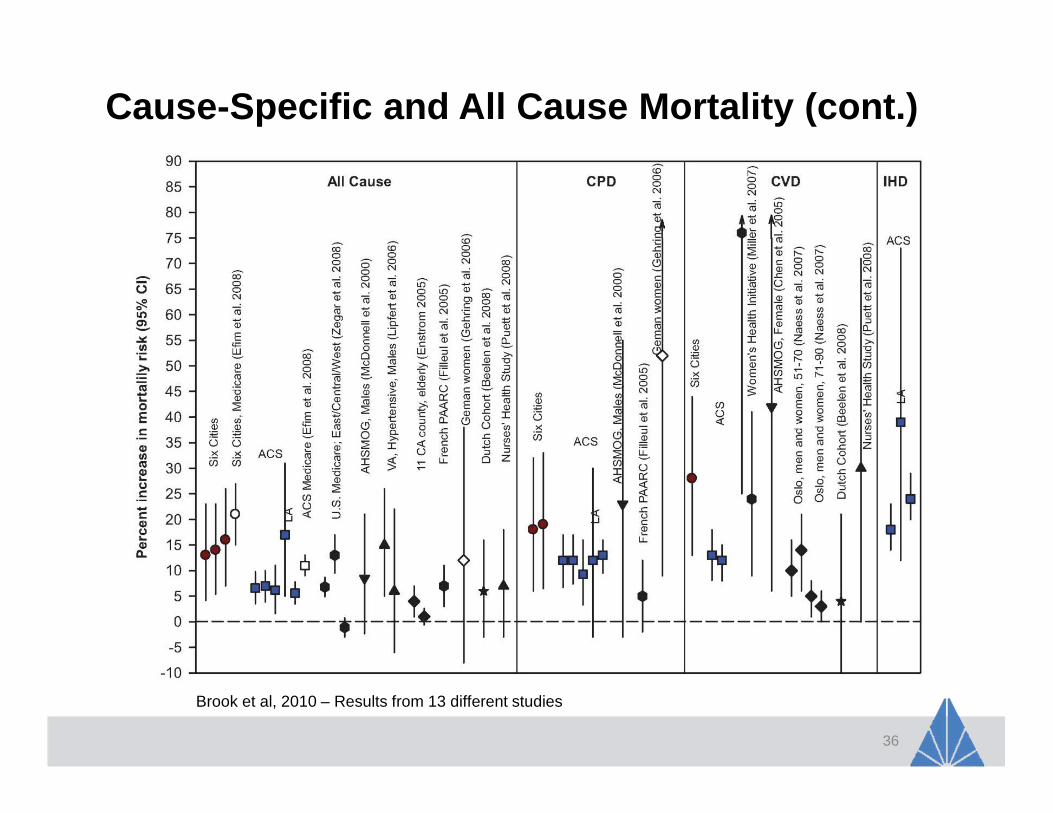
Cause-Specific and All Cause Mortality (cont.)
36
Brook et al, 2010 – Results from 13 different studies
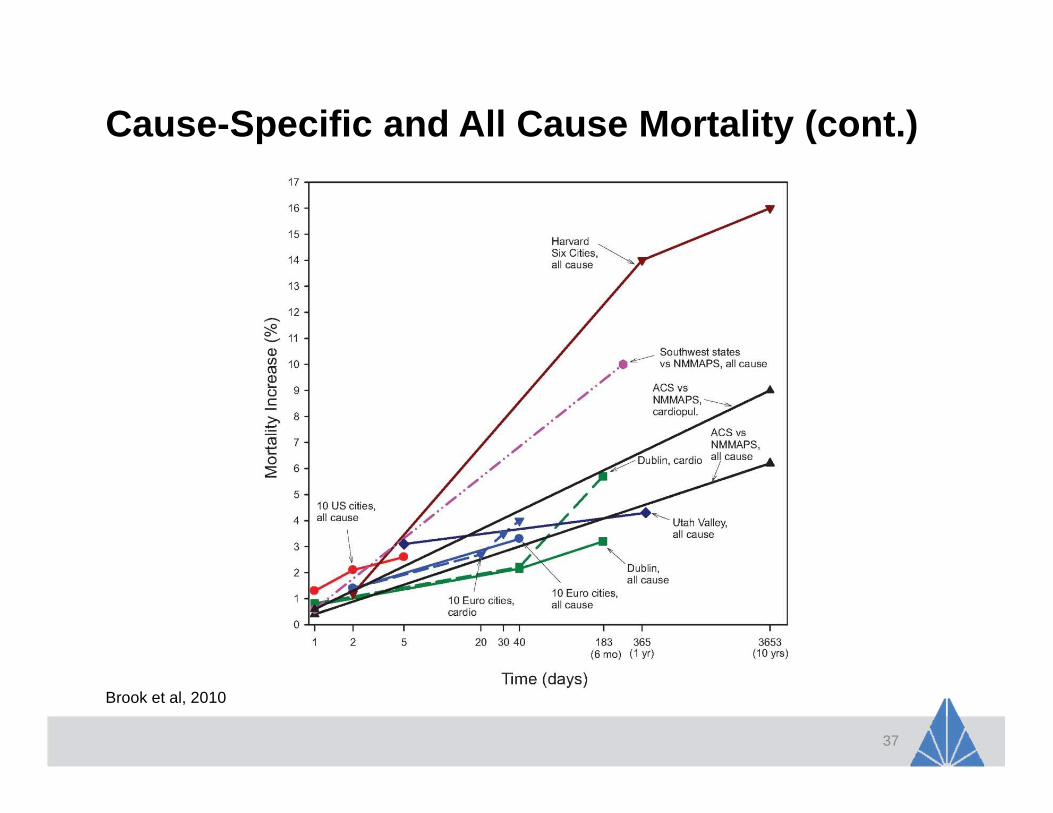
Cause-Specific and All Cause Mortality (cont.)
37
Brook et al, 2010
Cause-Specific and All Cause Mortality (cont.)
38
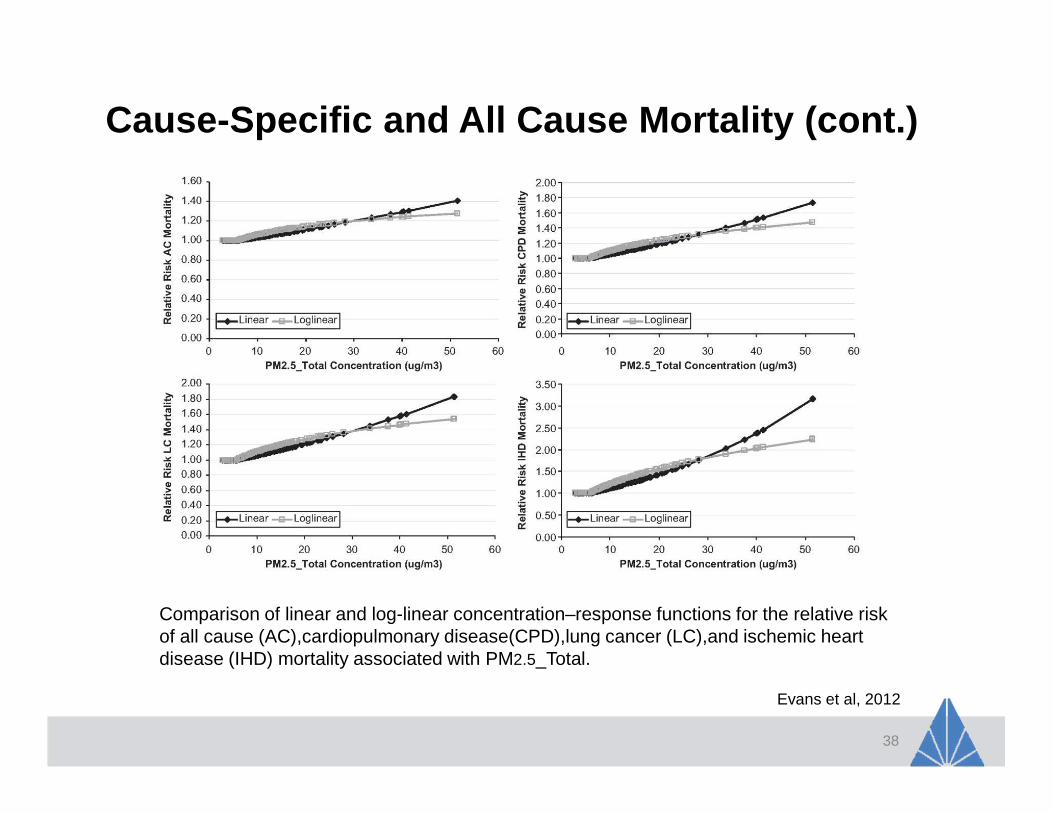
Evans et al, 2012
Comparison of linear and log-linear concentration–response functions for the relative risk of all cause (AC),cardiopulmonary disease(CPD),lung cancer (LC),and ischemic heart disease (IHD) mortality associated with PM2.5_Total.
Cholesterol
• Rice, 2011– Using a repeated measures panel study, lipid levels
before and after welding and personal exposures to fine particulate matter (PM2.5) were measured in 36 male welders over 63 exposure and/or control days.
– There was a trend toward decrease in HDL (-2.3 mg/dL, p = 0.08) 18 hours after welding. This effect became significant (-2.6 mg/dL, p = 0.05) after adjustment for possible confounders. The effect was strongest (-4.3 mg/dL, p = 0.02) among welders who did not weld the day before the study.
39
LITIGATION IMPLICATIONS
40
The American Tradition Institute v. EPA
• The American Tradition Institute sued the EPA in October 2012 to stop an ongoing experiment in which the agency was exposing elderly study subjects (up to 75 years of age) to concentrated levels of PM2.5
• The lawsuit claimed the experiments were illegal in that they blatantly violated virtually every major standard developed since World War II for the protection of human study subjects used in scientific experiments.
41
The American Tradition Institute v. EPA
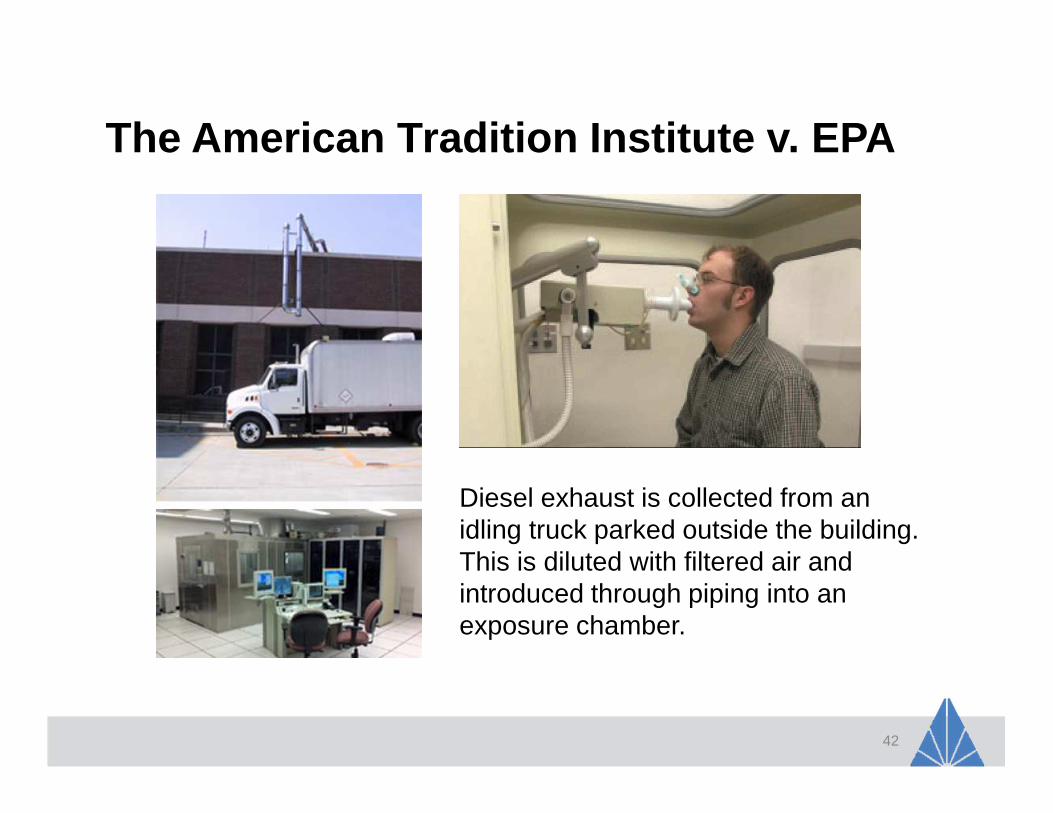
42
Diesel exhaust is collected from an idling truck parked outside the building. This is diluted with filtered air and introduced through piping into an exposure chamber.
The American Tradition Institute v. EPA (cont.)• “During these experiments, the study subjects
were intentionally exposed to airborne fine particulate matter (“PM2.5”) at levels ranging from 41.54 micrograms per cubic meter to 750.83 micrograms per cubic meter for periods of up to two hours.”
43
Texas - Texas Campaign for the Environment v. LCRA (July 20, 2012)
• The Fayette Power Project located in La Grange, Texas, a 1,625 megawatt power plant located about 60 miles west of the state capital of Austin was served a notice of intent by the Environmental Integrity Project (EIP).
• The EIP alleges LCRA (Lower Colorado River Authority the majority owner and operator of the plant) is in violation of its air pollution permits from the Texas Commission on Environmental Quality (TCEQ), specifically the limits on particulate matter (PM2.5), claiming that the plant uses antiquated electrostatic precipitators for dust collection instead of newer, more efficient baghouse filters.
44
Rio Tinto
• Rio Tinto’s power plant is only one of their four currently permitted operations in Salt Lake County. Rio Tinto emits 77% of all NOx, 66% of PM2.5, and 79% of all SO2.
• Since both NOx species and SO2 are capable of forming chemical particulates in the atmosphere, the DAQ considers PM2.5, NOx, and SO2 to be “interchangeable” as particulates under current air permitting rules.
• Rio Tinto annually emits 12,600 of those pollutants and the total for Salt Lake County is 39,119. Rio Tinto then is responsible for 32% of PM2.5 and its precursors. The details of Rio Tinto’s plans to increase the size and scope of their Utah mining and smelting operations
45
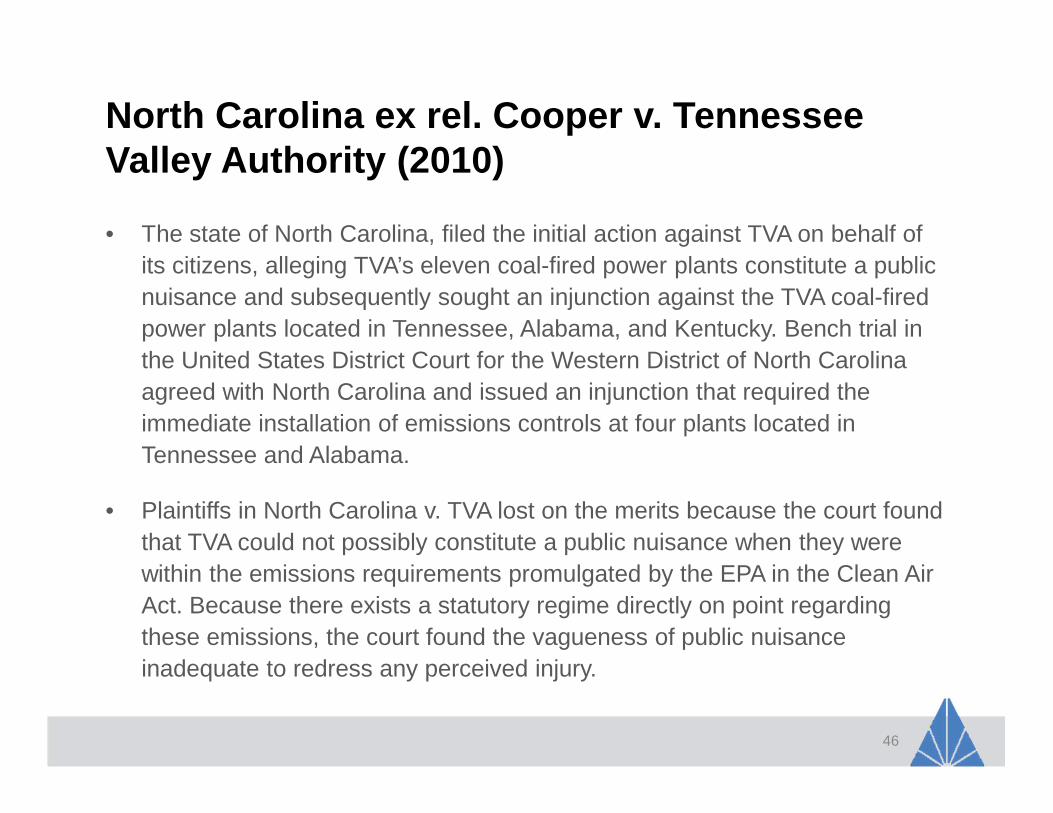
North Carolina ex rel. Cooper v. Tennessee Valley Authority (2010)
• The state of North Carolina, filed the initial action against TVA on behalf of its citizens, alleging TVA’s eleven coal-fired power plants constitute a public nuisance and subsequently sought an injunction against the TVA coal-fired power plants located in Tennessee, Alabama, and Kentucky. Bench trial in the United States District Court for the Western District of North Carolina agreed with North Carolina and issued an injunction that required the immediate installation of emissions controls at four plants located in Tennessee and Alabama.
• Plaintiffs in North Carolina v. TVA lost on the merits because the court found that TVA could not possibly constitute a public nuisance when they were within the emissions requirements promulgated by the EPA in the Clean Air Act. Because there exists a statutory regime directly on point regarding these emissions, the court found the vagueness of public nuisance inadequate to redress any perceived injury.
46
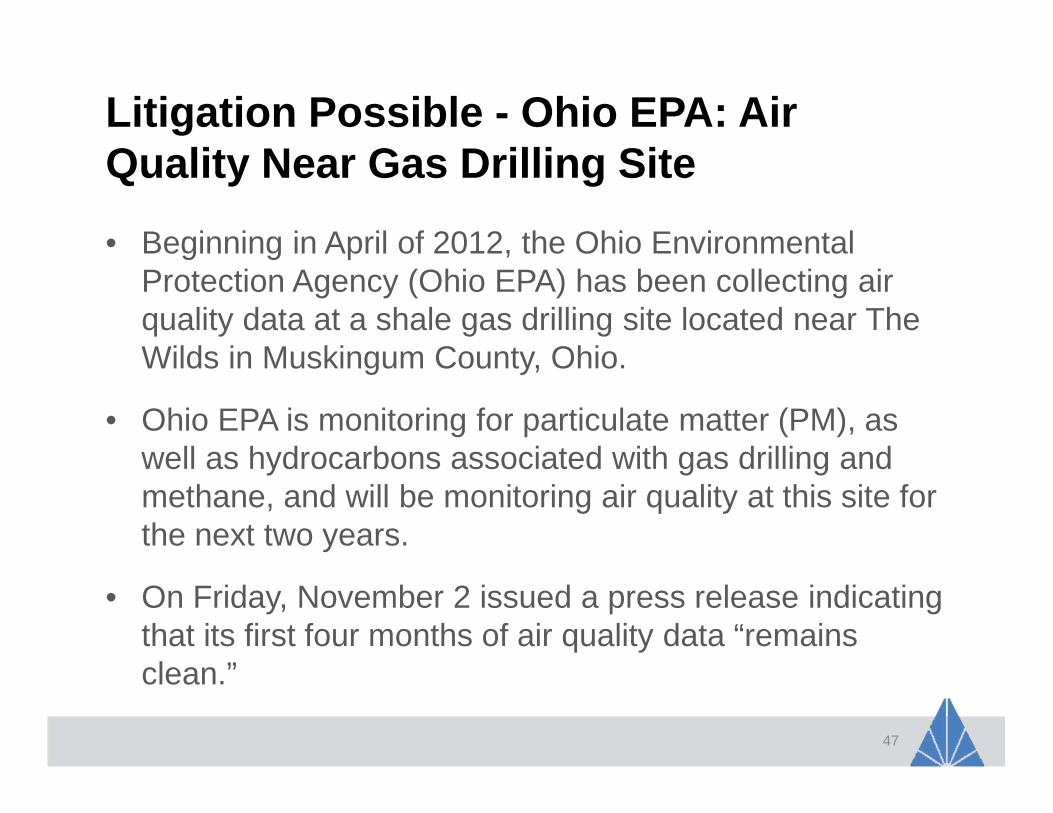
Litigation Possible - Ohio EPA: Air Quality Near Gas Drilling Site
• Beginning in April of 2012, the Ohio Environmental Protection Agency (Ohio EPA) has been collecting air quality data at a shale gas drilling site located near The Wilds in Muskingum County, Ohio.
• Ohio EPA is monitoring for particulate matter (PM), as well as hydrocarbons associated with gas drilling and methane, and will be monitoring air quality at this site for the next two years.
• On Friday, November 2 issued a press release indicating that its first four months of air quality data “remains clean.”
47
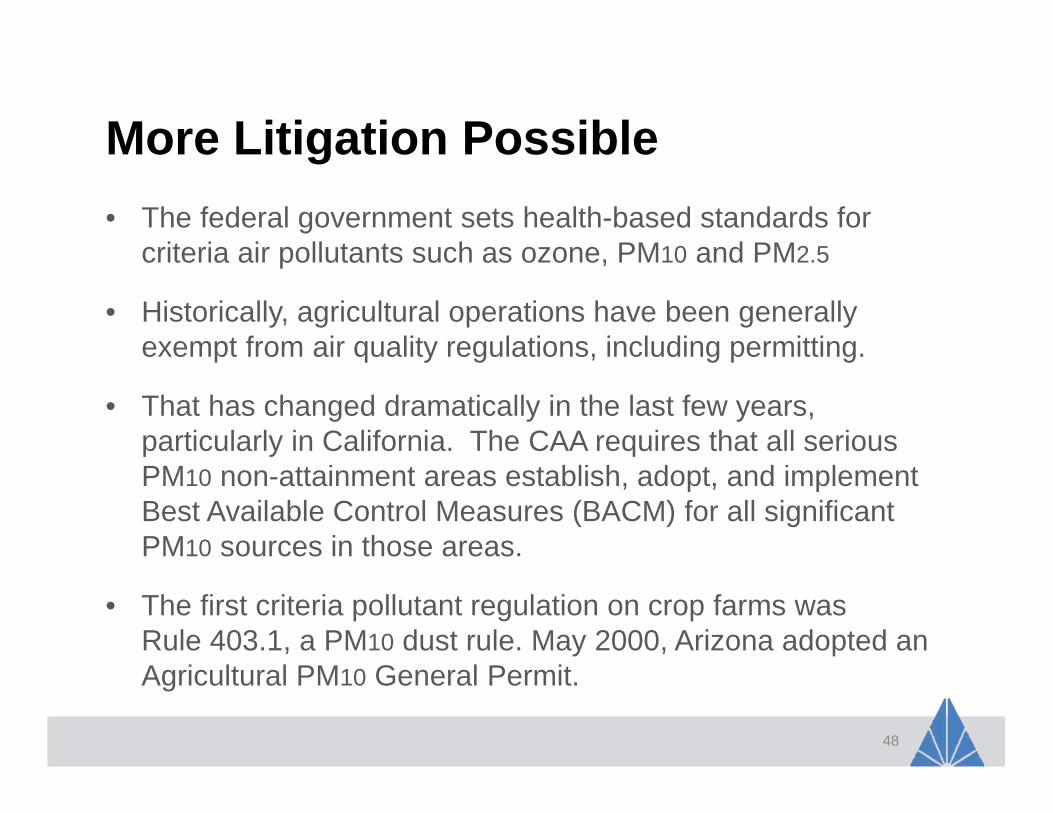
More Litigation Possible
• The federal government sets health-based standards for criteria air pollutants such as ozone, PM10 and PM2.5
• Historically, agricultural operations have been generally exempt from air quality regulations, including permitting.
• That has changed dramatically in the last few years, particularly in California. The CAA requires that all serious PM10 non-attainment areas establish, adopt, and implement Best Available Control Measures (BACM) for all significant PM10 sources in those areas.
• The first criteria pollutant regulation on crop farms was Rule 403.1, a PM10 dust rule. May 2000, Arizona adopted an Agricultural PM10 General Permit.
48
EXPOSURE MITIGATION
49
How are PM 2.5 Being Monitored?
• Community-oriented (core) sites that represent community-wide average exposure, form the basis of the PM2.5 network design.
• The network has close to 1,500 sites throughout the US territories that are maintained by both federal, state, and local agencies.
• The network consists of different elements that serve multiple information needs.
50
Continuous Monitoring
• The US EPA decided that continuous monitoring would be required in each of the nation's 52 largest metropolitan areas or cities.
• The continuous monitoring of PM2.5 will provide useful data for public reporting of short-term concentrations, for understanding diurnal and episodic behavior of fine particles, and for use by health scientists investigating exposure patterns.
• In lieu of filters, the samplers use an internal analytical apparatus to instantaneously measure the particles passing through the sampler.
51
Compliance Monitoring
• Making regional comparisons for PM2.5 National Ambient Air Quality Standards (NAAQS) is the prime objective of the PM2.5 network.
• This comparison is done with mass-only samplers which detect ambient concentrations of PM2.5 over a 24-hour period.
• Filters are pre-weighed under controlled conditions, run in samplers for 24 hours with a known volume of air, then post-weighed to determine ambient concentrations.
• At least three years of data will be collected before compliance issues are addressed.
• All sampling sites that provide data for comparison to either the 24-hour or the annual PM2.5
• NAAQS for the purpose of addressing attainment/nonattainment must use federally referenced samplers and techniques.
52
Speciation Monitoring
• Knowing the chemical composition of the PM2.5 mix is important for determining sources of pollution.
• The basic objective of the chemical speciation analysis is to develop seasonal and annual chemical characterizations of ambient particulates across the nation.
• This speciation data will be used to perform source attribution analyses, evaluate emission inventories and air quality models, and support health related research studies and regional haze assessments.
• The speciation samplers use different inlet tubes and filters to collect suspected harmful components of the PM2.5 mixture.
53
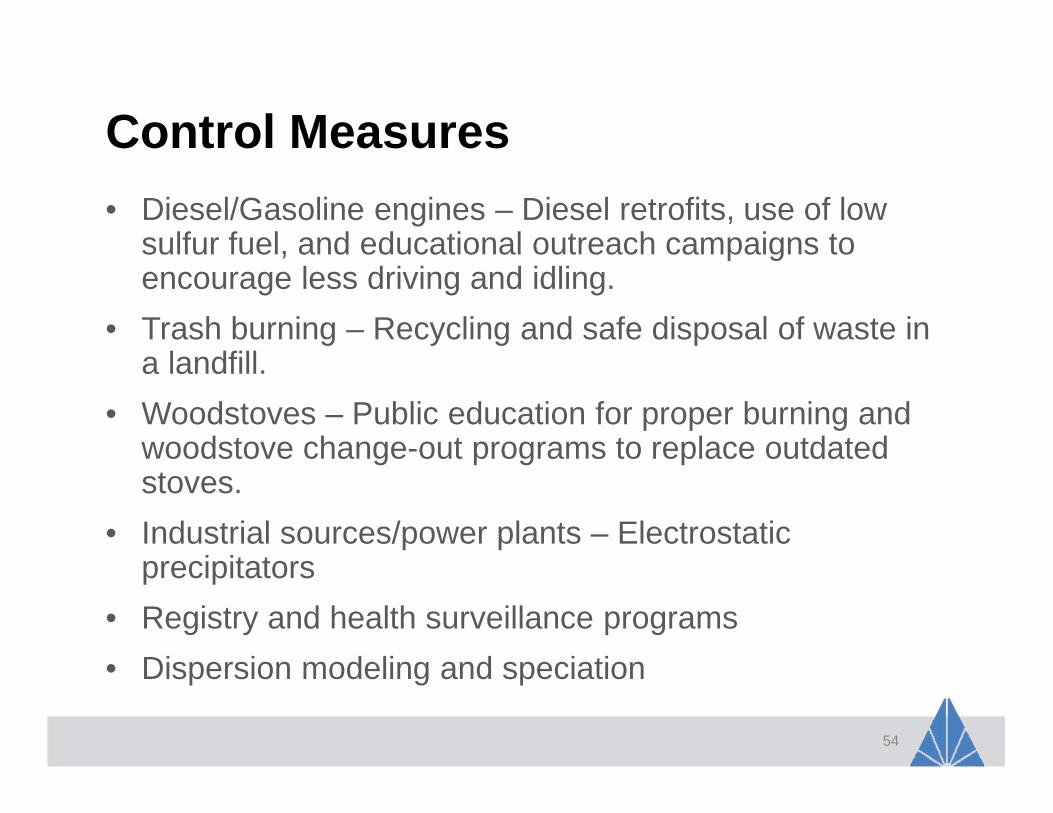
Control Measures
• Diesel/Gasoline engines – Diesel retrofits, use of low sulfur fuel, and educational outreach campaigns to encourage less driving and idling.
• Trash burning – Recycling and safe disposal of waste in a landfill.
• Woodstoves – Public education for proper burning and woodstove change-out programs to replace outdated stoves.
• Industrial sources/power plants – Electrostatic precipitators
• Registry and health surveillance programs
• Dispersion modeling and speciation
54

SUMMARY
55
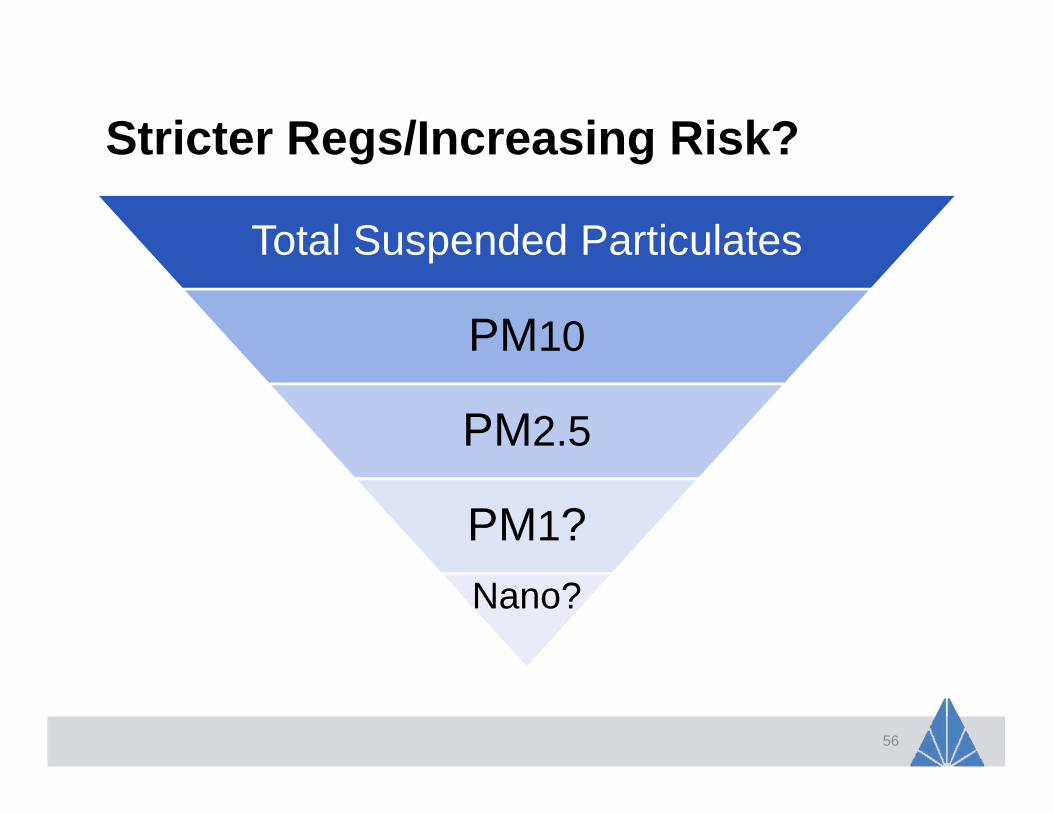
Stricter Regs/Increasing Risk?
Total Suspended Particulates
PM10
PM2.5
PM1?
Nano?
56
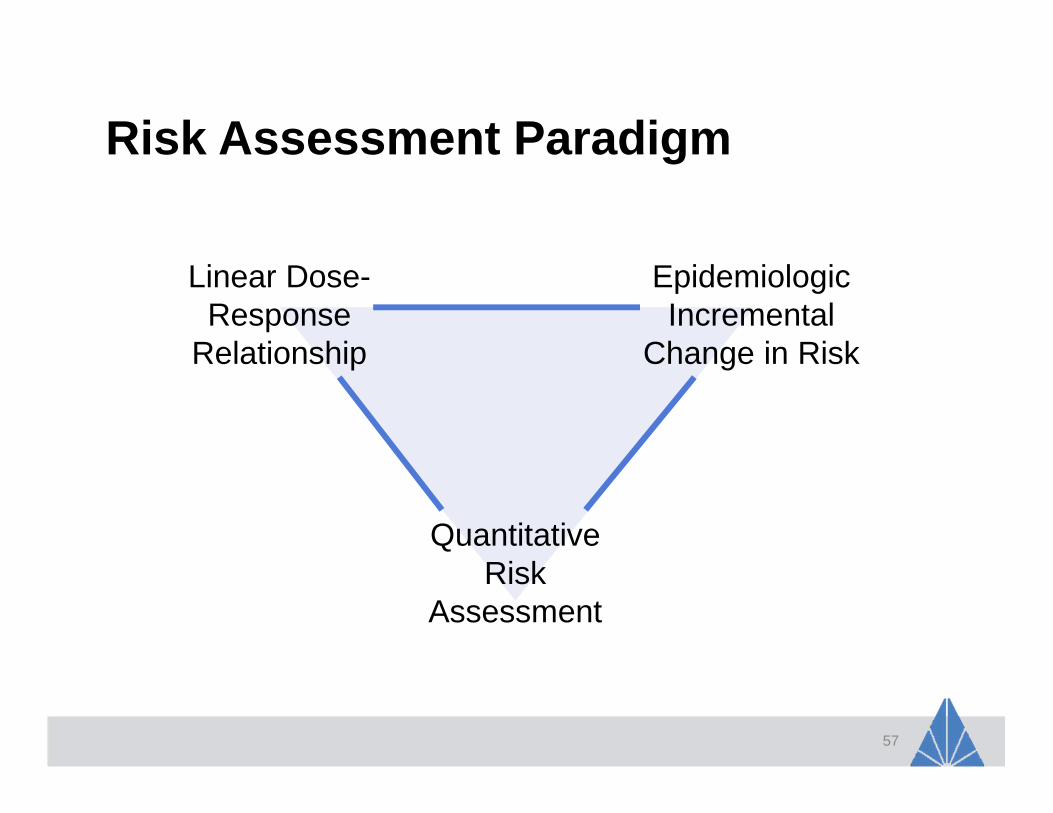
Risk Assessment Paradigm
57
Linear Dose-Response
Relationship
Epidemiologic Incremental
Change in Risk
Quantitative Risk
Assessment
Conclusions• Recent literature suggests that PM 2.5 may be
associated with several health conditions including:– Diabetes
– Cardiovascular disease and stroke
– Mortality
• Litigation involving PM 2.5 exposure has already been filed and may increase based on new research
• There may be no “safe” level of PM 2.5 exposure (linear dose-response)
• Methods exist that can help mitigate litigation and regulatory compliance
58
Related Issues for Another Day
• Engineered nanoparticles
• Diesel particulate
• NO2/sulfates
• Metals/ultrafine particles
• Silica
• PM10
• In vitro/animal studies
59

QUESTIONS?
60

![jan 2012 · 2017-07-19 · phot 2" x 2.5" photo 2" x 2.5" C) PageMaps photo 2.5" x 2.5" photo 2.5" x 2.5" photo 2.5" x 2.5" photo 2" x 2.5" photo 2.5" x 2.5" C] PageMaps photo 2.5"](https://img.pdfslide.us/doc/110x75/5f4cb42409b5fa18f7093d11/jan-2012-2017-07-19-phot-2-x-25-photo-2-x-25-c-pagemaps.jpg)


![Biomarkers of Exposure and Sensitivity to Organophosphorus [OP] Compounds and Consequences of Exposure Clement E. Furlong Genome Sciences and Medicine,](https://img.pdfslide.us/doc/110x75/551b7302550346a6148b503d/biomarkers-of-exposure-and-sensitivity-to-organophosphorus-op-compounds-and-consequences-of-exposure-clement-e-furlong-genome-sciences-and-medicine.jpg)