Embed Size (px)
Citation preview
Community Safety • Education Health Care • Economic Development
Community Safety • Education Health Care • Economic Development
Montcalm CountyCommunity Report Card 2005
IndIcators of our Well-BeIng

This page left intentionally blank.

Montcalm County Community Report Card
IntroductIon
Introductory InformatIon • Pages 3-5Introduction • State of the County• Indicator Evaluation
communIty Safety • Pages 6-9Out of Home Placement • Domestic Violence• Crime Offenses • Vehicle Crashes, Under-Age Drinkers
economIc development • Pages 10-15Total Equalized Value-Real Property • Public Transportation • Full- and Part-Time Jobs • Pre-valance of Poverty • Unemployment • Per Capita Income
educatIon • Pages 16-17Educational Attainment • Community College Enrollment/Conferment
HealtH care • Pages 18-25Teen Pregnancy • Infant Mortality • Preventable Hospitalizations • Child Immunization Rate • Prenatal Care • Low-Weight Births • Children’s Oral Health • Unintentional Injury Fatalities
taBle of contents
The Montcalm Human Services Coalition (MHSC) is comprised of 26 organizations and disciplines in Montcalm County including: economic development, public K-12 and higher education, public safety, health care, human services, employment and training, faith community, law enforcement, community foundations, and the community at large, among others. The mission of the MHSC is to plan, promote, and coordinate activities which result in an accessible, effective, and comprehensive community human service system. The coalition recognizes that Montcalm County is a great place to live, work, and play. The MHSC wanted a mechanism to track how well (or poorly) the needs of our citizens were being addressed over time, and then use that information to improve the community. The purpose of this Montcalm Community Report Card is to provide a data-driven foundation to report baseline information and assess changes. The MHSC selected four initial Report Card categories, then selected goals and in-dicators for each category. The initial category, goal, and indicator selection processes were conducted with the understanding that additional information and indicators would be included in future revisions. The Montcalm Community Report Card can be used by the MHSC and others to: Promote awareness of the MHSC’s purpose and role • Provide baseline information from which to track goal progress and change over time • Establish funding and program priorities • Develop community-supported programs that impact identified issues • Raise community awareness of identified community trends, needs, and strengths • Increase agency accountability • Stimulate community dialogue that moves people/organizations to action • and Influence public policy through education.
This document will be re-printed periodically as significant changes in information dictate. However, a website version at www.montcalm.org/reportcard.asp will be updated as new relevant information and indicators becomes available, with the “last updated” date noted. For the most current information regarding Montcalm County’s status, visitwww.montcalm.org/reportcard.asp.
3

state of the county
This first ever “Montcalm County Report Card” is presented at a time of dramatic change. Montcalm County is undergoing a major transition and, as is the case anytime significant change occurs, there are both positive and negative impacts.
Population Growth The county has experienced, and continues to experience, unprecedented population growth. Between 1990 and 2004, the population of the county increased from 53,059 to almost 64,000, and by 2020 is projected to be approaching 90,000 (Source: U.S. 2000 Census and West Michigan Regional Planning Commission projections).
Almost all of this growth has occurred because of new people moving into the county from surrounding urban areas and a significant portion of the growth has occurred in rural townships. However, these new residents, for the most part, continue to be employed outside of the county. Those commuting to jobs outside the county are approaching 50% of those residents employed who live in the county. This “bedroom community” growth pattern has resulted in significant investment in new construction in the county, both residential and commercial. It also, however, has resulted in new and significant pressures on existing land resources – prime agricultural areas, lakes, and streams, and other natural resources that help define the quality of life that makes the county such an attractive location. These pressures of growth will continue into the foreseeable future.
Employment At the same time this growth in population and significant new investment is occurring, there has been a continued decline in good-paying, manufacturing jobs which will culminate in the closing of both the Electrolux and Hitachi manufacturing facilities in 2005-2006, as well as the elimination or reduction of jobs at many other smaller operations. Even prior to these closings, Montcalm County’s unemployment rate exceeded the State of Michigan average and for 2004 the yearly average for the county was 8.6%. With the forthcoming layoffs, it is anticipated that this number will increase by the spring of 2006 to nearly 15%. The impact of these layoffs will be significant.
Poverty As the indicators in this report show, Montcalm County historically has had a percentage of its population living at or near the poverty level and has faced the challenges this creates. However, this number has also remained fairly constant in terms of absolute numbers of people. Moreover, many of these individuals have out of necessity learned to survive and cope with their existing situation over the years. This will not be the case with the 3,000+ newly unemployed workers, most of whom have never had to face issues such as wondering where their next mortgage or rent payment would come from, how to pay for needed health care for their children, or needing money to put food on the table for their family. These newly unemployed individuals and their families will be facing stressful situations that they have never experienced before. The communities of Montcalm County must step up to the challenge to ensure that the community’s and individual family’s safety, health and educational concerns are met. And further, given the new stressors, diligence is needed by all to assure that there are not rapidly increasing levels of negative outcomes such as abuse, drug usage, alcoholism, burglary, and lower student achievement.
4

IndIcator evaluatIon
The table below summarizes the results for each community indicator highlighted in the report. In describing the local trend (second column), those indicators having sufficient data are expressed as progressing in either a positive or negative direction, or unchanged. In the third column, Montcalm County indicator results are compared to those of the state, when possible, and rated as better, worse, similar or uncertain. Montcalm County’s progress toward each goal is recorded in the fourth column as yes, no or uncertain. The indicator’s overall rating is based on the consideration of these three above-mentioned observations, with the symbols representing satisfactory C, needs improvement D, or undetermined F.
outcome measure local trendcomparIson
to stateprogress
toWard goaloverallratIng
communIty safety
• Out of Home Placement Positive Better Yes C• Domestic Violence Unchanged Similar Yes C• Crime Offenses Negative Better Yes C• Under-Age Drinking Crashes Positive Similar Yes FeconomIc development
• Total Equalized Value Positive Better Yes C• Public Transportation Uncertain Worse No D• Employment (Total Jobs) Positive Better Yes C - Manufacturing Jobs Negative Worse No D• Prevalence of Poverty Negative Worse No D• Unemployment Rate Negative Worse No D• Per Capita Income Positive Worse Yes C
educatIon
• Educational Attainment Positive Better Yes C• Community College Enrollment Positive Better Yes C
health care
• Teen Pregnancy Positive Worse Yes C• Infant Mortality Unchanged Worse No D• Preventable Hospitalizations Unchanged Worse No F• Child Immunization Rate Positive Better Yes C• Adequacy of Prenatal Care Unchanged Worse No D• Low-Weight Births Negative Better No D• Children’s Oral Health Unknown Uncertain Uncertain F• Unintentional Injuries Unchanged Worse No D
5

communIty safety
IndIcator: out-of-home placement
MeasureThe number of youth under 18 years of age in out-of-home placement per thousand youth residing in the county, due to neglect and/or abuse by caretakers. This does not include cases of out-of-home placement due to delinquency.
Why Is thIs IndIcator IMportant? The number of youth placed in out-of-home (foster) care due to neglect and abuse is an indicator of the prevalence of families with poor parenting skills and unhealthy/unsafe lifestyles. Youth in foster care need extra support to succeed since these children are more likely to have emotional/men-tal health problems, are more likely to be involved in delin-quency, and are less likely to graduate from high school. The goal of foster care is to provide the abused/neglected child with a home and family until the child is either returned to his/her birth parents or is adopted. The Michigan Depart-ment of Human Services (DHS) attempts to maintain in-home placements whenever possible. Provision of support services such as Families First, counseling, Step Down (con-tract to provide in-home services including teaching effec-tive parenting, conflict resolution, budgeting and referral to other services), transportation, and medical care are impor-tant to maintaining a healthy and safe family unit. Reunifica-tion services are also available to assist biological parents and children continue visitation in preparation of restoring the child to the home.
Goal for MontcalM countyTo maintain or reduce the rate of youth in out-of-home placement (foster care) below that of the state-wide rate by pro-viding services to families identified as at-risk.
hoW Well Is the MontcalM
coMMunIty doInG?The data indicates consistently fewer cases of abuse/ne-glect resulting in foster-care placement per 1,000 youth within Montcalm County families investigated compared to state-wide findings. The DHS reports there is a significant increase in the shift from out-of-home placement in non-relative foster care to relative (kinship) care the past several years. Montcalm County’s ongoing foster-care caseload represents only a small fraction (0.25% to 0.45%) of the state’s total number of children in foster care. Montcalm County has experienced a recent decrease in the proportion of youth in out-of-home placement over the last two years and some success in preserving families.
SOURCE: MichiganDepartment of Human Services Management Information Report, 2005.
Avg. Foster Care Ongoing Caseload Supervised by FIA/DHS per 1,000 Youth under 18 yrs.
2.33.2
4.3 4.43.7 3.2
7.5 7.5 7.8 7.6 7.7 7.7
0.0
2.0
4.0
6.0
8.0
10.0
1999 2000 2001 2002 2003 2004
Cas
es p
er 1
,000
You
th
Montcalm Cases per 1,000 Youth MI Cases per 1,000 Youth
avG. foster care onGoInG caseload supervIsed
by dhs per 1,000 youth under 18 yrs.
NOTE: The Michigan Family Independence Agency (FIA) changed its name to the Michigan Department of Human Services (DHS) in 2005.
MI % Change Montcalm % Change
averaGe annual abuse/neGlect caseload
1999 19,302 n/a 38 n/a2000 19,434 0.7% 53 39.5%2001 20,058 3.2% 70 32.1%2002 19,593 -2.3% 71 1.4%2003 19,451 -0.7% 59 -16.9%2004 19,590 0.7% 52 -11.9%
6

communIty safety
IndIcator: domestIc vIolence
MeasureThe number of domestic violence victims reported to law enforcement per 10,000 population.
Why Is thIs IndIcator IMportant?Domestic violence impacts families and communities at all levels and is an unacceptable reality and constant presence in our county. Between 1993 and 2002, family violence accounted for about one in 10 violent victimizations. Of roughly 3.5 million violent crimes committed against family members, 49% were crimes against spouses, 11% against sons/daughters and 40% against other family members. It is estimated that only 59% of family violence incidents during these years were actu-ally reported to police. Approximately 73% of victims were female. (SOURCE: U.S. Department of Justice Family Violence Statistics, June 2005, NCJ207846). Domestic violence means the occurrence of any of the following (to a family or house-hold member by a person) that is not an act of self-defense: causing or attempting to cause physical or mental harm; placing a member in fear of physical or mental harm; causing or at-tempting to cause a member to engage in involuntary sexual ac-tivity by force or threat of force; or engaging in an activity that would cause a reasonable person to feel terrorized, frightened or intimidated. A family or household member may include a current or former spouse, an individual that has had a dating
relationship or sexual relationship, is related or was formerly related by marriage, an individual with whom there is a child in common, or the minor child of a spouse or former spouse.
hoW Well Is the MontcalM
coMMunIty doInG?The prevalence (per 10,000 population) of domestic vio-lence victims is quite similar between Montcalm County and the state of Michigan, as is the trend in the victimization rate between 1998 and 2003 (see chart below). Both regions have maintained a rate of approximately 45 to 50 victims per 10,000 population, with relatively minor fluctuations from year to year. Montcalm County did experience a greater rate of decline in victimization than the state in 2003, after peaking in 2002. Relief After Violent Encounter–Ionia/Montcalm, Inc. (RAVE-I/M) provides free and confidential services to victims of domestic and sexual violence. In 2003-04, RAVE-I/M provided domestic violence services to 195 women and children from Montcalm County.
Goals for MontcalM countygoal one) To reduce or maintain the prevalence of domestic violence victimization below that of the statewide rate.goal tWo) For sectors, organizations and individuals to work together collaboratively to provide a seamless system response to domestic violence.
SOURCE: MichiganDepartment of Human Services Management Information Report, 2005.
Avg. Foster Care Ongoing Caseload Supervised by FIA/DHS per 1,000 Youth under 18 yrs.
2.33.2
4.3 4.43.7 3.2
7.5 7.5 7.8 7.6 7.7 7.7
0.0
2.0
4.0
6.0
8.0
10.0
1999 2000 2001 2002 2003 2004
Cas
es p
er 1
,000
You
th
Montcalm Cases per 1,000 Youth MI Cases per 1,000 Youth
avG. foster care onGoInG caseload supervIsed
by dhs per 1,000 youth under 18 yrs. Domestic Violence Victim Prevalence (1998 - 2003)
48.442.4
46.9 48.054.9
49.0
45.6 42.1 46.2 47.152.6
43.9
0
15
30
45
60
1998 1999 2000 2001 2002 2003
Vic
tims
per
10,0
00 p
op.
Michigan Victims per 10,000 pop. Montcalm Victims per 10,000 pop.
doMestIc vIolence vIctIM prevalence (1998-2003)
SOURCE: Domestic Violence Victims: Michigan State Police Department, Uniform Crime Reports, 2005. State and county population: U.S. Census Bureau, 2005.
Annual Number of Domestic Violence
Victims Reported to Law Enforcement
in Montcalm County
1998 — 2741999 — 2562000 — 2832001 — 2922002 — 3292003 — 276
7

communIty safety
IndIcator: crIme offenses
MeasureThe number of index (violent and property) crime offenses per 10,000 population.
Why Is thIs IndIcator IMportant? The Michigan State Police and the Federal Bureau of In-vestigation (FBI) classify crimes as index or non-index. The eight index crimes can be sub-divided into those of a violent nature (murder, rape, robbery and aggravated assault) and those affecting property (burglary, larceny, arson, and motor vehicle theft). Because of their serious nature, these index-crime offenses are considered a better indicator of the crime situation than is total crime, which includes many non-index offenses and minor infractions.
hoW Well Is the MontcalM
coMMunIty doInG?While Michigan has witnessed a nearly 20% decrease in the rate of major (index) property crime offenses from 1997 to 2003, Montcalm County is beginning to experi-ence an increase, now approaching a rate similar to the state. The rate of index violent crime offenses in the state has decreased about 10% over the same period, whereas Mont-calm County has witnessed essentially no change; however, it remains lower than the overall state violent crime rate. Montcalm County continues to experience a higher non-in-dex crime rate than Michigan, not accounted for by assault, vandalism and Driving Under the Influence (DUI) offenses, which have a nearly identical rate as Michigan.
Goal for
MontcalM countyTo maintain violent and property index crime of-fense rate below that of the State of Michigan.
NOTE: In the bottom chart, assault, vandalism and DUI (A,V, DUI) make up 3 of the most frequently encountered non-index crimes and are grouped together as a com-parison to total non-index offenses. Sixteen categories of non-index crimes are listed in the Uniform Crime Report.
SOURCE: Michigan State Police Department, Uniform Crime Report, 2005.
Montcalm County vs. MI Offense Rate - Non-Index Crimes
653729 709 690 696 682 656
292 317 298 295 295 293 280
301 333 314 291 285 272
835832710743775760729
335
0
200
400
600
800
1997 1998 1999 2000 2001 2002 2003
Offe
nses
per
10,
000
Pop.
MI Total Non-Index Montcalm Total Non-IndexMI A,V,DUI Montcalm A,V,DUI
Total Non-Index
A,V,DUI Crime
Michigan vs Montcalm County Offense Rate - Index Crimes
57 65 59 54 55 54 51
405 420380
349 353 337 326
263 244 253 242277 299 309
353332312533260
100
200
300
400
500
1997 1998 1999 2000 2001 2002 2003
Off
ense
s p
er 1
0,00
0 P
op
.
MI Index (Violent) Montcalm Index (Violent)MI Index (Property) Montcalm Index (Property)
Property Crime
Violent Crime
MIchIGan vs. MontcalM county offense rate - Index crIMes
MontcalM county vs. MIchIGan offense rate - non-Index crIMes
8

communIty safety
IndIcator: vehIcle crashes, under-age drInkers
MeasureThe proportion of total alcohol-related vehicular crashes involving registered drivers age 16 to 20 years occurring in Montcalm County.
Why Is thIs IndIcator IMportant?The Montcalm County population continues to grow, and with this growth comes an increase in traffic-related issues, including crash injuries and fatalities. Michigan is one of several states that has enacted a graduated driver licensing system (1998) in an attempt to reduce crashes and injuries involving teen drivers. In July 2003, the Michigan Depart-ment of State launched its “We Check to Protect!” public awareness campaign highlighting a new law (a vertical driv-er’s license for youth under 21) designed to keep Michigan’s youth safe on and off the roads. However, the proportion of teens involved in alcohol-related crashes has continued to increase despite minimum legal drinking age (MLDA) laws prohibiting the sale of alcohol to persons under age 21.
hoW Well Is the MontcalM
coMMunIty doInG?While Michigan has witnessed a 19% decrease in vehicular crashes from 1995 to 2003 related to drinking-drivers age 16 to 20 years, this age group has steadily accounted for a greater proportion of total crashes involving a drinking driv-er – from 9.8% to 11.7% by 2003. This is because crashes involving other age groups 25 years and older have decreased at a faster rate than teens (38% vs. 19%). In Montcalm County, the trend is similar, and teens continue to account for a significant portion of drinking-driver crashes, averag-ing nearly 14% of the total from 1995 to 2003.
Goal for MontcalM countyTo reduce the proportion of vehicular crashes involving a drinking driver among youth age 16 to 20 years below 10% of total crashes or below the Michigan rate, whichever is less.
NOTE:M.C. represents Montcalm County; MIrepresents the State ofMichigan.
vehIcle crashes by aGe of drInkInG drIver
MIchIGan
vehIcle crashes by aGe of drInkInG drIver
MontcalM county
proportIon of vehIcle crashes by aGe of drInkInG drIver
9
Proportion of Vehicle Crashes by Age of Drinking Driver
8.4% 17
.4%
9.8% 15
.2%
13.7
%
16.4
%
10.9
%
15.8
%
17.6
%
12.7
%
11.1
%
16.1
%
14.3
%
21.4
%
11.8
%
17.3
%
15.8
%
17.8
%
12.2
%
18.1
%
12.6
% 24.3
%
63.1
%
11.7
%
18.5
%
69.7
%
74%
75%
70% 73%
70%
73%
64% 71
%
66% 70%
0%
20%
40%
60%
80%
100%
M.C. 16-20 yrs(% of total)
M.C. 21-24 yrs(% of total)
M.C. 25+ yrs(% of total)
MI 16-20 yrs(% of total)
MI 21-24 yrs(% of total)
MI 25+ yrs (%of total)
Perc
ent o
f Tot
al C
rash
es
1995 1999 2000 2001 2002 2003
Vehicle Crashes by Age of Drinking Driver - Montcalm Co.
13
2720 2429
2118
2724 27
13
25
115
102 11
581
101
65
0
30
60
90
120
M.C. 16-20 yrs M.C. 21-24 yrs M.C. 25+ yrs
Num
ber o
f Cra
shes
1995 1999 2000 2001 2002 2003
0%(-)7%
(-)43%
Vehicle Crashes by Age of Drinking Driver - Michigan
3,32
9
1,91
5
2,76
1
1,82
0
2,65
0
1,77
7
2,60
9
1,83
9
2,73
2
1,71
2
2,69
9
16,3
90
2,13
2
12,8
4211
,984
10,6
8610
,514
10,1
61
0
3,000
6,000
9,000
12,000
15,000
MI 16-20 yrs MI 21-24 yrs MI 25+ yrs
Num
ber o
f Cra
shes
1995 1999 2000 2001 2002 2003
(-)19%
(-)38%
(-)19%

economIc development
IndIcator: total equalIzed value
MeasureThe total equalized value of real property growth in Mont-calm County.
Why Is thIs IndIcator IMportant?A key to the county and its residents’ future well-being is that there is ongoing investment being made in the county. Significant investment in upgrading that which currently ex-ists and investment in new projects (i.e., residential, commer-cial, industrial) is a strong indicator of a vibrant, growing and stable economic base.
Goal for MontcalM countyTo maintain an annual real property growth rate of at least 10%.
hoW Well Is the MontcalM
coMMunIty doInG?Montcalm County has experienced significant economic growth since 1994 as measured by both an absolute increase in real property values and as measured by an annual per-centage increase. Since 1994, the County has had a posi-tive 180% change in real property values, increasing from $664,888,855 in 1994 to $1,869,888,184 in 2004. Since 1998, this growth has been reflected in all sectors (residen-tial development, new and expanded commercial develop-ment, and industrial growth) and has been significantly greater than the annual inflation rate. Growth has been the strongest in the Greenville area, in the Panhandle area (Pier-son, Winfield, and Reynolds Townships), and in the county’s Renaissance Zone areas.
NOTE: Average growth per year was 10.8%, with the highest growth of 16.3% for the years 2002-2003 and the lowest growth of 7.4% for the years 1995-1996. SOURCE: Michigan State Tax Commission, last updated May, 2005.
10
Total Equalized Value of Real Property GrowthMontcalm County
$0$200,000,000
$400,000,000$600,000,000$800,000,000
$1,000,000,000
$1,200,000,000$1,400,000,000$1,600,000,000
$1,800,000,000$2,000,000,000
1995
1996
1997
1998
1999
2000
2001
2002
2003
2004
Tota
l Equ
aliz
ed V
alue
- Rea
l Pro
pert
y
Dollar Amount
total equalIzed value of real property GroWth
MontcalM county

IndIcator: puBlIc transportatIon
economIc development
MeasureAt this time, we have not selected one measure that best re-flects our progress toward our goals of public transportation that meets the needs of transit-dependent populations.
Why Is thIs IndIcator IMportant?We know that the lack of available public transporta-tion for the majority of Montcalm’s citizens is a problem. Participants in recent county-wide surveys have indicated that up to 25% of the county population is in need of such transportation. Ability for many to access health care, job training, employment opportunities, day care services, and other every day human service needs is greatly restricted be-cause of the non-existence of public transportation in most areas of the county. It is clear that the need and demand for such transportation will only increase as our population ages and the nature of our workforce changes.
hoW Well Is the MontcalM
coMMunIty doInG?Montcalm is fortunate to have at least 28 organizations, including K-12 schools, that provide some level of transpor-tation for their clients/customers. In response to a recent
survey of transportation providers, the total annual budget for these services was reported to be in excess of $4 million (SOURCE: 2002 Montcalm Human Services Coalition survey).
With the huge dollar amount spent annually on transporta-tion, one would expect that our residents would have ready access to public transit whenever and wherever needed. However, this is not the case.
Although agencies, schools and government cumulatively are spending millions of dollars, funding streams and regula-tions often require that agencies provide services only to their clients, sometimes only in crisis situations. This results in a fragmented transportation system that is costly, duplica-tive, and unable to meet the needs across the county.
Through research of existing successful transportation models, a system that is sustainable and meets the needs of Montcalm’s citizens will be proposed and an implementa-tion strategy will be developed.
Goals for MontcalM countygoal one) To provide comprehensive public transportation that meets the needs of Montcalm County’s transit-depen-dent population.
goal tWo) To maximize the efficient use of available, exist-ing resources to provide the county-wide transportation service to Montcalm residents in the near term.
goal three) To identify and implement a sustainable fund-ing mechanism necessary to support a county-wide public transportation system.
11
economIc development
IndIcator: full- & part-tIme JoBs
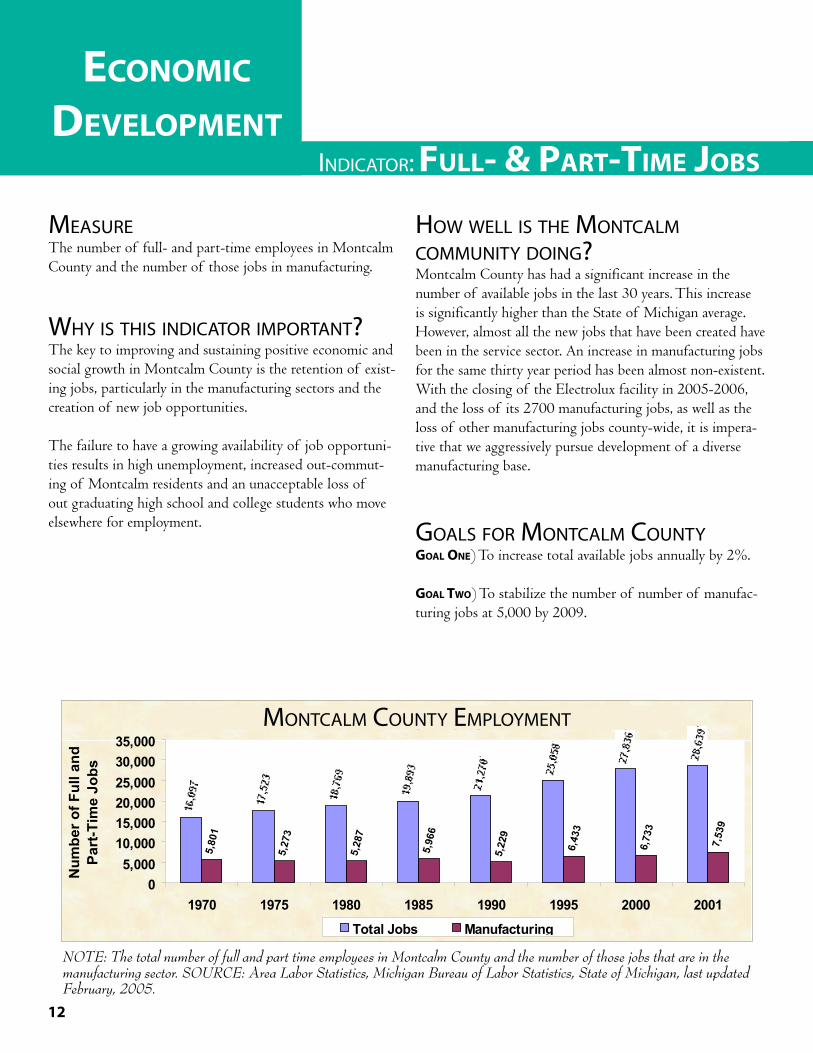
MeasureThe number of full- and part-time employees in Montcalm County and the number of those jobs in manufacturing.
Why Is thIs IndIcator IMportant?The key to improving and sustaining positive economic and social growth in Montcalm County is the retention of exist-ing jobs, particularly in the manufacturing sectors and the creation of new job opportunities.
The failure to have a growing availability of job opportuni-ties results in high unemployment, increased out-commut-ing of Montcalm residents and an unacceptable loss of out graduating high school and college students who move elsewhere for employment.
hoW Well Is the MontcalM
coMMunIty doInG?Montcalm County has had a significant increase in the number of available jobs in the last 30 years. This increase is significantly higher than the State of Michigan average. However, almost all the new jobs that have been created have been in the service sector. An increase in manufacturing jobs for the same thirty year period has been almost non-existent. With the closing of the Electrolux facility in 2005-2006, and the loss of its 2700 manufacturing jobs, as well as the loss of other manufacturing jobs county-wide, it is impera-tive that we aggressively pursue development of a diverse manufacturing base.
Goals for MontcalM countygoal one) To increase total available jobs annually by 2%.
goal tWo) To stabilize the number of number of manufac-turing jobs at 5,000 by 2009.
NOTE: The total number of full and part time employees in Montcalm County and the number of those jobs that are in the manufacturing sector. SOURCE: Area Labor Statistics, Michigan Bureau of Labor Statistics, State of Michigan, last updated February, 2005.
12
Montcalm County Employment
5,80
1
5,27
3
5,28
7
5,96
6
5,22
9
6,43
3
6,73
3
7,53
9
05,000
10,00015,00020,00025,00030,00035,000
1970 1975 1980 1985 1990 1995 2000 2001
Num
ber o
f Ful
l and
Pa
rt-T
ime
Jobs
Total Jobs Manufacturing
MontcalM county eMployMent

IndIcator: prevalence of poverty
MeasureThe number and percentage of Montcalm County popula-tion with income at or below the poverty level. The U.S. Census Bureau uses a set of income thresholds that vary by family size and composition to determine the poor. If a family’s total income is less than the threshold for that fam-ily size, then that family and every individual in it is consid-ered poor. In 2004, the threshold for a family of four was $18,850.
Why Is thIs IndIcator IMportant?Poverty is associated with many negative outcomes such as substance abuse, violent behavior, teen pregnancy, juvenile delinquency, low academic achievement, and lack of access to health care. Poverty places a strain on individuals, fami-lies, and community resources.
hoW Well Is the MontcalM
coMMunIty doInG?The number of people with income at or below the poverty
level in Montcalm County decreased by 1,804 between the years 1989 and 1999. However, the number increased by 1,256 between the years 1999 and 2002. Currently, (2002), 12.0% of the population in Montcalm County is at or below the poverty level. This is above the state average of 10.9%. It is anticipated that with the significant increase in dislocated workers due to the closing of Electrolux, Hitachi, and others in 2005-2006, that in the short term this num-ber will increase significantly.
Goals for MontcalM countygoal one) To provide a wide range of support to those newly at the poverty level in order to move them back into the employed workforce as rapidly as possible.
goal tWo) To reduce the total number of those living in poverty in Montcalm County to under 4,000 by 2009.
goal three) To reduce poverty percentage in Montcalm County to under 5% by 2009.
economIc development
NOTE: The number of Montcalm residents with income at or below the poverty level. SOURCE: United States Census Bureau, Housing and Household Statistics Division, Small Area Estimate Branch, last updated December, 2004.
13
Poverty in Montcalm County
7,8009,004
8,226 7,861
5,996 6,1747,252
0
2,000
4,000
6,000
8,000
10,000
12,000
1989 1993 1995 1997 1999 2001 2002
Year
Num
ber o
f Res
iden
ts
Livi
ng in
Pov
erty
poverty In MontcalM county

economIc development
IndIcator: unemployment
MeasureThe rate of unemployed persons in Montcalm County to the total labor force expressed as a percentage. Persons are considered unemployed if they have no job and are actively seeking work.
Why Is thIs IndIcator IMportant?The unemployment rate is low during good economic times and high during a recession. In an economic downturn, the rate tends to underestimate the number of unemployed because some people become discouraged and stop looking for work, thereby disqualifying them from being counted as unemployed by the definition.
At the individual level, unemployment reduces household income, can limit access to health insurance, and contributes to psychological stress. At the community level, a rise in job-lessness reflects a lack of job opportunities and places de-mands on community human services. Unemployment rates in Michigan are normally low among persons with education
beyond high school and among managerial, professional, and technical workers. Rates are higher among minority groups, high school dropouts and unskilled laborers.
hoW Well Is the MontcalM
coMMunIty doInG?After several years of decline, Montcalm County’s unem-ployment rate since 2000 has increased yearly and for the year 2004 stood at 8.5%. The rate for the county contin-ues to be consistently higher than the rate for the state of Michigan, and is an area of major concern with the closing of Electrolux and other manufacturing operations in 2005-2006.
Goals for MontcalM countygoal one) To maintain an annual unemployment rate below 6%.goal tWo) To maintain an annual unemployment rate below the state of Michigan average by 2010.
NOTE: The ratio of unemployed persons in the total labor force expressed as a percentage. SOURCE: Local area unemploy-ment statistics, Michigan Bureau of Labor Statistics, last updated January, 2005.
14
Unemployment In Montcalm County
0.0
3.0
6.0
9.0
12.0
15.0
18.0
1970 1980 1985 1990 1995 2000 2002 2003 2004
Ann
ual A
vera
ge P
erce
ntag
e
Montcalm Michigan
uneMployMent In MontcalM county

IndIcator: per capIta Income
MeasureThe average income per person in Montcalm County.
Why Is thIs IndIcator IMportant?Changes in per capita income reflect economic growth in a community. In addition, comparison between state and local area per capita income data provide insight into the econom-ic well being of a community.
Low per capita income may indicate that the local economy does not adequately support individuals and families.
hoW Well Is the MontcalM
coMMunIty doInG?The per capita income in the Montcalm community has risen steadily since 1970, but it remains both in growth percentage and absolute amount significantly lower than the Michigan per capita income of $29,816 as of 2002.
Goals for MontcalM countygoal one) To increase per capita income in Montcalm County at an annual rate of 4%.goal tWo) To exceed the state of Michigan’s annual average growth rate for per capita income.
economIc development
15
NOTE: Per capita income is the average income per person. SOURCE: Regional Economic Information System, Bureau of Economic Analysis, U.S. Department of Commerce, last updated February, 2005.
Per Capita Income
$4,194$6,279
$10,369
$14,734
$19,020
$23,934
$28,408$29,816
$5,004
$8,456$11,073
$12,964$15,492
$17,396$19,752
$3,388$0
$5,000
$10,000
$15,000
$20,000
$25,000
$30,000
$35,000
1970 1975 1980 1985 1990 1995 2000 2002
Dol
lars
Michigan Montcalm
per capIta IncoMe

educatIon
IndIcator: educatIonal attaInment
MeasureThe level of education achieved by Montcalm County resi-dents.
Why Is thIs IndIcator IMportant?An individual with a higher education is believed to be a vital member of a healthy and successful global-thinking community. Increased educational levels also translate to a higher quality of life.
hoW Well Is the MontcalM
coMMunIty doInG?The population of Montcalm County is becoming bet-ter educated. Every category reported in the 2000 Census improved relative to the 1990 Census. Most notably was the significant increase in the number of people with post-sec-ondary education.
Goal for MontcalM countyTo increase the number of Montcalm County residents who receive high school diplomas and post-secondary certificates and degrees.
NOTE: For population 25 years of age and over. SOURCE: Montcalm County, U.S. Census, 1990 and 2000.16
Popu
latio
n
MONTCALM COUNTY EDUCATIONAL ATTAINMENT 1990 vs. 2000
0
10,000
20,000
30,000
40,000
Popu
latio
n
1990 39,238 3,060 5,712 13,874 5,646 1,973 1,726 968
2000 39,560 2,115 5,334 15,801 9,336 2,863 2,863 1,415
Pop 25 Yrs +
Less than 9th Grd.
9-12 No Diploma
Diploma/GED
Some College
Assoc. Degree
Bach. Degree
Prof. Degree
MontcalM county educatIonal attaInMent
1990 vs. 2000

IndIcator: communIty college enrollment
MeasureMontcalm Community College total credit enrollment, total non-credit and workforce development enrollment, and total degrees and certificates conferred.
Why Is thIs IndIcator IMportant?In today’s global market, education beyond high school is increasingly necessary to attain an individual’s career and economic goals.
hoW Well Is the MontcalM
coMMunIty doInG?The residents of Montcalm County are becoming better educated. Montcalm Community College continues to play a vital role in advancing the education levels of county resi-dents. Educational and training opportunities are available at the following locations: Sidney, Greenville, Howard City, Ionia, Alma, and at area high schools.
Goal for MontcalM countyTo increase the number of people who obtain post-second-ary hours, degrees and certificates.
educatIon
SOURCE: Montcalm Community College, last updated June 29, 2005.
a Word aBout lIteracy
Literacy and life-long learning are vital to creating a county that offers a high quality of life for its residents. Higher literacy levels can mean employment and higher wages, aiding in mobility and economic opportunities. A num-ber of Montcalm County organizations address literacy at all ages, including foster-grandparents/school-based reading mentoring programs, Mont-calm Adult and Community Education, and Montcalm Adult Reading Council. Unfortunately, limited data exists on the demographics of the population served and program success rates.
17
MCC Degrees and Certificates Conferred
9977
176141
45
186
63
138
201
050
100150200250
Degrees Certificates Total
Num
ber
May-02 May-03 May-04
Mcc deGrees and certIfIcates conferred
MCC Student Enrollment 2002-05
1,649 1,632
664
1,824 1,896
740 804
2,1162,085
619445
1,122
744
389634 740 888
437790 742
0
500
1,000
1,500
2,000
2,500
Summer2002
Fall 2002 Spring2003
Summer2003
Fall 2003 Spring2004
Summer2004
Fall 2004 Spring2005
Summer2005
Stud
ent P
opul
atio
n
Total Credit Enrollment Total Non-Credit & Workforce Dev. Enrollment
Mcc student enrollMent 2002-05
health care
IndIcator: teen pregnancy
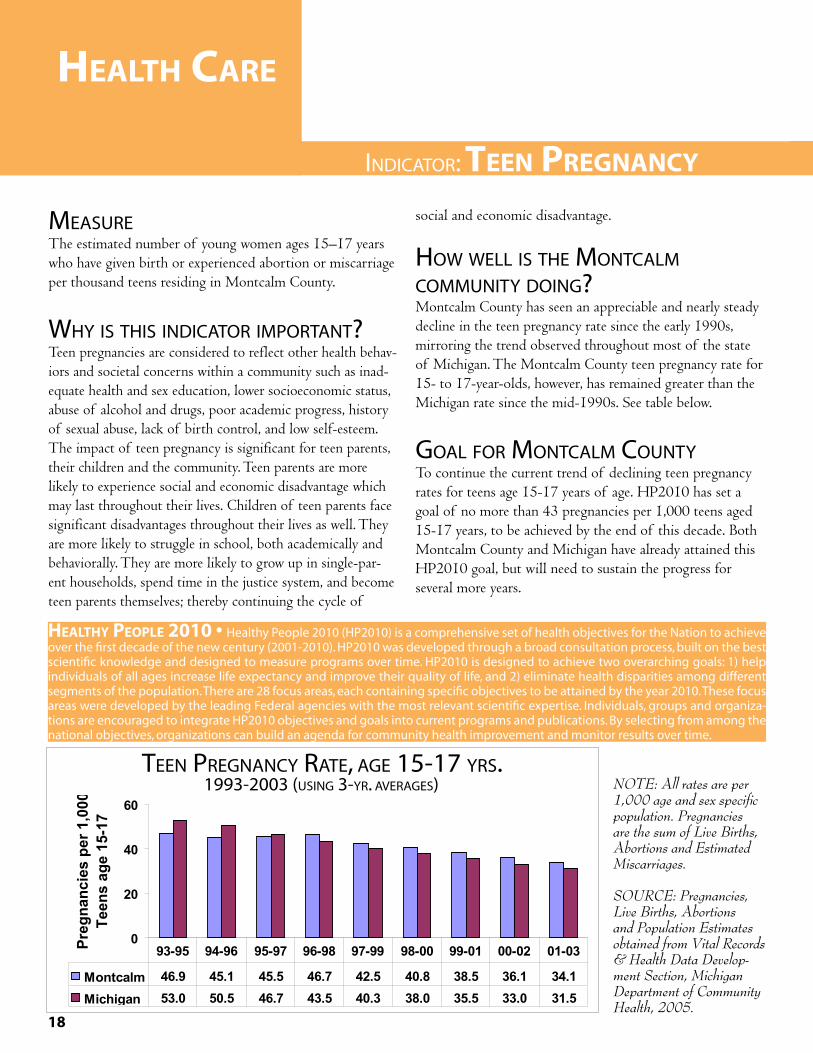
MeasureThe estimated number of young women ages 15–17 years who have given birth or experienced abortion or miscarriage per thousand teens residing in Montcalm County.
Why Is thIs IndIcator IMportant?Teen pregnancies are considered to reflect other health behav-iors and societal concerns within a community such as inad-equate health and sex education, lower socioeconomic status, abuse of alcohol and drugs, poor academic progress, history of sexual abuse, lack of birth control, and low self-esteem. The impact of teen pregnancy is significant for teen parents, their children and the community. Teen parents are more likely to experience social and economic disadvantage which may last throughout their lives. Children of teen parents face significant disadvantages throughout their lives as well. They are more likely to struggle in school, both academically and behaviorally. They are more likely to grow up in single-par-ent households, spend time in the justice system, and become teen parents themselves; thereby continuing the cycle of
social and economic disadvantage.
hoW Well Is the MontcalM
coMMunIty doInG?Montcalm County has seen an appreciable and nearly steady decline in the teen pregnancy rate since the early 1990s, mirroring the trend observed throughout most of the state of Michigan. The Montcalm County teen pregnancy rate for 15- to 17-year-olds, however, has remained greater than the Michigan rate since the mid-1990s. See table below.
Goal for MontcalM countyTo continue the current trend of declining teen pregnancy rates for teens age 15-17 years of age. HP2010 has set a goal of no more than 43 pregnancies per 1,000 teens aged 15-17 years, to be achieved by the end of this decade. Both Montcalm County and Michigan have already attained this HP2010 goal, but will need to sustain the progress for several more years.
healthy people 2010 • Healthy People 2010 (HP2010) is a comprehensive set of health objectives for the Nation to achieve over the first decade of the new century (2001-2010). HP2010 was developed through a broad consultation process, built on the best scientific knowledge and designed to measure programs over time. HP2010 is designed to achieve two overarching goals: 1) help individuals of all ages increase life expectancy and improve their quality of life, and 2) eliminate health disparities among different segments of the population. There are 28 focus areas, each containing specific objectives to be attained by the year 2010. These focus areas were developed by the leading Federal agencies with the most relevant scientific expertise. Individuals, groups and organiza-tions are encouraged to integrate HP2010 objectives and goals into current programs and publications. By selecting from among the national objectives, organizations can build an agenda for community health improvement and monitor results over time.
Teen Pregnancy Rate, Age 15-17 years1993-2003 (using 3 yr. averages)
0
20
40
60
Preg
nanc
ies
per 1
,000
Te
ens
age
15-1
7
Montcalm 46.9 45.1 45.5 46.7 42.5 40.8 38.5 36.1 34.1
Michigan 53.0 50.5 46.7 43.5 40.3 38.0 35.5 33.0 31.5
93-95 94-96 95-97 96-98 97-99 98-00 99-01 00-02 01-03
NOTE: All rates are per 1,000 age and sex specific population. Pregnancies are the sum of Live Births, Abortions and Estimated Miscarriages.
SOURCE: Pregnancies, Live Births, Abortions and Population Estimates obtained from Vital Records & Health Data Develop-ment Section, Michigan Department of Community Health, 2005.
teen preGnancy rate, aGe 15-17 yrs.1993-2003 (usInG 3-yr. averaGes)
18

IndIcator: Infant mortalIty
MeasureThe number of infant deaths per 1,000 live births during the first year of life.
Why Is thIs IndIcator IMportant?Infant mortality is often used as an index of the general health of a community, since many of the risk factors reflect on community issues such as healthcare access, education, and poverty, as well as lifestyle choices and adequacy of prenatal care. The leading causes of neonatal death (within the first 28 days of life) include birth defects, disorders related to short gestation and/or low birth weight, and pregnancy complications. Prematurity and its complications cause about 20% of neonatal deaths, while birth defects are the cause of about 25% of neonatal deaths. Post-neonatal death (after 28th day, but prior to 1 year of age) reflects events experienced in infancy, including SIDS, birth defects, injuries, and homicide. Birth defects account for approxi-mately 17% of post-neonatal deaths; the rest are likely to stem from preventable causes.
hoW Well Is the MontcalM
coMMunIty doInG?After seeing steady improvement in infant mortality since the 1970s, the rate in Michigan has changed little since the mid 1990s, hovering around 8 deaths per 1,000 infants. The mortality rate for black infants continues to be more than twice that of white infants in Michigan. To better ap-proximate Montcalm County’s population characteristics, the mortality rate for white infants has been included. From the figure below, it can be seen that the Montcalm County infant mortality rate has generally been higher than the Michigan rate for white infants, although generally lower than the overall Michigan rate. The number of infant deaths at the county level can vary considerably from year to year (see table), affecting rates.
Goal for MontcalM countyTo reduce infant mortality to no more than 4.5 deaths per 1,000 births, per HP2010, to be achieved by the end of this decade.
health care
Infant Mortality1993-2003 (using 3 yr. averages)
0
2
4
6
8
10
Infa
nt D
eath
s pe
r 1,
000
Birt
hs
Montcalm 7.1 6.4 6.7 7.3 9.2 8.0 6.3 5.2 8.7
Michigan 8.8 8.3 8.1 8.1 8.1 8.1 8.1 8.1 8.2
MI - White 6.5 6.2 6.1 6.1 6.1 6.1 6.0 6.0 6.2
93-95 94-96 95-97 96-98 97-99 98-00 99-01 00-02 01-03
NOTE: 3-year moving averages are used in the chart above to better approximate the trend in mortality at the county level. SOURCE: Michigan Resident Death Files and Michigan Resident Birth Files, 1992-2003; Nov. 2004. Vital Records and Health Data Development Section, Michigan Department of Community Health.
Montcalm Co. 1991 1992 1993 1994 1995 1996 1997 1998 1999 2000 2001 2002 2003Infant Deaths 5 5 6 3 8 4 4 10 9 1 6 6 10
Infant MortalIty1993-2003 (usInG 3-yr. averaGes)
19

health care
IndIcator: preventaBle hospItalIzatIons
MeasureThe proportion (percentage) of total hospitalizations con-sidered to be preventable, had adequate ambulatory care been received to prevent the onset of an illness or condition, control an acute episode of an illness, or manage a chronic disease or condition in persons under 65 years of age.
Why Is thIs IndIcator IMportant?A useful measure of access to health care is the number of cases (involving people aged under 65) for which hospital-ization usually may be avoided if appropriate out-patient or ambulatory care is available or given. High hospital admis-sion rates for conditions that could be treated by other means may be indirect evidence of patients not having access to physicians or deficiencies in outpatient management. By definition, the cost of these hospitalizations are avoidable through prevention. There also is some evidence that regions with a greater number of available hospital beds per 1,000
population have a higher rate of preventable hospitalizations.
hoW Well Is the MontcalM
coMMunIty doInG?For the years 1993 through 2002, there has been no appre-ciable change in preventable hospitalizations for Montcalm County or the state of Michigan. Montcalm County has consistently maintained a higher rate of preventable hospital-izations than the state during this period.
Goal for MontcalM countyTo reduce the percentage of all preventable hospitaliza-tions in Montcalm County below that of the Michigan rate. HP2010 has set preventable hospitalization goals for two conditions among people below age 65 years to be achieved by the end of this decade: pediatric asthma and uncontrolled adult diabetes. The results and goal for these specific condi-tions can be seen in the bottom table on this page.
Preventable Hospitalizations as a Percentage of Total Hospitalizations 1993-2002
0
6
12
18
24
Perc
enta
ge
Montcalm 19.8 20.1 21.1 20.7 20.1 19.8 19.3 20.0 19.9 20.4
Michigan 18.8 18.8 18.8 18.7 18.7 18.8 19.0 18.7 18.9 19.4
1993 1994 1995 1996 1997 1998 1999 2000 2001 2002
*Rate reported as hospital admissions per 10,000 population. SOURCE: Michigan Resident Inpa-tient Files, Div for Vital Records and Health Sta-tistics, Michigan Dept of Community Health, 2005.
NOTE: Hospitaliza-tions are inpatient hospital stays as measured by stays that were completed during the specified year. The number of hospitaliza-tions is often greater than the number of persons hospitalized since some persons are hospitalized more than once during a year. SOURCE: Michigan Resident Inpatient Files, Div. for Vital Records and Health Statistics, Michi-gan Dept. of Community Health.
preventable hospItalIzatIons as a percentaGe oftotal hospItalIzatIons 1993-2002
20
Perc
enta
ge o
fTo
tal H
ospi
taliz
atio
ns
Preventable Hospitalization Rates* by Age Group - Montcalm County 1998-2002
1998 1999 2000 2001 2002 HP 2010 Goal
Asthma 12.1 16.9 16.9 17.7 16.6 17.3 (under age 18 yrs.)
Diabetes 6.7 5.9 12.6 7.9 11.2 5.4(age 18 to 64 yrs.)

IndIcator: chIld ImmunIzatIon rate
MeasurePercentage of Montcalm County children age 19 to 35 months known to have complete vaccination series and registered in *MCIR (total vaccines include 4 DTP, 3 Polio, 1 MMR, 3 HiB, 3 HepB, and 1 Varicella vaccine dose [4.3.1.3.3.1]).
Why Is thIs IndIcator IMportant?Getting children immunized is an easy and proven way to prevent serious and potentially deadly illnesses such as Hepa-titis B, influenza, measles and meningitis. Immunizations are one of the most basic and important safeguards against illness for both the individual and community. Healthy People 2010 has made immunizations one of the 10 leading health indicators. The Michigan Department of Community Health identifies three major barriers to childhood immuni-zation: low public awareness of the importance of vaccina-tion, inadequate access to immunization services, and missed opportunities to administer vaccines.
hoW Well Is the MontcalM
coMMunIty doInG?In 1994, the Centers for Disease Control and Prevention
ranked Michigan last in the nation regarding vaccination coverage among children. Considerable progress has been made in the state over the last ten years, including the devel-opment of the Michigan Childhood Immunization Regis-try (MCIR). Renewed focus and energy on tracking child immunizations electronically has led to substantial improve-ment throughout the state. As the chart below indicates, Montcalm County has increased the proportion of children age 19-35 months registered in the MCIR with complete vaccination coverage from 40% in January 2002 to 70% in January 2005. The county has consistently maintained a higher percentage of vaccinated children registered in MCIR than the state during this period.
Goal for MontcalM countyTo follow the HP2010 vaccination coverage goals for chil-dren aged 19-35 months, to be achieved by the end of this decade. These include 90% coverage for each of the vaccines in the 4.3.1.3.3.1 series. These rates have been determined for states in the past using the National Immunization Survey. County-level and state results for this report are based on the Michigan Childhood Immunization Registry (MCIR).
health care
Immunization Rate, Age 19 - 35 Months, (4.3.1.3.3.1) January 2002 - January 2005
0
20
40
60
80
100
Perc
ent I
mm
uniz
ed
Montcalm 40 48 51 58 59 65 70
Michigan 34 40 44 47 49 54 58
Jan-02 Jul-02 Jan-03 Jul-03 Jan-04 Jul-04 Jan-05
NOTE: Data for the 4.3.1.3.3.1 vaccination se-ries began being tracked elec-tronically in 2002 when the Varicella vaccine became a mandatory component of the MCIR database. SOURCE: Michigan Childhood Immu-nization Registry, 2005.
Vaccines of 4.3.1.3.3.1 series: - 4 doses DTP - 3 doses polio - 1 dose MMR - 3 doses H. influenza type B - 3 doses hepatitis B - 1 dose varicella
*MICHIGAN CHILDHOOD IMMUNIZATION REGISTRY (MCIR)MCIR is an electronic statewide child immunization registry initially funded in 1997 through the State of Michigan, CDC and Robert Wood Johnson Foundation. It is operated by the Michigan Dept. of Community Health and maintains an immunization history on children between birth and 20 years of age. All health care providers in Michigan providing immuniza-tion services to a child are required to report each immunization to the registry. Additional information about MCIR may be found on the MDCH website at www.michigan.gov/mdch.
IMMunIzatIon rate, aGe 19-35 Mos. (4.3.1.3.3.1)January 2002-January 2005
21

health care
IndIcator: adequacy of prenatal care
MeasureKotelchuck’s Adequacy of Prenatal Care Utilization Index (APCUI) measures two dimensions of care: adequacy of a timely start of prenatal care and adequacy of the use of prenatal services once care has begun (by comparing actual use to the recommended number of visits based on month of initiation of care and length of pregnancy). These dimensions are combined to classify each woman’s prenatal care history as inadequate, intermediate, adequate, or adequate-plus.
Why Is thIs IndIcator IMportant?Assessing health status during pregnancy and continuous monitoring identifies risks and potential issues that con-tribute to poor pregnancy and birth outcomes. The prenatal assessment needs to occur at the beginning of the pregnan-cy, which is why initiating prenatal care early is promoted. Prenatal care should begin by the end of the first trimester (three months) of pregnancy. A second standard in prenatal care is the adequacy of the care, as defined by the American College of Obstetrics and Gynecology, as at least 13 prena-tal visits for a full-term pregnancy. The small percentage of women who present with risks that contribute to mortality and morbidity need to be identified through risk assessment during prenatal care. Known risk factors are mother’s age,
race and ethnicity, intendedness of pregnancy, lack of a pre-natal care payment source, and pre-existing and potentially developing adverse health and emotional conditions.
hoW Well Is the MontcalM
coMMunIty doInG?Michigan has not seen a significant increase in adequacy of prenatal care during the last 20 years (Healthy Michigan 2010). The level of prenatal care reported for Michigan in 2003 (using Kessner Index) was 78.4% adequate care, 13.8% intermediate care, and 7.4% inadequate prenatal care. The cor-responding rates for Montcalm County were 79.1%, 13.6% and 6.9%. Michigan has maintained a rate of approximately 80% of pregnancies initiating prenatal care in the first tri-mester since the early 1970s. Montcalm County results have mirrored the state’s from 1993 to 2002, increasing by about 2 percentage points during this period.
Goal for MontcalM countyTo continue to increase the proportion of pregnant women receiving early and adequate prenatal care. HP2010 has set a goal of 90% of live births having early and adequate prena-tal care, to be achieved by the end of this decade.
NOTE: Results based on the Kotelchuck Adequacy of Prenatal Care Utilization Index.SOURCE: Michigan Maternal and Child Health County Profiles 1993 to 2002, May 2004.
Proportion of Births with Adequate Prenatal Care1993-2002 (using 3 yr. averages)
0
20
40
60
80
100
Perc
ent o
f Liv
e B
irths
Montcalm 71.5 71.2 72.4 73.7 75.4 74.5 74.4 75.1
Michigan 74.2 74.5 75.1 75.1 74.9 74.3 75.3 76.3
93-95 94-96 95-97 96-98 97-99 98-00 99-01 00-02
Kotelchuck’s Adequacy of Prenatal Care Utilization Index (APCUI)Kotelchuck’s index uses two elements obtained from birth certificate data to determine adequacy of prenatal care: month of gestation that prenatal care is initiated and number of prenatal visits up to the time of delivery. These ele-ments are then compared to expected results and adjusted to the gestational age at the time of delivery. Adequate care includes pre-natal care beginning within first 3 months of gestation and attending 80% or more of expected prenatal visits.
proportIon of bIrths WIth adequate prenatal care1993-2002 (usInG 3-yr. averaGes)
22

IndIcator: loW-WeIght BIrths
MeasureThe proportion (percentage) of live births in which infant weighs less than 2,500 grams or 5 lbs. 8 oz. (low birth weight, LBW) or less than 1,500 grams or 3 lbs. 5 oz. (very low birth weight, VLBW).
Why Is thIs IndIcator IMportant?Birth weight is the best population-based predictor of infant mortality and childhood morbidity (Healthy Michigan 2010). Low birth weight can be a result of poor fetal growth dur-ing pregnancy or a pregnancy lasting less than 37 completed weeks. Despite medical and technological advances, LBW babies continue to be a public health problem at tremendous individual and societal cost. More than 90% of all neonatal deaths are to infants who weigh less than 2,500 grams at birth. About 40% of all VLBW infants that survive experience long-term health problems. The most important factors associated with low weight are race, maternal age, delivery history, marital status, socioeconomic factors, level of prenatal care, smoking and drinking alcohol. Multiple births are also more likely to produce low-birth-weight infants, and newer fertility procedures are
producing more frequent multiple-birth pregnancies.
hoW Well Is the MontcalMcoMMunIty doInG?Reducing the prevalence of LBW has been difficult in Mich-igan and the nation. The prevalence generally declined until 1985 (a low of 6.8%), but has been on the increase since 1989. Low birth weight rates have continued to increase over the last decade (see figure below). As this figure shows, the percent of live births reported as LBW in Michigan has surpassed 8.0%, while in Montcalm County the rate has surpassed 7.0%. The VLBW rates have experienced a similar relative increase over this period, although the magnitude is much smaller — currently about 1.7% of all live births in Michigan and 1.1% of all live births in Montcalm County.
Goal for MontcalM countyTo decrease the proportion of women who deliver a low-birth-weight baby. HP2010 has set two goals for reducing the prevalence of low birth weight: reduce LBW to 5% and VLBW to 0.9% of live births, to be achieved by the end of this decade.
health care
NOTE: Low birth weight (LBW) is less than 2,500 grams; very low birth weight (VLBW) less than 1,500 grams. Percentage is based on all live births for given period of time. SOURCE: Michigan Resident Birth Files, Vital Records & Health Data Develop-ment Section, Michigan Department of Community Health, 2005.
Percent Low Birthweight and Very Low Birthweight1993-2003 (using 3 yr. averages)
0
3
6
9
Perc
ent o
f Birt
hs
Montcalm (LBW) 5.8 5.6 5.7 6.0 6.6 7.3 7.1 7.4 7.0
Michigan (LBW) 7.7 7.7 7.7 7.7 7.9 7.9 8.0 8.0 8.1
Montcalm (VLBW) 0.9 1.1 1.2 1.1 1.2 1.3 1.2 1.3 1.1
Michigan (VLBW) 1.5 1.5 1.5 1.6 1.6 1.6 1.6 1.6 1.7
93-95 94-96 95-97 96-98 97-99 98-00 99-01 00-02 01-03
percent loW bIrth WeIGht and very loW bIrth WeIGht1993-2003 (usInG 3-yr. averaGes)
23

health care
IndIcator: chIldren’s oral health
MeasureThe proportion of second-grade students (age 6-8 yrs.) with a history of dental caries (cavities), untreated decay of primary or permanent teeth, and sealant placed on the first permanent molars.
Why Is thIs IndIcator IMportant?Oral health is an integral component of overall health. Poor oral health and untreated oral disease can have a significant impact on quality of life. Millions of people in the United States experience dental caries (cavities) and periodontal disease, resulting in needless pain and suffering; difficulty in speaking and chewing; increased costs of care; loss of self-esteem; and decreased economic productivity through lost work and school days. Dental caries is the most common chronic disease of childhood, occurring five to eight times as frequently as asthma, the second most common chronic disease of children. Despite the reduction in rate of caries in recent years, more than half of all children have dental decay by the second grade. Dental caries remains a significant problem in some populations, particularly certain racial and ethnic groups and poor children. National data indicate that 80 percent of dental caries in the permanent teeth found
in children is concentrated in 25 percent of the child and adolescent populations.
hoW Well Is the MontcalM
coMMunIty doInG?During the school years 2000-01 and 2001-02, 907 second-grade students attending Montcalm Area public elementary schools participated in a dental screening project to determine the prevalence of dental caries. The table below summarizes the results of this screening project. Approximately 31% of the children screened were identified as having untreated caries, while nearly 9% of the students screened appeared to have an oral condition (pain, infection, ulceration) in need of urgent dental care. There is no currently available prevalence rate for caries experience or untreated caries in this age group for the state of Michigan.
Goal for MontcalM countyTo reduce the proportion of children 6-8 years of age with caries experience to 42%, and untreated dental decay to 21%, while improving sealant rates to 50%, to be achieved by the end of this decade; per the HP2010 goals.
*Urgent care represents the recommendation for dental care as soon as possible (days). Signs or symptoms present may include pain, infection or soft tissue ulceration. **Non-urgent care represents the recommendation for dental care within several weeks. Signs or symptoms present include cavities without associated pain, or suspicious soft-tissue areas. SOURCE: Local data collected by Mid-Michigan District Health Department, 2000-2002.
-Total Students Available 969 917 - -
-Number Children Screened 390 (40%) 517 (56%) - -
-History of Having Cavity(ies) 245 (63%) 349 (68%) Total 52%-White 49% 42%
-Current Untreated Cavity(ies) 117 (30%) 158 (31%) Total 29%-White 22% 21%
-Molar Sealant Present 66 (17%) 78 (15%) Total 23%-White 29% 50%
-Urgent Care Recommended* 35 (9%) 41 (8%) - -
-Non-Urgent Care Recomm.* 78 (20%) 117 (23%) - -
-No Medical Insurance 45/390 (12%) 52/517 (10%) - -
-No Dental Insurance 89/390 (23%) 103/517 (20%) - -
-Dental Visit Previous Year 282/390 (72%) 436/517 (84%) 3rd graders - 82% 83%
Montcalm Area2nd Graders 2000-01
Montcalm Area2nd Graders 2001-02
Healthy People2010 (6-8 yrs.)
- Baseline -
Healthy People2010 (6-8 yrs.)
- Goal -
24

IndIcator: unIntentIonal InJury fatalItIes
MeasureThe number of unintentional injury deaths per 100,000 population.
Why Is thIs IndIcator IMportant?Injuries are one of the most under-recognized public health problems facing society today (Healthy Michigan 2010). “Unintentional injuries” are injuries that have historically been referred to as accidents and include injuries due to motor vehicle accidents, fires, falls, drowning, poisoning, suffocation, and others. The word “accident” implies that the event could not have been prevented; however, public health professionals use the term “unintentional injuries” knowing that prevention plays a key role in reducing deaths contributed to these causes. Injury deaths, motor vehicle injury deaths, fall injury deaths, and poisoning deaths have been identified as priority causes of injury in the Michigan Injury Prevention Plan.
hoW Well Is the MontcalMcoMMunIty doInG?In 2001, injuries were the fifth leading cause of death for all age groups combined, and the leading cause of death for people ages 1-34 years in Michigan. As can be seen in the figure below, no sustainable county trend was observed for the years 1993 through 2003, although the Montcalm County rate has continuously surpassed the overall Michigan rate during the years indicated. As can be seen in the table of specific causes of injury, motor vehicle fatalities account for more than half of all unintentional injury deaths in the county and are a proportionately greater contributor to total injury deaths than they are for the state (58.1% vs. 44.9% for combined years 1996-2003).
Goal for MontcalM countyTo reduce deaths caused by unintentional injury from a baseline of 35.0 per 100,000 population in 1998 to 17.5 per 100,000 by the year 2010, per the HP2010 goals.
health care
NOTE: “other” causes includes unintentional death from firearms, machinery, suffocation, aircraft-related, overexer-tion, cut/piercing, etc. SOURCE: Vital Records and Health Data Section, Table 31D, Michigan De-partment of Community Health, 2004.
Unintentional Injury Death Rate1993-2002 (using 3-yr averages)
0
10
20
30
40
50
60
Dea
ths
per 1
00,0
00
Montcalm Co. 53.5 55.2 49.2 44.9 49.5 54.7 60.2 54.4 53.4
Michigan 31.8 32.4 32.7 32.2 32.2 32.4 32.6 32.6 32.4
93-95 94-96 95-97 96-98 97-99 98-00 99-01 00-02 01-03
*MC% is Montcalm Co. avg. percent of total injury deaths for combined years 1996-03. ^MI% is avg. % of total injury deaths for MI for years 1996-03.
Unintentional Injury Deaths by Cause, 1996-2003, Montcalm County
TOTAL INJURY DEATHS
-motor vehicle
-poisoning
-falls
-fire
-drowning
-other
1996
28
12
1
4
0
2
9
1997
26
19
0
2
2
0
3
1998
26
18
3
0
0
1
4
1999
37
21
2
1
6
0
7
2000
36
24
6
1
0
0
5
2001
37
19
2
4
1
2
9
2002
27
14
3
3
0
0
7
2003
35
19
2
9
1
0
4
*MC %
58.1
7.6
9.5
4.1
1.9
19.0
^MI %
0
44.9
9.4
15.3
4.4
3.4
22.4
unIntentIonal InJury death rate1993-2002 (usInG 3-yr. averaGes)
25

contrIButors
montcalm Human ServIceS coalItIon (mHSc)communIty development coordInator– Lisa Lund
mHSc educatIon commIttee cHaIr– Kathy Betts
mHSc economIc development commIttee
cHaIr—Franz Mogdis
mHSc HealtH care commIttee cHaIr– Kim Singh
mHSc communIty Safety commIttee cHaIr– Bill Barnwell
SpecIal tHankS: to Rex Hoyt of the Mid-Michigan District Health Department for his data analysis expertise and contri-bution to this report. tHIS publIcatIon waS prInted In montcalm county, mIcHIgan, at: Greenville Printing.note: All photographs used in this report were taken in Montcalm County, Michigan.
tHe prIntIng of tHIS report waS made poSSIble by tHe followIng SponSorS:Montcalm County Board of CommissionersEightCAP, Inc. Ionia Montcalm Department of Human Services Mid-Michigan District Health Department Montcalm Area Intermediate School District Montcalm Community College The Montcalm Center for Behavioral Health Catholic Social Services Michigan State University Montcalm Extension Central Area Michigan Works! Consortium Montcalm County Commission on Aging Relief After Violent Encounter Montcalm AllianceLife Guidance Wellness and Prevention ServicesUnited Lifestyles
26

memBershIp
George P. StamasMHSC ChairpersonSuperintendentMontcalm Area Intermediate School District
Phil LarsonMHSC Vice ChairpersonDirectorIonia Montcalm Department of Human Services
Alison BarberiPresident/CEOGreenville Area Community Foundation Bill BarnwellSheriffMontcalm County Sheriff’s Office
Vera BeechExecutive DirectorRelief Against Violent Encounter (RAVE) of Ionia/Montcalm
John BerchtoldAdministrator/ControllerMontcalm County
Dr. Dorothy BergDirectorNorth Kent Guidance Services Kathy Betts,Director of Community Education,Montcalm Adult and Community Education Janet BloomfieldVice President of Employment and Training Central Area Michigan Works! Consortium Robert BrownExecutive DirectorThe Montcalm Center for Behavioral Health Eron DrakeDean of Community Services and Continuing EducationMontcalm Community College
Jodie FaberExecutive DirectorUnited Lifestyles
Pete HainesAssistant SuperintendentGreenville Public Schools Denise HubbardExecutive DirectorUnited Way of Montcalm County Lauri ImplomSupport Services CoordinatorMontcalm County Commission on Aging John JohansenCommissionerMontcalm County Board of Commissioners
Andrea KrauseProsecuting AttorneyMontcalm County Prosecutor’s Office
John KroneckMontcalm County Substance Abuse Wellness andPrevention CoordinatorLife Guidance Services
Don LehmanDirectorMichigan State University Montcalm Extension
Richard LiberatoreDirectorCatholic Social Services
Franz MogdisExecutive DirectorMontcalm Alliance
James KissingerDirector of Northern ServicesGoodwill Industries
Ken KraftPastorFirst Baptist Church of Stanton
Kimberly SinghHealth OfficerMid-Michigan District Health Department
John Van NieuwenhuyzenPresidentEightCAP, Inc.
27

Montcalm Human Services Coalition621 New St.P.O. Box 367
Stanton, MI 48888(989) 831-5261
Read updated versions of this report online atwww.montcalm.org/reportcard.asp
Community Safety • Education Health Care • Economic Development