Embed Size (px)
Citation preview
The ageing HIV population in
Scotland:adults and children
Lesley A WallaceHealth Protection Scotland
SHIVAG, Dunfermline, 26th June 2015

HIV infection in Scotland
• Outline: Adults• HIV landscape • HIV diagnoses• Treatment & Care• Late diagnoses
• Combined with age information
• Data on paediatric infection

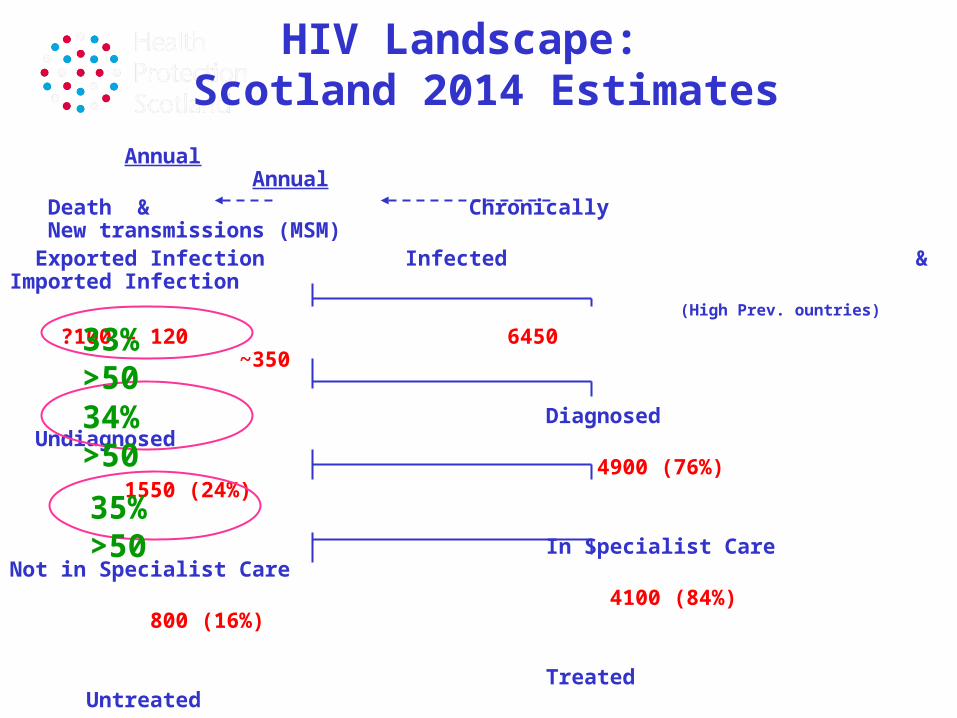
HIV Landscape: Scotland 2014 Estimates
Annual Annual Death & Chronically New transmissions (MSM) Exported Infection Infected & Imported Infection
(High Prev. ountries)
?100 – 120 6450 ~350
Diagnosed Undiagnosed 4900 (76%) 1550 (24%)
In Specialist Care Not in Specialist Care 4100 (84%) 800 (16%) Treated Untreated 3650 (89%) 450 (11%)
Optimal Response* Suboptimal Response 3500 (96%) 150 (4%)
*Cases recording HIV viral load of 400 copies/ml or less at latest attendance
34% >50
33% >50
35% >50

HIV infected persons by transmission category and year of
report, Scotland, 1981-2014
Data source: HIV diagnoses database, Health Protection Scotland
0
50
100
150
200
250
300
350
400
450
500
Nu
mb
er
Year
MSM
Heterosexual
PWID
Other/not known
Total
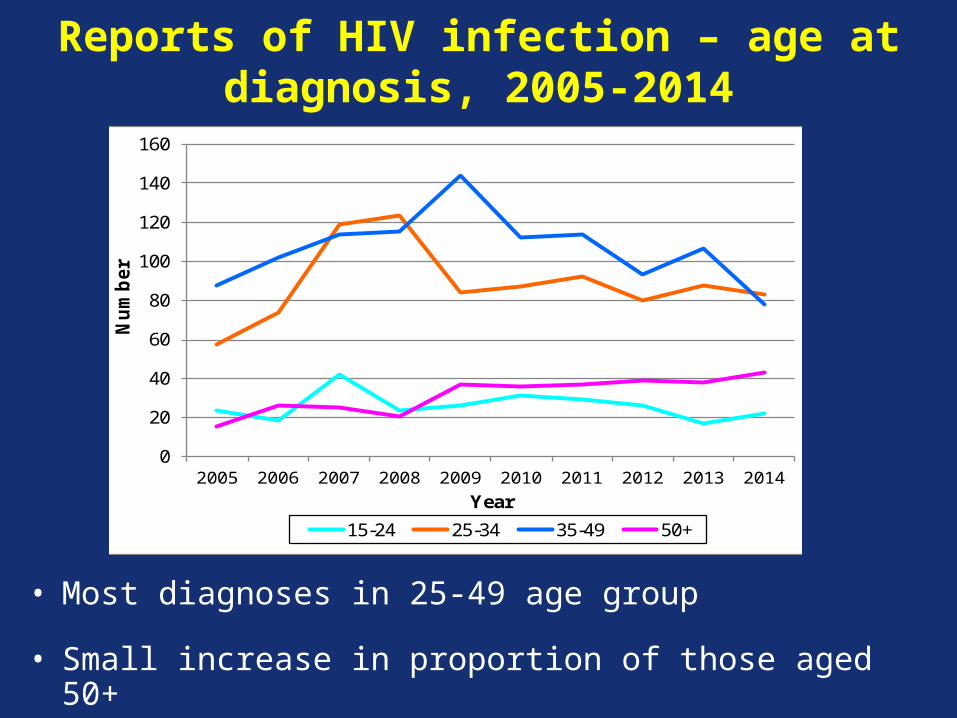
Reports of HIV infection – age at diagnosis, 2005-2014
• Most diagnoses in 25-49 age group
• Small increase in proportion of those aged 50+
0
20
40
60
80
100
120
140
160
2005 2006 2007 2008 2009 2010 2011 2012 2013 2014
Nu
mb
er
Year
15-24 25-34 35-49 50+
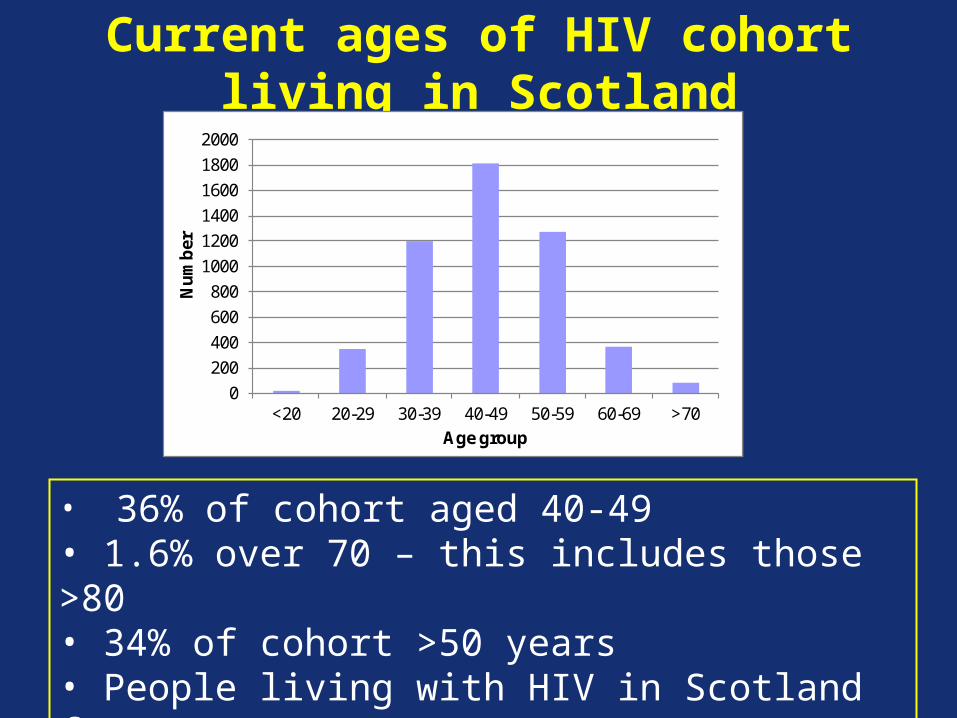
Current ages of HIV cohort living in Scotland
0
200
400
600
800
1000
1200
1400
1600
1800
2000
<20 20-29 30-39 40-49 50-59 60-69 >70
Nu
mb
er
Age group
• 36% of cohort aged 40-49• 1.6% over 70 – this includes those >80• 34% of cohort >50 years• People living with HIV in Scotland for >30 years
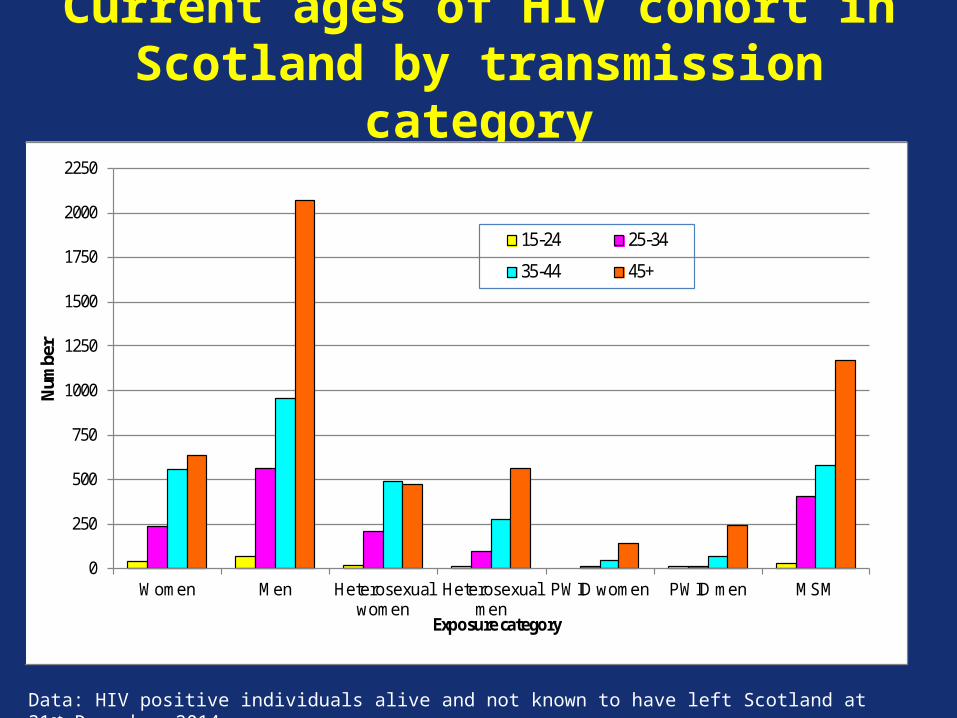
Current ages of HIV cohort in Scotland by transmission category
Data: HIV positive individuals alive and not known to have left Scotland at 31st December 2014
0
250
500
750
1000
1250
1500
1750
2000
2250
Women Men Heterosexual women
Heterosexual men
PWID women PWID men MSM
Num
ber
Exposure category
15-24 25-34
35-44 45+

Reports of heterosexually acquired HIV infection, Scotland, 2000-2014
0
20
40
60
80
100
120
140
160
180
2000 2001 2002 2003 2004 2005 2006 2007 2008 2009 2010 2011 2012 2013 2014
Nu
mb
er
Year
Non-UK nationals infected outwith the UK Non-UK nationals infected within the UK
UK Nationals infected within the UK UK Nationals infected outwith the UK
50% attending services are >45years, of this group:• 58% infected UK & 42% sub-Saharan Africa• 59% White UK/Ireland ethnicity & 32% Black African• 54% men
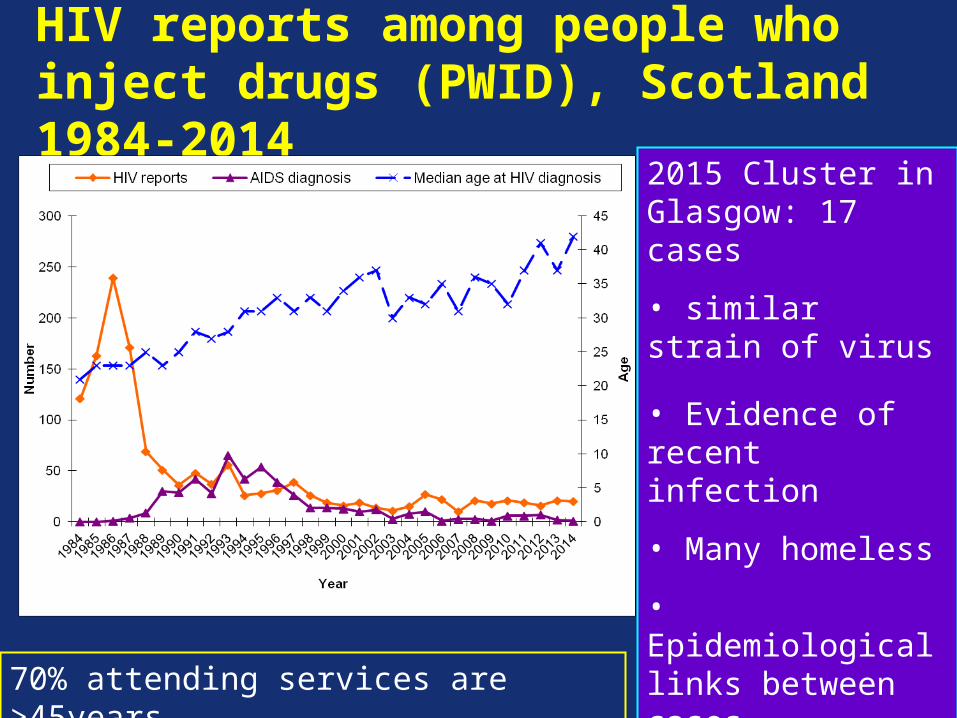
HIV reports among people who inject drugs (PWID), Scotland 1984-2014
2015 Cluster in Glasgow: 17 cases
• similar strain of virus
• Evidence of recent infection
• Many homeless
• Epidemiological links between cases
• Public health action
70% attending services are >45years
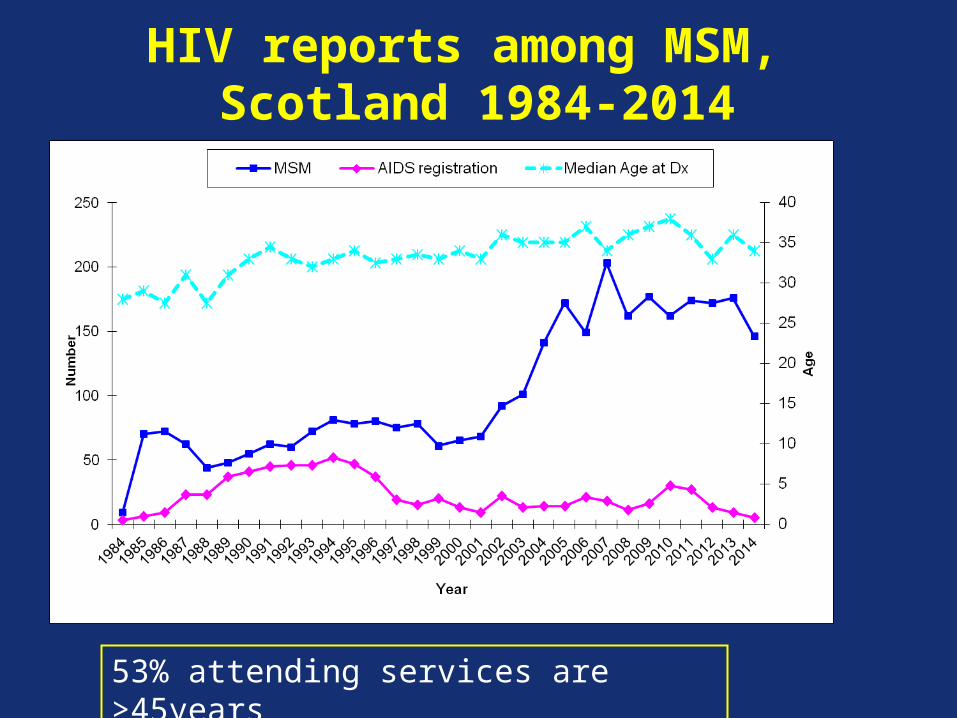
HIV reports among MSM, Scotland 1984-2014
53% attending services are >45years
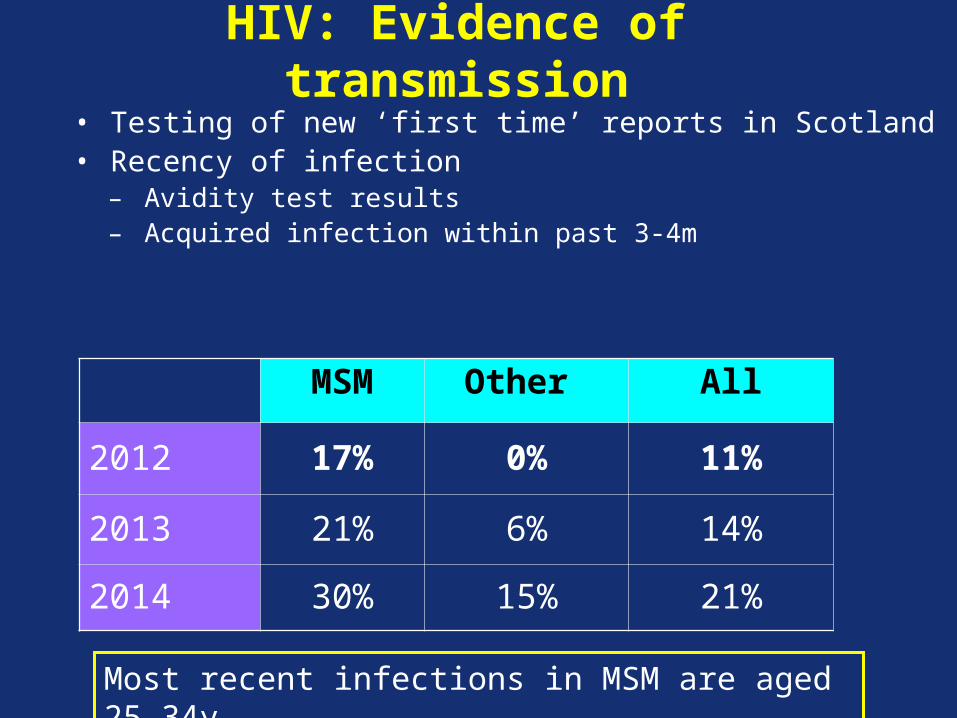
HIV: Evidence of transmission• Testing of new ‘first time’ reports in Scotland• Recency of infection
– Avidity test results– Acquired infection within past 3-4m
MSM Other All
2012 17% 0% 11%
2013 21% 6% 14%
2014 30% 15% 21%
Most recent infections in MSM are aged 25-34y
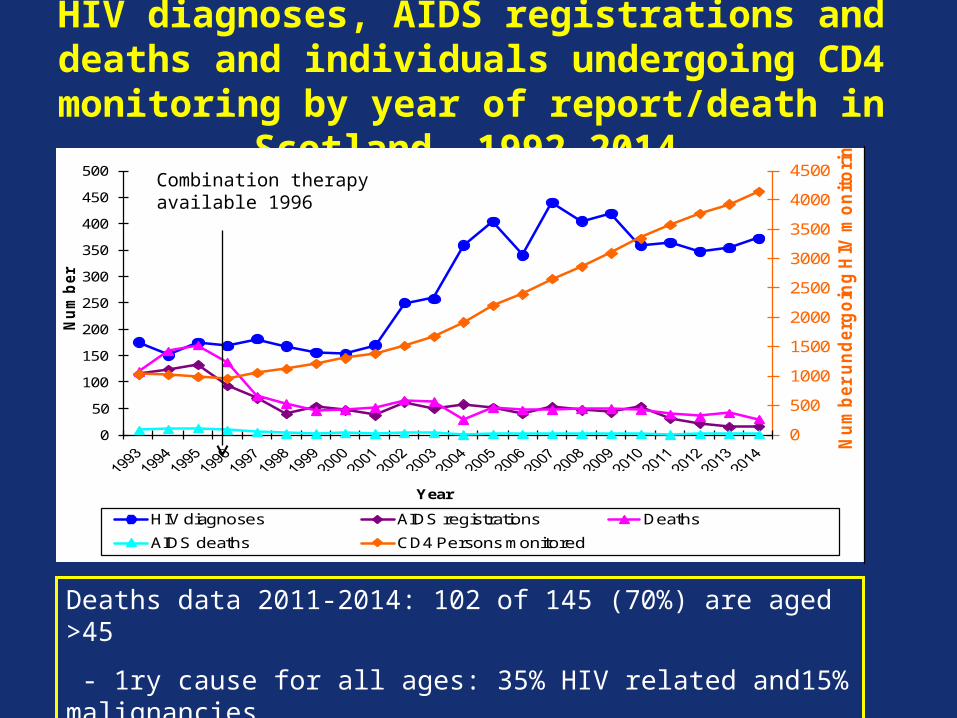
HIV diagnoses, AIDS registrations and deaths and individuals undergoing CD4 monitoring by year of report/death in
Scotland, 1992-2014
Deaths data 2011-2014: 102 of 145 (70%) are aged >45
- 1ry cause for all ages: 35% HIV related and15% malignancies
- 32% with AIDS registration at some time
0
500
1000
1500
2000
2500
3000
3500
4000
4500
0
50
100
150
200
250
300
350
400
450
500
Nu
mb
er
un
derg
oin
g H
IV m
on
ito
rin
g
Nu
mb
er
Year
HIV diagnoses AIDS registrations Deaths
AIDS deaths CD4 Persons monitored
Combination therapy available 1996
HIV Landscape: Scotland 2014 Estimates
Annual Annual Death & Chronically New transmissions (MSM) Exported Infection Infected & Imported Infection
(High Prev. ountries)
?100 – 120 6450 ~350
Diagnosed Undiagnosed 4900 (76%) 1550 (24%)
In Specialist Care Not in Specialist Care 4100 (84%) 800 (16%) Treated Untreated 3650 (89%) 450 (11%)
Optimal Response* Suboptimal Response 3500 (96%) 150 (4%)
*Cases recording a “managable” HIV viral load of 400 copies/ml or less at latest attendance
34% >50
33% >50
35% >50
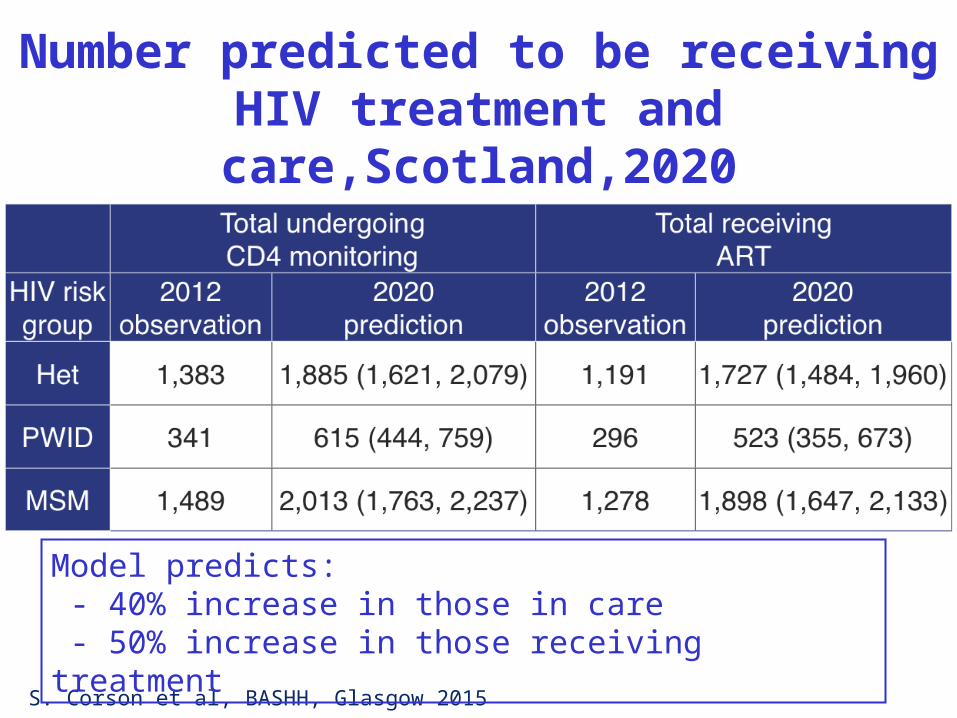
Number predicted to be receiving HIV treatment and care,Scotland,2020
S. Corson et al, BASHH, Glasgow 2015
Model predicts: - 40% increase in those in care - 50% increase in those receiving treatment
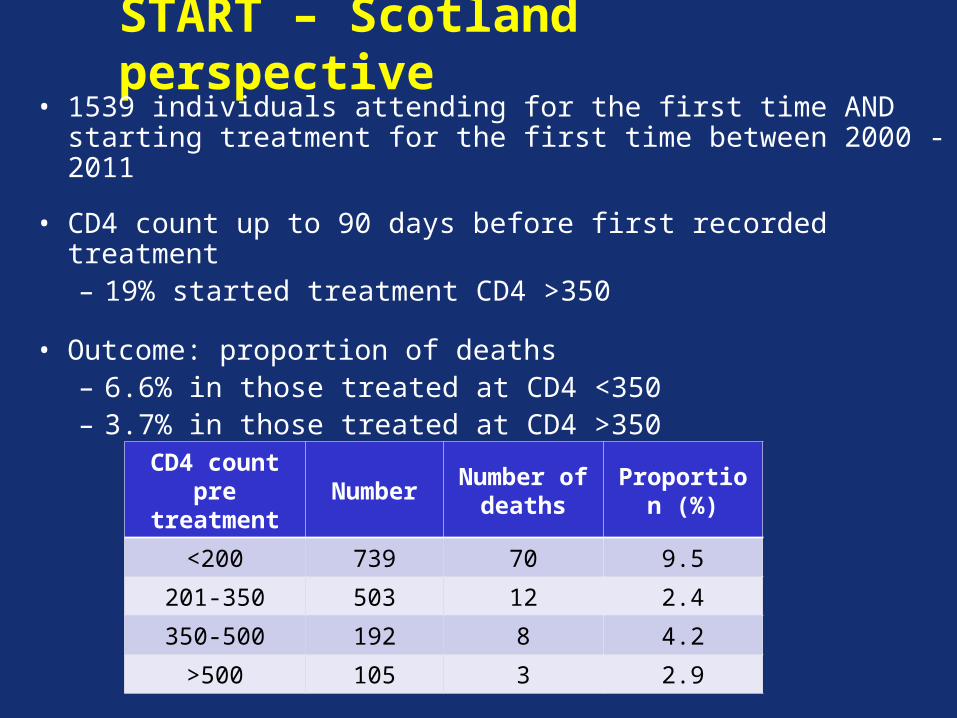
START – Scotland perspective
• 1539 individuals attending for the first time AND starting treatment for the first time between 2000 -2011
• CD4 count up to 90 days before first recorded treatment– 19% started treatment CD4 >350
• Outcome: proportion of deaths– 6.6% in those treated at CD4 <350– 3.7% in those treated at CD4 >350
CD4 count pre
treatmentNumber
Number of deaths
Proportion (%)
<200 739 70 9.5
201-350 503 12 2.4
350-500 192 8 4.2
>500 105 3 2.9
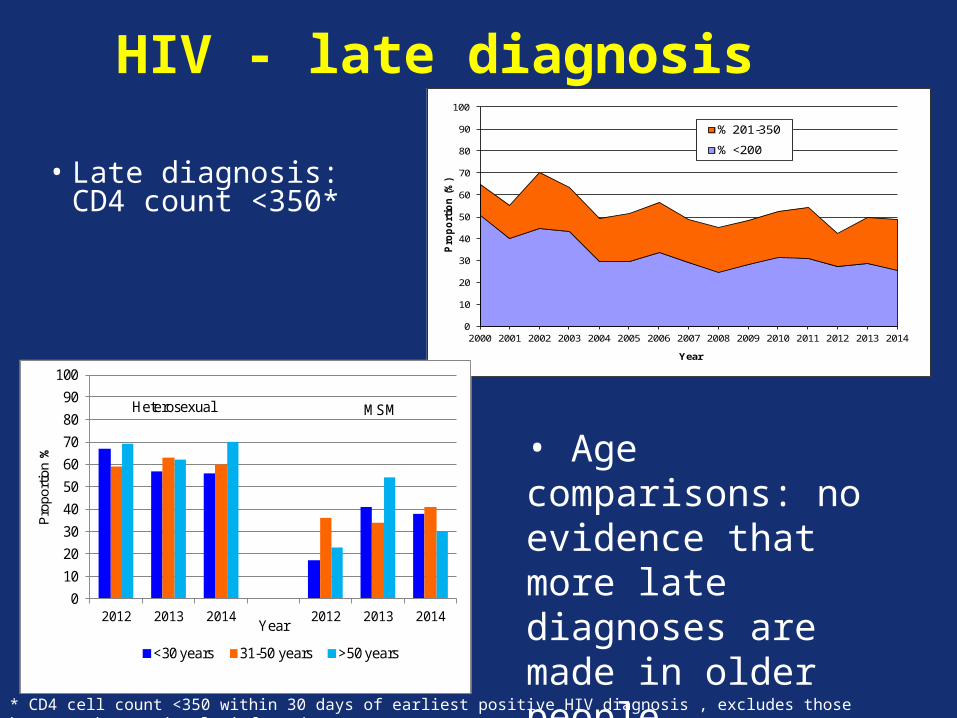
HIV - late diagnosis
• Late diagnosis: CD4 count <350*
* CD4 cell count <350 within 30 days of earliest positive HIV diagnosis , excludes those known to be previously infected
0
10
20
30
40
50
60
70
80
90
100
2000 2001 2002 2003 2004 2005 2006 2007 2008 2009 2010 2011 2012 2013 2014
Pro
po
rtio
n (
%)
Year
% 201-350
% <200
0
10
20
30
40
50
60
70
80
90
100
2012 2013 2014 2012 2013 2014
Pro
port
ion
%
Year
<30 years 31-50 years >50 years
Heterosexual MSM
• Age comparisons: no evidence that more late diagnoses are made in older people
HIV infection among children in Scotland
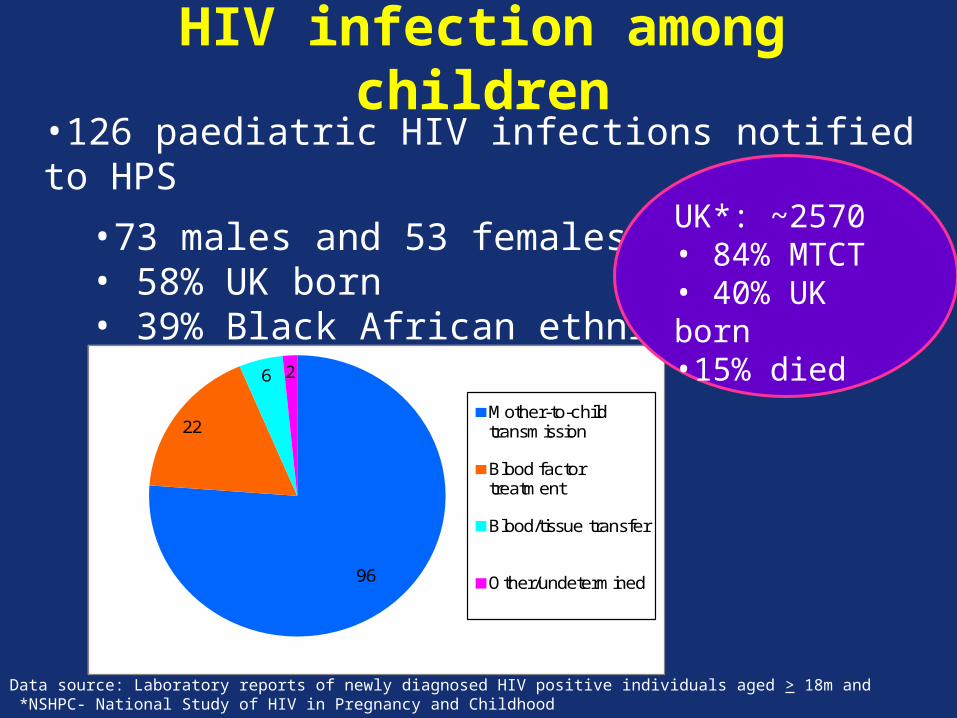
HIV infection among children•126 paediatric HIV infections notified to HPS
•73 males and 53 females • 58% UK born • 39% Black African ethnicity• Transmission routes:
96
22
6 2
Mother-to-child transmission
Blood factor treatment
Blood/tissue transfer
Other/undetermined
Data source: Laboratory reports of newly diagnosed HIV positive individuals aged > 18m and *NSHPC- National Study of HIV in Pregnancy and Childhood
UK*: ~2570• 84% MTCT• 40% UK born•15% died
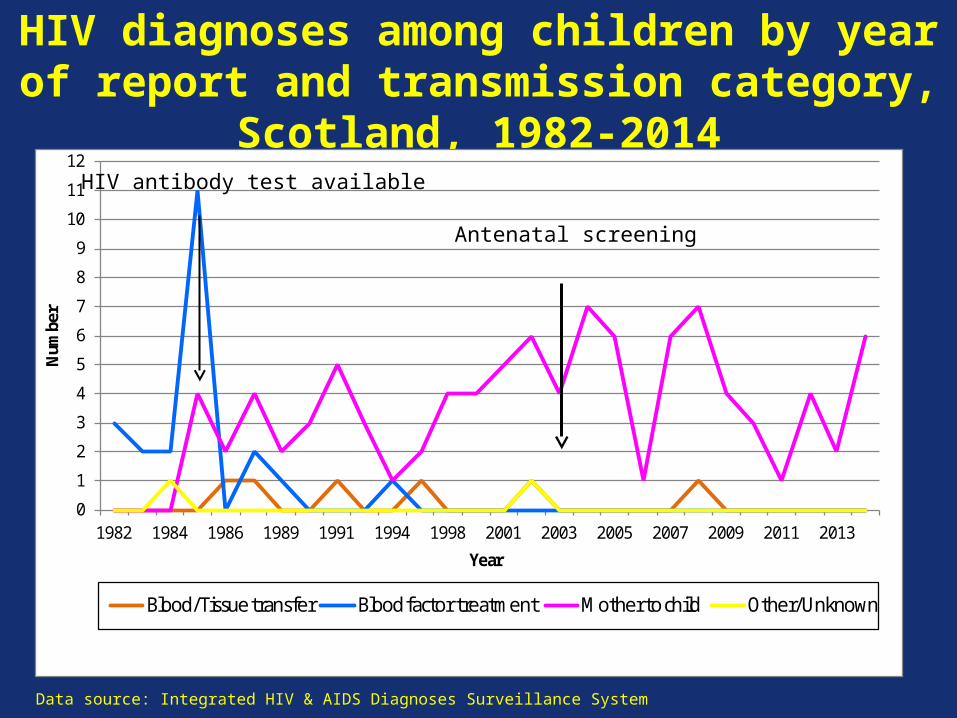
HIV diagnoses among children by year of report and transmission category,
Scotland, 1982-2014
Data source: Integrated HIV & AIDS Diagnoses Surveillance System
0
1
2
3
4
5
6
7
8
9
10
11
12
1982 1984 1986 1989 1991 1994 1998 2001 2003 2005 2007 2009 2011 2013
Num
ber
Year
Blood/Tissue transfer Blood factor treatment Mother to child Other/Unknown
HIV antibody test available
Antenatal screening

HIV diagnoses among children by ethnicity and year of
report,Scotland, 1982-2014
Data source: Integrated HIV & AIDS Diagnoses Surveillance System
0
2
4
6
8
10
12
14
16
1982 1984 1986 1988 1990 1992 1994 1996 1998 2000 2002 2004 2006 2008 2010 2012 2014
Num
ber
Year
Black-African Mixed White-Scottish
White-Other White-Other British Other/Unk
Antenatal screening

Outcomes among paediatric HIV diagnoses
• Of 126 paediatric diagnoses:
• 29 (23%) have died
• median survival 5years (range 0-20years)
• 21 (72%) of these registered as having AIDS
• Of 97 HIV infected children alive at end 2014• 43 attending for treatment and care• 30 are <15 years• 18 lost to follow up• 6 left ScotlandData source: Integrated HIV & AIDS Diagnoses Surveillance System
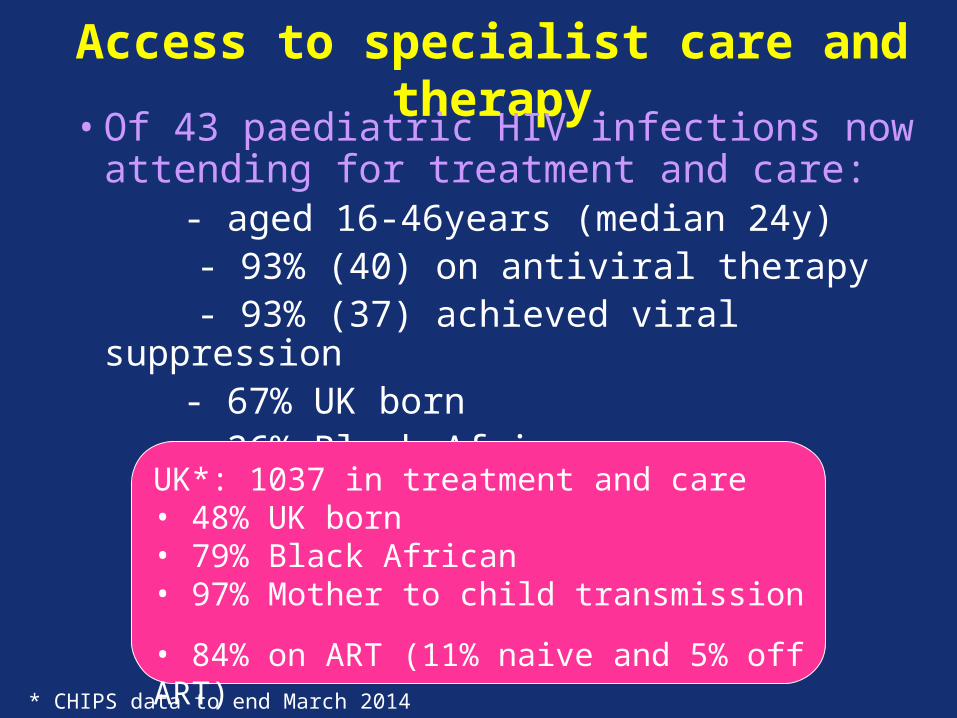
Access to specialist care and therapy
• Of 43 paediatric HIV infections now attending for treatment and care:
- aged 16-46years (median 24y) - 93% (40) on antiviral therapy
- 93% (37) achieved viral suppression - 67% UK born - 26% Black African
UK*: 1037 in treatment and care • 48% UK born• 79% Black African• 97% Mother to child transmission
• 84% on ART (11% naive and 5% off ART)* CHIPS data to end March 2014

Summary• Estimated 6450 living with HIV in Scotland
– 4900 diagnosed
• Ongoing HIV transmission
• Late diagnosis
• High proportion of cohort accessing specialist care and responding to treatment
• Diagnosis of HIV among children in Scotland is rare event - mostly imported infection
• Ageing cohort – further analyses?– use morbidity data?– survival analyses?

Acknowledgements
with thanks to data suppliers…AIDS & HIV Clinicians, Nurses, GUM clinic staff, Co-ordinators,and Collaborators
& Laboratory staff throughout Scotland
& Colleagues at HPS