Embed Size (px)
Citation preview

Maximising DataA hospice success story
1

Saint Francis Hospice
2

About Saint Francis Hospice
• Catchment of 750,000 people• 25,000 active supporters• 20,000 inactive supporters (lapsed 2 - 6 yrs)• 20,000 comatosed (not given last 6 years +)• Hospice needs £7.7 million• £10 per person (catchment)• CRUK £6 per person (catchment)
3
Objectives for the Project
• Enhance existing relationships• Grow supporter base• More effective marketing• ThankQ• Skills and experience and time were limited – Purple Vision
4

Drivers for the Project
• Awareness levels patchy over such a large catchment area
• Three childrens’ hospices who compete heavily
• Cold recruitment difficult/costly particularly in low awareness areas
• Cause creates a natural source of new supporters – but does it encourage them to keep on giving?
5

Other influencing drivers
• Tried multiple approaches to engage audiences – raffles, sponsor a nurse, light up a life, general appeal- bit hit and miss.
• Lots of supporters making one off donations.• Nature of cause – doesn’t assist with the need
for continued support?• More than 70% of our IMO givers don’t give
again – need a reason to repeat.• At least 20% of people affected are under 40!
6
Pulling together data
• Source – where have they come from?
• Length of time on database – when did they first interact with the hospice?
• How do they support – what type of giving – IMO, regular, value?
• What have they been asked to do?
• What are the motivations for giving?
7
Supporter Segmentation?
• Different types of supporters • Where are they now in their life cycle?• Where do we want to take them?• How old are they really?• How loyal are they really?• Is the hospice a mainstream charity for them?• 4000 people cared for – does that mean at
least 4000 new supporters on the database each year?
8

Supporter Segmentation
• Types of information to collect to enable better segmentation:
• How would you like to receive our newsletter/
• Frequency• Format• Raffles – like to receive?• Light up a Life – take
part?
• Social media – Facebook, Twitter.
• Frequency of use• Know about hospice
facebook page?• Cards and Gifts?• Events –
Challenge/Corporate (Ball, Golf )
9
Assembli Supporter Profile Analysis
• Penetration assessment by Post Code• Socio demographic profile by Post Code
compared to region• Mapping of– Penetration– Concentrations of matched potential supporters
• Assessment of potential supporter base• Implications for future strategy

Profile Model – closeness of fitSegment 4 (71<Tenure) AND (54<Age) AND (60<Urbanicity<=65)
Segment 16 (85<Tenure) AND (54<Age) AND (65<Urbanicity<=83)
Segment 7 (71<Tenure<=85) AND (54<Age) AND (65<Urbanicity<=83)
Segment 10 (71<Tenure) AND (Age<=54) AND (72<Property) AND (60<Urbanicity<=83)
Segment 8 (40<Tenure<=71) AND (56<Age) AND (62<Urbanicity<=83)
Segment 3 (71<Tenure) AND (Age<=54) AND (Property<=72) AND (60<Urbanicity<=83)
Segment 15 (32<Tenure<=71) AND (45<Spend) AND (Age<=56) AND (60<Urbanicity<=88)
Segment 9 (40<Tenure<=71) AND (Education<=46) AND (56<Age) AND (83<Urbanicity)
Segment 11 (71<Tenure) AND (63<Age) AND (83<Urbanicity)
Segment 20 (11<Income) AND (Tenure<=40) AND (56<Age) AND (Children<=50)
Segment 18 (71<Tenure) AND (82<Spend) AND (Urbanicity<=60)
Segment 14 (32<Tenure<=71) AND (Spend<=45) AND (Age<=56) AND (60<Urbanicity<=88)
Segment 19 (40<Tenure<=71) AND (46<Education) AND (56<Age) AND (83<Urbanicity)
Segment 6 (40<Tenure<=71) AND (56<Age) AND (Urbanicity<=62)
Segment 22 (Tenure<=32) AND (25<Spend) AND (Age<=56) AND (60<Urbanicity<=88)
Segment 17 (Tenure<=40) AND (Education<=29) AND (56<Age) AND (50<Children)
Segment 5 (Income<=11) AND (Tenure<=40) AND (56<Age) AND (Children<=50)
Segment 2 (71<Tenure) AND (Age<=63) AND (83<Urbanicity)
Segment 0 (Tenure<=71) AND (Age<=56) AND (Urbanicity<=60) AND (Retail<=43)
Segment 1 (71<Tenure) AND (Spend<=82) AND (Urbanicity<=60)
Segment 24 (Tenure<=40) AND (29<Education) AND (56<Age) AND (50<Children)
Segment 13 (Tenure<=32) AND (Spend<=25) AND (Age<=56) AND (60<Urbanicity<=88)
Segment 23 (Tenure<=71) AND (38<Age<=56) AND (88<Urbanicity)
Segment 12 (Tenure<=71) AND (Education<=36) AND (Age<=38) AND (88<Urbanicity<=90)
Segment 28 (Tenure<=71) AND (36<Education) AND (Age<=38) AND (88<Urbanicity<=90)
Segment 27 (Tenure<=71) AND (38<Spend) AND (Age<=56) AND (Urbanicity<=60) AND (43<Retail)
Segment 26 (Tenure<=71) AND (39<Occupation) AND (Age<=38) AND (90<Urbanicity)
Segment 21 (Tenure<=71) AND (Spend<=38) AND (Age<=56) AND (Urbanicity<=60) AND (43<Retail)
Segment 25 (Tenure<=71) AND (Occupation<=39) AND (Age<=38) AND (90<Urbanicity)

Profile Model – closeness of fitAssembli Model Customers Base Penetration Z-Score Index
Counts % Counts % % 0 100 200
Segments
Segment 4 1582 11.7 10311 3.0 15.3 9 396 ██████████ >200
Segment 16 1206 8.9 10017 2.9 12.0 7 311 ██████████ >200
Segment 7 980 7.2 10008 2.9 9.8 6 253 ██████████ >200
Segment 10 958 7.1 10183 2.9 9.4 6 243 ██████████ >200
Segment 8 1418 10.5 16860 4.8 8.4 6 217 ██████████ >200
Segment 3 950 7.0 15953 4.6 6.0 3 154 █████ Segment 15 661 4.9 12749 3.7 5.2 2 134 ███ Segment 9 540 4.0 10787 3.1 5.0 2 129 ███ Segment 11 534 4.0 10760 3.1 5.0 2 128 ███ Segment 20 565 4.2 14191 4.1 4.0 0 103 Segment 18 377 2.8 10391 3.0 3.6 0 94 █ Segment 14 497 3.7 15365 4.4 3.2 -1 84 ██ Segment 19 385 2.8 12085 3.5 3.2 -1 82 ██ Segment 6 404 3.0 13376 3.8 3.0 -2 78 ██ Segment 22 267 2.0 10391 3.0 2.6 -2 66 ███ Segment 17 232 1.7 10003 2.9 2.3 -3 60 ████ Segment 5 228 1.7 10115 2.9 2.3 -3 58 ████ Segment 2 352 2.6 17560 5.0 2.0 -5 52 █████ Segment 0 215 1.6 12063 3.5 1.8 -5 46 █████ Segment 1 158 1.2 10053 2.9 1.6 -5 41 ██████ Segment 24 159 1.2 10856 3.1 1.5 -6 38 ██████ Segment 13 152 1.1 10429 3.0 1.5 -6 38 ██████ Segment 23 253 1.9 17591 5.0 1.4 -8 37 ██████ Segment 12 120 0.9 10061 2.9 1.2 -7 31 ███████ Segment 28 82 0.6 10053 2.9 0.8 -10 21 ████████ Segment 27 74 0.5 10014 2.9 0.7 -11 19 ████████ Segment 26 74 0.5 10316 3.0 0.7 -11 19 ████████ Segment 21 48 0.4 12971 3.7 0.4 -19 10 █████████ Segment 25 47 0.3 13458 3.9 0.3 -21 9 █████████ - - - 0 0
Total 13518 348,970 3.87
12
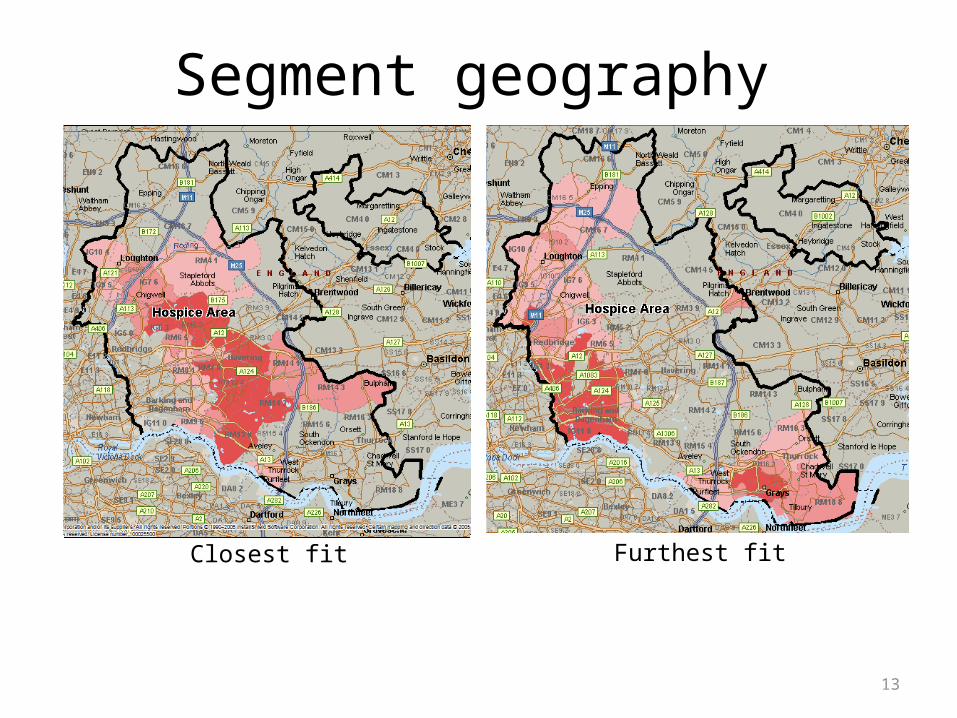
Closest fit
Segment geography
Furthest fit
13
Observations @SFH
• Lots of supporters - lots of one off donations!
• Supporters being silo’d – Once an IMO giver, always an IMO giver?
• Recruiting cold – becoming more costly
• Need to keep the ones we have and keep their interest – 80/20 rule – need to maximise the 20%!
14
The Approach
The proposal recommended three distinct phases:Phase 1 – Profile the data & understand the current supporter basePhase 2 – The Supporter Journey – reviewing the ‘As Is’ and understanding the aspiration for the ‘To Be’Phase 3 – The reality of the Journey – turning the theory into practice via database and processes
15

Phase 2 - Step 1 – ‘As Is’
Determined this via• Workshops with teams to map ‘As is’ processes –
Events; Community; IMO; Individual Giving; LUAL• As part of this ‘known issues’ and ‘would like to
have’ points came out • Documented & back to teams for review• Process allowed opportunity to get ‘buy in’ from
all teams
16

17
Step 2 – ‘To be’
Once ‘lie of land’ known, issues aired, and ‘blue sky thinking’ begun, investigated what was wanted via workshop to:• Identify all audience types going forward (not
same as past)• Identify all products to be taken forward (not
same as past)• Discuss, refine and model into ideal journeys
18

The classic donor pyramid
19

A key to success is…
20

Three things…
1. I want2. I give3. I get
21
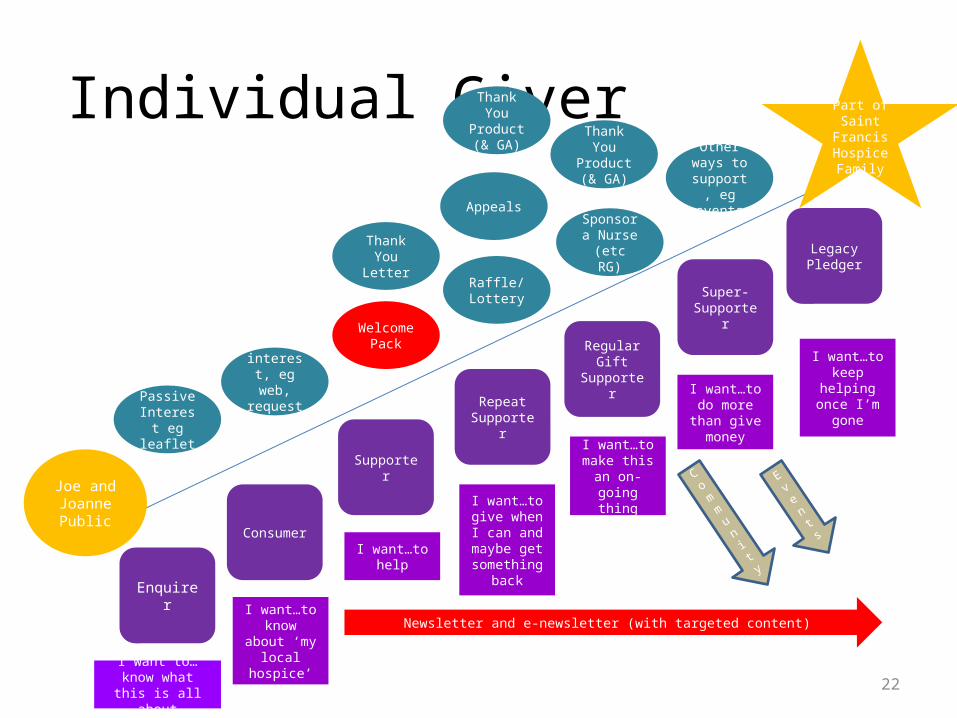
Individual Giver
Consumer
Enquirer
Supporter
Repeat Supporter
Regular Gift Supporter
Super-Supporter
Legacy Pledger
Part of Saint
Francis Hospice Family
Joe and Joanne Public
Active interest, eg web, request
info
Welcome Pack
Thank You Letter
Raffle/ Lottery
Appeals
Thank You Product (& GA)
Passive Interest
eg leaflet
Thank You Product (& GA)
Other ways to support, eg events
I want to…know what this is all
about
I want…to know about
‘my local hospice’
I want…to help
I want…to give when I
can and maybe get something
back
I want…to make this an
on-going thing
I want…to do more than give money
I want…to keep helping
once I’m gone
Newsletter and e-newsletter (with targeted content)
Sponsor a Nurse (etc
RG)
Co
mm
un
it
y
Ev
en
ts
22
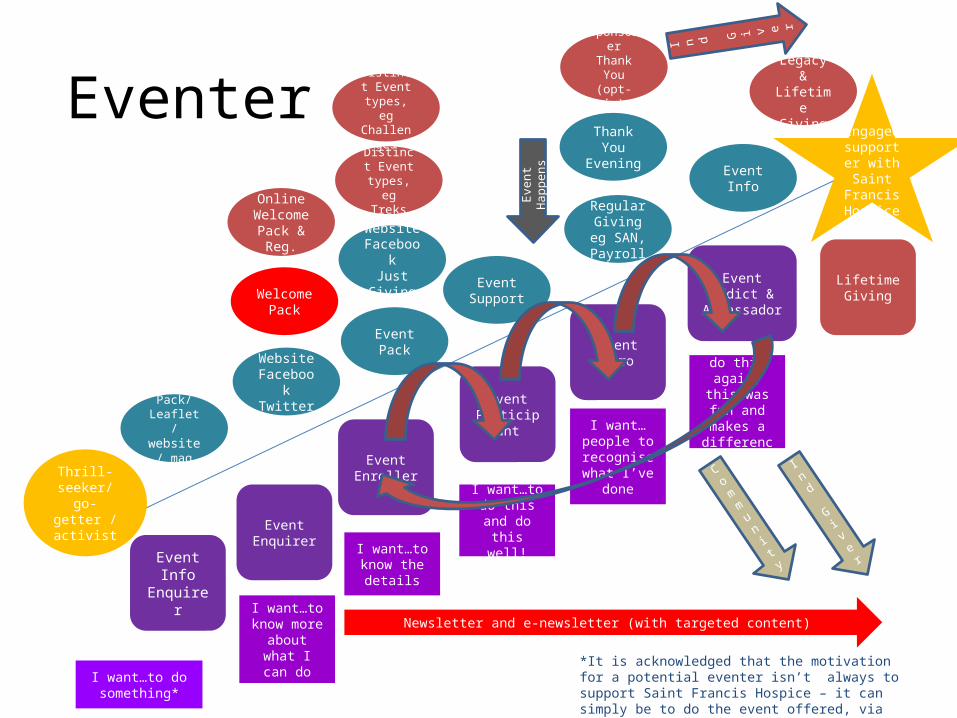
Eventer
Event Enquirer
Event Info Enquirer
Event Enroller
Event Participant
Event Hero
Event Addict & Ambassador
Engaged supporter with Saint
Francis Hospice
Thrill-seeker/go-
getter /activist
Website Facebook
Welcome Pack
Event Pack
Event Support
Info Pack/ Leaflet/
website/ mag etc
Event Info
I want…to do something*
I want…to know more
about what I can do
I want…to know the
details
I want…to do this and do this well!
I want…people to recognise what I’ve
done
I want…to do this again,
this was fun and makes a
difference
Newsletter and e-newsletter (with targeted content)
Regular Giving eg
SAN, Payroll
Co
mm
un
it
y
Even
t H
appe
ns
In
d G
iv
er
*It is acknowledged that the motivation for a potential eventer isn’t always to support Saint Francis Hospice – it can simply be to do the event offered, via Charity of the Year, etc
WebsiteFacebook
Just Giving
Distinct Event
types, eg Treks
Thank You Evening
Online Welcome
Pack & Reg.
Distinct Event
types, eg Challenges
Lifetime Giving
Legacy & Lifetime Giving
Sponsorer Thank You
(opt-in)
I n d G i v e r

Where next?
• Partnership working to find an automated approach to donor journey administration and management via the database.
• Review thanking process• Phone thank – easy to gather more intelligence• Follow – up process (determine what information is
the most appropriate to send)• Lapsing – monitor monthly and ask why? Record this
information.
24

Individual Giver - Development
Consumer
Enquirer
Supporter
Joe and Joanne Public
Active interest, eg web, request
info
Info Pack/ Leaflet
Passive Interest
eg leaflet 1. Code all response devices,
record all interactions
2a. Record Gift2b. Record Welcome
Pack response & tailor & target comms
accordingly
Newsletter and e-newsletter (with targeted content)
3. Record gifts/response &
use to derive next prompt. If no gift in
x months offer Lottery?
Lottery
2nd Appeal
Sent within x days
Sent within x weeks
Sent within x weeks
Repeat Supporter
Thank You
If Lottery have delayed upgrade/ conversion plan
Welcome Pack

Early Days – Outcomes so far
• IMO 50% give once – value £200k per annum • 50% made a repeat donation £100k • 70 IMO givers moved to tribute fund• 754 Raffle purchasers now signed up to new lottery = £40,354• 754 Raffle players were giving £7540• Variance £32,814• 1000 cash donors now signed up to Sponsor a Nurse = £60,000
a year• 1000 cash donors were giving £8000• Variance £52,000
26
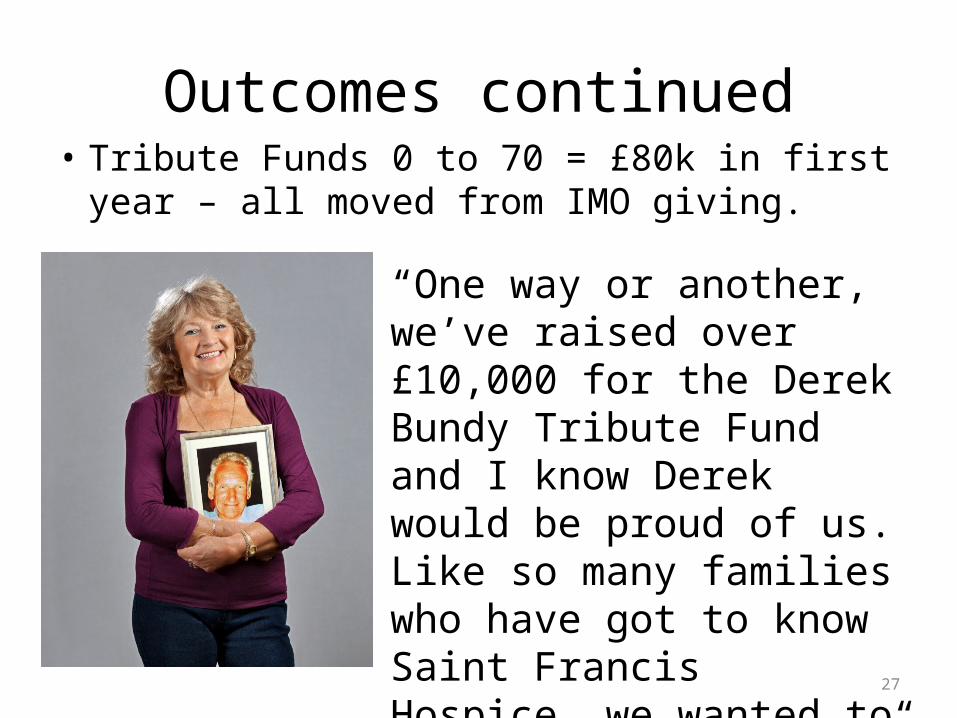
Outcomes continued• Tribute Funds 0 to 70 = £80k in first year – all
moved from IMO giving.
“One way or another, we’ve raised over £10,000 for the Derek Bundy Tribute Fund and I know Derek would be proud of us. Like so many families who have got to know Saint Francis Hospice, we wanted to give something back.”
27
Going forward
• Donor Development Manager in budget to work across all fundraising streams looking at cross fertilisation of information and giving opportunities.
• Plans to move towards more sophisticated journeys for every income streams and every type of supporter
• Really still in the early stages of donor journey development as so much more to do.
• Benefits – we know more about our supporters and they know more about us
• Lessons learned – it takes time and resources. We will be spending more time keeping the supporters we have.
28
Any Questions?
29