Embed Size (px)
Citation preview

Rapid Micro Detection - Part of Risk Based Lifecycle for Pharma/
Biopharma Production for XXI Century
Igor Gorsky, Sr. Consultant, ConcordiaValsource, LLC Javits Conventions Center, New York, NY 26 April, 2016

Objective • Rapid micro detection methods and instruments • Main aspects of rapid microbial testing
implementation • Current status of regulatory and compendia
requirements for Pharmaceutical Water • Aid implementers of instant micro testing
instrumentation in their understanding of new technology
• Sentiment - new technologies vs. new drugs in 21st century

Pharmaceutical cGMPs for the 21st Century - A Risk-Based Approach
• August 2002, the Food and Drug Administration (FDA or the Agency) announced a significant new initiative, Pharmaceutical Current Good Manufacturing Practices
• (CGMPs) for the 21st Century, to enhance and modernize the regulation of pharmaceutical manufacturing and product quality — to bring a 21st century focus to this critical FDA responsibility.
• Fall 2004 Final Report

cGMPs for 21st Century Goals Encourage the early adoption of new technological advances by the pharmaceutical industry:
Facilitate industry application of modern quality management techniques, including implementation of quality systems approaches, to all aspects of pharmaceutical production and quality assurance
Encourage implementation of risk-based approaches that focus both industry and Agency attention on critical areas
Ensure that regulatory review, compliance, and inspection policies are based on state-of-the-art pharmaceutical science
Enhance the consistency and coordination of FDA's drug quality regulatory programs, in part, by further integrating enhanced quality systems approaches into the Agency’s business processes and regulatory policies concerning review and inspection activities

Rapid Micro Methods – Why Do It?
• Microbiological testing plays an ever-increasing role in the pharmaceutical laboratory.
• Variety of alternative and rapid methodologies that automate existing methods, make use of surrogate markers, or are based on wholly new technologies have emerged in recent years.
• These alternative methodologies offer significant improvements in terms of speed, accuracy, precision , and specificity over traditional, or classical, microbiology test methodologies.

Old Methods • Century-old • Based on the recovery and growth of
microorganisms using solid or liquid microbiological growth media
• Have a long history of application in both industrial and clinical settings
• Appropriate for their intended use

Old Methods - Limitations • Slow microbial growth rates • Intended selectivity of microbiological culture, and the
inherent variability of microorganisms in their response to culture methods
• In spite of the limitations of classical culture methods, acceptance of alternative and potentially superior methods has only started to gain momentum within the pharmaceutical, biotechnology, and medical device industries

Guidance • USP General Informational Chapter < 1225>
Validation of Compendial Methods • USP General Information Chapter < 1223>
Validation of Alternative Microbiological • Ph. Eur. Informational Chapter 5.1.6 Alternative
Methods for Control of Microbiological Quality • ICH Q2 (R1) Guideline Validation of Analytical
Procedures

Guidance – PDA Technical Report • PDA Technical Report 33 (Revised): Evaluation,
Validation and Implementation of Alternative and Rapid Microbiological Methods
• Original Report 1999
• Revised in 2013

Regulatory Basis for Validation • 21 CFR 211.100 of GMPs: “There shall be written procedures for product and
process control designed to assure that drug products have identity, strength, quality, and purity they purport or are represented to possess.”
• Purpose of regulations is to protect the public and to provide effective products. Industry must provide assurance that products are safe and pure.
10

RMD- Growth Based • Employ the use of growth-based platforms
have been shown to reduce the time at which actively growing microorganisms can be detected
• Actual time-to-result may be impacted by the physiological state of microorganisms and/ or the lag period in which microorganisms adapt to growth conditions

RMD- Growth Based • Electrochemical Measurement • Detection of Carbon Dioxide (CO2) • Utilization of Biochemical and Carbohydrate Substrates • Digital Imaging and Auto-fluorescence of Micro-Colonies • Fluorescent Staining and Laser Excitation of Micro-Colonies • Use of Selective Media for the Detection of Specific
Microorganisms • Measurement of Change in Head Space Pressure • Microcalorimetry

RMD – Viability Based • Use viability stains and laser excitation for the detection and
quantification of microorganisms without the need for cellular growth
• Organisms that are stressed, injured, fastidious, in a dormant state or are considered viable, but nonculturable
• May now be detected when these same organisms will not grow in or on classical microbiological media Flow Cytometry Laser Scanning Solid Phase Cytometry Direct Epifluorescence Filter Microscopy
Cellular Component Based • ATP Bioluminescence • Fatty Acid Profiling • Matrix Assisted Laser Desorption Ionization Time of Flight
(MALDI-TOF) Mass Spectrometry • Surface Enhanced Laser Desorption Ionization Time of Flight
(SELDI-TOF) Mass Spectrometry • Fourier Transform-Infrared (FT-IR) Spectrometry • Endotoxin Detection The system uses LAL (Limulus
Amoebocyte Lysate) reagents and has a sensitivity level similar to larger laboratory-based instrumentation (e.g., 0.05 - 5.0 EU/ mL). or ELISA

Optical Spectroscopy
• Light Scattering/Intrinsic Fluorescence
• Light Scattering/Intrinsic Fluorescence
• Raman Spectroscopy

Nucleic Acid Amplification • Polymerase Chain Reaction (PCR) • Reverse Transcriptase (RT) PCR • Ribotyping • Gene Sequencing • PCR and MALDI-TOF Mass Spectrometry
Combination

Micro-Electro-Mechanical Systems (MEMS)
• Utilize microarrays, biosensors, Lab-On-A-Chip or micro-fluidic systems, and nanotechnology
• Provide miniaturized technology platforms as compared with conventional, bench-top instrumentation.

27
How Many Methods Was Listed?

How Many Methods Your Firm Uses?

Microbial Cell Metabolism and Metabolites
• Metabolism - the sum of all chemical reactions within a living organism
• Because chemical reactions either release or require energy, metabolism can be visualized as an energy balancing act
• These chemical reactions are essential mechanisms of microbial cell life
• In living microbial cells such catalysts are large biological molecules - enzymes and coenzymes

Microbial Cell Metabolites • Nicotinamide adenine dinucleotide (NADH) • Riboflavin which also functions as a coenzyme for a wide
variety of enzymes in the intermediate microbial cell metabolism.
• One of the important characteristics of these microcell metabolites is their fluorescence
• Their fluorescence is making them readily detectible by Laser-induced fluorescence (LIF) instruments
Gerard J. Tortora, Berdell Funke and Christine Case Microbiology, the Introduction the Bendgemn Publishing, CA 1986. Seong Han Lim, Jong Soo Choi, and Enoch Y. Park “Microbial Production of Riboflavin Using Riboflavin Overproducers, Ashbya gossypii, Bacillus
subtilis, and Candida famate”, Biotechnol. Bioprocess Eng. 2001, 6: 75-88

Laser Induced Fluorescence Principles
Laser-induced fluorescence or LED induced fluorescence (LIF) is a spectroscopic method used for studying structure of molecules, detection of selective species and flow visualization and measurements

Laser Induced Fluorescence Principles
• Light scattering is a phenomenon in which the propagation of light is disturbed by its interaction with particles
• Instrumentation that utilizes Mie scattering (i.e., where the scattered light intensity is dependent upon the particle size in a certain size range) and fluorescence detection techniques can provide information about the size and number of viable microorganisms in air and water

• As microorganisms pass through a laser of a specific wavelength, micro cell metabolites, such as NADH, riboflavin and dipicolinic acid, are excited and provide an intrinsic fluorescent signal that distinguishes the microorganisms from other particulates
• The species to be examined are excited with a laser • The wavelength is often selected to be the one at which the
species has its largest cross section • The excited species will after some time, usually in the order of
few nanoseconds to microseconds, de-excite and emit light at a wavelength longer than the excitation wavelength
Laser Induced Fluorescence Principles

LIF Technology – How Does It Work?* • Laser Induced Fluorescence (LIF) is a technology which utilizes a high intensity
light source, e.g., ~405nm laser, to induce Mie scatter and fluorescence resulting in detection of both inert particles and biologics like bacteria, yeasts, molds
• Fluorescence is derived from internal fluorophores (NADH, riboflavin, DPA) of microbes
• Detects and characterizes particles in the 0.5 to 50 micron range
The scattered light is concentrated in a forward direction The angle of the scattered light is highly sensitive to the scattering particle size
Mie Scattering
* Source: LIF Technologies for Process and Environmental Monitoring, A collaboration by Particle Measuring Systems, Azbil BioVigilant, TSI, Instant BioScan, Presentation Updated 30-Jul-2014

LIF Method of Microbial Detection
* Source: LIF Technologies for Process and Environmental Monitoring, A collaboration by Particle Measuring Systems, Azbil BioVigilant, TSI, Instant BioScan, Presentation Updated 30-Jul-2014
LIF Technology – How Does It Work?*

LIF – Brief History and Use • The LIF technology has been known for aver 50 years and has been actively used in numerous areas
of science and technology • The LIF advantages: • Bright signal against a dark background • Excels in the signal to the noise ratio (the basis for ultrasensitive biochemical analysis, enabling
detection limits to be pushed to that of microbiological levels) • Permits preparation of a well-defined excited state whose properties—radiative and collisional—can
be studied in great details. • Used in prospecting for petroleum leaks in the ocean floor, in medical diagnosis, distinguishing
between cancerous and noncancerous tissue in a patient, detection of the various toxins in foods, the sequencing of the human genome, and space bioscience studies to name a few diverse applications of its used
• Great sensitivity and accuracy it is a great tool in measurement of bioburden in pharmaceutical water
Richard N. Zare, “My Life with LIF: A Personal Account of Developing Laser-Induced Fluorescence” Department of Chemistry, Stanford University, Stanford, California, Annu. Rev. Anal. Chem. 2012. 5:1–14
Vladimir V. Ghukasyan‡ and Fu-Jen Kao, Monitoring Cellular Metabolism with Fluorescence Lifetime of Reduced Nicotinamide Adenine Dinucleotide, J. Phys. Chem., Jan. 2005
K. Koenig and H. Schneckenburger “Laser-Induced Autofluorescence for Medical Diagnosis”, Journal of Fluorescence, Vol. 4, No. L 1994
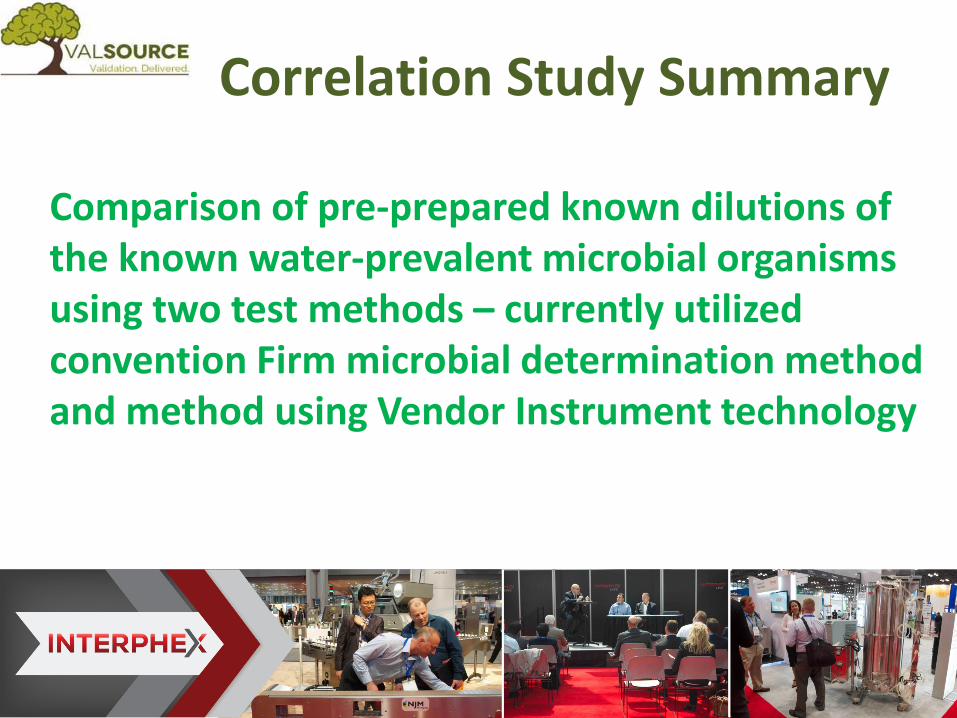
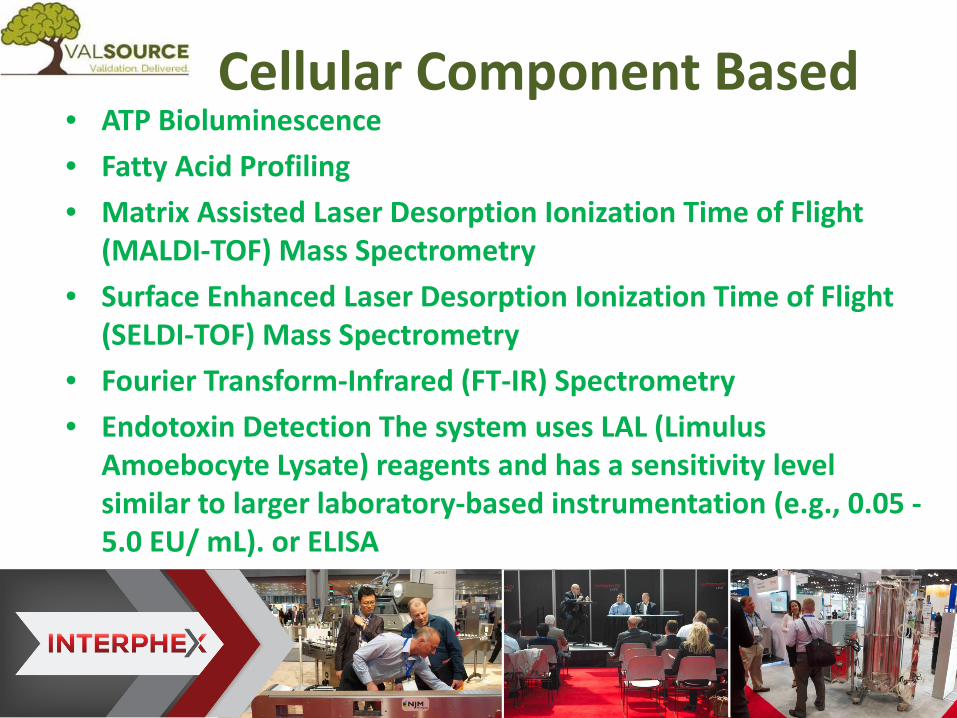
Correlation Study Summary
Comparison of pre-prepared known dilutions of the known water-prevalent microbial organisms using two test methods – currently utilized convention Firm microbial determination method and method using Vendor Instrument technology

The Instrument test is considered a Quantitative test and the following aspects of Method Suitability should be considered:
Accuracy, Precision, Specificity, Limit of Detection (LOD), Limit of Quantification (LOQ), Linearity Range
Parenteral Drug Association (PDA) Technical Report No. 33 Evaluation, Validation and Implementation of Alternative and Rapid Microbiological Methods (Revised 2013), PDA, Bethesda, MD 2013
General Chapter <1223> Validation of Alternative Microbiological Methods USP37/NF32, U.S. Pharmacopeia 2014.
Informational Chapter 5.1.6 Alternative Methods for control of Microbiological Quality. European
Pharmacopeia 8.2, European Directorate for the Quality of Medicines (EDQM), Strasbourg, France: 2014
Chapter 21 Quality Control of Water for Pharmaceutical Use, Japanese Pharmacopeia XV: 2006
Correlation Study Summary

30
31

32

Validation Deliverables • Risk Assessment and Validation Plan • User Requirements Specification (URS) • Design Qualification (DQ) • Functional Design Specification (FDS) • Requirements Traceability Matrix (RTM) • SOPs and Technology Training • System Integration • Installation Qualification • Operational Qualification • Performance Qualification (Method Validation)Suitability Testing • On-going Maintenance and Periodic Reviews
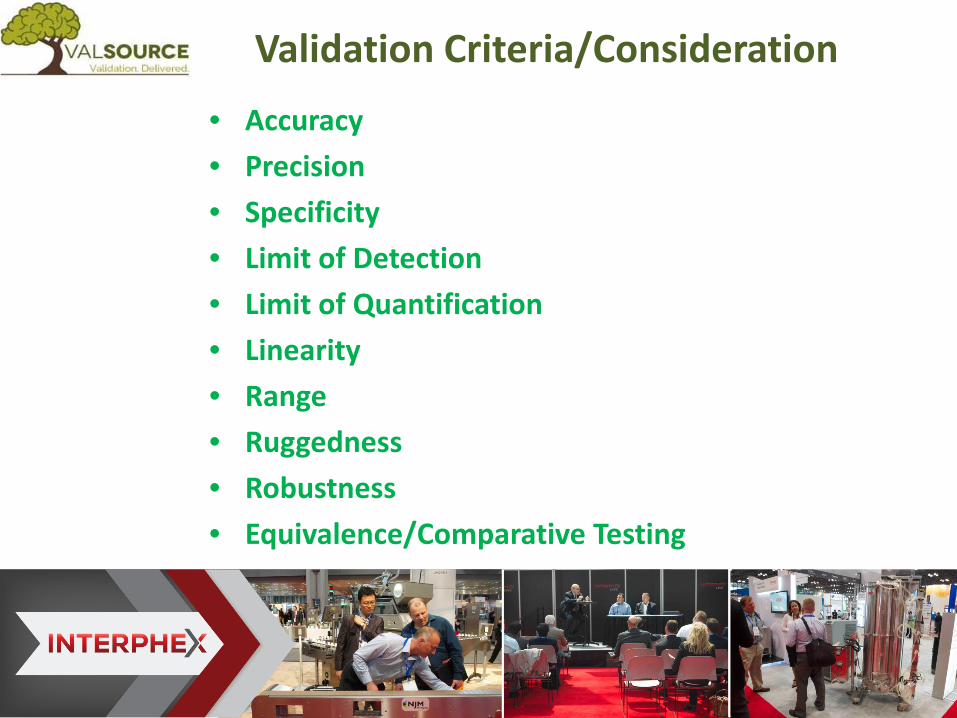
Validation Criteria/Consideration
• Accuracy • Precision • Specificity • Limit of Detection • Limit of Quantification • Linearity • Range • Ruggedness • Robustness • Equivalence/Comparative Testing

IQ, OQ, PQ and Tech Transfer Considerations
• Training program • Procedures written and approved • Maintenance and Calibration programs
developed prior to performing the analyst qualification and subsequent routine use

Performance Qualification • Exhaustive microbiological testing completed during
method suitability and correlation at the initial qualification facility = may not be necessary (like-for-like instrument)
• Important - sufficient data is required to evaluate whether a shift in the data from the alternative or rapid method is statistically significant than the method being replaced, and whether the data warrants a modification to the baseline acceptance levels or specifications

Current Pharmaceutical Water Validation Maintenance/Monitoring Trending Rules
• All Instant Micro Testing Instrument data must be trended • Trending must be integrated into current trending practices • Evaluation should take into consideration:
Results of the Correlation Study Risk Management Practical Significance and Statistical Significance (as applicable)

Validation at Multi-Site Firms
• Guidance for the Transfer of an Alternative or Rapid Method from an Originating Qualification Lab to Each Site
• It may not be necessary to repeat the same qualification test plan for identical technologies that will be installed in the same location or at the other Firm sites
• However separate evaluation to determine the extent of additional IQ, OQ, or PQ testing should be performed
• Opportunity for reduced testing may be evaluated

Validation at Multi-Site Firms
• Once the alternative or rapid method has been successfully installed and qualified for use at other site and regulatory approval as required is sought, the system may be used routinely
• Data and conclusions drawn from this study may support global implementation of all RMD models of similar design and function now and in the future

40

41
50454035302520151051
0.9
0.8
0.7
0.6
0.5
Observation
Cond
ucti
vity
Number of runs about median: 28Expected number of runs: 26.0Longest run about median: 5Approx P-Value for Clustering: 0.716Approx P-Value for Mixtures: 0.284
Number of runs up or down: 36Expected number of runs: 33.0Longest run up or down: 3Approx P-Value for Trends: 0.847Approx P-Value for Oscillation: 0.153
Run Chart of Conductivity
50454035302520151051
0.0035
0.0030
0.0025
0.0020
0.0015
Observation
TOC
Number of runs about median: 27Expected number of runs: 26.0Longest run about median: 8Approx P-Value for Clustering: 0.612Approx P-Value for Mixtures: 0.388
Number of runs up or down: 30Expected number of runs: 33.0Longest run up or down: 4Approx P-Value for Trends: 0.153Approx P-Value for Oscillation: 0.847
Run Chart of TOC
Run Charts System In-Control

42
System In-Control Process Capability
1.21.00.80.60.40.2-0.0
LSL USL
LSL 0Target *USL 1.3Sample Mean 0.7Sample N 50StDev (Within) 0.1StDev (O v erall) 0.0981401
Process Data
C p 2.17C PL 2.33C PU 2.00C pk 2.00
Pp 2.21PPL 2.38PPU 2.04Ppk 2.04C pm *
O v erall C apability
Potential (Within) C apability
PPM < LSL 0.00PPM > USL 0.00PPM Total 0.00
O bserv ed PerformancePPM < LSL 0.00PPM > USL 0.00PPM Total 0.00
Exp. Within PerformancePPM < LSL 0.00PPM > USL 0.00PPM Total 0.00
Exp. O v erall Performance
WithinOverall
Process Capability of Conductivity
0.231
0.198
0.165
0.132
0.099
0.066
0.033
0.000
LSL USL
LSL 0Target *USL 0.5Sample Mean 0.026Sample N 50StDev (Within) 0.002StDev (O v erall) 0.000443055
Process Data
C p 41.67C PL 4.33C PU 79.00C pk 4.33
Pp 188.09PPL 19.56PPU 356.61Ppk 19.56C pm *
O v erall C apability
Potential (Within) C apability
PPM < LSL 0.00PPM > USL 0.00PPM Total 0.00
O bserv ed PerformancePPM < LSL 0.00PPM > USL 0.00PPM Total 0.00
Exp. Within PerformancePPM < LSL 0.00PPM > USL 0.00PPM Total 0.00
Exp. O v erall Performance
WithinOverall
Process Capability of TOC
Ppk > 6σ

43
Process Shifted Run Charts
50454035302520151051
1.4
1.3
1.2
1.1
1.0
0.9
0.8
0.7
0.6
Observation
Cond
ucti
vity
(2n
d Sy
stem
)
Number of runs about median: 22Expected number of runs: 26.0Longest run about median: 8Approx P-Value for Clustering: 0.126Approx P-Value for Mixtures: 0.874
Number of runs up or down: 36Expected number of runs: 33.0Longest run up or down: 3Approx P-Value for Trends: 0.847Approx P-Value for Oscillation: 0.153
Run Chart of Conductivity (2nd System)
50454035302520151051
0.0055
0.0050
0.0045
0.0040
0.0035
0.0030
0.0025
0.0020
Observation
TOC
(2nd
Sys
tem
)
Number of runs about median: 14Expected number of runs: 26.0Longest run about median: 11Approx P-Value for Clustering: 0.000Approx P-Value for Mixtures: 1.000
Number of runs up or down: 30Expected number of runs: 33.0Longest run up or down: 4Approx P-Value for Trends: 0.153Approx P-Value for Oscillation: 0.847
Run Chart of TOC (2nd System)

44
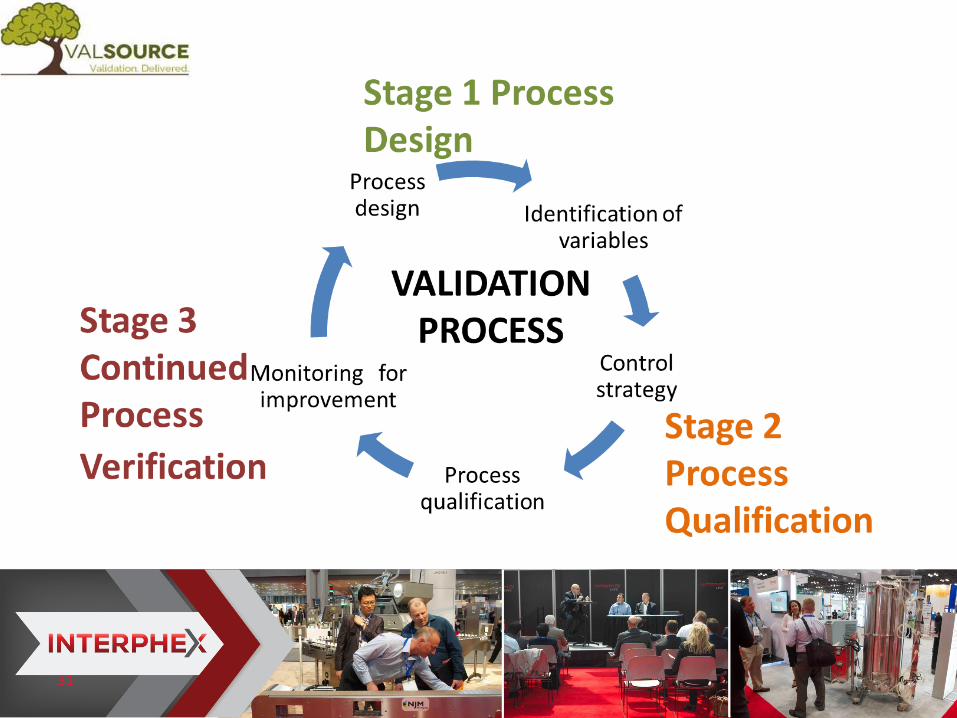
Monitoring/Continued Verification of Pharmaceutical Water Systems - Application of a Lifecycle to Validation of Water Systems
Stage 3 – Continued Verification
Process Shifted Process Capability
0.36
40.
312
0.26
00.
208
0.15
60.
104
0.05
2
-0.000
LSL USL
LSL 0Target *USL 0.5Sample Mean 0.026Sample N 50StDev (Within) 0.005StDev (O v erall) 0.000820958
Process Data
C p 16.67C PL 1.73C PU 31.60C pk 1.73
Pp 101.51PPL 10.56PPU 192.46Ppk 10.56C pm *
O v erall C apability
Potential (Within) C apability
PPM < LSL 0.00PPM > USL 0.00PPM Total 0.00
O bserv ed PerformancePPM < LSL 0.10PPM > USL 0.00PPM Total 0.10
Exp. Within PerformancePPM < LSL 0.00PPM > USL 0.00PPM Total 0.00
Exp. O v erall Performance
WithinOverall
Process Capability of TOC (2nd System)
1.200.960.720.480.24-0.00
LSL USL
LSL 0Target *USL 1.3Sample Mean 0.7Sample N 50StDev (Within) 0.1StDev (O v erall) 0.1715
Process Data
C p 2.17C PL 2.33C PU 2.00C pk 2.00
Pp 1.26PPL 1.36PPU 1.17Ppk 1.17C pm *
O v erall C apability
Potential (Within) C apability
PPM < LSL 0.00PPM > USL 20000.00PPM Total 20000.00
O bserv ed PerformancePPM < LSL 0.00PPM > USL 0.00PPM Total 0.00
Exp. Within PerformancePPM < LSL 22.36PPM > USL 233.91PPM Total 256.27
Exp. O v erall Performance
WithinOverall
Process Capability of Conductivity (2nd System)
Ppk < 6σ

Trend Analysis
The goal of trend analysis should be extracting an underlying pattern of behavior which occurs over time which would otherwise be partly or nearly completely hidden by data noise Trend Analysis leads to establishment of relevant Alert and Action Limits Process Capability and Process

Trend Analysis • The Instant Micro Testing Instrument collects about 500 data
points per day, compared to a single grab sample collected at a defined frequency (once per day, maximum) the data attained from these instruments may be subjected to Statistical Process Control Analyses such as Control Charting, CuSum Charting, Process Capability and Process Performance Analyses as applicable
• These techniques could be utilized for monitoring of the systems performance over time and showing early signs of possible shift

Intermittent Spikes Handling • As Intermittent Spikes may occur in the Water Systems most probably due to either a
sloughing events when large bolus of cells or dead cells shed or release from the biofilm or a detaching events small number of cells detach from the biofilm periodically over time each site’s trending shall take these events into consideration when establishing typical water trend
• Where thresholds for alert and actions are exceeded, alarms are broadcasted
• Due to the number of measurements taken daily, high intermittent count spike events may be seen as a possible pattern which may show an increased variation and cause changes in measured process capability or process performance
• Each site shall exercise analyses of those intermittent events as they relate to their specific system and introduce controls that are based on already existing water evaluation tools.

Regulatory View • The FDA has been accepting of alternative and RMMs for a
number of years • FDA's 2004 Guidance for Industry: Sterile Drug Products
Produced by Aseptic Processing- cGMP recommends the use of rapid genotypic methods for microbial identification, as these methods have been shown to be more accurate and precise than biochemical and phenotypic techniques
• 2011 published a proposed rule in the U.S. Federal Register amending the sterility test requirements for biologic products

Benefit of Implementing: Risk Management Perspective
• Design robust processes that prevent contamination • Ensure that a state of microbial control is
maintained • Develop more effective strategies to correct a
contamination problem • Continually improve processes and products • Assess the potential impact of results that don’t
meet specification on the patient

Benefit of Implementing: Business and Economic Consideration
• Potential for reduced in-process microbiology testing and finished product release cycle times
• Reduction in risks associated with forward processing (e.g., bacterial contamination of mammalian cell cultures)
• Elimination or reduction of off-line assays

Benefit of Implementing: Business and Economic Consideration
• Increases in laboratory automation and reductions in manual testing, sample handling and/ or data management
• Reduced overhead and/ or headcount for sampling and/ or testing
• Ability to make immediate microbiology decisions on the state of microbial control

Benefit of Implementing: Business and Economic Consideration
• Faster response to contamination events or microbial data deviations, and the initiation of investigations
• Reduced repeat testing, lot rejection, reprocessing and rework
• Reduction in plant downtime and investigations

Benefit of Implementing: Business and Economic Consideration
• Increased product yields • Reduced raw material, in-process and
finished goods inventory holdings • Reduced warehousing space I cost and work-
in-process (WIP)

Operating Costs Examples
• Cost per test (e.g., consumables) • Labor time and labor costs • Equipment depredation, calibration, qualification
and maintenance • Laboratory overhead • Data management and storage • Additional testing (e.g., if the RMM is not approved
in all countries).

Investment Costs • The capital costs for the new technology • Software updates • Training • Validation • Regulatory filings and associated costs, when
applicable

Quality Considerations • Better more precise Real time monitoring control • Provide a greater understanding of manufacturing
variability, enhance process • Knowledge • Contribute to continuous process and product
improvement should be considered
Quality Considerations • Some technologies allow for more accurate,
sensitive and reproducible monitoring • Provide enhanced trending of microbiological
data, and automation, • Contribute to increases in compliance,
process knowledge and the improved detection of microorganisms

58
Questions