Embed Size (px)
Citation preview
Planned Hospital IT Investment: Budgets, Plans and Purchases in a stratified marketplace
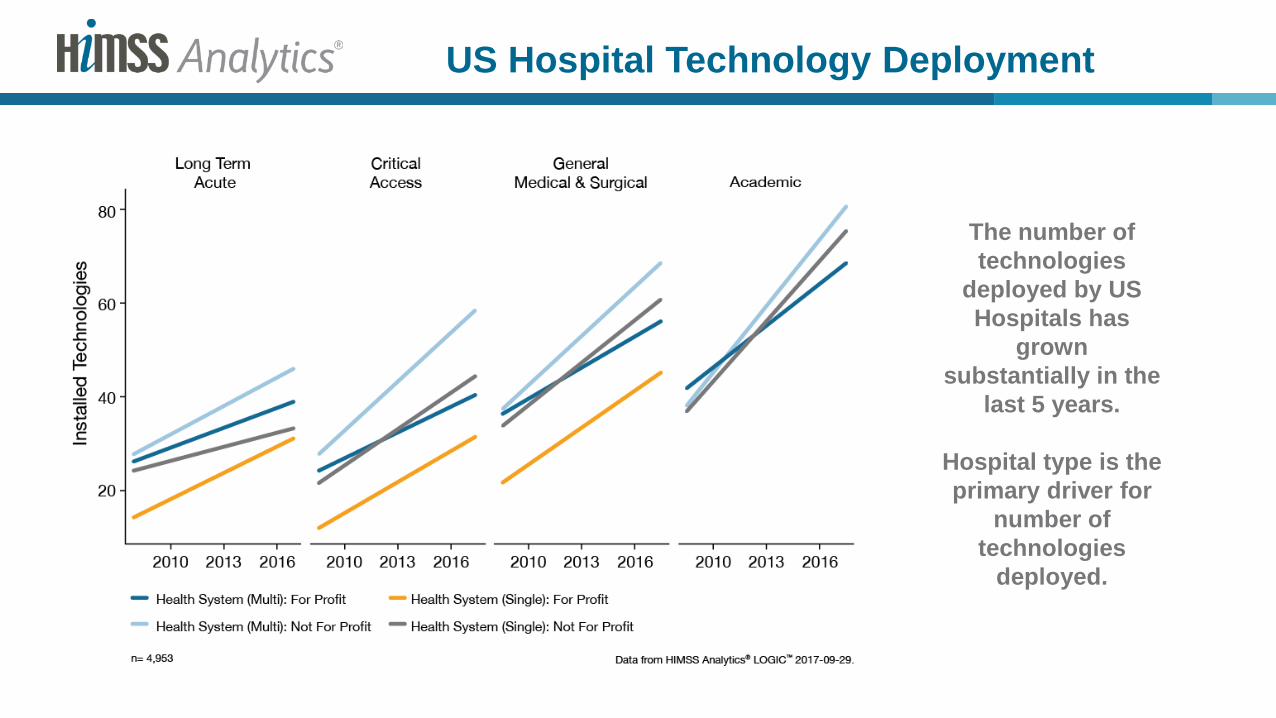
US Hospital Technology Deployment
The number of technologies
deployed by US Hospitals has
grown substantially in the
last 5 years.
Hospital type is the primary driver for
number of technologies
deployed.
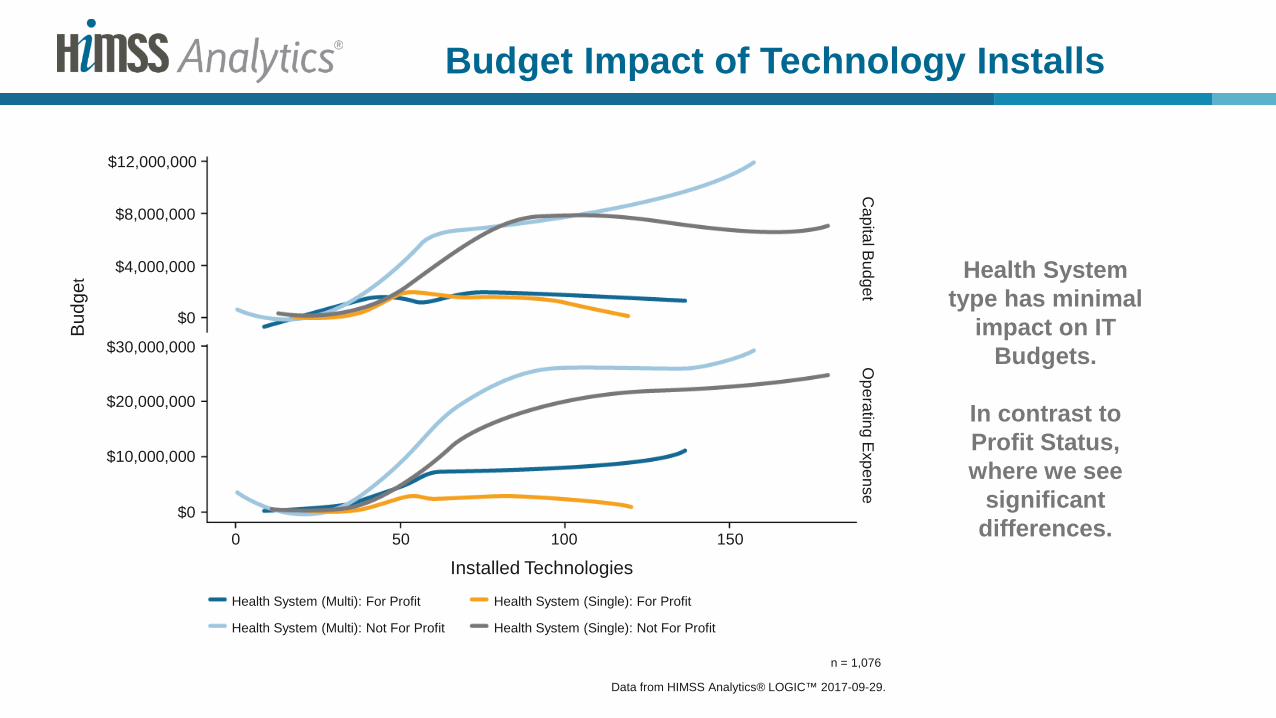
Budget Impact of Technology Installs
Health System type has minimal
impact on IT Budgets.
In contrast to Profit Status, where we see
significant differences.
$12,000,000
$8,000,000
$4,000,000
$30,000,000
$20,000,000
$10,000,000
$0
Bud
get
0
$0
Capital B
udgetO
perating Expense
Installed Technologies50 100 150
Health System (Multi): For Profit
Health System (Multi): Not For Profit
Health System (Single): For Profit
Health System (Single): Not For Profit
Data from HIMSS Analytics® LOGIC™ 2017-09-29.
n = 1,076
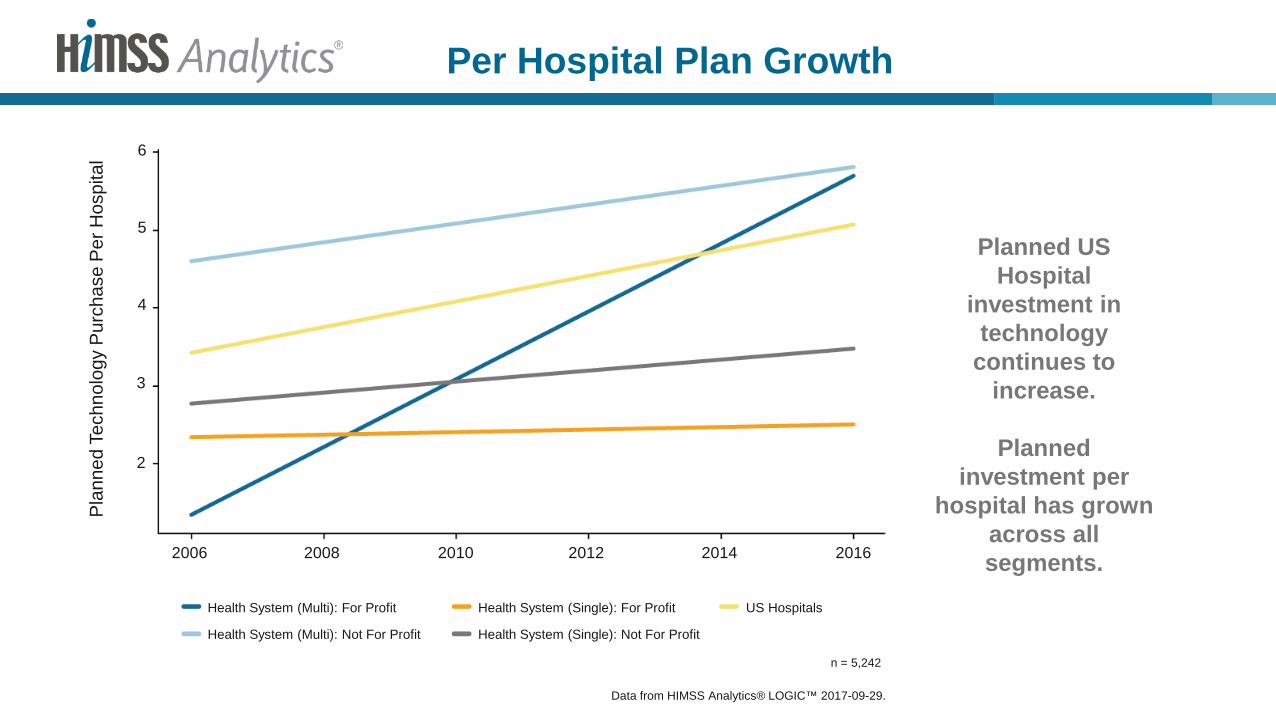
Per Hospital Plan Growth
Planned US Hospital
investment in technology
continues to increase.
Planned investment per
hospital has grown across all segments.
4
3
2
Pla
nned
Tec
hnol
ogy
Pur
chas
e P
er H
ospi
tal
2006
Health System (Multi): For Profit
Health System (Multi): Not For Profit
Health System (Single): For Profit
Health System (Single): Not For Profit
5
6
US Hospitals
Data from HIMSS Analytics® LOGIC™ 2017-09-29.
n = 5,242
2008 2010 2012 2014 2016
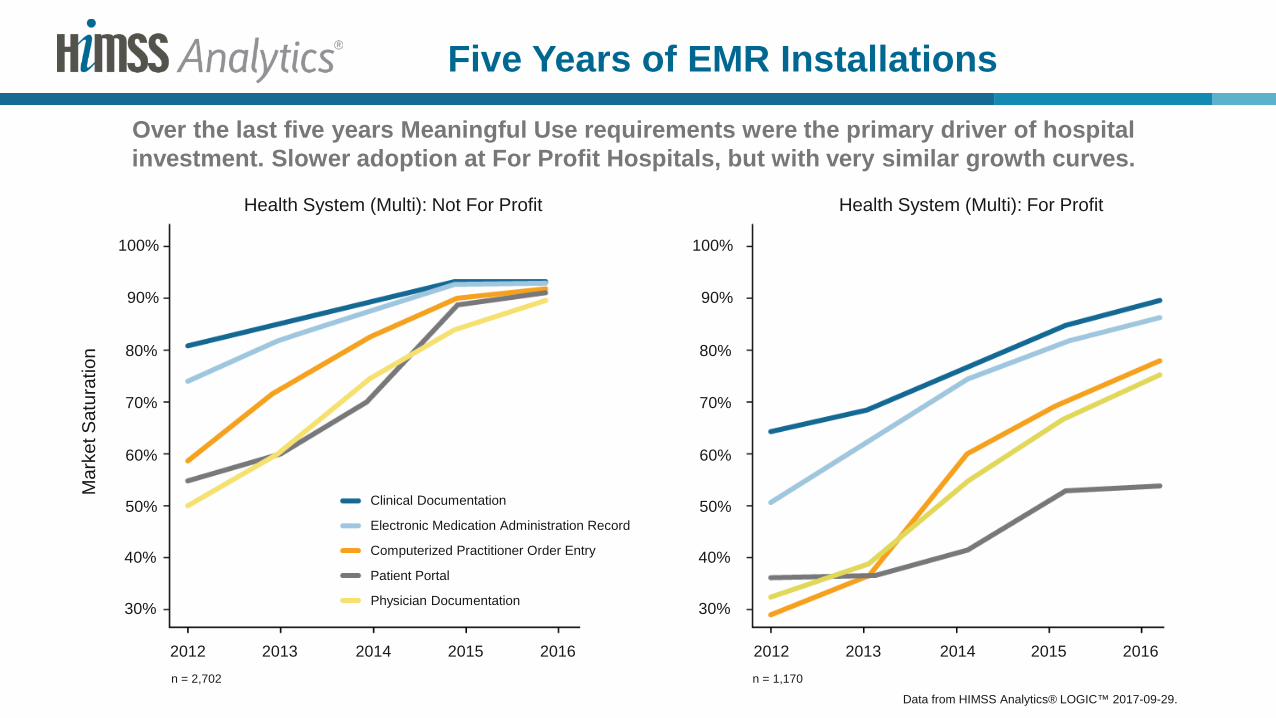
Five Years of EMR Installations
Over the last five years Meaningful Use requirements were the primary driver of hospital investment. Slower adoption at For Profit Hospitals, but with very similar growth curves.
50%
40%
30%
2012
Clinical Documentation
Electronic Medication Administration Record
Computerized Practitioner Order Entry
Patient Portal
60%
70%
Physician Documentation
Data from HIMSS Analytics® LOGIC™ 2017-09-29.
n = 1,170
2013 20152014 2016
80%
90%
100%
Mar
ket S
atur
atio
n
Health System (Multi): Not For Profit Health System (Multi): For Profit
50%
40%
30%
2012
60%
70%
2013 20152014 2016
80%
90%
100%
n = 2,702
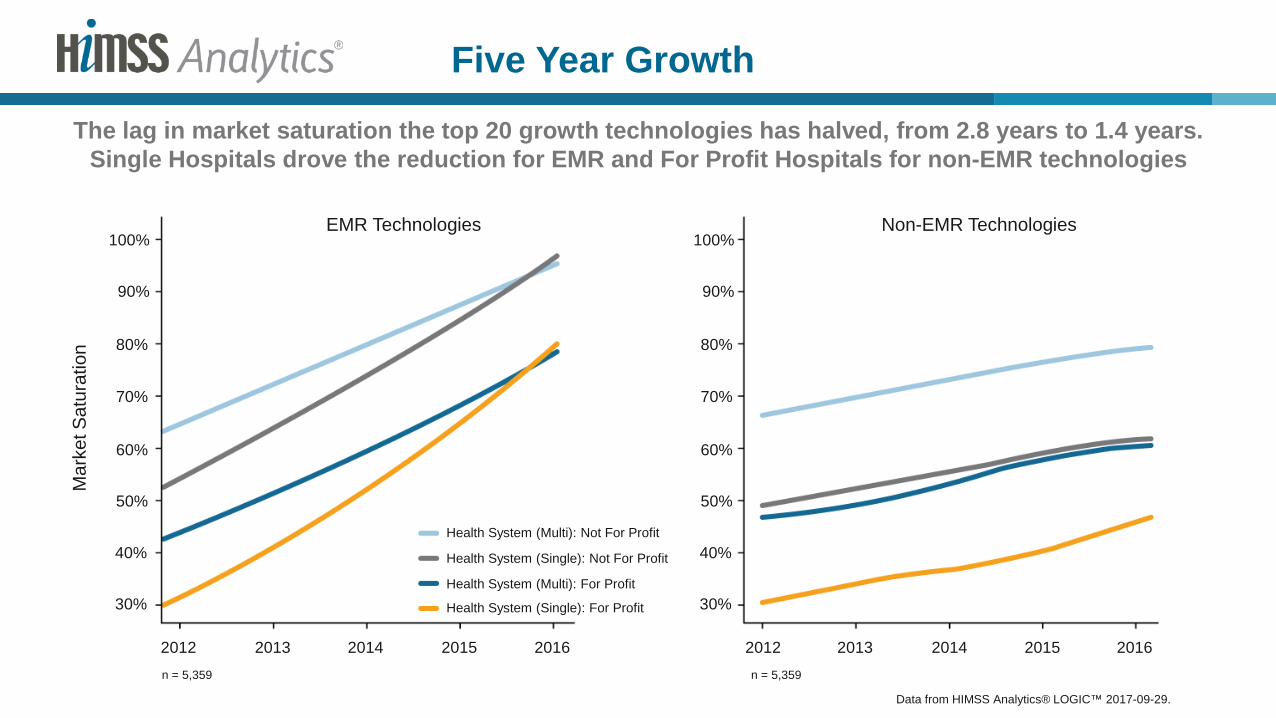
Five Year Growth
The lag in market saturation the top 20 growth technologies has halved, from 2.8 years to 1.4 years. Single Hospitals drove the reduction for EMR and For Profit Hospitals for non-EMR technologies
50%
40%
30%
2012
60%
70%
2013 20152014 2016
80%
90%
100%
Mar
ket S
atur
atio
n
n = 5,359
50%
40%
30%
2012
60%
70%
2013 20152014 2016
80%
90%
100%
n = 5,359
Data from HIMSS Analytics® LOGIC™ 2017-09-29.
EMR Technologies Non-EMR Technologies
Health System (Multi): For Profit
Health System (Multi): Not For Profit
Health System (Single): For Profit
Health System (Single): Not For Profit
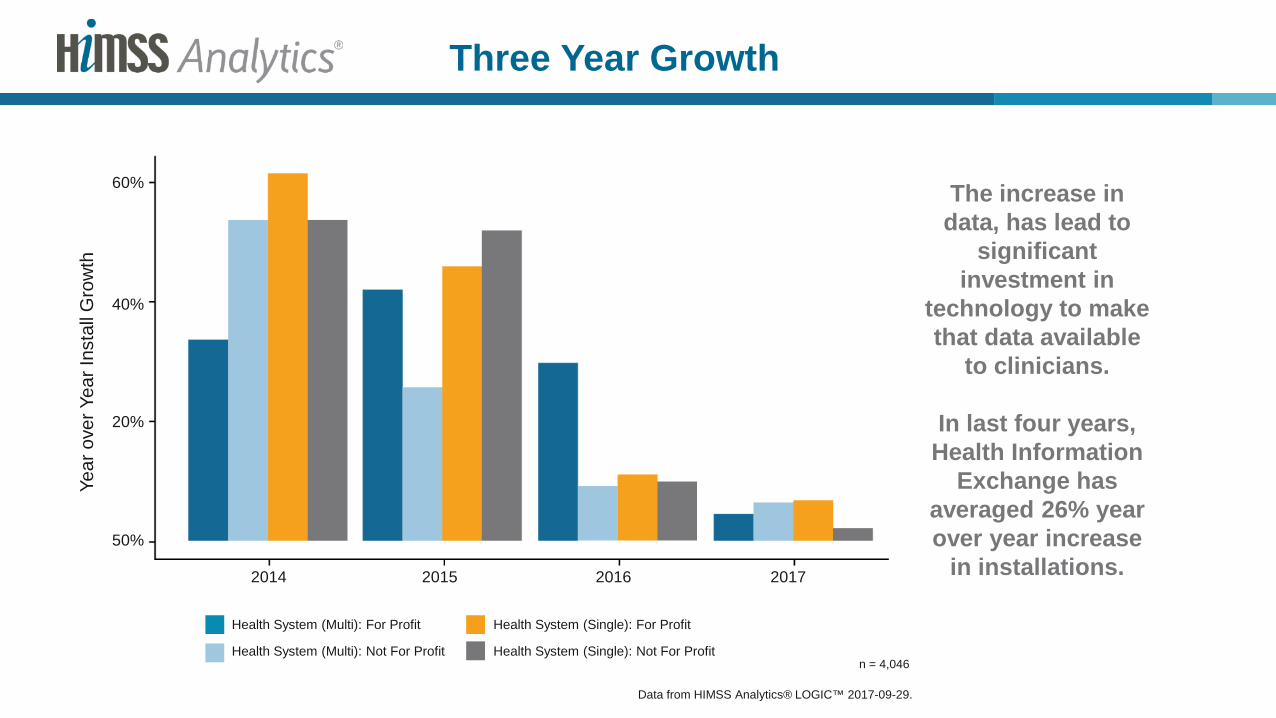
Three Year Growth
The increase in data, has lead to
significant investment in
technology to make that data available
to clinicians.
In last four years, Health Information
Exchange has averaged 26% year over year increase
in installations.
Year
ove
r Yea
r Ins
tall
Gro
wth
n = 4,046
Data from HIMSS Analytics® LOGIC™ 2017-09-29.
50%
2014
20%
40%
60%
2015 2016 2017
Health System (Multi): For Profit
Health System (Multi): Not For Profit
Health System (Single): For Profit
Health System (Single): Not For Profit
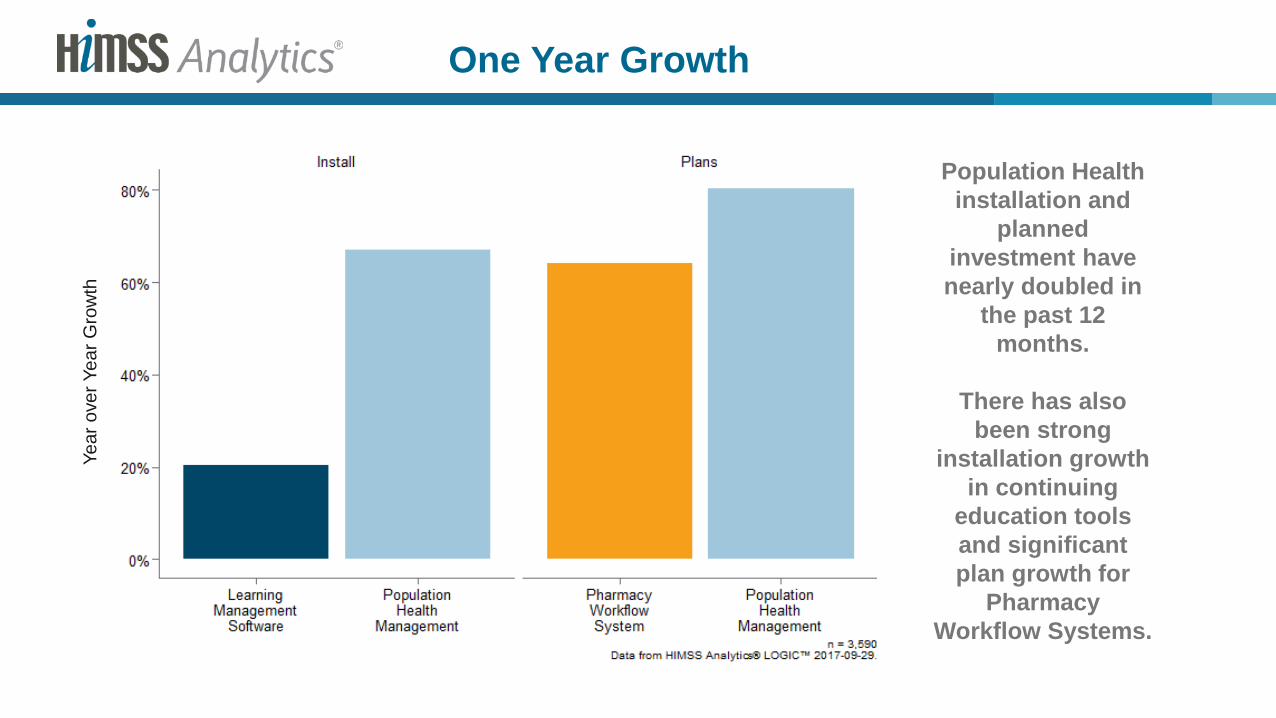
One Year Growth
Population Health installation and
planned investment have nearly doubled in
the past 12 months.
There has also been strong
installation growth in continuing
education tools and significant plan growth for
Pharmacy Workflow Systems.
Year
ove
r Yea
r Gro
wth