Embed Size (px)
Citation preview
Allocating Healthcare Budgets to General Practices
Peter C. Smith on behalf of PBRA team
Imperial College Business School & Centre for Health Policy
http://www.nuffieldtrust.org.uk/projects/index.aspx?id=338
The Person‐based resource allocation ( )(PBRA) project
• Led by Jennifer Dixon (Nuffield Trust) fromLed by Jennifer Dixon (Nuffield Trust) from 2007
• Initial purpose was to develop budgets for• Initial purpose was to develop budgets for practice based commissioning based on individual patient dataindividual patient data
• Coverage: secondary care, prescribing, i h l h icommunity health services
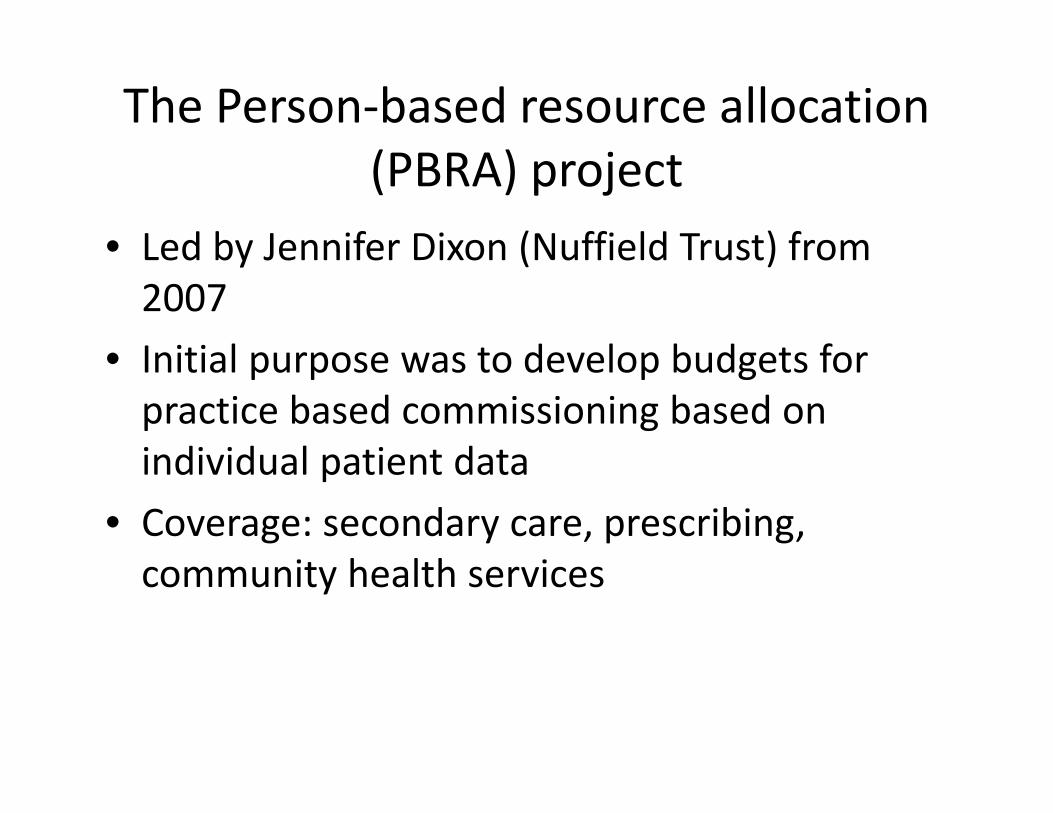
Reviews of resource allocation in English NHS Hospital and Community Health Services 1976‐ today
Year Name Allocations to
Approximate population
Years applied
Hospital and Community Health Services , 1976‐ today
to population size
1976 RAWP 14 RHAs 3m 77/78 – 90/91
1980 R R 14 RHA 3 91/92 94/951980 RoR 14 RHAs 3m 91/92 – 94/95
1993 University of York
14 RHAs192 DHAs
3m250,000
95/96 – 01/02
2001 AREA 303 PCTs 175,000 02/03 – 06/07
2006 CARAN 152 PCTs 350,000 07/08 –
Drawn from Bevan, and Bevan and Van der Ven
3
Drawn from Bevan, and Bevan and Van der Ven Note: RAWP = Resource Allocation Working Party
RoR = Review of RAWPAREA = Allocation of Resources to English AreasCARAN = Combining Age Related Additional Needs (9)
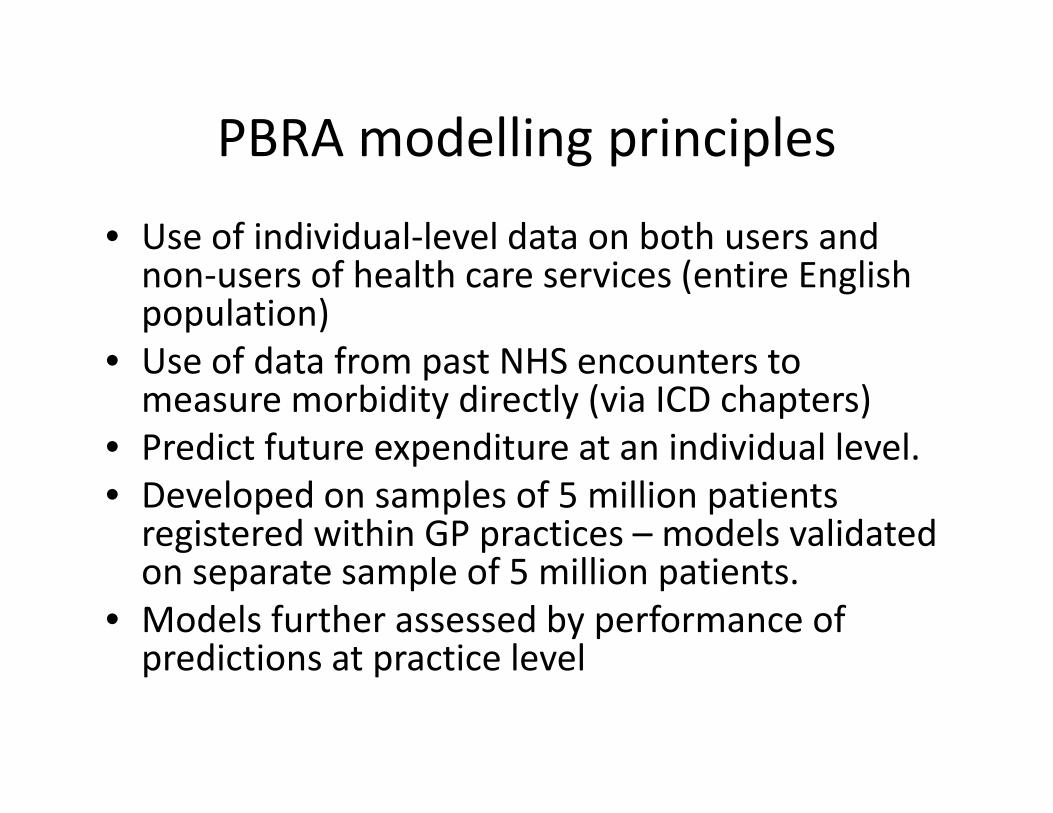
PBRA modelling principlesPBRA modelling principles
• Use of individual‐level data on both users and non‐users of health care services (entire English population)
• Use of data from past NHS encounters to• Use of data from past NHS encounters to measure morbidity directly (via ICD chapters)
• Predict future expenditure at an individual level.Predict future expenditure at an individual level.• Developed on samples of 5 million patients registered within GP practices – models validated
l f 5 illi ion separate sample of 5 million patients. • Models further assessed by performance of predictions at practice levelpredictions at practice level
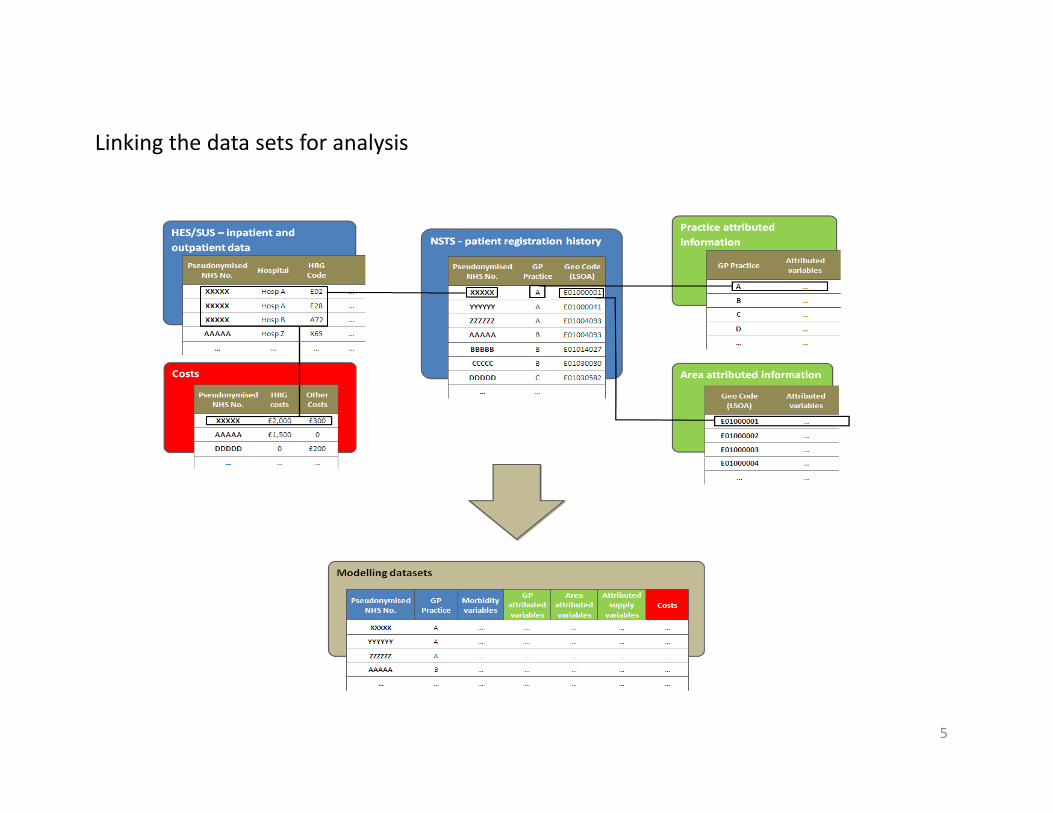
Linking the data sets for analysisg y
5
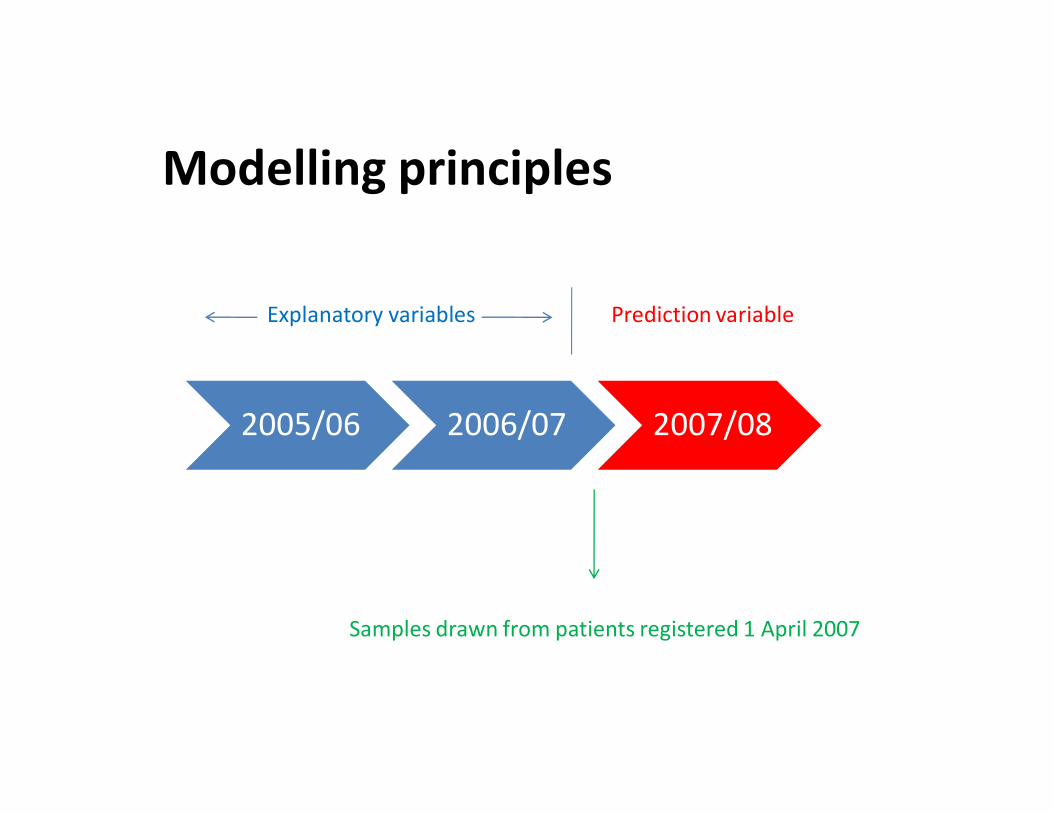
d lli i i lModelling principles
Explanatory variables Prediction variable
2005/06 2006/07 2007/08
Samples drawn from patients registered 1 April 2007
6
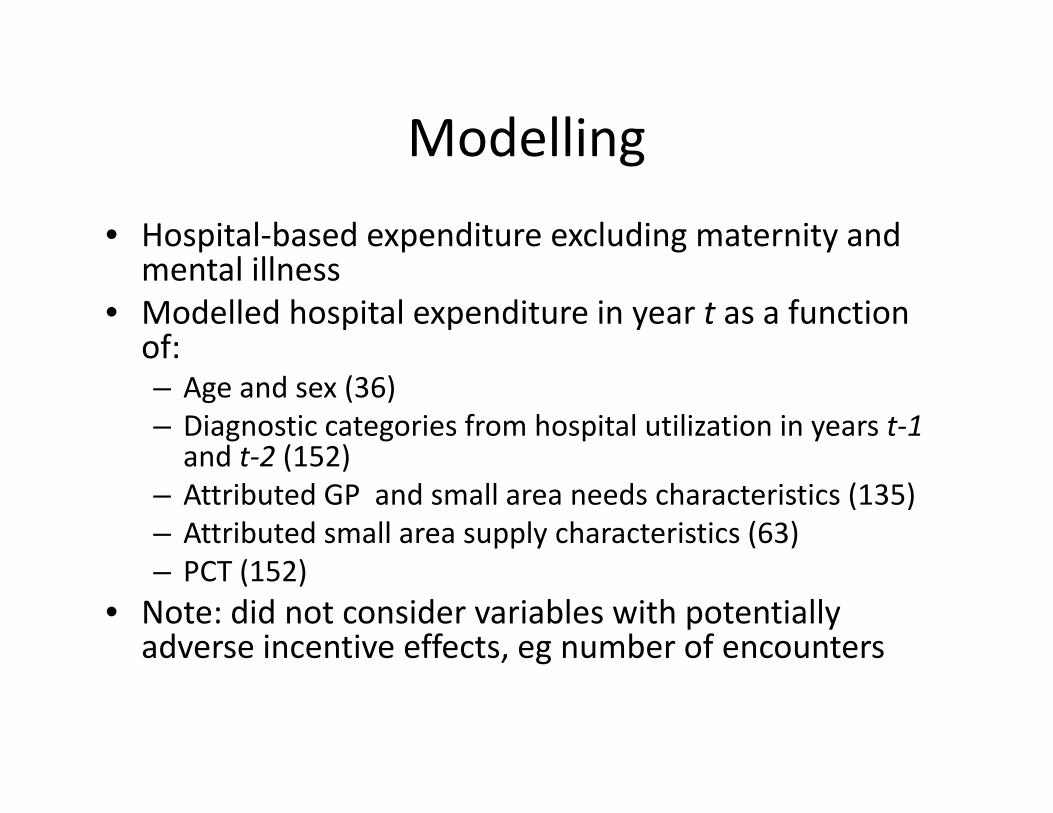
ModellingModelling
• Hospital‐based expenditure excluding maternity and mental illness
• Modelled hospital expenditure in year t as a function of:of:– Age and sex (36)– Diagnostic categories from hospital utilization in years t‐1and t‐2 (152)and t‐2 (152)
– Attributed GP and small area needs characteristics (135)– Attributed small area supply characteristics (63)
( )– PCT (152)• Note: did not consider variables with potentially adverse incentive effects, eg number of encountersg
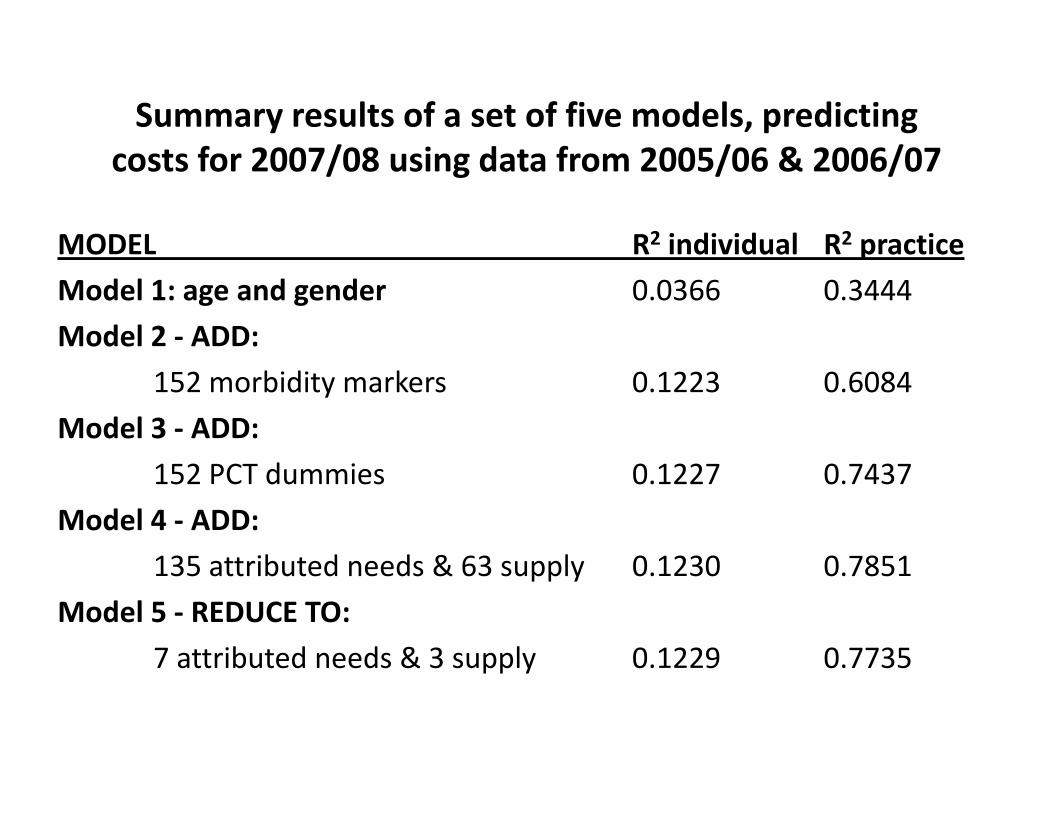
Summary results of a set of five models, predicting t f 2007/08 i d t f 2005/06 & 2006/07costs for 2007/08 using data from 2005/06 & 2006/07
MODEL R2 individual R2 practiceMODEL R individual R practice
Model 1: age and gender 0.0366 0.3444
Model 2 ‐ ADD:
152 morbidity markers 0.1223 0.6084
Model 3 ‐ ADD:
152 PCT dummies 0.1227 0.7437
Model 4 ‐ ADD:
135 tt ib t d d & 63 l 0 1230 0 7851135 attributed needs & 63 supply 0.1230 0.7851
Model 5 ‐ REDUCE TO:
7 attributed needs & 3 supply 0 1229 0 77357 attributed needs & 3 supply 0.1229 0.7735
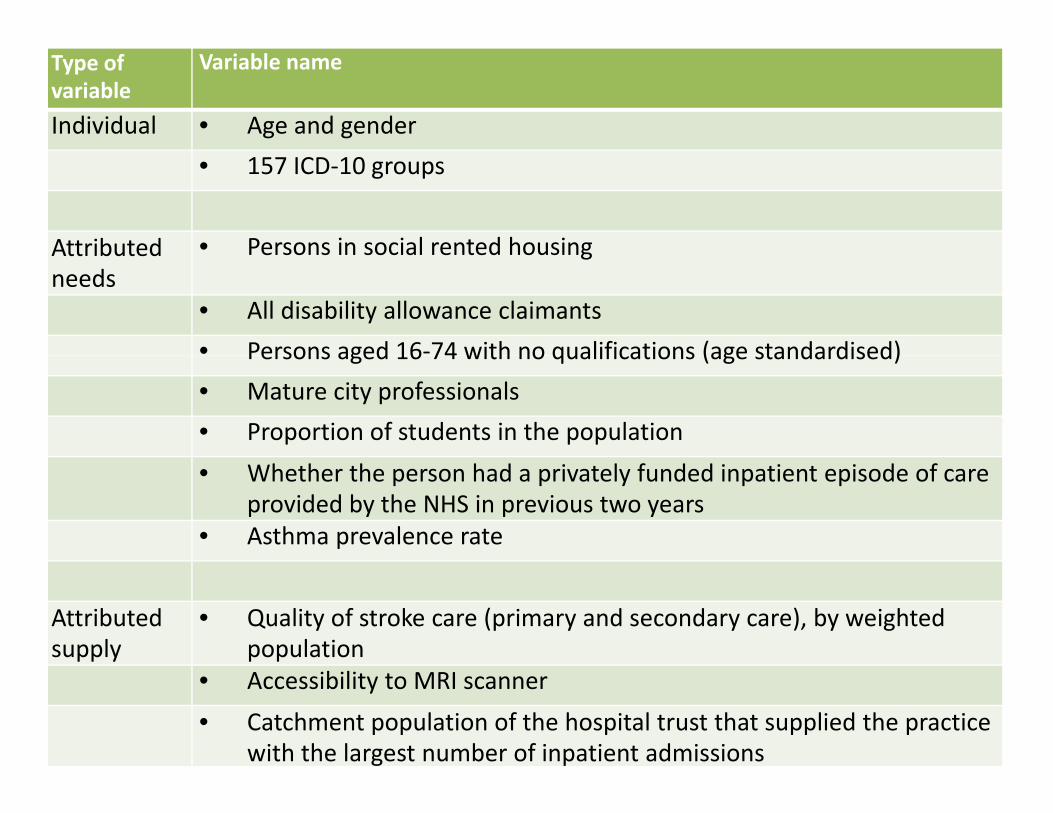
Type of variable
Variable name
Individual • Age and gender
• 157 ICD‐10 groups
Attributed • Persons in social rented housingAttributed needs
Persons in social rented housing
• All disability allowance claimants
• Persons aged 16‐74 with no qualifications (age standardised)Persons aged 16 74 with no qualifications (age standardised)
• Mature city professionals
• Proportion of students in the population
• Whether the person had a privately funded inpatient episode of care provided by the NHS in previous two years
• Asthma prevalence rate
Attributed supply
• Quality of stroke care (primary and secondary care), by weighted population
• Accessibility to MRI scanner
• Catchment population of the hospital trust that supplied the practice with the largest number of inpatient admissions
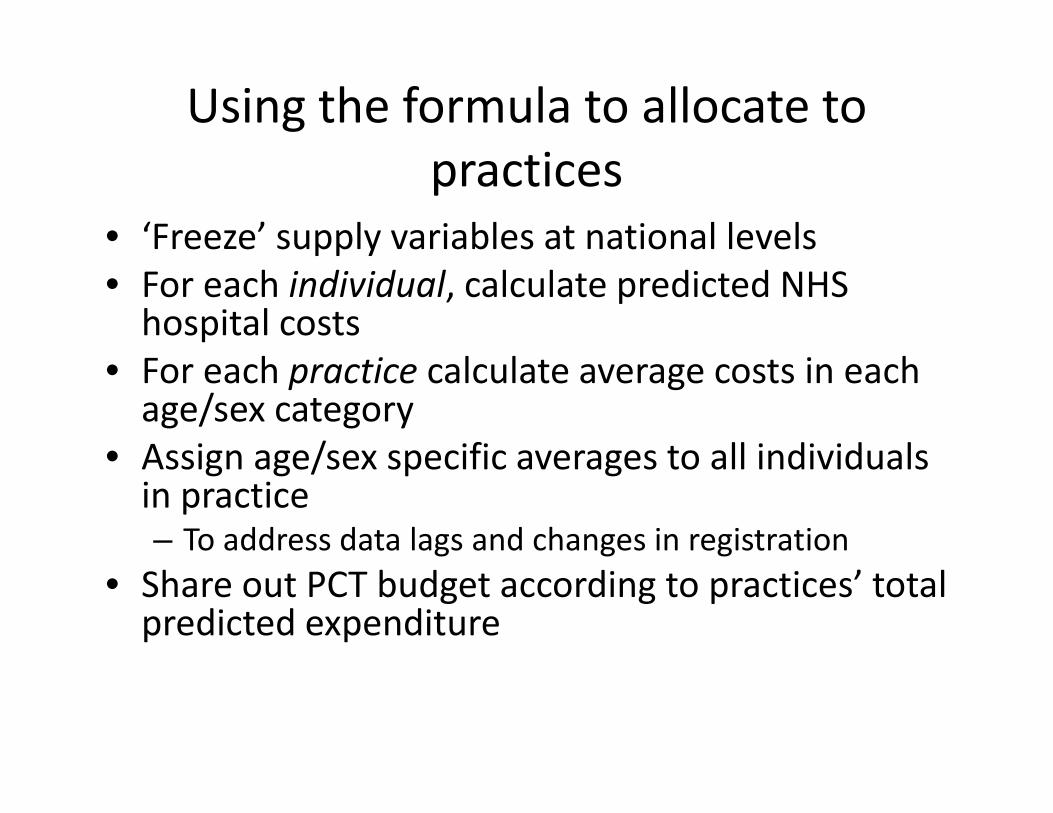
Using the formula to allocate to practices
• ‘Freeze’ supply variables at national levelspp y• For each individual, calculate predicted NHS hospital costs
• For each practice calculate average costs in each age/sex category
• Assign age/sex specific averages to all individuals• Assign age/sex specific averages to all individuals in practice– To address data lags and changes in registration
• Share out PCT budget according to practices’ total predicted expenditure
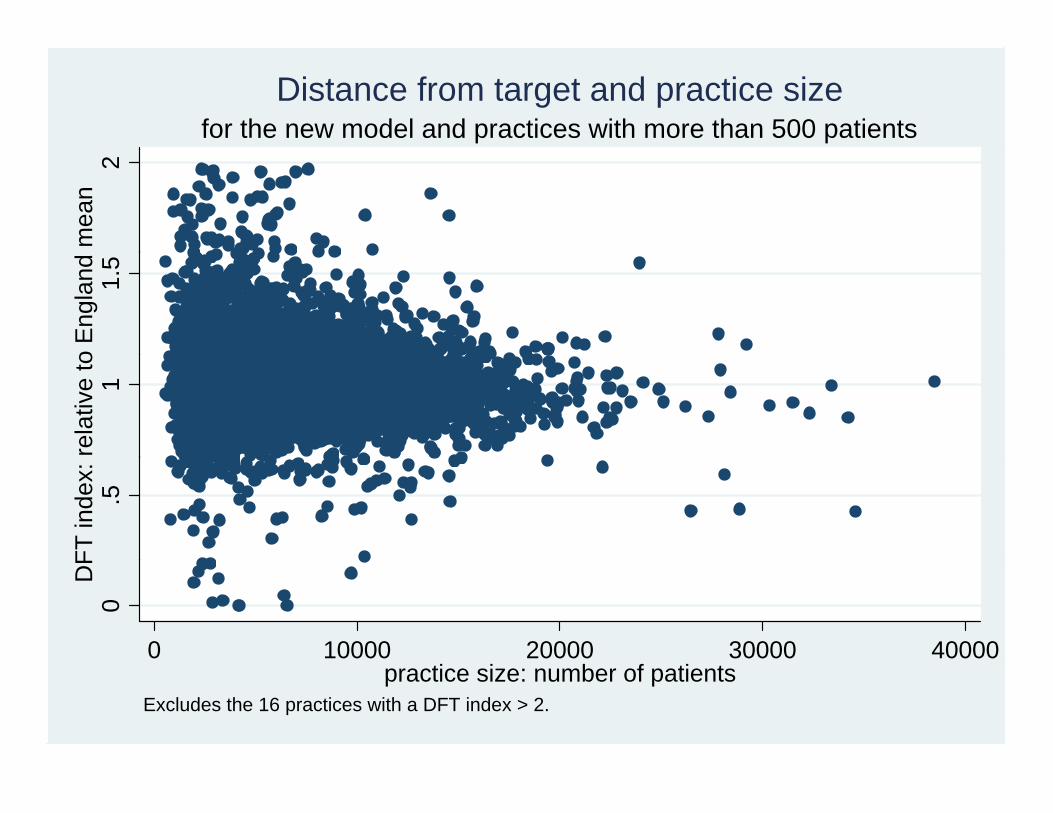
for the new model and practices with more than 500 patientsDistance from target and practice size
2m
ean
1.5
o E
ngla
nd
1re
lativ
e to
.5FT
inde
x:
0D
F
0 10000 20000 30000 40000practice size: number of patients
Excludes the 16 practices with a DFT index > 2.
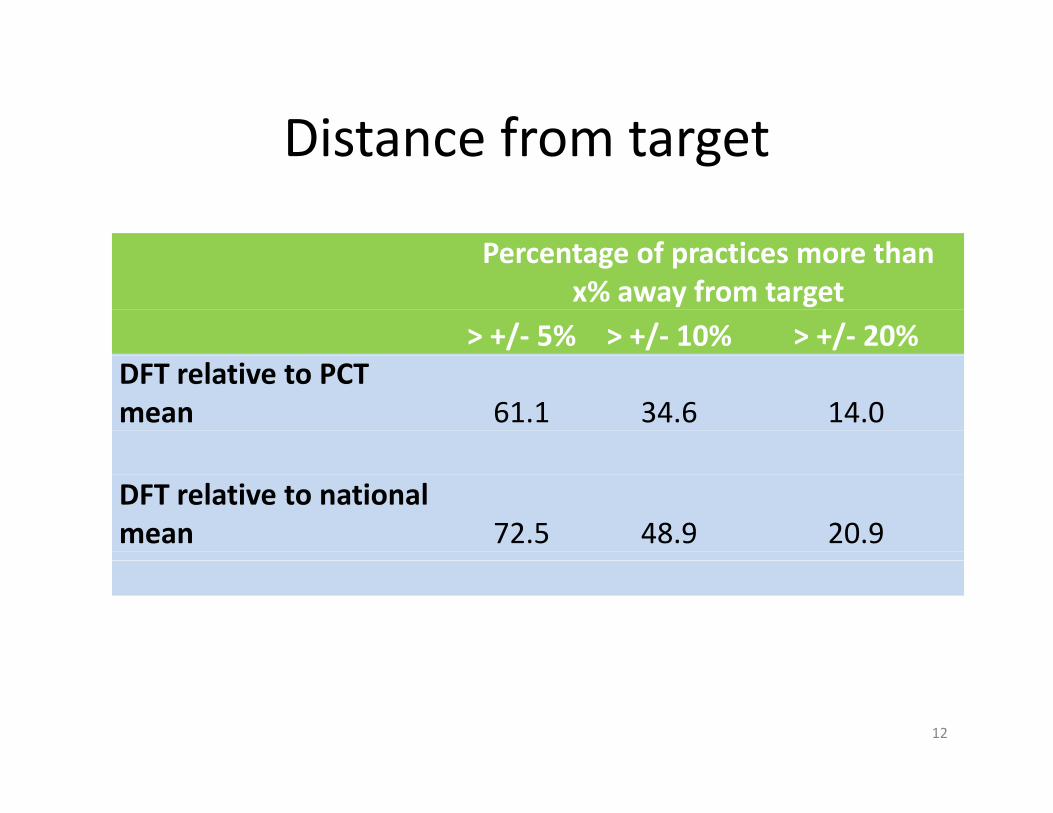
Distance from targetDistance from target
Percentage of practices more thanPercentage of practices more than x% away from target
> +/‐ 5% > +/‐ 10% > +/‐ 20%DFT relative to PCT mean 61.1 34.6 14.0
DFT relative to national mean 72.5 48.9 20.9
12
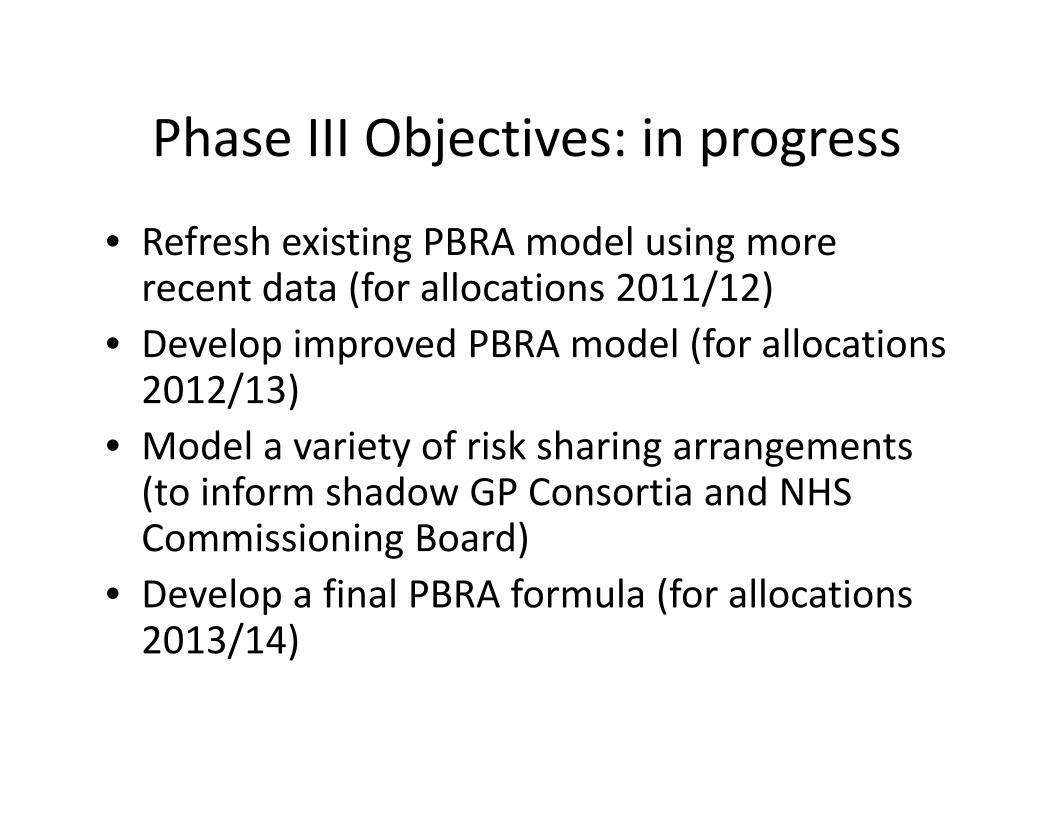
Phase III Objectives: in progressPhase III Objectives: in progress
• Refresh existing PBRA model using moreRefresh existing PBRA model using more recent data (for allocations 2011/12)
• Develop improved PBRA model (for allocationsDevelop improved PBRA model (for allocations 2012/13)
• Model a variety of risk sharing arrangementsModel a variety of risk sharing arrangements (to inform shadow GP Consortia and NHS Commissioning Board)
• Develop a final PBRA formula (for allocations 2013/14)
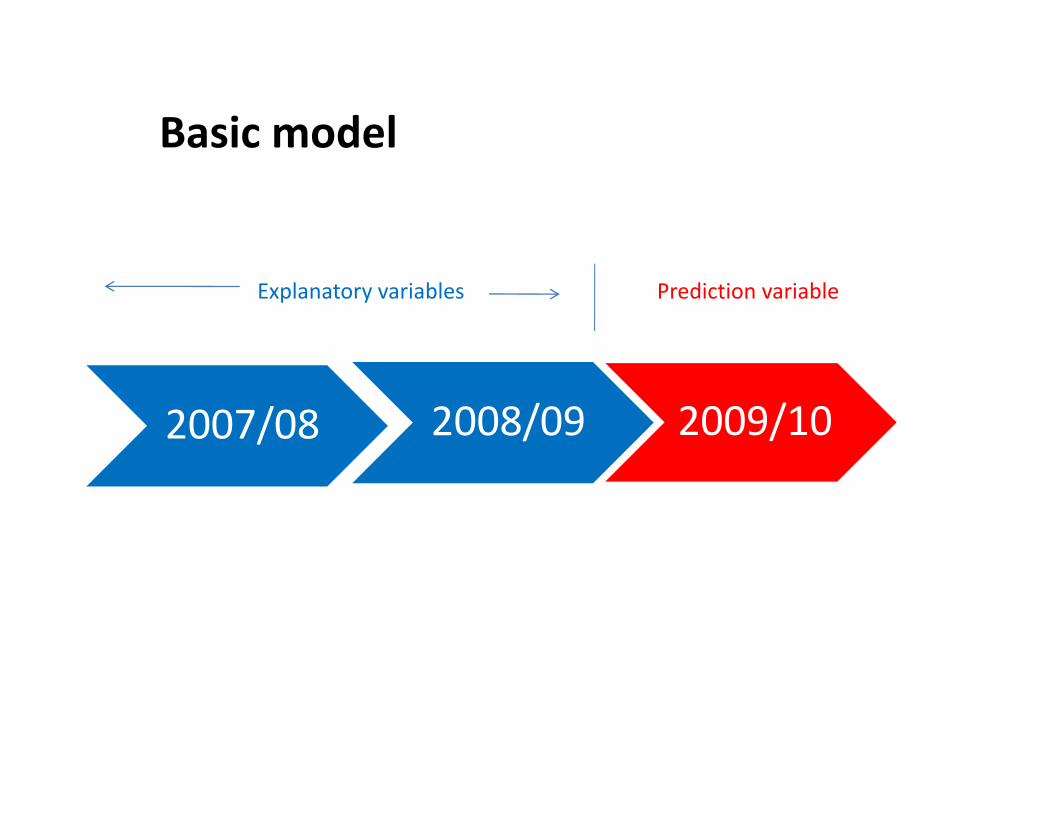
Basic model
Explanatory variables Prediction variable
2007/08 2009/102008/09
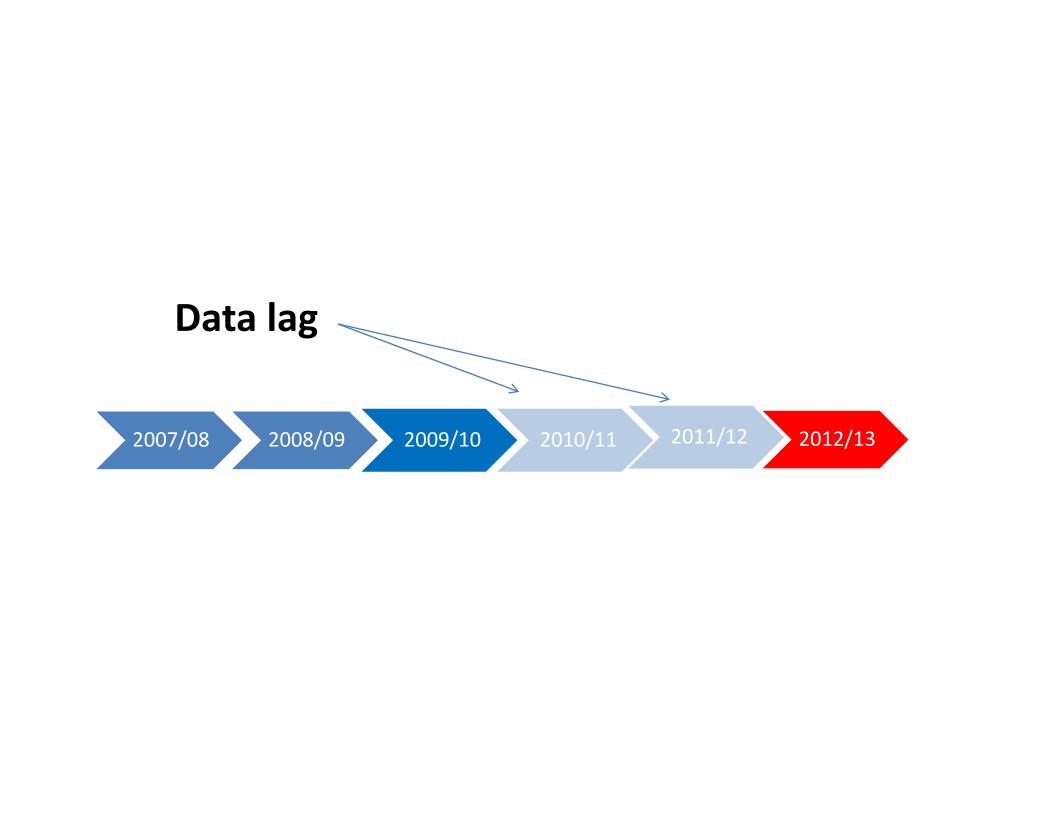
Data lag
2007/08 2008/09 2009/10 2010/11 2012/132011/12
GP budgets and risk:’ b h b fwe’ve been here before
• GP fundholding c.1991g• Total fundholding c.1995• ‘Primary Care Groups’ c.1998• Practice based commissioning c.2002
Martin, S., Rice, N. and Smith, P. (1998), “Risk and the general practitioner budget holder”, Social Science and Medicine, 47(10), 1547‐1554.
Smith, P. (1999), “Setting budgets for general practice in the New NHS”, British Medical Journal, 318, 776‐779.
FundholdingFundholding
• Relatively generous budgetsRelatively generous budgets
• Limited set of elective conditions plus prescribing coveredprescribing covered
• Per patient limit £6000
• Overspends largely borne by Health Authority
• Underspends kept by practice for patient p p y p pservices
• A very ‘soft’ budgetA very soft budget
Decomposing the variation in practice dexpenditure
• The formula captures average clinical responses p g pto measured patient and area characteristics. Therefore any variation from the formula will be due to:due to:– Variations in clinical practice;– Variations in the prices of treatments used by the practice;
– Imperfections in the formula caused by known patient characteristics that are not captured in the formula;p ;
– Random (chance) variations in levels of sickness within the practice population.
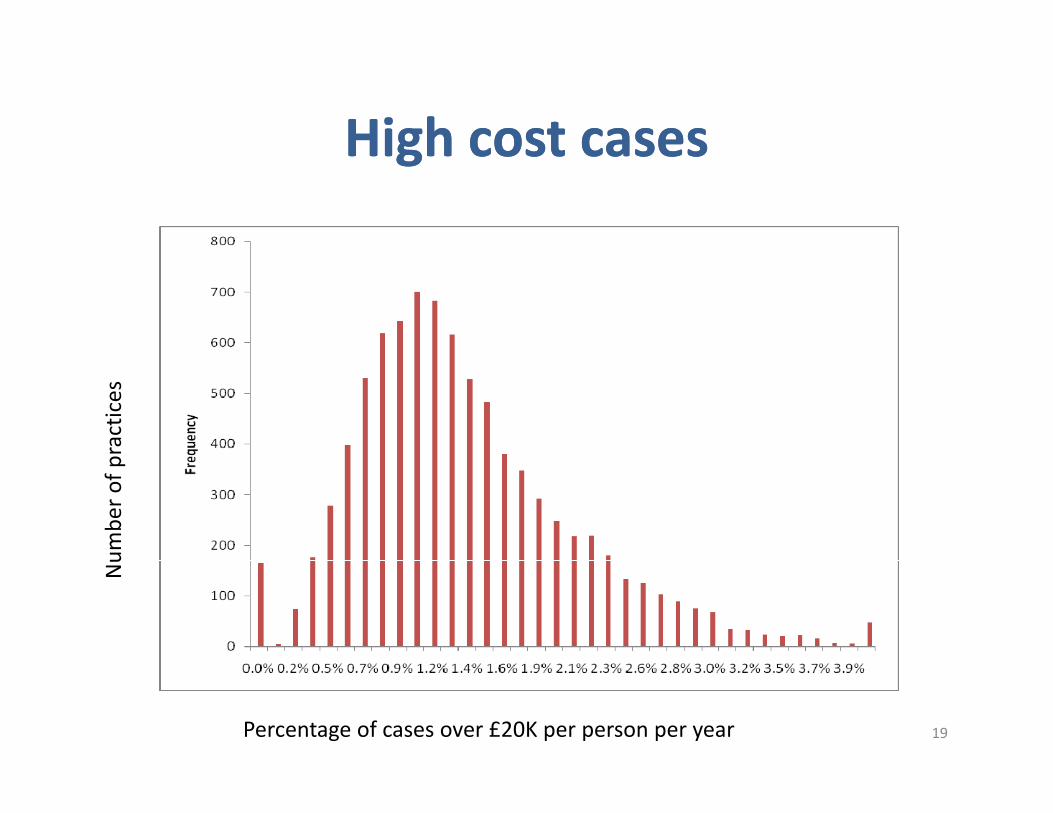
High cost casesHigh cost casesHigh cost casesHigh cost casespractices
umbe
r of p
Nu
Percentage of cases over £20K per person per year 19
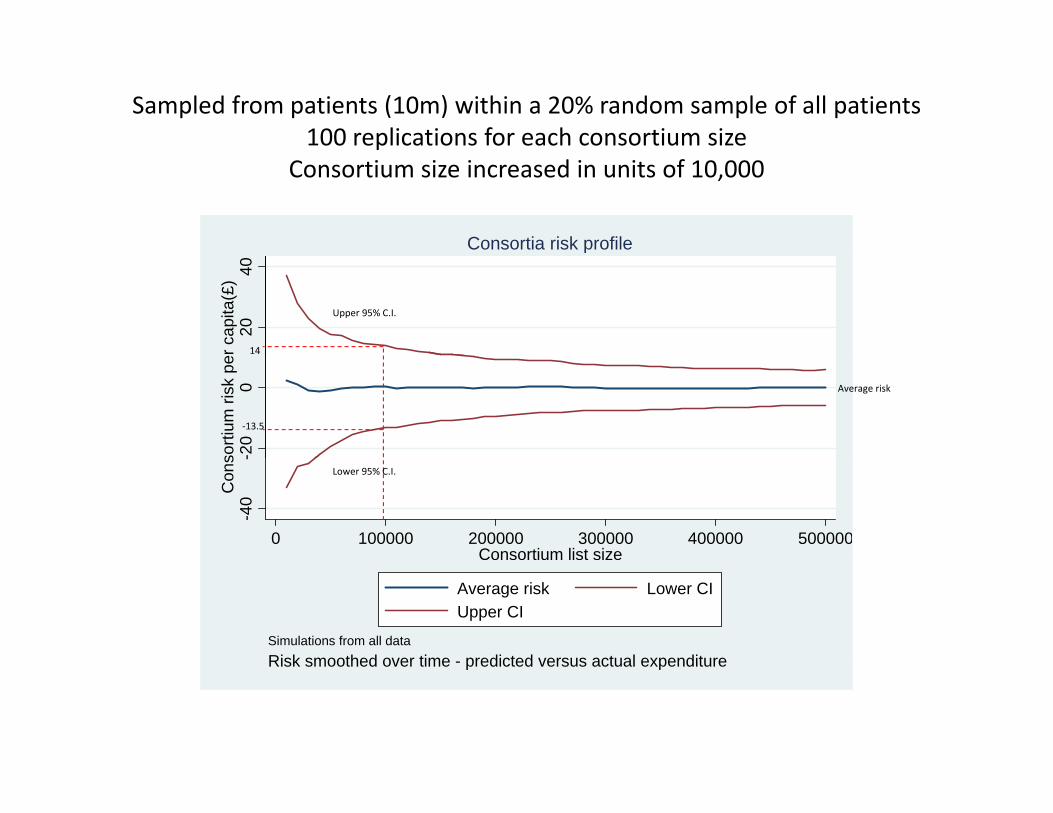
Sampled from patients (10m) within a 20% random sample of all patients100 replications for each consortium size
Consortium size increased in units of 10,000
Consortia risk profile20
40r c
apita
(£)
p
14
Upper 95% C.I.
-20
0so
rtium
risk
pe
‐13.5
Average risk
-40
-C
ons
0 100000 200000 300000 400000 500000Consortium list size
Lower 95% C.I.
Average risk Lower CIUpper CI
Simulations from all dataRisk smoothed over time - predicted versus actual expenditureRisk smoothed over time predicted versus actual expenditure
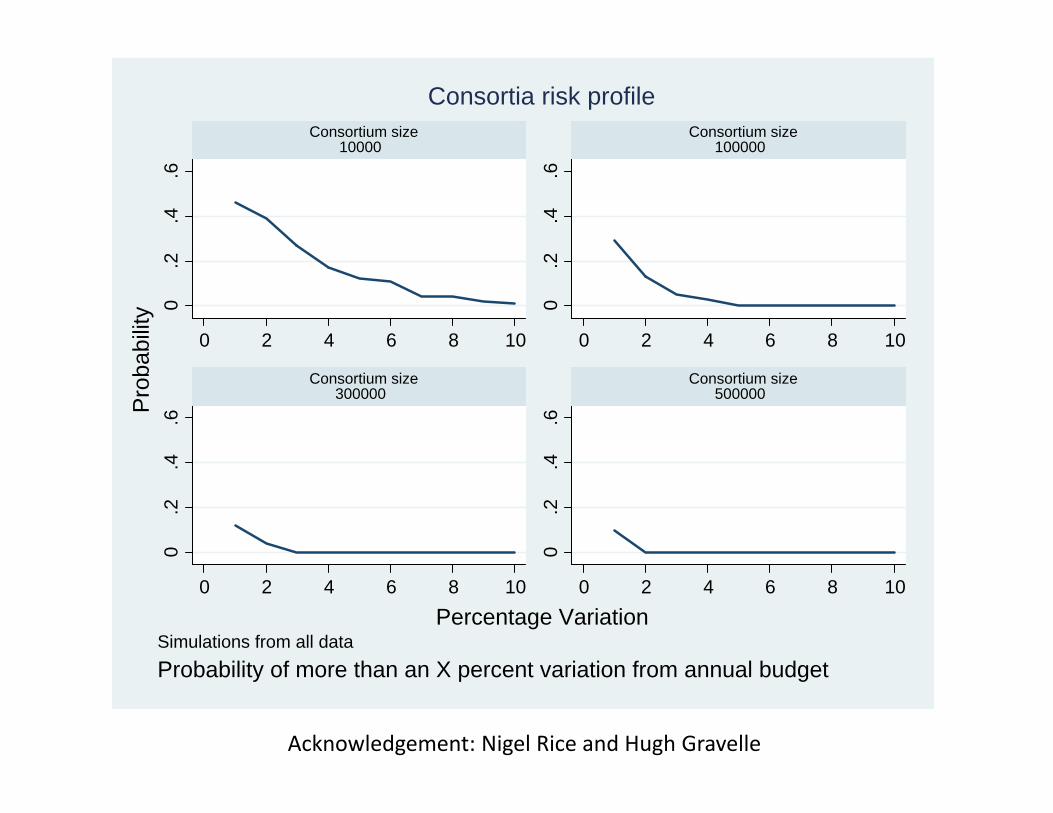
Consortium size10000
Consortium size100000
Consortia risk profile
.4.6
.4.6
10000 100000
0.2
0.2
0 2 4 6 8 10 0 2 4 6 8 10
abilit
y4
.6
4.6
Consortium size300000
Consortium size500000P
roba
0.2
.4
0.2
.4
0 2 4 6 8 10 0 2 4 6 8 10Percentage Variation
Simulations from all dataP b bilit f th X t i ti f l b d tProbability of more than an X percent variation from annual budget
Acknowledgement: Nigel Rice and Hugh Gravelle
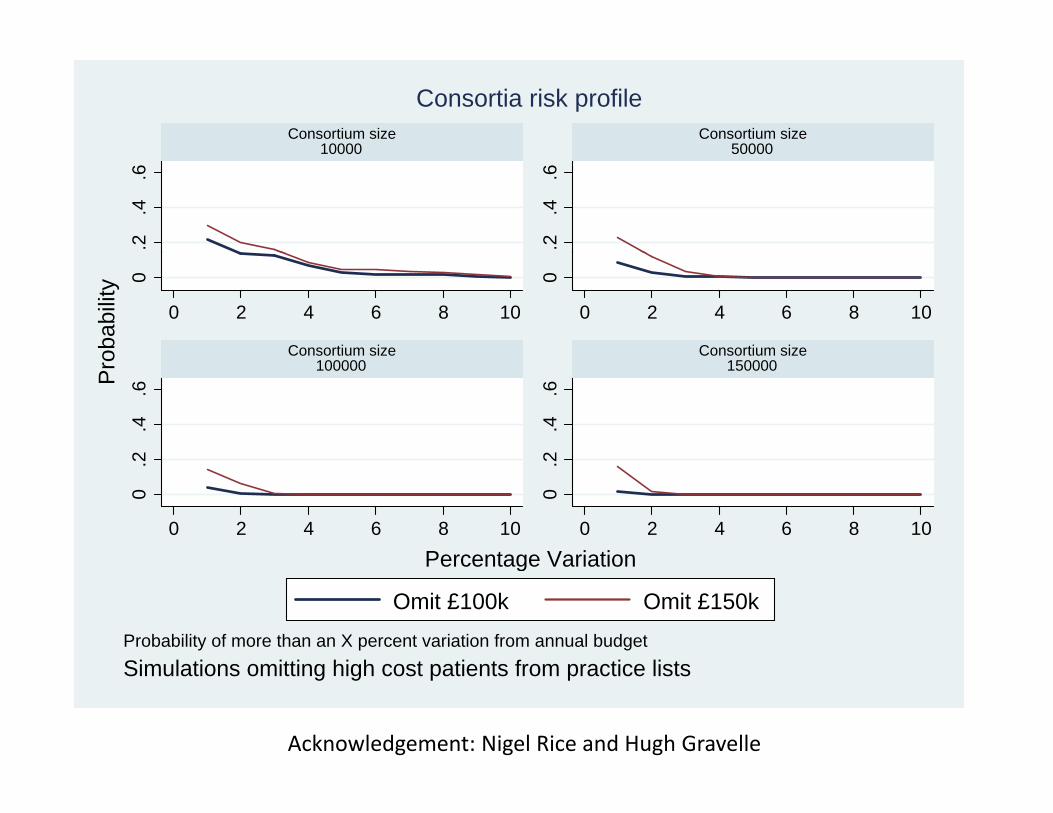
Consortium size10000
Consortium size50000
Consortia risk profile.2
.4.6
.2.4
.6
10000 500000 0
0 2 4 6 8 10 0 2 4 6 8 10
Consortium size Consortium sizeobab
ility
2.4
.6
2.4
.6
Consortium size100000
Consortium size150000P
ro0
.2
0.2
0 2 4 6 8 10 0 2 4 6 8 10
Percentage Variation
Omit £100k Omit £150k
Percentage Variation
Probability of more than an X percent variation from annual budgetSi l ti itti hi h t ti t f ti li tSimulations omitting high cost patients from practice lists
Acknowledgement: Nigel Rice and Hugh Gravelle
Some possible consequences of ‘hard’ b dbudget constraints
• Practices that perceive that their expenditure will fall below their b d t “ d ” i d t t t th i b d t itibudget may “spend up” in order to protect their budgetary position in future years;
• Practices that perceive that their expenditure will exceed their budget may be thrown into crisis as they seek to conform to thebudget may be thrown into crisis as they seek to conform to the budget;
• Patients may be treated inequitably. Different practices will be under different budgetary pressures, and so may adopt different treatment practices.
• Within a practice, choice of treatment may vary over the course of a year if the practice’s perception of its budgetary position changes.G l i d i f d f i h• General practices may adopt a variety of defensive stratagems, such as cream skimming patients they perceive to be healthier than implied by their capitation payment.
Some budgetary risk management strategies
• Pooling practices• Pooling years• Excluding predictably expensive patients• ‘Carving out’ certain procedures or services• Carving out certain procedures or services• Analysis of reasons for variations from budgets• Allowing some reinsurance of risk
– Limiting liability on individual episode– Limiting liability on individual patient– Risk sharing– Retention of a contingency fund– Etc
• Making sanctions and rewards proportionateg p p