Embed Size (px)
DESCRIPTION
Michele Sutherland presented this at the 2014 Reducing Avoidable Pressure Injuries conference. The conference highlights medico leagl issues in the care of pressure injury patients, integration into practice and gaining senior support, three E's to pressure injury prevention, risk screening and continuum of care from hospital to community. You can find out more about next year's conference at http://bit.ly/1sjS6BO
Citation preview

Reducing avoidable pressure injuries
Applying Pressure to the
Data.
What Can it Tell Us?
Michele Sutherland
Safety and Quality Unit
SA Department of Health

SA Health

SA Health
Introduction and overview
Pressure injuries are preventable.
> Data is most useful for us when it;
• identifies where the biggest problems
are
• guides us as to what to do next
> There are two main sources of data about
pressure injury in SA for 2013-14
• incidents during health care
• coded data
Understand the strengths and limits of
your data

SA Health
2 sources of data for all of SA
1. ICD-10 AM coded hospital data • All admissions that include
L89.0 (stage 1)
L89.1 (stage 2)
L89.2 (stage 3)
L89.3 (stage 4) and
L89.9 (stage unspecified)
• Diagnoses
• Length of stay
> Analysis of COF 1 pressure injury
• Condition onset flag (COF code)
1= * condition arose in hospital
2= condition arose prior to admission

SA Health
SA sources of data 2. Safety Learning System
The SA system for reporting incidents during health
care.
Pressure injury fields are quite new.
• Stage (1, 2, 3, 4, suspected deep, unstageable
and unknown)
• Whether the PI was
* New
Present on admission from home or external
provider
Worsening of existing, or observed after internal
transfer
• Contributing factors and interventions in place
Analysis of New PI

SA Health
What do we want the data to tell us?
Questions…
> How big / serious is the problem?
> What are the implications for people who
have pressure injuries?
> How do the 2 data sets line up?

SA Health
Comparison between ICD-10 and SLS
Total number of
pressure injuries
2012-13 2013-14
Coded from medical
records (ICD-10)
2434 2826
Reported to Safety
Learning System
(SLS)
461 1333

SA Health
Comparison between ICD-10 and SLS
Total number of
pressure injuries
2012-13 2013-14
Coded from medical
records (ICD-10)
2434 2826
* COF 1 - 709
(25%)
Reported to Safety
Learning System
(SLS)
461 1333
* New - 798
(60%)

SA Health
Stages of Pressure Injury (2013/14)
ICD-10
(COF 1, n=709)
SLS
(New n=798)
Stage 1 38 % 42 %
Stage 2 27 % 41 %
Stage 3 8 % 2 %
Stage 4 6 % 0.5 %
Unstageable - 6 %
Suspected deep - 0.5 %
Stage unknown,
unspecified
18 % 8 %

SA Health
Stages of Pressure Injury (2013/14)
ICD-10
(COF 1, n=709)
SLS
(New n=798)
Stage 1 38 % 42 %
Stage 2 27 % 41 %
Stage 1&2 65% 83%
Stage 3 8 % 2 %
Stage 4 6 % 0.5 %
Unstageable - 6 %
Suspected deep - 0.5 %
Stage unknown,
unspecified
18 % 8 %

SA Health
Admitted from…? Discharged to…?
(ICD-10, n=2826, 2013-14)
COF 1 COF 2
Accommodation type
Home 90 % 79 %
Residential aged care 8 % 16 %
Other 2 % 5 %
Discharge destination
Home 32 % 43 %
Residential aged care 16 % 20 %
Died 17 % 15 %
Other 35 % 22 %

SA Health
What do we want the data to tell us?
Questions…..
> Who is getting PI? How many PI per
person?
> Age, characteristics of patients?
> Length of stay?
> What conditions do they have?

SA Health
0
50
100
150
200
250
300
350
400
1 2 3 4 or more No value
Incidents by Total number of current pressure injury(ies) present (SLS)

SA Health
Age, and length of stay
Average Length of stay, 2013-14
(ICD-10 data)
(NB 80% of patients
were aged 65+)
COF 1 (new, hospital acquired)
All ages 33.1 days
Under 64 years 40 days
COF 2 (prior to admission)
All ages 16.7 days
Under 64 years 22.6 days

SA Health
Analysis by age group and diagnostic
grouping (ICD-10 COF 1)
COF 1
Number % Number of
diagnoses per
person
0-17 23 3 % 12.7 per person
18-64 138 19.5 % 13.2 per person
65+ 548 77.3% 11.7 per person
total 709 100%

SA Health
Pressure injury acquired during admission,
principal diagnosis and all diagnoses (n= 709,COF=, ICD-10)
0
5
10
15
20
25
A a
nd
B
C a
nd
D E F G I J K
L
M
N
O, P
an
d Q
R
S an
d T
U, W
, X a
nd
Y Z
Principal diagnosis All diagnoses

SA Health
COF 1 (n= 709 ) Principal diagnosis All diagnoses A and B 3.8 6.6 C and D 15.1 7.2 E 3.4 13.1 F 1.5 3.4 G 1.9 2.1 I 11.6 10 J 13.5 7 K 9.5 5.3 L 1.4 1.6 M 6.8 2.8 N 4.5 6.2
O, P and Q 1.5 1.3 R 3.5 14 S and T 21.2 6.5
U, W, X and Y 0 3.3 Z 0.6 8.9

SA Health
Diagnostic group
(PI COF=1) 0-17 years (%), n= 23
18-64 years (%),n=138
65+ years (%), n=548
A and B 6.2 7.9 6.3 C and D 2.1 9.1 6.9 E 4.8 12.9 13.5 F 2.7 4.2 3.2 G 1.7 2.6 2 H 0.3 0.4 0.7 I 3.4 8.1 10.8 J 5.8 7.5 6.9 K 7.5 5.6 5.1
L (except L89) 2.7 1.7 1.5 M 0.6 2.6 2.9 N 0.6 5.6 6.6 R 5.8 11.4 15.1 O, P and Q 29.8 1.4 0 S and T 13.7 7.8 5.9
U, W, X and Y 2.1 3.1 3.5 Z 9.9 8.3 8.9

SA Health
Diagnostic group (PI COF=1)
0-17 years (%), n= 23
18-64 years (%),
n=138 65+ years (%), n=548
A and B 6.2 7.9 6.3
C and D 2.1 9.1 6.9
E 4.8 12.9 13.5
F 2.7 4.2 3.2
G 1.7 2.6 2
H 0.3 0.4 0.7
I 3.4 8.1 10.8
J 5.8 7.5 6.9
K 7.5 5.6 5.1
L (except L89) 2.7 1.7 1.5
M 0.6 2.6 2.9
N 0.6 5.6 6.6
R 5.8 11.4 15.1
O, P and Q 29.8 1.4 0
S and T 13.7 7.8 5.9
U, W, X and Y 2.1 3.1 3.5
Z 9.9 8.3 8.9

SA Health
Diagnostic group
(PI COF=1) 0-17 years (%), n= 23
18-64 years (%),n=138
65+ years (%), n=548
A and B 6.2 7.9 6.3 C and D 2.1 9.1 6.9 E 4.8 12.9 13.5 F 2.7 4.2 3.2 G 1.7 2.6 2 H 0.3 0.4 0.7 I 3.4 8.1 10.8 J 5.8 7.5 6.9 K 7.5 5.6 5.1
L (except L89) 2.7 1.7 1.5 M 0.6 2.6 2.9 N 0.6 5.6 6.6 R 5.8 11.4 15.1 O, P and Q 29.8 1.4 0 S and T 13.7 7.8 5.9
U, W, X and Y 2.1 3.1 3.5 Z 9.9 8.3 8.9

SA Health

SA Health
What do we want the data to tell
us?
Questions…..
Our aim is prevention
> What are the problem areas?
> What to do next ……………………..
SA Health
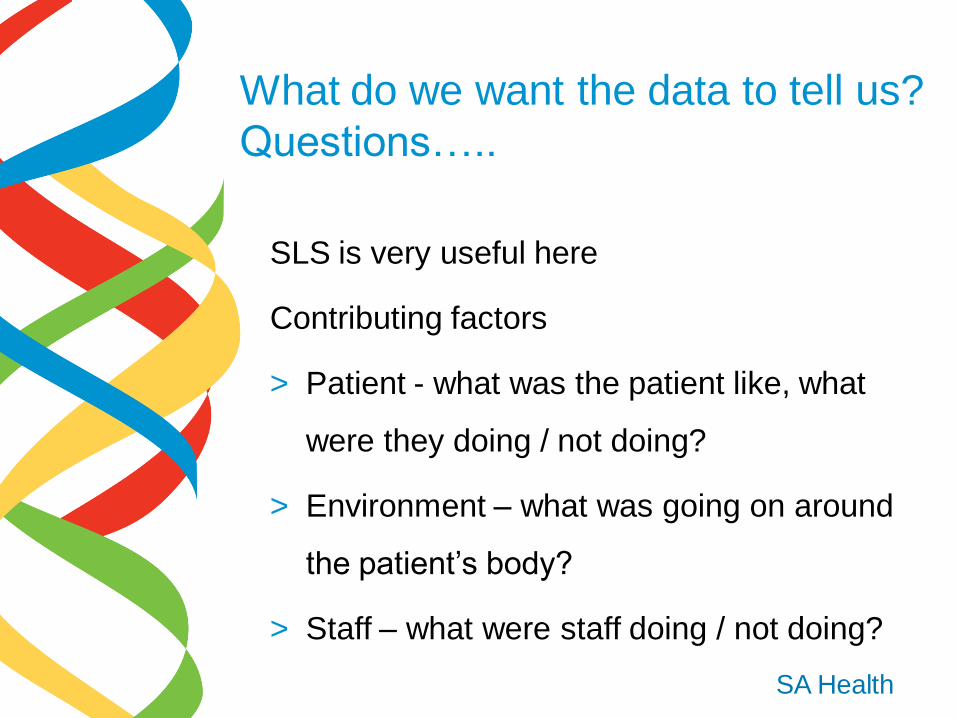
What do we want the data to tell us?
Questions…..
SLS is very useful here
Contributing factors
> Patient - what was the patient like, what
were they doing / not doing?
> Environment – what was going on around
the patient’s body?
> Staff – what were staff doing / not doing?

SA Health
Contributing factors - Patient factors (SLS, n=515, 3.2 factors per patient)
% of reports where this was selected
Impaired mobility 66.6%
Low levels of activity 55.1%
Poor nutritional status / malnutrition 36.1%
Underweight or obese 29.1%
Impaired body sensation 28.0%
Difficulty complying with prevention strategies 20.8%
Palliative, frail 20.4%
Impaired circulation or perfusion 20.2%
Oedema, swelling 15.9%
Long period of anaesthesia or sedation 11.1%
History of pressure injury(s) in the last two years 8.5%
Rash, dermatological condition(s) 3.9%
None of the above 4.7%

SA Health
The physical environment, type of
service
Location - where ?
> 69% in acute wards
> 18% in residential aged care
> 13% - other settings
Presence of moisture, pressure, shear,
friction, devices in contact with skin etc
SA Health

SA Health
Contributing factors - Environmental (SLS, n=501, 2.1 factors per patient)
% of reports where this was selected
Exposure to pressure 74.0%
Exposure to friction 37.0%
Exposure to shearing forces 29.4%
Exposure to moisture 28.0%
Presence of device(s) in contact with skin 20.8%
Exposure to poor hygiene / skin irritants 10.0%
Exposure to high skin temperatures 4.8%
None of the above 6.6%

SA Health

SA Health
What was in place to prevent the
pressure injury?
> Was there a current risk assessment?
> What equipment / strategies were in place
eg pressure mattress?
> What nursing strategies were in place?
> What team members were involved?
> Was there discussion with patient, care,
family?
SA Health

SA Health
Intervention Strategies in use / in place (SLS n= 498, 4.7 interventions per patient)
% of reports where this was selected
Current assessment of pressure risk and skin 71.3%
Pressure - eliminate or redistribute using equipment or other 55.2%
Re-positioning routine 53.2%
Encourage and assist patient positioning and mobility 46.6%
Current pressure injury prevention plan and handover 43.6%
Skin hygiene and moisture reduction strategies 37.1%
Friction - eliminate or reduce using equipment or other 28.5%
Pain assessment and management 24.1%
Manual handling technique(s) to reduce skin trauma 22.1%
Shearing - eliminate or reduce using equipment or other 21.9%
Oral nutrition supplements, feeding assistance 19.5%
Referral(s) and multidisciplinary team involved 18.3%
Consumer, family, carers involved 17.1%
Discharge planning 4.6%
None of the above 4.4%

SA Health
What went wrong?
> What good things didn’t happen? What
bad things happened?
> What was missing from the care? (delay
or failure in care)
> Did staff know what to do / what not to do?
(staff training)
> Did all staff in care team know what the
risks and plan was? (communication,
team work)
> Staff thoughts about what could have
prevented the PI?
> Was the right care provided afterwards to
promote healing / minimise harm?

SA Health

SA Health
Consumer involvement
> Were the patient and carer(s) informed)?
Safety Learning System
> 154 reports indicated that consumer,
family carer involved (18%)
> Additional analysis including the
managers report section indicated that
1006 (75%) of all 1333 PI reports to SLS
there was information provided, discussed

SA Health
Thank you
Any questions?
Safety and Quality unit
Department for Health and Ageing, SA
http://www.sahealth.sa.gov.au/wps/wcm/con
nect/Public+Content/SA+Health+Internet/Cli
nical+resources/Safety+and+quality/