Embed Size (px)
Citation preview
Medical and Prescription Drug Deductibles for Plans Offered in Federally Facilitated or
Partnership Marketplaces for 2015
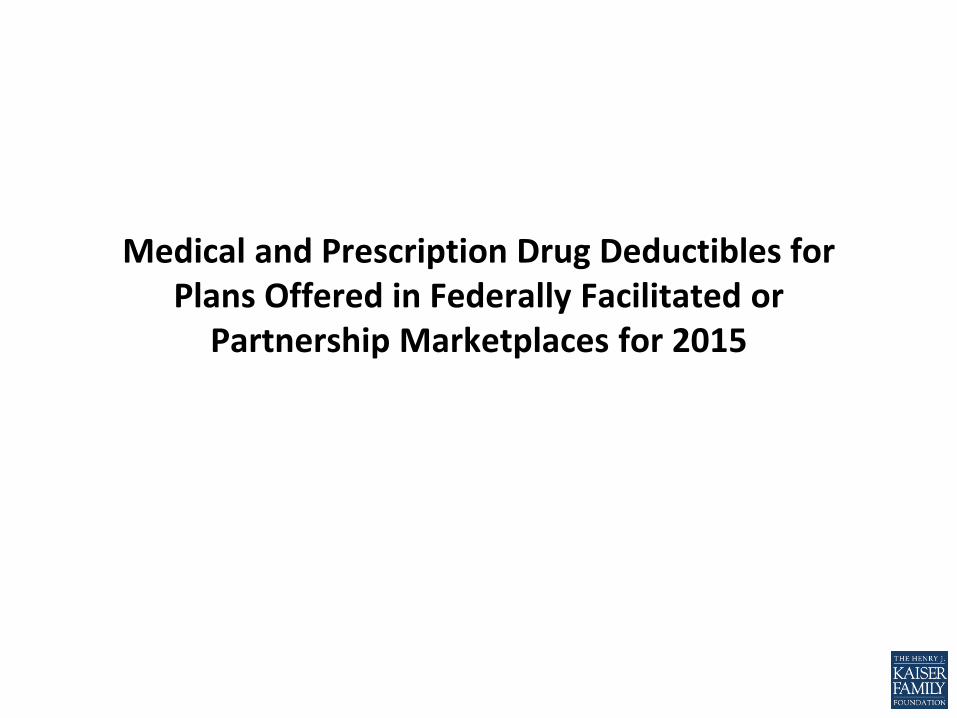
Percent of Plans Where Medical Deductible is Combined with, or Separate from, the Prescription Drug Deductible
91%
55%
37% 38%
9%
45%
63% 62%
0%
10%
20%
30%
40%
50%
60%
70%
80%
90%
100%
Bronze Silver Gold Platinum
Separate
Combined
Among Federally Facilitated and Partnership Marketplaces in 2015
SOURCE: Kaiser Family Foundation analysis of Marketplace plans in the 37 states with Federally Facilitated or Partnership exchanges in 2015 (including New Mexico, Oregon, and Nevada). Data are from Healthcare.gov Health plan information for individuals and families available here: https://www.healthcare.gov/health-plan-information/
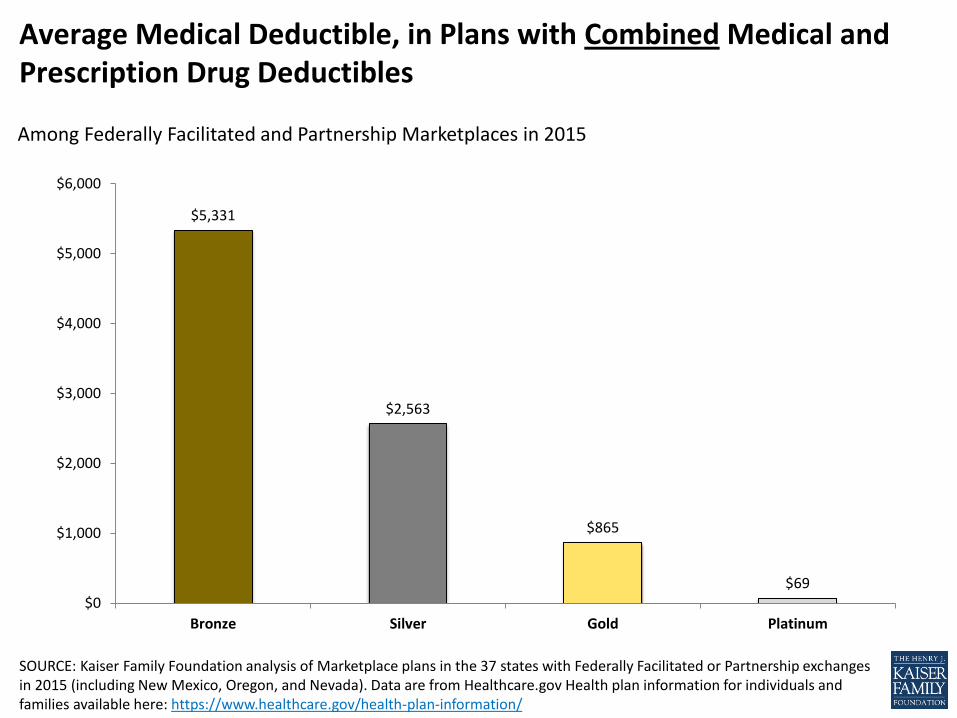
Average Medical Deductible, in Plans with Combined Medical and Prescription Drug Deductibles
$5,331
$2,563
$865
$69 $0
$1,000
$2,000
$3,000
$4,000
$5,000
$6,000
Bronze Silver Gold Platinum
Among Federally Facilitated and Partnership Marketplaces in 2015
SOURCE: Kaiser Family Foundation analysis of Marketplace plans in the 37 states with Federally Facilitated or Partnership exchanges in 2015 (including New Mexico, Oregon, and Nevada). Data are from Healthcare.gov Health plan information for individuals and families available here: https://www.healthcare.gov/health-plan-information/
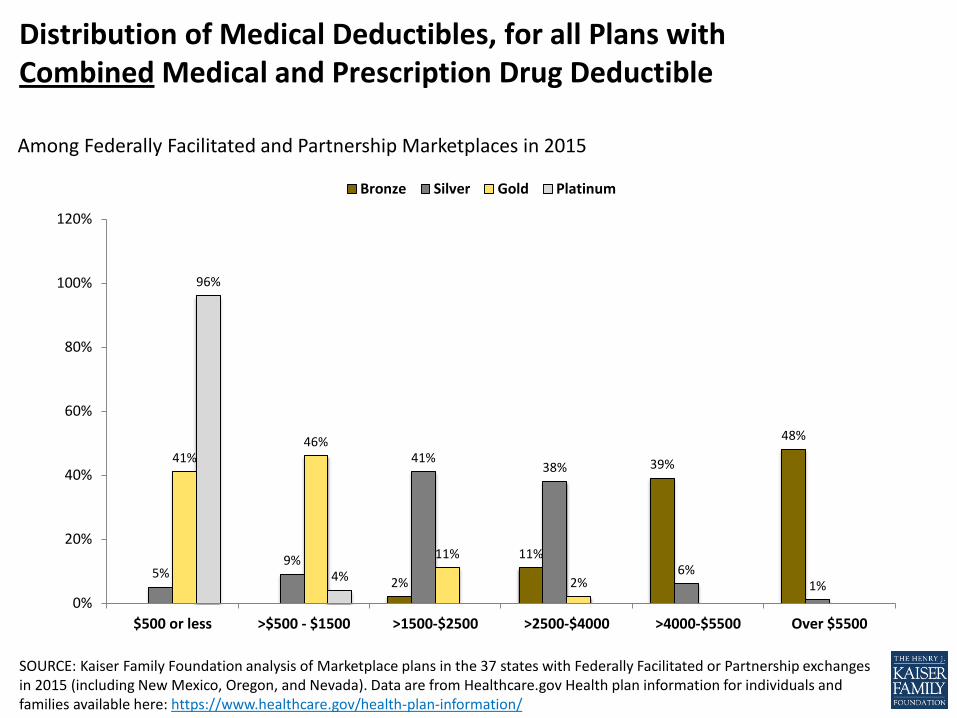
Distribution of Medical Deductibles, for all Plans with Combined Medical and Prescription Drug Deductible
2%
11%
39%
48%
5% 9%
41% 38%
6% 1%
41% 46%
11%
2%
96%
4%
0%
20%
40%
60%
80%
100%
120%
$500 or less >$500 - $1500 >1500-$2500 >2500-$4000 >4000-$5500 Over $5500
Bronze Silver Gold Platinum
Among Federally Facilitated and Partnership Marketplaces in 2015
SOURCE: Kaiser Family Foundation analysis of Marketplace plans in the 37 states with Federally Facilitated or Partnership exchanges in 2015 (including New Mexico, Oregon, and Nevada). Data are from Healthcare.gov Health plan information for individuals and families available here: https://www.healthcare.gov/health-plan-information/
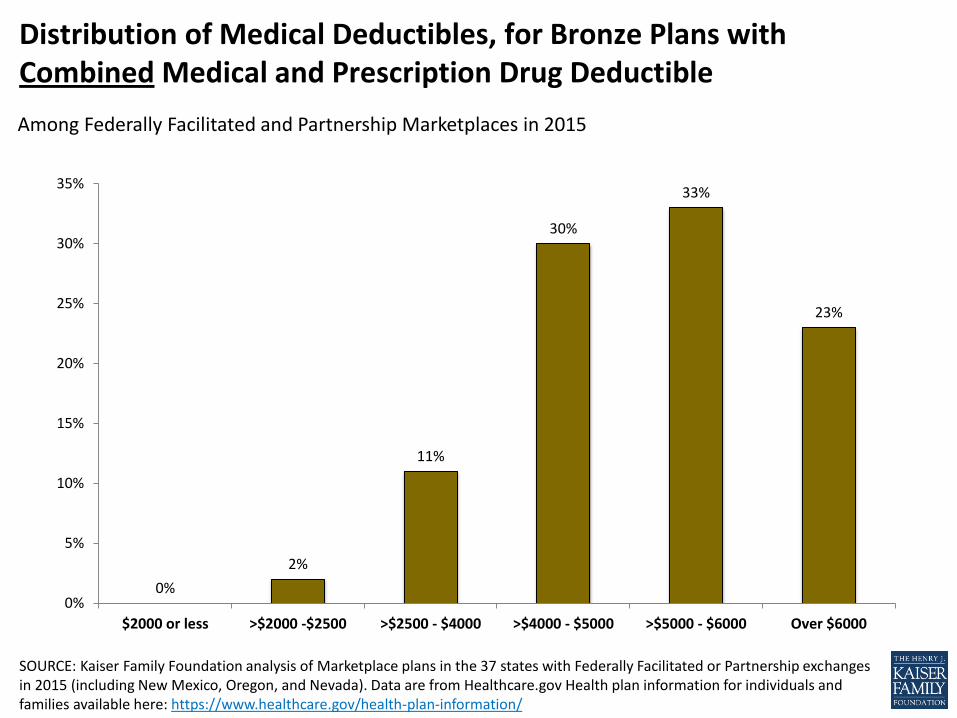
Distribution of Medical Deductibles, for Bronze Plans with Combined Medical and Prescription Drug Deductible
0%
2%
11%
30%
33%
23%
0%
5%
10%
15%
20%
25%
30%
35%
$2000 or less >$2000 -$2500 >$2500 - $4000 >$4000 - $5000 >$5000 - $6000 Over $6000
Among Federally Facilitated and Partnership Marketplaces in 2015
SOURCE: Kaiser Family Foundation analysis of Marketplace plans in the 37 states with Federally Facilitated or Partnership exchanges in 2015 (including New Mexico, Oregon, and Nevada). Data are from Healthcare.gov Health plan information for individuals and families available here: https://www.healthcare.gov/health-plan-information/
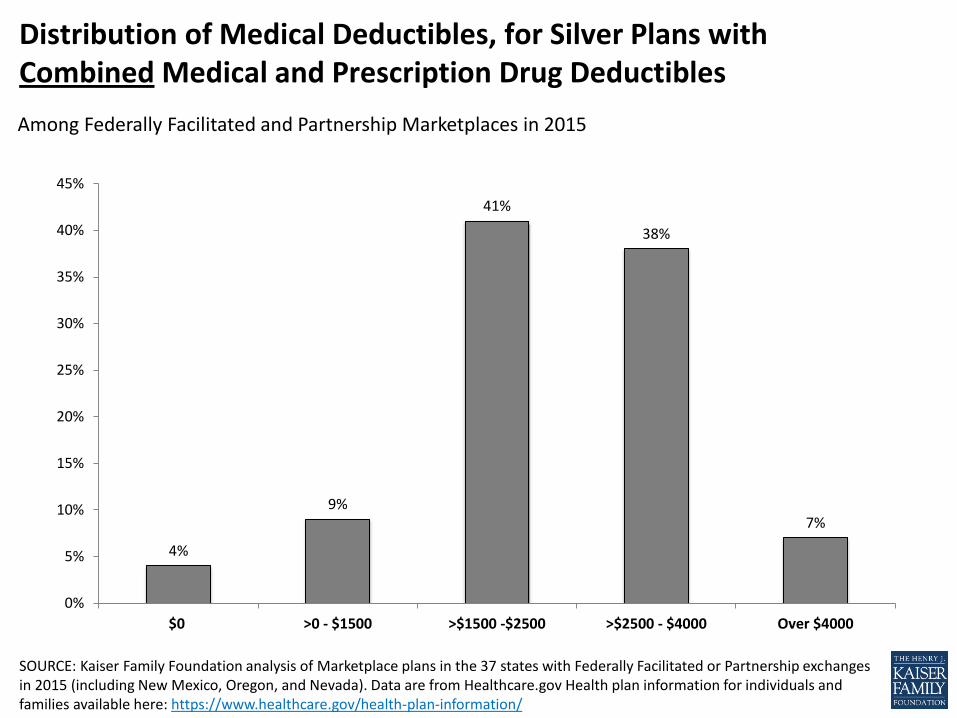
Distribution of Medical Deductibles, for Silver Plans with Combined Medical and Prescription Drug Deductibles
4%
9%
41%
38%
7%
0%
5%
10%
15%
20%
25%
30%
35%
40%
45%
$0 >0 - $1500 >$1500 -$2500 >$2500 - $4000 Over $4000
Among Federally Facilitated and Partnership Marketplaces in 2015
SOURCE: Kaiser Family Foundation analysis of Marketplace plans in the 37 states with Federally Facilitated or Partnership exchanges in 2015 (including New Mexico, Oregon, and Nevada). Data are from Healthcare.gov Health plan information for individuals and families available here: https://www.healthcare.gov/health-plan-information/
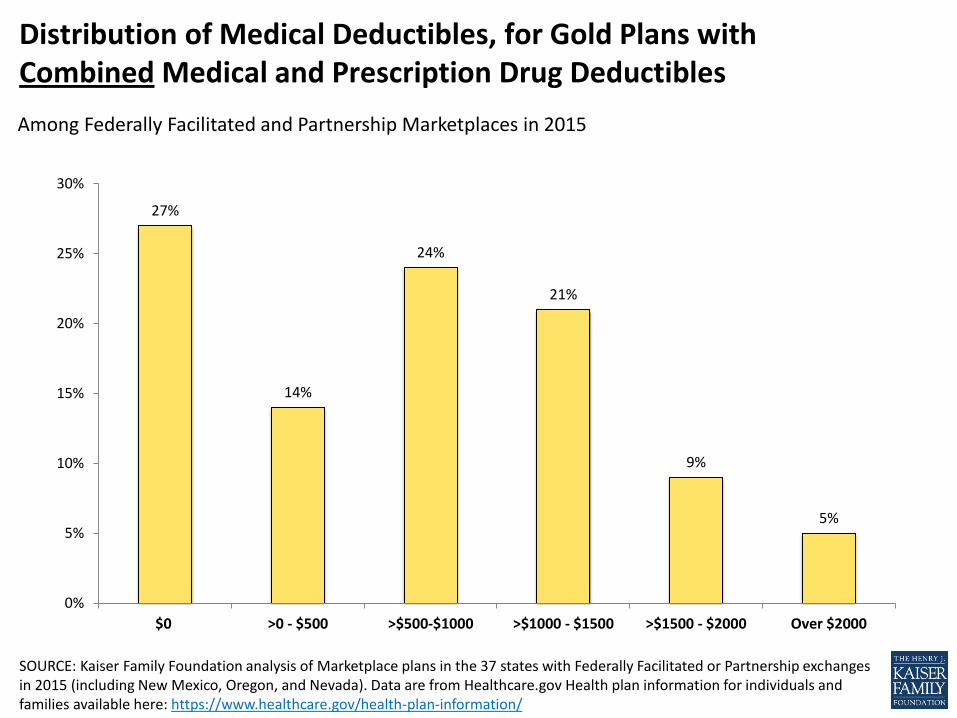
Distribution of Medical Deductibles, for Gold Plans with Combined Medical and Prescription Drug Deductibles
27%
14%
24%
21%
9%
5%
0%
5%
10%
15%
20%
25%
30%
$0 >0 - $500 >$500-$1000 >$1000 - $1500 >$1500 - $2000 Over $2000
Among Federally Facilitated and Partnership Marketplaces in 2015
SOURCE: Kaiser Family Foundation analysis of Marketplace plans in the 37 states with Federally Facilitated or Partnership exchanges in 2015 (including New Mexico, Oregon, and Nevada). Data are from Healthcare.gov Health plan information for individuals and families available here: https://www.healthcare.gov/health-plan-information/
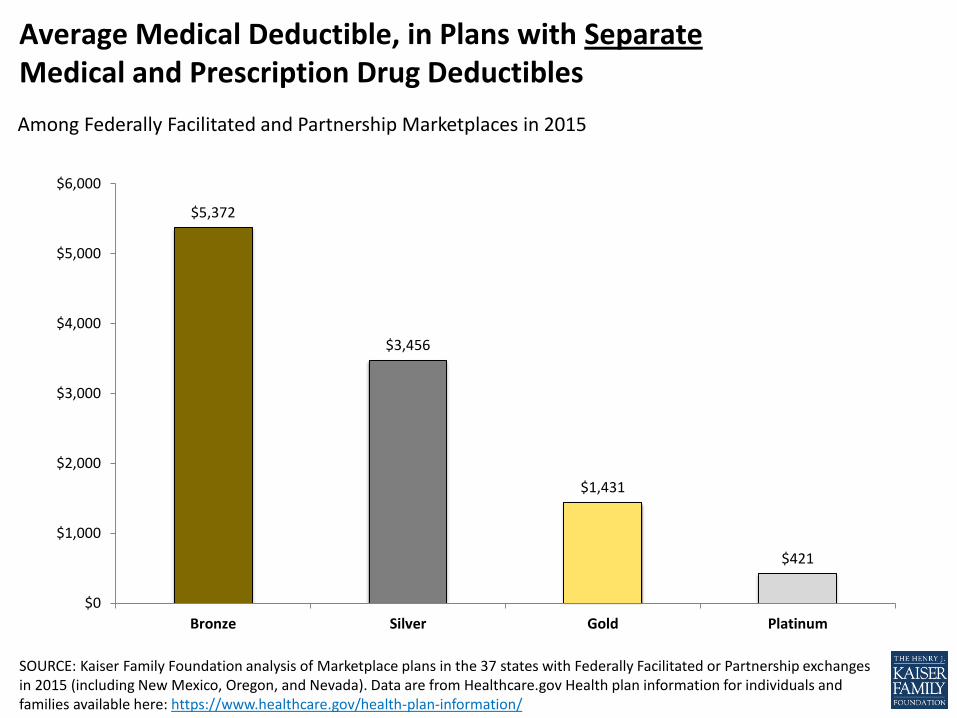
Average Medical Deductible, in Plans with Separate Medical and Prescription Drug Deductibles
$5,372
$3,456
$1,431
$421
$0
$1,000
$2,000
$3,000
$4,000
$5,000
$6,000
Bronze Silver Gold Platinum
Among Federally Facilitated and Partnership Marketplaces in 2015
SOURCE: Kaiser Family Foundation analysis of Marketplace plans in the 37 states with Federally Facilitated or Partnership exchanges in 2015 (including New Mexico, Oregon, and Nevada). Data are from Healthcare.gov Health plan information for individuals and families available here: https://www.healthcare.gov/health-plan-information/
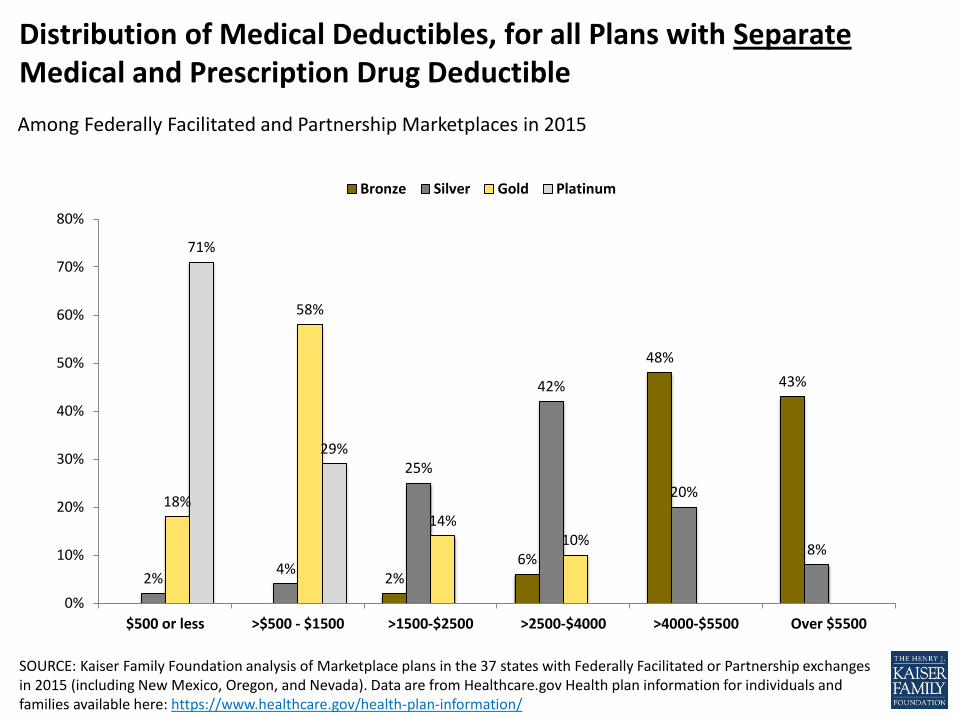
Distribution of Medical Deductibles, for all Plans with Separate Medical and Prescription Drug Deductible
2% 6%
48%
43%
2% 4%
25%
42%
20%
8%
18%
58%
14% 10%
71%
29%
0%
10%
20%
30%
40%
50%
60%
70%
80%
$500 or less >$500 - $1500 >1500-$2500 >2500-$4000 >4000-$5500 Over $5500
Bronze Silver Gold Platinum
Among Federally Facilitated and Partnership Marketplaces in 2015
SOURCE: Kaiser Family Foundation analysis of Marketplace plans in the 37 states with Federally Facilitated or Partnership exchanges in 2015 (including New Mexico, Oregon, and Nevada). Data are from Healthcare.gov Health plan information for individuals and families available here: https://www.healthcare.gov/health-plan-information/
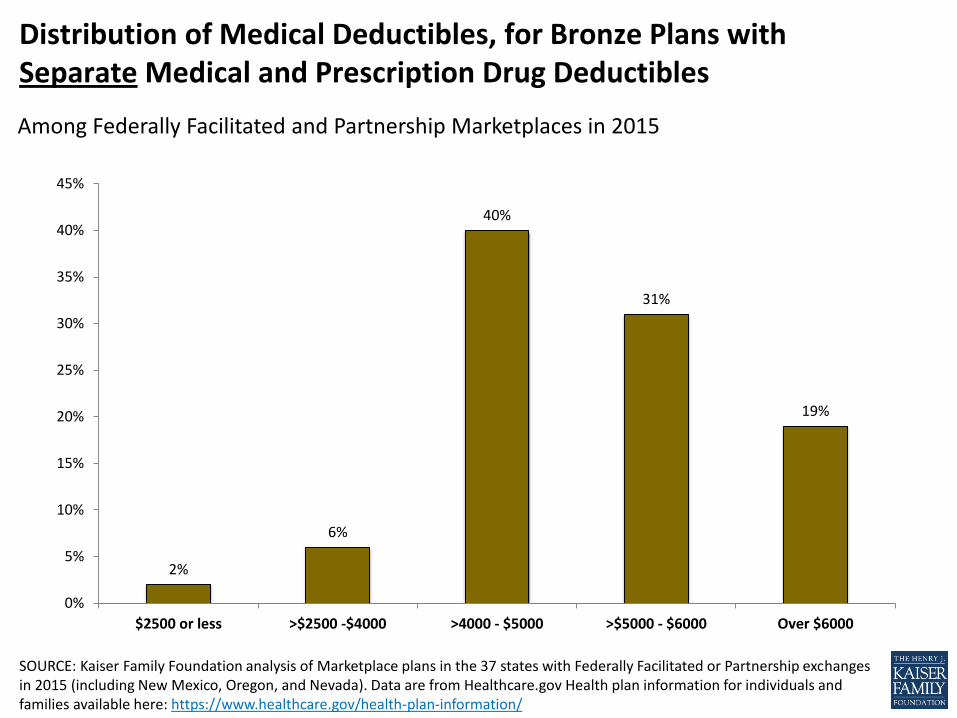
Distribution of Medical Deductibles, for Bronze Plans with Separate Medical and Prescription Drug Deductibles
2%
6%
40%
31%
19%
0%
5%
10%
15%
20%
25%
30%
35%
40%
45%
$2500 or less >$2500 -$4000 >4000 - $5000 >$5000 - $6000 Over $6000
Among Federally Facilitated and Partnership Marketplaces in 2015
SOURCE: Kaiser Family Foundation analysis of Marketplace plans in the 37 states with Federally Facilitated or Partnership exchanges in 2015 (including New Mexico, Oregon, and Nevada). Data are from Healthcare.gov Health plan information for individuals and families available here: https://www.healthcare.gov/health-plan-information/
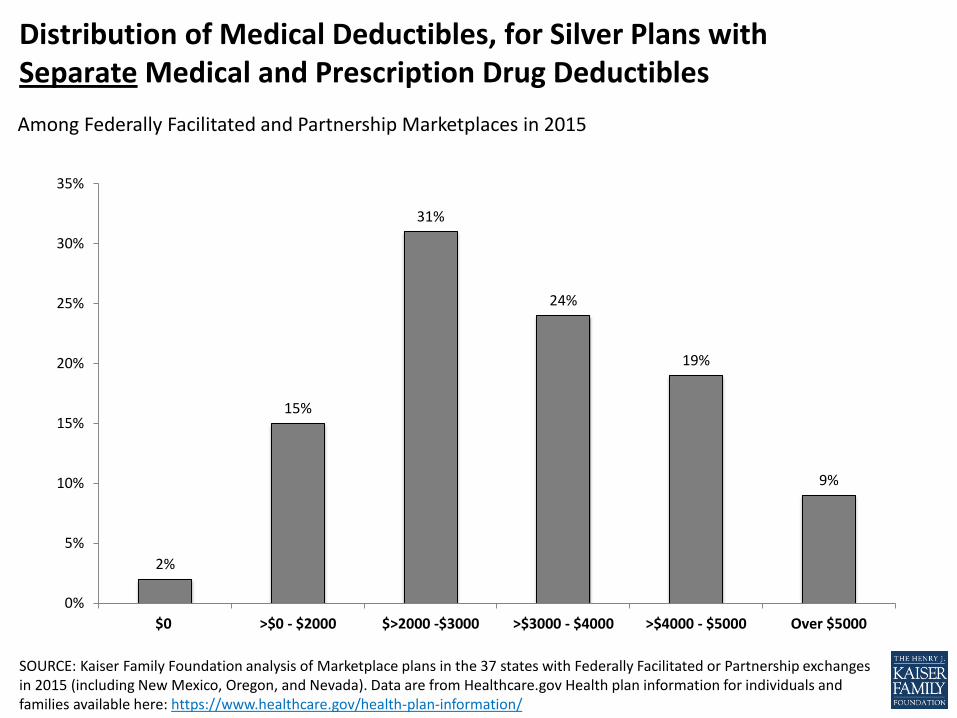
Distribution of Medical Deductibles, for Silver Plans with Separate Medical and Prescription Drug Deductibles
2%
15%
31%
24%
19%
9%
0%
5%
10%
15%
20%
25%
30%
35%
$0 >$0 - $2000 $>2000 -$3000 >$3000 - $4000 >$4000 - $5000 Over $5000
Among Federally Facilitated and Partnership Marketplaces in 2015
SOURCE: Kaiser Family Foundation analysis of Marketplace plans in the 37 states with Federally Facilitated or Partnership exchanges in 2015 (including New Mexico, Oregon, and Nevada). Data are from Healthcare.gov Health plan information for individuals and families available here: https://www.healthcare.gov/health-plan-information/
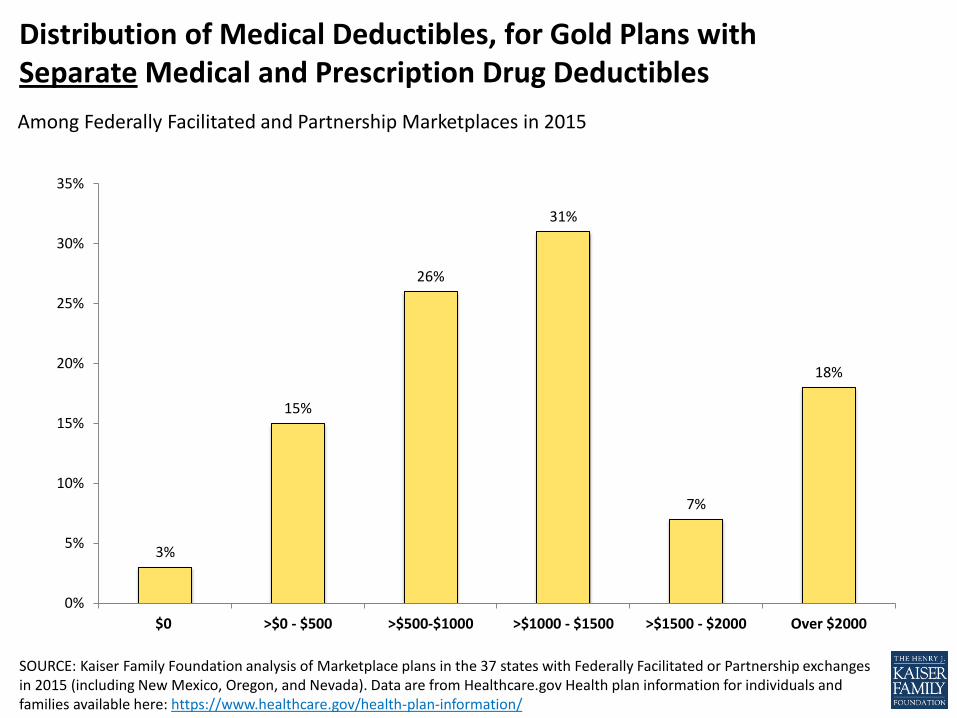
Distribution of Medical Deductibles, for Gold Plans with Separate Medical and Prescription Drug Deductibles
3%
15%
26%
31%
7%
18%
0%
5%
10%
15%
20%
25%
30%
35%
$0 >$0 - $500 >$500-$1000 >$1000 - $1500 >$1500 - $2000 Over $2000
Among Federally Facilitated and Partnership Marketplaces in 2015
SOURCE: Kaiser Family Foundation analysis of Marketplace plans in the 37 states with Federally Facilitated or Partnership exchanges in 2015 (including New Mexico, Oregon, and Nevada). Data are from Healthcare.gov Health plan information for individuals and families available here: https://www.healthcare.gov/health-plan-information/
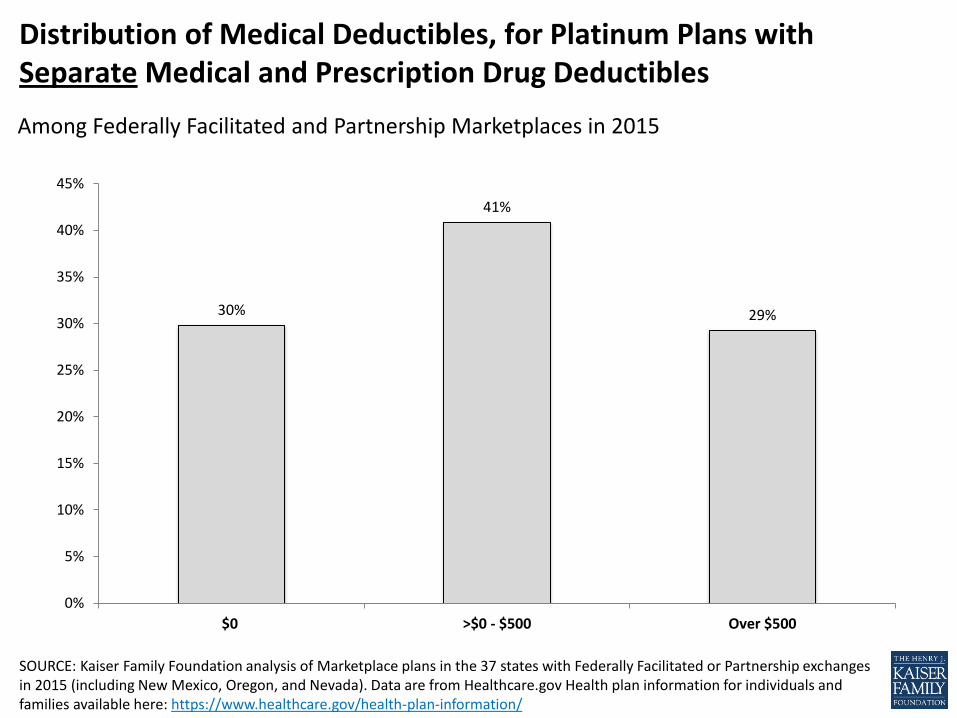
Distribution of Medical Deductibles, for Platinum Plans with Separate Medical and Prescription Drug Deductibles
30%
41%
29%
0%
5%
10%
15%
20%
25%
30%
35%
40%
45%
$0 >$0 - $500 Over $500
Among Federally Facilitated and Partnership Marketplaces in 2015
SOURCE: Kaiser Family Foundation analysis of Marketplace plans in the 37 states with Federally Facilitated or Partnership exchanges in 2015 (including New Mexico, Oregon, and Nevada). Data are from Healthcare.gov Health plan information for individuals and families available here: https://www.healthcare.gov/health-plan-information/

Drug Deductibles
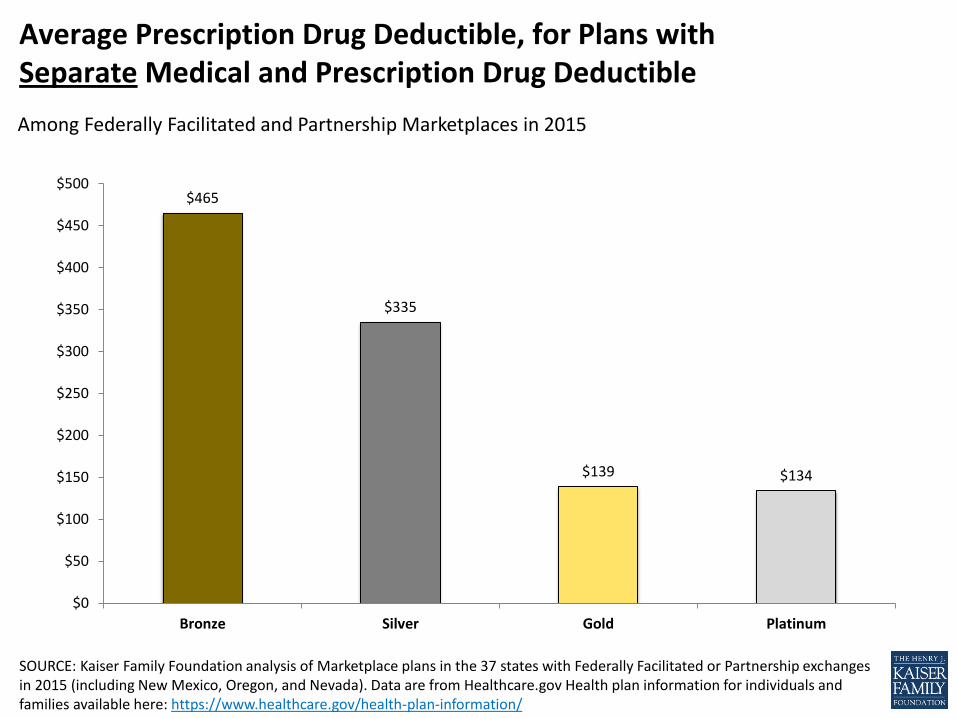
Average Prescription Drug Deductible, for Plans with Separate Medical and Prescription Drug Deductible
$465
$335
$139 $134
$0
$50
$100
$150
$200
$250
$300
$350
$400
$450
$500
Bronze Silver Gold Platinum
Among Federally Facilitated and Partnership Marketplaces in 2015
SOURCE: Kaiser Family Foundation analysis of Marketplace plans in the 37 states with Federally Facilitated or Partnership exchanges in 2015 (including New Mexico, Oregon, and Nevada). Data are from Healthcare.gov Health plan information for individuals and families available here: https://www.healthcare.gov/health-plan-information/
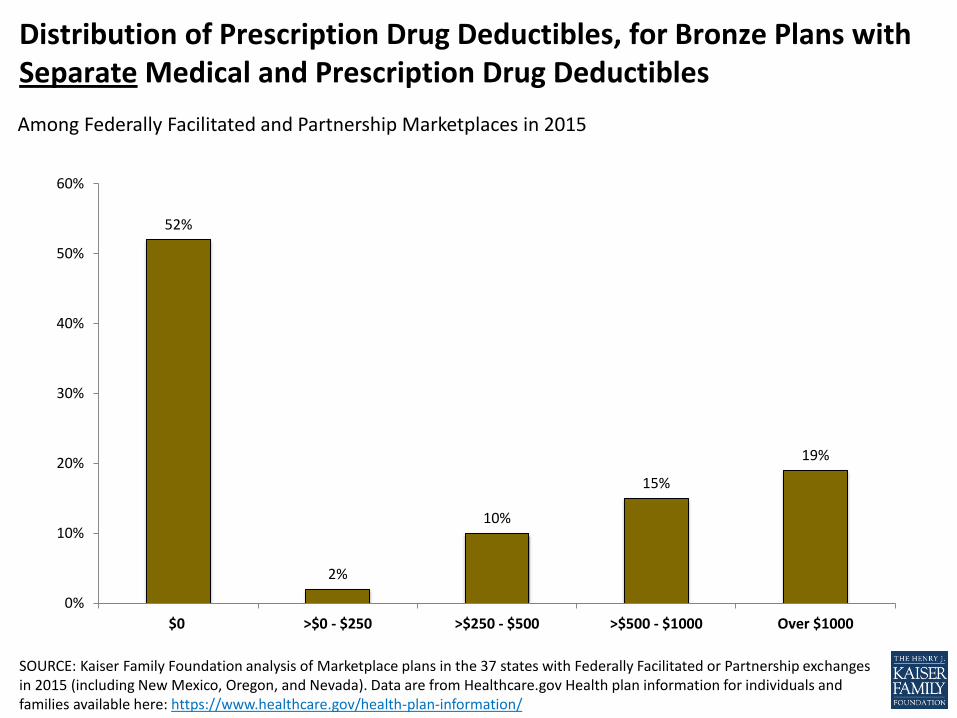
Distribution of Prescription Drug Deductibles, for Bronze Plans with Separate Medical and Prescription Drug Deductibles
52%
2%
10%
15%
19%
0%
10%
20%
30%
40%
50%
60%
$0 >$0 - $250 >$250 - $500 >$500 - $1000 Over $1000
Among Federally Facilitated and Partnership Marketplaces in 2015
SOURCE: Kaiser Family Foundation analysis of Marketplace plans in the 37 states with Federally Facilitated or Partnership exchanges in 2015 (including New Mexico, Oregon, and Nevada). Data are from Healthcare.gov Health plan information for individuals and families available here: https://www.healthcare.gov/health-plan-information/
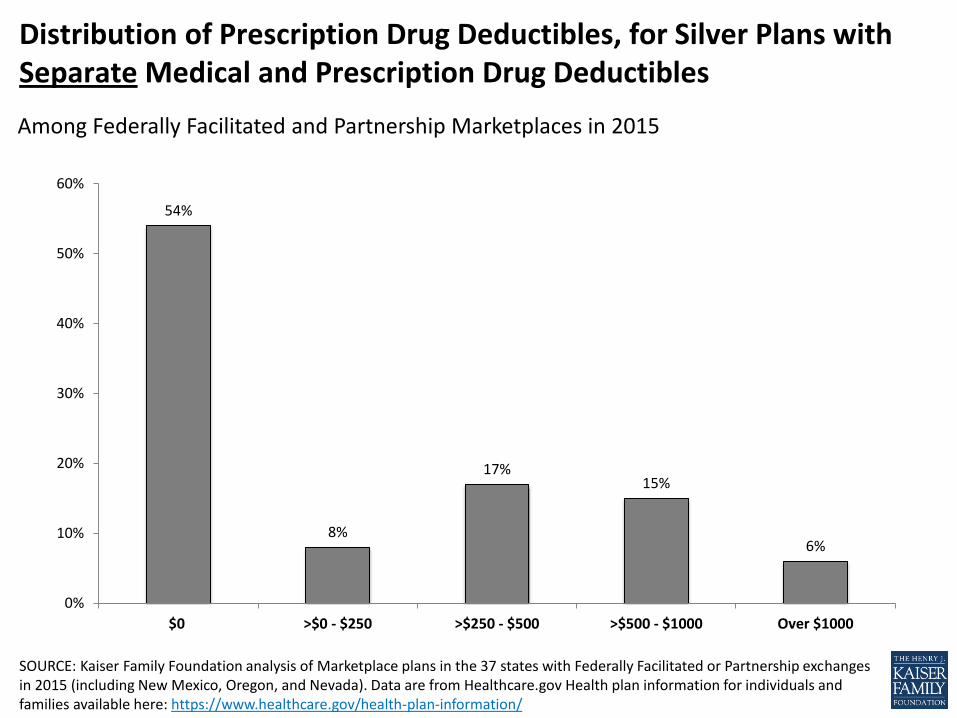
Distribution of Prescription Drug Deductibles, for Silver Plans with Separate Medical and Prescription Drug Deductibles
54%
8%
17% 15%
6%
0%
10%
20%
30%
40%
50%
60%
$0 >$0 - $250 >$250 - $500 >$500 - $1000 Over $1000
Among Federally Facilitated and Partnership Marketplaces in 2015
SOURCE: Kaiser Family Foundation analysis of Marketplace plans in the 37 states with Federally Facilitated or Partnership exchanges in 2015 (including New Mexico, Oregon, and Nevada). Data are from Healthcare.gov Health plan information for individuals and families available here: https://www.healthcare.gov/health-plan-information/
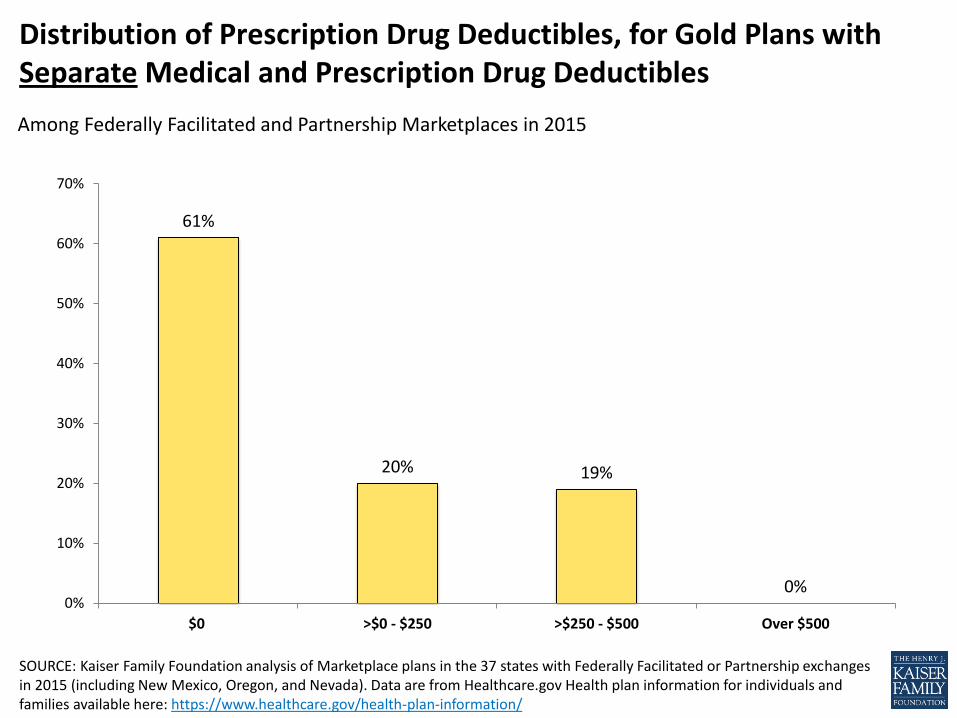
Distribution of Prescription Drug Deductibles, for Gold Plans with Separate Medical and Prescription Drug Deductibles
61%
20% 19%
0% 0%
10%
20%
30%
40%
50%
60%
70%
$0 >$0 - $250 >$250 - $500 Over $500
Among Federally Facilitated and Partnership Marketplaces in 2015
SOURCE: Kaiser Family Foundation analysis of Marketplace plans in the 37 states with Federally Facilitated or Partnership exchanges in 2015 (including New Mexico, Oregon, and Nevada). Data are from Healthcare.gov Health plan information for individuals and families available here: https://www.healthcare.gov/health-plan-information/
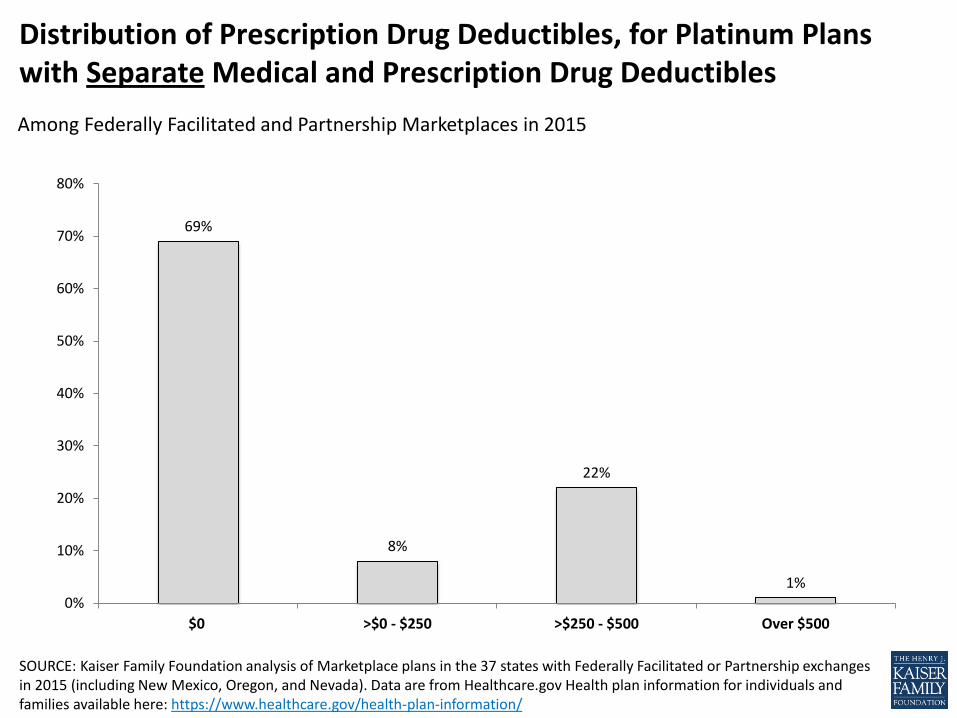
Distribution of Prescription Drug Deductibles, for Platinum Plans with Separate Medical and Prescription Drug Deductibles
69%
8%
22%
1%
0%
10%
20%
30%
40%
50%
60%
70%
80%
$0 >$0 - $250 >$250 - $500 Over $500
Among Federally Facilitated and Partnership Marketplaces in 2015
SOURCE: Kaiser Family Foundation analysis of Marketplace plans in the 37 states with Federally Facilitated or Partnership exchanges in 2015 (including New Mexico, Oregon, and Nevada). Data are from Healthcare.gov Health plan information for individuals and families available here: https://www.healthcare.gov/health-plan-information/