Embed Size (px)
Citation preview

Fluids and Kids: What Now?
Kathryn MaitlandImperial College, London

1998
Fluid bolus therapy –my story


Glucose control
The Silent emergencySimple treatments: evidence base?

Severe febrile illness: evidence of hypovolaemia?

Physiological and dose-finding studies
612121112125 4131516161611 498106106N =
Time(hrs)
4824126-841-20
CV
P (
cm H
2O)
12
10
8
6
4
2
0
-2
CVP low at admission
B
B=Bolus ~ 20-40mls/kgMaitland et al Pediatr Crit Care (2005)


Forest Plot
Choice of fluids for resuscitation: a systematic review: Akech et al BMJ 2010

Perpetual funding crisis….
Major concerns raised in grant reviews:Shock: •Provide the evidence (ie relevant physiological research) from paediatric literature underpinning shock definitionManagement:• Show us the evidence that on which the fluid management recommendations are based

Fluid bolus therapy: The Story from the Rest of the world
(paediatrics)

Paediatric recommendations
Dellinger Surviving Sepsis 2012

Paediatric Recommendations: Dellinger 2012
‘…… blood pressure alone is not a reliable endpoint for assessing the adequacy of resuscitation. However, once hypotension occurs, cardiovascular collapse may soon follow. Thus, fluid resuscitation is recommended for both normotensive and hypotensive children in hypovolemic shock [542–554]’’.4 dengue papers, 1 malaria systematic review; implementation (before after study designs) one small RCT (India)
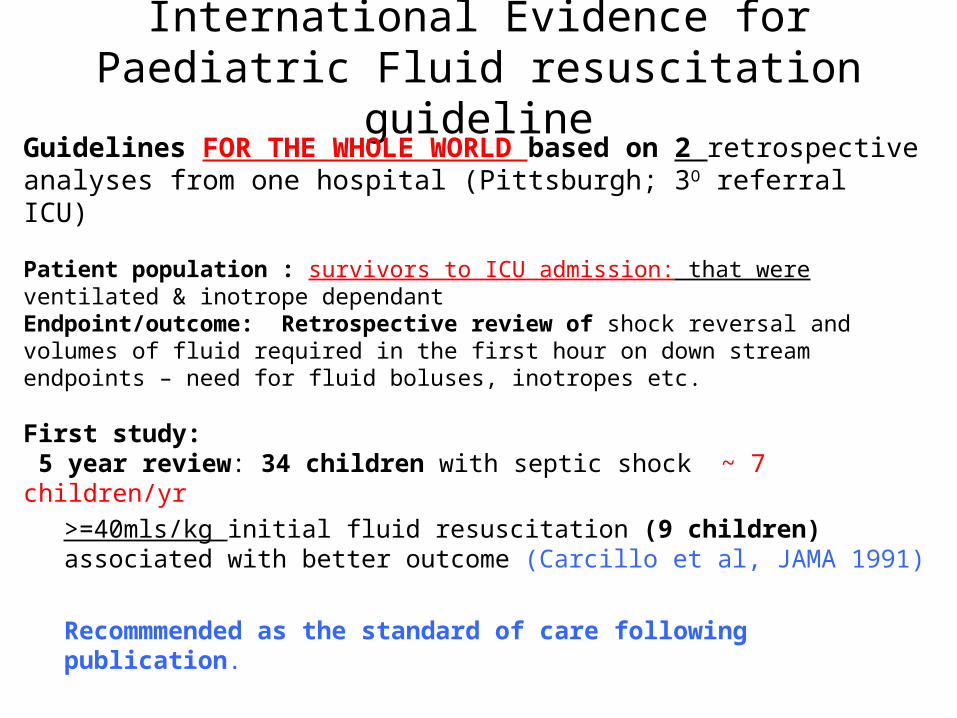
International Evidence for Paediatric Fluid resuscitation guideline
Guidelines FOR THE WHOLE WORLD based on 2 retrospective analyses from one hospital (Pittsburgh; 3O referral ICU)
Patient population : survivors to ICU admission: that were ventilated & inotrope dependantEndpoint/outcome: Retrospective review of shock reversal and volumes of fluid required in the first hour on down stream endpoints – need for fluid boluses, inotropes etc.
First study: 5 year review: 34 children with septic shock ~ 7 children/yr
>=40mls/kg initial fluid resuscitation (9 children) associated with better outcome (Carcillo et al, JAMA 1991)
Recommmended as the standard of care following publication.

9 children

International Evidence for Paediatric Fluid resuscitation guideline
Second study: 10 year review of Septic shock (91 children) ~ 9 children/yr Patient population : SURVIVED to ICU admission: ventilated & inotrope dependantEndpoint/outcome: Shock reversal by community physicians: volumes of fluid required in the first hour
>60mls/kg over 15 mins (34 children): early reversal of shock improves outcome; (Han Y et all, Pediatrics 2003)
Now recommended as the standard of care Surviving Sepsis 2012 guideline graded 2C level of evidence= Weak recommendation based on very poor evidence

2007The FEAST trial was funded!!!

Pragmatic trial
Severe malarial + acidosis
Undernutrition
Sepsis/shock
Cerebral malariaPneumonia
Meningitis/encephalitis
HIV
Severe malarial anaemia

Controlled trial of fluid resuscitation (FEAST A)
Follow-up to 4 weeks (24 weeks if developed neurological sequelae by 4 weeks)Clinical assessments at 1, 4, 8, 24, 48 hours and at 4 weeks
Impaired perfusionAny one of: •Cap refill > 2 secs, •Severe tachycardia, •temperature gradient•weak pulse
Excluded: Gastroenteritis Severe malnutrition Non-medical admission (burns,trauma)


Primary endpoint: 48 hour mortality
10.5%
7.3%
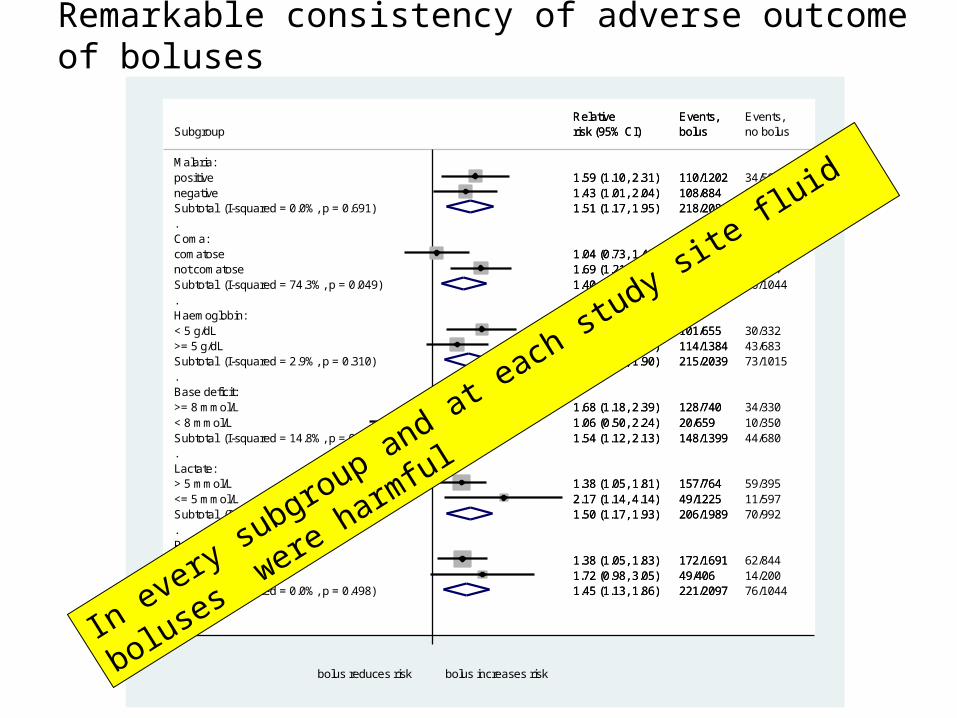
Remarkable consistency of adverse outcome of boluses
.
.
.
.
.
.
Malaria:positivenegativeSubtotal (I-squared = 0.0%, p = 0.691)
Coma:comatosenot comatoseSubtotal (I-squared = 74.3%, p = 0.049)
Haemoglobin:< 5 g/dL>= 5 g/dLSubtotal (I-squared = 2.9%, p = 0.310)
Base deficit:>= 8 mmol/L< 8 mmol/LSubtotal (I-squared = 14.8%, p = 0.279)
Lactate:> 5 mmol/L<= 5 mmol/LSubtotal (I-squared = 39.2%, p = 0.200)
Period:before amendmentafter amendmentSubtotal (I-squared = 0.0%, p = 0.498)
Subgroup
1.59 (1.10, 2.31)1.43 (1.01, 2.04)1.51 (1.17, 1.95)
1.04 (0.73, 1.49)1.69 (1.21, 2.36)1.40 (1.10, 1.79)
1.71 (1.16, 2.51)1.31 (0.93, 1.84)1.47 (1.14, 1.90)
1.68 (1.18, 2.39)1.06 (0.50, 2.24)1.54 (1.12, 2.13)
1.38 (1.05, 1.81)2.17 (1.14, 4.14)1.50 (1.17, 1.93)
1.38 (1.05, 1.83)1.72 (0.98, 3.05)1.45 (1.13, 1.86)
risk (95% CI)Relative
110/1202108/884218/2086
78/317143/1777221/2094
101/655114/1384215/2039
128/74020/659148/1399
157/76449/1225206/1989
172/169149/406221/2097
bolusEvents,
34/59138/44672/1037
33/14043/90476/1044
30/33243/68373/1015
34/33010/35044/680
59/39511/59770/992
62/84414/20076/1044
no bolus Events,
1.59 (1.10, 2.31)1.43 (1.01, 2.04)1.51 (1.17, 1.95)
1.04 (0.73, 1.49)1.69 (1.21, 2.36)1.40 (1.10, 1.79)
1.71 (1.16, 2.51)1.31 (0.93, 1.84)1.47 (1.14, 1.90)
1.68 (1.18, 2.39)1.06 (0.50, 2.24)1.54 (1.12, 2.13)
1.38 (1.05, 1.81)2.17 (1.14, 4.14)1.50 (1.17, 1.93)
1.38 (1.05, 1.83)1.72 (0.98, 3.05)1.45 (1.13, 1.86)
risk (95% CI)Relative
110/1202108/884218/2086
78/317143/1777221/2094
101/655114/1384215/2039
128/74020/659148/1399
157/76449/1225206/1989
172/169149/406221/2097
bolusEvents,
bolus reduces risk bolus increases risk
.
.
.
.
.
.
Malaria:positivenegativeSubtotal (I-squared = 0.0%, p = 0.691)
Coma:comatosenot comatoseSubtotal (I-squared = 74.3%, p = 0.049)
Haemoglobin:< 5 g/dL>= 5 g/dLSubtotal (I-squared = 2.9%, p = 0.310)
Base deficit:>= 8 mmol/L< 8 mmol/LSubtotal (I-squared = 14.8%, p = 0.279)
Lactate:> 5 mmol/L<= 5 mmol/LSubtotal (I-squared = 39.2%, p = 0.200)
Period:before amendmentafter amendmentSubtotal (I-squared = 0.0%, p = 0.498)
Subgroup
1.59 (1.10, 2.31)1.43 (1.01, 2.04)1.51 (1.17, 1.95)
1.04 (0.73, 1.49)1.69 (1.21, 2.36)1.40 (1.10, 1.79)
1.71 (1.16, 2.51)1.31 (0.93, 1.84)1.47 (1.14, 1.90)
1.68 (1.18, 2.39)1.06 (0.50, 2.24)1.54 (1.12, 2.13)
1.38 (1.05, 1.81)2.17 (1.14, 4.14)1.50 (1.17, 1.93)
1.38 (1.05, 1.83)1.72 (0.98, 3.05)1.45 (1.13, 1.86)
risk (95% CI)Relative
110/1202108/884218/2086
78/317143/1777221/2094
101/655114/1384215/2039
128/74020/659148/1399
157/76449/1225206/1989
172/169149/406221/2097
bolusEvents,
34/59138/44672/1037
33/14043/90476/1044
30/33243/68373/1015
34/33010/35044/680
59/39511/59770/992
62/84414/20076/1044
no bolus Events,
1.59 (1.10, 2.31)1.43 (1.01, 2.04)1.51 (1.17, 1.95)
1.04 (0.73, 1.49)1.69 (1.21, 2.36)1.40 (1.10, 1.79)
1.71 (1.16, 2.51)1.31 (0.93, 1.84)1.47 (1.14, 1.90)
1.68 (1.18, 2.39)1.06 (0.50, 2.24)1.54 (1.12, 2.13)
1.38 (1.05, 1.81)2.17 (1.14, 4.14)1.50 (1.17, 1.93)
1.38 (1.05, 1.83)1.72 (0.98, 3.05)1.45 (1.13, 1.86)
risk (95% CI)Relative
110/1202108/884218/2086
78/317143/1777221/2094
101/655114/1384215/2039
128/74020/659148/1399
157/76449/1225206/1989
172/169149/406221/2097
bolusEvents,
bolus reduces risk bolus increases risk
In every subgroup and at each study site
fluid boluses were harmful
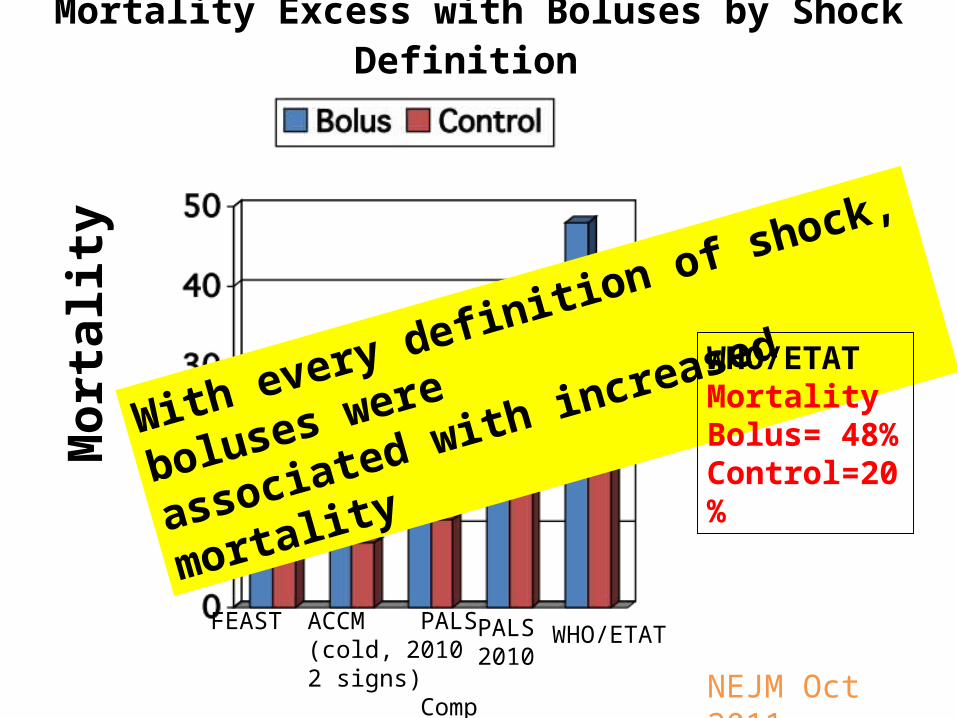
Mortality Excess with Boluses by Shock Definition
FEAST ACCM (cold, 2 signs)
PALS 2010 Comp
WHO/ETAT
Mor
talit
y
PALS 2010 Decomp
With every definition of shock, boluses were
associated with increased mortality
NEJM Oct 2011
WHO/ETATMortalityBolus= 48%Control=20%

Control betterBolus better
Hb 3 g/dl
Hb 11g/dl
Did anaemia affect outcome? Each level of Haemoglobin level
Maitland BMC Medicine 2013

Sepsis: Culture +ve or Goldstein et al definition (& malaria negative)
Maitland Unpublished

Acute Kidney Injury: Evidence fluid challenge beneficial?
Maitland Unpublished


Presenting syndromes

Response to fluid boluses

Shock reversal at one-hour&: does not predict benefit
&One-hour time point chosen since no difference in deaths in bolus vs control arms ie result not influenced by survivorship bias
*p-value for heterogeneity between the two relative risks. = 0.68

1
1.5
2
2.5
3
3.5
4
4.5
5
5.5
6
6.5
7
Cum
ulat
ive
inci
denc
e (%
)
0 4 8 12 16 20 24 28 32 36 40 44 48Hours until death
Cardiogenic (Bolus)
Cardiogenic (No Bolus)
Neurological (Bolus)
Neurological (No Bolus)
Respiratory (Bolus)
Respiratory (No Bolus)
Unknown/Other (Bolus)
Unknown/Other (No Bolus)
Percentage of death in Bolus (B) vs Control (C) with Terminal Clinical Event attributed to:
Cardiogenic/shock: 4.6%(n=96) B vs 2.6%(n=27) C [Ratio 1.79 (1.17-2.74) p=0.008]
Neurological: 2.1%(n=44) B vs 1.8%(n=19) C [Ratio 1.15 (0.67-1.98); p=0.6]
Respiratory: 2.2%(n=47) B vs 1.3%(n=14) C [Ratio 1.68 (0.93-3.06); p=0.09]
‘Terminal Clinical Event’: Cumulative incidence of mortality for bolus & control arms

Cup half full or half empty?

Dose –response?
.
.
.
.
.
.
Malaria:positivenegativeSubtotal (I-squared = 0.0%, p = 0.691)
Coma:comatosenot comatoseSubtotal (I-squared = 74.3%, p = 0.049)
Haemoglobin:< 5 g/dL>= 5 g/dLSubtotal (I-squared = 2.9%, p = 0.310)
Base deficit:>= 8 mmol/L< 8 mmol/LSubtotal (I-squared = 14.8%, p = 0.279)
Lactate:> 5 mmol/L<= 5 mmol/LSubtotal (I-squared = 39.2%, p = 0.200)
Period:before amendmentafter amendmentSubtotal (I-squared = 0.0%, p = 0.498)
Subgroup
1.59 (1.10, 2.31)1.43 (1.01, 2.04)1.51 (1.17, 1.95)
1.04 (0.73, 1.49)1.69 (1.21, 2.36)1.40 (1.10, 1.79)
1.71 (1.16, 2.51)1.31 (0.93, 1.84)1.47 (1.14, 1.90)
1.68 (1.18, 2.39)1.06 (0.50, 2.24)1.54 (1.12, 2.13)
1.38 (1.05, 1.81)2.17 (1.14, 4.14)1.50 (1.17, 1.93)
1.38 (1.05, 1.83)1.72 (0.98, 3.05)1.45 (1.13, 1.86)
risk (95% CI)Relative
110/1202108/884218/2086
78/317143/1777221/2094
101/655114/1384215/2039
128/74020/659148/1399
157/76449/1225206/1989
172/169149/406221/2097
bolusEvents,
34/59138/44672/1037
33/14043/90476/1044
30/33243/68373/1015
34/33010/35044/680
59/39511/59770/992
62/84414/20076/1044
no bolus Events,
1.59 (1.10, 2.31)1.43 (1.01, 2.04)1.51 (1.17, 1.95)
1.04 (0.73, 1.49)1.69 (1.21, 2.36)1.40 (1.10, 1.79)
1.71 (1.16, 2.51)1.31 (0.93, 1.84)1.47 (1.14, 1.90)
1.68 (1.18, 2.39)1.06 (0.50, 2.24)1.54 (1.12, 2.13)
1.38 (1.05, 1.81)2.17 (1.14, 4.14)1.50 (1.17, 1.93)
1.38 (1.05, 1.83)1.72 (0.98, 3.05)1.45 (1.13, 1.86)
risk (95% CI)Relative
110/1202108/884218/2086
78/317143/1777221/2094
101/655114/1384215/2039
128/74020/659148/1399
157/76449/1225206/1989
172/169149/406221/2097
bolusEvents,
bolus reduces risk bolus increases risk
.
.
.
.
.
.
Malaria:positivenegativeSubtotal (I-squared = 0.0%, p = 0.691)
Coma:comatosenot comatoseSubtotal (I-squared = 74.3%, p = 0.049)
Haemoglobin:< 5 g/dL>= 5 g/dLSubtotal (I-squared = 2.9%, p = 0.310)
Base deficit:>= 8 mmol/L< 8 mmol/LSubtotal (I-squared = 14.8%, p = 0.279)
Lactate:> 5 mmol/L<= 5 mmol/LSubtotal (I-squared = 39.2%, p = 0.200)
Period:before amendmentafter amendmentSubtotal (I-squared = 0.0%, p = 0.498)
Subgroup
1.59 (1.10, 2.31)1.43 (1.01, 2.04)1.51 (1.17, 1.95)
1.04 (0.73, 1.49)1.69 (1.21, 2.36)1.40 (1.10, 1.79)
1.71 (1.16, 2.51)1.31 (0.93, 1.84)1.47 (1.14, 1.90)
1.68 (1.18, 2.39)1.06 (0.50, 2.24)1.54 (1.12, 2.13)
1.38 (1.05, 1.81)2.17 (1.14, 4.14)1.50 (1.17, 1.93)
1.38 (1.05, 1.83)1.72 (0.98, 3.05)1.45 (1.13, 1.86)
risk (95% CI)Relative
110/1202108/884218/2086
78/317143/1777221/2094
101/655114/1384215/2039
128/74020/659148/1399
157/76449/1225206/1989
172/169149/406221/2097
bolusEvents,
34/59138/44672/1037
33/14043/90476/1044
30/33243/68373/1015
34/33010/35044/680
59/39511/59770/992
62/84414/20076/1044
no bolus Events,
1.59 (1.10, 2.31)1.43 (1.01, 2.04)1.51 (1.17, 1.95)
1.04 (0.73, 1.49)1.69 (1.21, 2.36)1.40 (1.10, 1.79)
1.71 (1.16, 2.51)1.31 (0.93, 1.84)1.47 (1.14, 1.90)
1.68 (1.18, 2.39)1.06 (0.50, 2.24)1.54 (1.12, 2.13)
1.38 (1.05, 1.81)2.17 (1.14, 4.14)1.50 (1.17, 1.93)
1.38 (1.05, 1.83)1.72 (0.98, 3.05)1.45 (1.13, 1.86)
risk (95% CI)Relative
110/1202108/884218/2086
78/317143/1777221/2094
101/655114/1384215/2039
128/74020/659148/1399
157/76449/1225206/1989
172/169149/406221/2097
bolusEvents,
bolus reduces risk bolus increases risk

Back to the drawing board…

Fluid is a drug

Fluid resuscitation guidelines

Response to fluid loading in severe malnutrition(AFRIM)
And MAPS study Dr Nchafatso Obonyo
• Management of Paediatric Shock– Observational study in severe malnutrition:
• Myocardial and haemodynamic response to bolus fluid resuscitation (current WHO treatment guideline)
• Risk factors for myocardial dysfunction– Non-malnourished children:
• Gastroenteritis and dehydration + hypovolemic shock• Severe febrile illness and septic shock (FEAST trial criteria)
• One-year Fellowship in Global Health

Other conditions: fluid bolus
Severe Gastroenteritis
Malnutrition
Surgical Burns

Myocardial Function in severe malnutrition
Bernadette Brent
• Detailed assessment comprising:– Clinical examination– ECG (including holter ECGs over 7 days)– ECHO
• Assessment time points:– Admission– Day 7 – Day 28– Any deterioration– Any IV fluids

SummaryShock present?20 mls/kg 0.9% saline rapidly, repeat x 2
Rehydration: Plan C <30ml/kg over 1 hr then 70ml/kg over 3 hrs Ringers Lactate (or 5 hrs if <12m)
(no subtraction of bolus volume)
Overall No shock: 100 mls/kg ~ 3-5 hrs; If shock present: 120-160mls/kg ~ 4-5 hrs (approximately 2-3 times a child’s circulating volume).
6 hours: If still dehydrated: Restart Plan C

FEAST wins Paper of the Year

Research- policy pipeline:Fluid resuscitation as a supportive therapy
Clinical Investigative Clinical trials New Evidence ? Policy
NEJM paper Acidosis Hypovolaemia Clinical trials
1996 1997 2000- 2009 FEAST 2011 Trial stopped
WT project grant

2013: Fluid Boluses continue to be recommended in WHO guidelines

Annual excess mortality of boluses predicted per 1 million doses
Kiguli et al , BMJ 20145, 200- 132, 000 excess deaths/year for 4 million fluid boluses in children with severe malaria whilst WHO continue to recommend boluses

Time for a bit of knowledge translation?
Lancet January 2014


Future trials……..

Fluids FEAST trial
Glycaemic controlTransfusion:TRACT trial
OxygenCOAST trial
The Silent emergencySimple treatments: evidence base?
Antibiotics
Antimalarials AQUAMAT trial

Factorial design: 3950 children with severe anaemia•Transfusion strategies•Long-term management
MalawiUganda
TRansfusion and TReatment of severe Anaemia in African Children Trial

Children’s Oxygen Administration Strategies Trial (COAST)
PI: Kath Maitland
Uganda
Niger
Innovations: ‘Frugal’ technologiesHigh Flow (PEP): sustainable resource for respiratory support John FraserFisher and PaykelBrisbane Respiratory Group
Kathy Rowan

POST: First patient enrolled
EIT: lung recruitment of oxygenation strategies

Clinical trials platform: Added value
Clinical trials facilityGCP compliant trials
East African collaborative research & capacity buildingLinked sample collection:
basic research