Embed Size (px)
Citation preview
Lean Strategies for Laboratory Testing
Jenny Watson Global Pharmaceutical Applications
Manager GE Analytical Instruments

Agenda
• Operational Excellence & Lean • Case Study
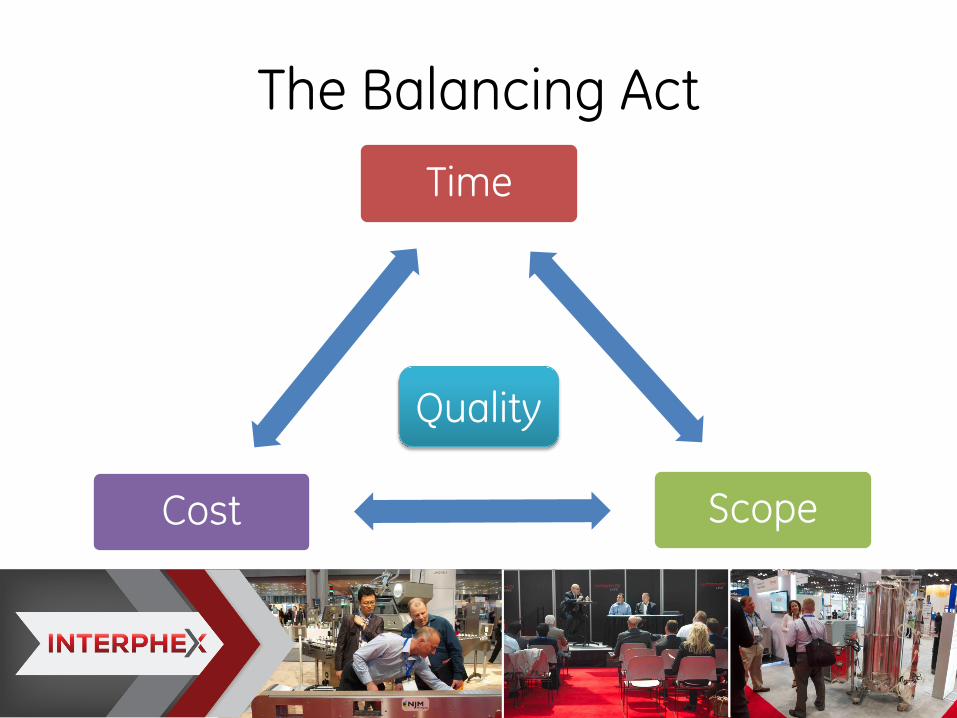
The Balancing Act Time
Scope Cost
Quality

Operational Excellence & Lean Lean Methodology • Focus on organizing
human activities • Reduce the 7 wastes
Operational Excellence • Organizational leadership
strategy • Applies a variety of
principles, systems, and tools to improve key performance metrics
• Includes application of new technology
Transport Inventory Motion Waiting
Overproduction Over processing Defects

Evaluation • SOPs • Business Practices • Technology
– Example: New Instrumentation, New Manufacturing Technology
• Data Handling – Example: Laboratory Data Management Systems,
Electronic Batch Records

What areas does this apply?
• Manufacturing • Process Development • Quality Systems • Quality Control
Looks at Procedures and New Technologies

Quality Control
• Environmental Monitoring • Ongoing Operational Testing • Final Product Testing • Stability Testing • Maybe Process Development Testing

Case Study: Evaluation of Lab Testing for Water Samples

Customer Current State
– Sample collection, testing, data entry, and review of 50-200 samples/week
– Stage 1 or 2 Conductivity performed in lab – Manual analysis – Data transcription
P.O.U. Sampling
Transfer to Lab
Set up Manual Analysis
Analyze for Stage 1
Manually Record Results
Analyze for Stage 2 (if
fails)
Transpose Results to
LIMS
Conductivity
Conductivity Background
• USP requires conductivity monitoring for bulk purified water and water for injection
• USP <645> Water Conductivity provides the following guidance:

Stage 1
• Measured Online or Offline in suitable container • Measure temp & raw conductivity • Compare to Pass/ Fail criteria
Stage 2
• Offline test • 100 mL sample • Temperature control (25°C) • Vigorous agitation • Conductivity measurement must stabilize (Δ ≤ 0.1 µS/cm over 5 min) • Pass if sample < 2.1 µS/cm
Stage 3
• Uses sample from Stage 2 within 5 minutes • Addition of KCl salt to sample • Measure pH • Determine corresponding conductivity • Value must be less than conductivity measured at Stage 2
USP <645> Conductivity < 15 min
~ 4 hours
~ 6 hours

Instruments and Consumables Current State Future State

The Challenge Conductivity and TOC measurements typically require different
sample containers
Measured in Plastic
• Glass has ionic interferences
Measured in Glass
• Plastic leaches TOC
DUCT Vials
Conductivity Total Organic Carbon
Solution

Customer Success
A large, global pharmaceutical company wanted to lean out processes, gain efficiency, and reduce costs related
to TOC and conductivity testing
• Purchased Sievers M9 Laboratory Analyzer for simultaneous TOC and
Conductivity measurements with DUCT Vials • Integrated instrument with laboratory data management system for
paperless workflow • Determined payback period and savings based on labor and costs

Implementation
Method Transfer Activities Conductivity Manual to Automated
• Stage 1 Conductivity on the M9 viewed as automated
• Accuracy, Precision and Linearity performed to establish suitability
TOC Upgraded to Current Model
• Instrument Comparability
• Container Comparison
• Side by side testing

TOC Method Transfer Results
80
85
90
95
100
105
110
115
120
Run 1 Run 2 Run 3
% R
espo
nse
Effic
ienc
y
DUCT VialSystemSuitability Kit
Borosilicate VialSystemSuitability Kit
900 BorosilicateVial SystemSuitability Kit
Acceptance Criteria = 85-115%
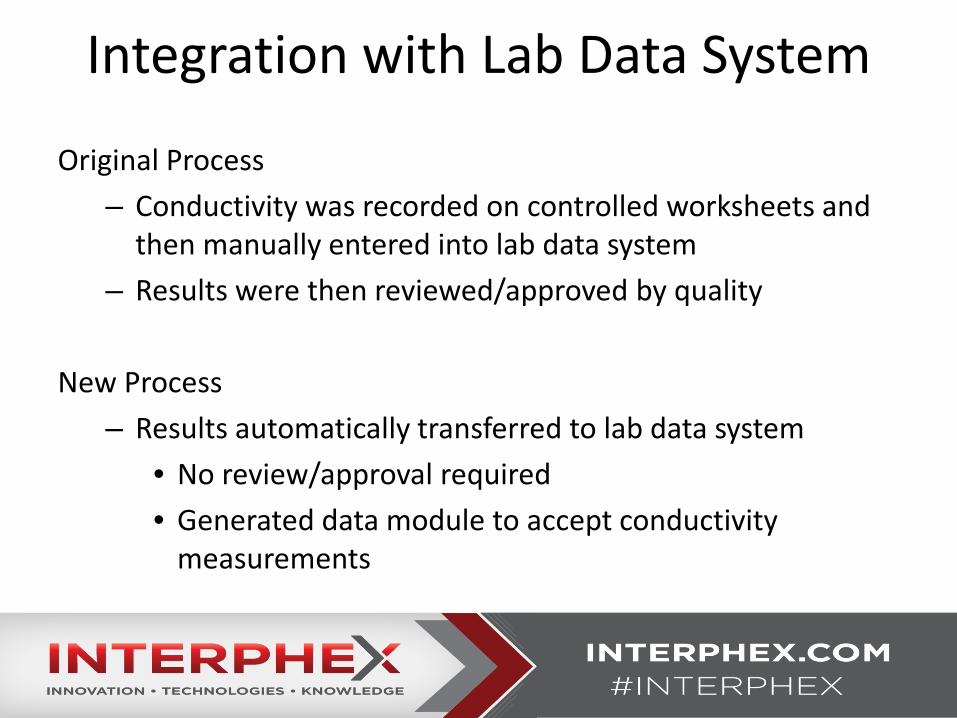
Integration with Lab Data System
Original Process – Conductivity was recorded on controlled worksheets and
then manually entered into lab data system – Results were then reviewed/approved by quality
New Process
– Results automatically transferred to lab data system • No review/approval required • Generated data module to accept conductivity
measurements

Streamlined Process
P.O.U.
Sampling Transfer to
Lab
Set up Manual Analysis
Analyze for Stage 1
Manually Record Results
Analyze for Stage 2 (if
fails)
Transpose Results to
LIMS
Current State Compendia Process Flow:
P.O.U. Sampling
Transfer to Lab
Set up Analysis
Analyze TOC & Cond.
Go To Stage 2 if Fail
Results direct to
LIMS
Future State TOC and Conductivity Process Flow:
P.O.U. Sampling
Transfer to Lab
Set up Analysis
Analyze TOC
Results direct to
LIMS
Conductivity
TOC

Payback Period: Cost per Sample Cost Type Current Future
Cons
umab
les Conductivity Sample Containers & Verification Standards $ 2.58 $ 15.70
TOC Sample Containers $ 4.83 N/A TOC Verification Standards No change
Total Consumable Cost per Sample $ 7.41 $ 15.70
Labo
r Analysis Time (minutes) 7 2
Labor Rate per sample $1.17 $1.17
Total Labor Cost per Sample $ 8.17 $ 2.33
PM
Maintenance per sample (PM cost divided by # samples per year) $ 0.44 $0.88
Overall Total Cost per Sample $ 16.01 $18.91
Current Future
• 40 mL TOC vial • 125 mL Conductivity bottle • 125 mL Conductivity back-up
• 30 mL DUCT vial • 125 mL Conductivity back-up

Payback Period Cost Factors Current Process Future Process
Instrument & Installation Costs N/A $ (99,710)1 Labor Costs $ (115, 500) $ (16,500) Consumable Costs $ (122, 220) $ (129, 500) Maintenance Costs $ (14, 484) $ (14, 484) Projected Labor Savings N/A $ 62,400 Total Cost $ (252,204) $ (197, 794) Overall Cost Savings N/A $ 54,410 Payback Period (months) N/A 8
Based on labor rate of $60/hour Labor rate = $40/hour; payback is 12 months

Summary
When evaluating opportunities for more efficient operations it is important to look at the whole process. How could a new technology change my overall process?

Jenny Watson Global Pharmaceutical Applications Manager
W +1 720 622 0241 C +1 303 349 0103
Email: [email protected] 6060 Spine Rd
Boulder, CO 80301-3687 USA
www.geinstruments.com