Embed Size (px)
Citation preview

Welcome to
Journal Club
Dr. Shubhra Prakash PaulMD (ped.) Part III
Bangladesh Institute of Child Health

TitleCorrelation of APGAR Score with Asphyxial Hepatic Injury and Mortality in Newborns: A Prospective Observational Study From India

Authors Deepak Sharma Mukesh Choudhary Mamta Lamba Sweta Shastri

Publication ParticularsJournal
Clinical Medicine Insights: Pediatrics 2016 . Vol.10 . Page: 27–34
DOI10.4137/CMPed.s38503
Date Published10th may 2016

First Page
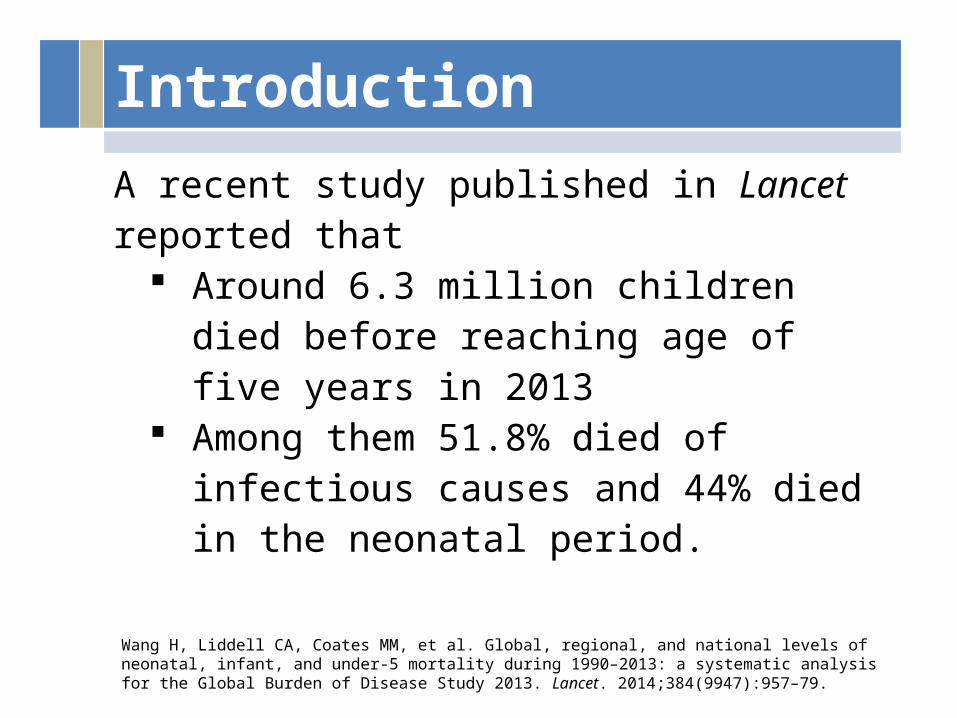
IntroductionA recent study published in Lancet reported that
Around 6.3 million children died before reaching age of five years in 2013
Among them 51.8% died of infectious causes and 44% died in the neonatal period.
Wang H, Liddell CA, Coates MM, et al. Global, regional, and national levels of neonatal, infant, and under-5 mortality during 1990–2013: a systematic analysis for the Global Burden of Disease Study 2013. Lancet. 2014;384(9947):957–79.
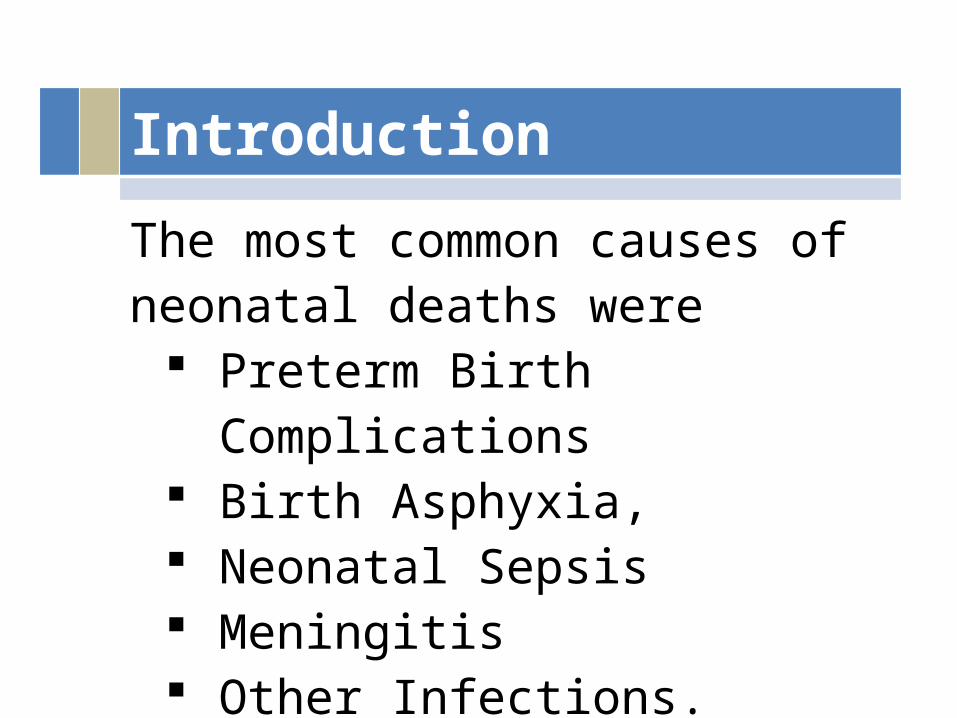
IntroductionThe most common causes of neonatal deaths were
Preterm Birth Complications
Birth Asphyxia, Neonatal Sepsis Meningitis Other Infections.

Introduction Majority of the neonatal deaths (99%)
occur in low and middle income countries,out of which more than 50% neonatal deaths occur at homes, which lack adequate care.
Neonates of developing countries have intrauterine growth restriction too, which makes them further vulnerable to various neonatal morbidities and mortality.

Introduction Neonatal birth asphyxia
Insult to the fetus or the newborn due to lack of oxygen and/or lack of perfusion to various organs of the body
Multisystem disorder Involves almost all organs of
body can cause hepatic hypoxic
injury, leading to release of intracellular enzymes and significant increase in their level
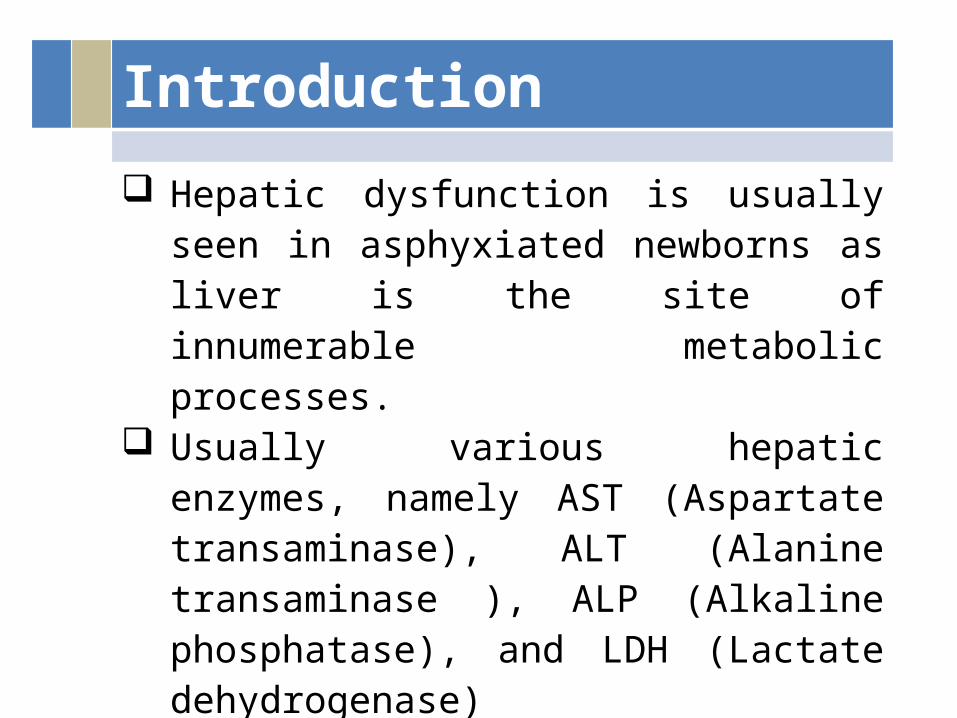
Introduction Hepatic dysfunction is usually seen in
asphyxiated newborns as liver is the site of innumerable metabolic processes.
Usually various hepatic enzymes, namely AST (Aspartate transaminase), ALT (Alanine transaminase ), ALP (Alkaline phosphatase), and LDH (Lactate dehydrogenase)
Increase early, abruptly, and transiently (within 24–72 hours after)
Usually, this increase returns to baseline within 10 days after birth.

Aims of the studyThe aim of this study was to evaluate the severity and type of liver dysfunction in relation to APGAR score and HIE grading of asphyxiated neonates and also to determine the correlation with neonatal mortality .

Materials and Methods It is a secondary analysis of study In this study comparison and
correlation done with the hepatic dysfunction on the basis of five-minute APGAR score in newborns with severe asphyxia with newborns to moderate asphyxia and normal control neonates.
Comparison also done with the five-minute APGAR score in correlation to neonatal mortality in severely and moderately asphyxiated neonates

Materials and MethodsDuration of Study
January 2011 to December 2011Sample Size
100 NeonatePlace of Study
Neonatal Intensive care unit of Umaid Hospital, Jodhpur, India.
Type of studyProspective observational case-controlled study

Exclusion CriteriaCongenital malformation
Primary disease of liver
Bacterial sepsis Receiving potentially hepatotoxic drug therapy
Study Population(n = 100)
Study Group A (Case)
(n = 70)
Study Group B (Control)(n = 30)
Moderate(n = 54 )
Severe(n = 16 )
APGAR score of 6 and 7 at five minutes
APGAR score of 4 and 5 at five minutes
APGAR score of 3 or less at five minutes
APGAR score of 7 or less at five minutes
Materials and Methods (contd.)Patient Allocation
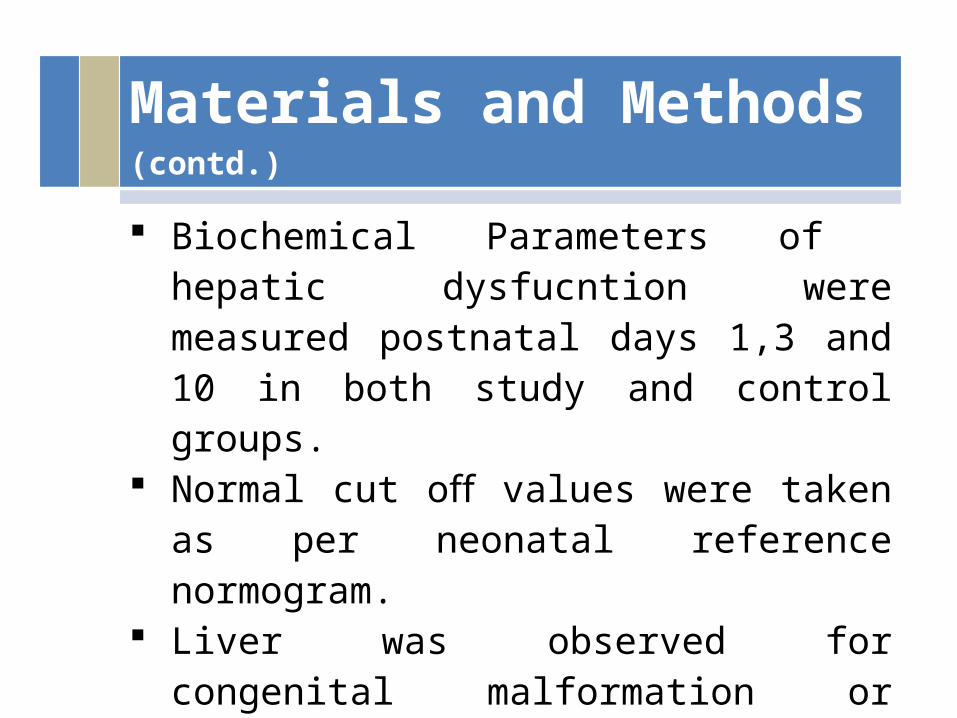
Materials and Methods (contd.) Biochemical Parameters of hepatic
dysfucntion were measured postnatal days 1,3 and 10 in both study and control groups.
Normal cut off values were taken as per neonatal reference normogram.
Liver was observed for congenital malformation or abnormality of biliary tract within 24 hours of birth by an ultrasound.
All neonates underwent head ultrasound at the time of discharge.

Materials and Methods (contd.)Biochemical Parameters of Hepatic InjuryThe criteria for liver impairment were
ALT > 50 U/L AST > 140 U/L ALP > 420 U/L LDH > 580 U/L Total protein < 4.5 g/dL, Serum albumin < 2.5 g/dL, PT > 20 seconds and INR >1.2
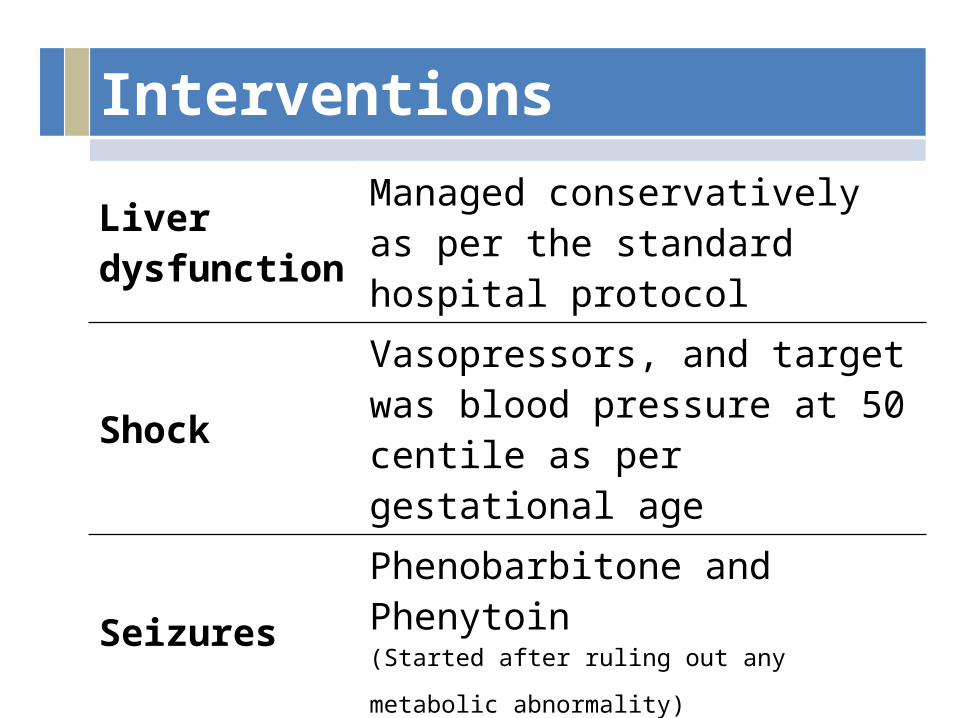
InterventionsLiver dysfunction
Managed conservatively as per the standard hospital protocol
ShockVasopressors, and target was blood pressure at 50 centile as per gestational age
Seizures Phenobarbitone and Phenytoin(Started after ruling out any metabolic abnormality)
Resp. Distress and Failure
Mechanical ventilation

Statistical Analysis All the data were entered in
Microsoft excel sheet, and statistical analysis was executed using SPSS version 21 for windows.
The asphyxiated newborns with five-minute APGAR score less than 3 (severe asphyxia) were compared with moderate asphyxiated newborns with APGAR score (4 and 5) and also with normal neonates (>7) that acted as control and neonatal mortality were compared between each group.

Statistical Analysis (contd.)
Student’s t-test and chi-square test were done for analysis.
P value less than 0.05 was considered statistically significant
Multivariate coefficient of correlation was calculated is used to correlate the severity of asphyxia based on APGAR score with LFTs and mortality

ResultSevere Asphyxia
Moderate Asphyxia
Control P value
Mean Gestational age (weeks)
38.02 ± 0.8
38.60 ± 0.6
38.52 ± 0.5
>0.1
Mean pH 6.86 ± 0.02
6.98 ± 0.02

ResultTable I (part I) : Comparing the various LFTs between newborns with Severe and Moderate asphyxia and Severe Asphyxia and Normal neonate at age of first day
Severe Asphyxia (I)n=16
Moderate Asphyxia (II)n=54
Control (III)
n=30
P valueI vs II
P valueI vs III
Weight 2.90 ± 0.334 3.06 ± 0.36 2.90±0.30 0.662 0.985SGPT/ALT 49.13 ±
32.3248.17 ± 30.59 28.40±15.72
30.632 0.000
SGOT/AST 109.19 ± 49.399
93.65 ± 40.91 68.16 ± 38.11
0.207 0.094
S. LDH 680.06 ± 511.08
388.67± 172.73
329.40 ±157.54
0.000 0.000
ALP 350.75 ± 105.58
338.11 ± 98.30
254.80 ± 98.43
0.727 0.455
Total Protein 5.29 ± 0.55 5.31 ± 0.55 5.71 ± 0.40 0.706 0.030S. Albumin 2.93 ± 0.60 3.07 ± 0.57 3.24 ± 0.40 0.873 0.034Total Bilirubin 5.00 ± 1.16 4.25 ± 1.74 3.45 ± 1.94 0.023 0.006Direct
Bilirubin1.19 ± 0.59 1.19 ± 0.70 1.10 ± 0.50 0.558 0.692
PT 16.32 ± 1.62 15.40 ± 1.77 14.37 ± 1.74 0.521 0.676INR 1.15 ± 0.11 1.15 ± 0.11 1.13 ± 0.08 0.606 0.032

ResultTable I (part II) : Comparing the various LFTs between newborns with Severe and Moderate asphyxia and Severe Asphyxia and Normal neonate at age of third day
Severe Asphyxia (I)n=16
Moderate Asphyxia (II)n=54
Control (III)
n=30
P valueI vs II
P valueI vs III
SGPT/ALT 33.00 ± 14.00
31.44 ± 15.02 24.13 ± 8.15 0.865 0.078
SGOT/AST 60.69 ± 29.88
63.83 ± 24.57 51.87 ± 16.93
0.215 0.004
S. LDH 1693.88 ± 515.28
1060.70 ± 631.72
322.33 ± 122.02
0.997 0.000
ALP 325.81 ± 79.00
283.26 ±68.16
260.50 ± 74.76
0.238 0.568
Total Protein 5.56 ± 0.39 5.68 ± 0.41 5.81 ± 0.30 0.999 0.102S. Albumin 3.06 ± 0.28 3.20 ± 0.45 3.36 ± 0.38 0.007 0.315Total Bilirubin 5.80 ± 1.70 5.99 ± 2.43 5.65 ± 3.07 0.016 0.01Direct
Bilirubin1.18 ± 0.50 1.52 ± 0.76 1.47 ± 0.74 0.057 0.05
PT 15.80 ± 1.25 15.28 ± 1.5 14.38 ± 1.45 0.128 0.290INR 1.09 ± 0.07 1.12 ± 0.09 1.12 ± 0.09 0.358 0.793

ResultTable0.01 I (part III) : Comparing the various LFTs between newborns with Severe and Moderate asphyxia and Severe Asphyxia and Normal neonate at age of tenth day
Severe Asphyxia (I)n=16
Moderate Asphyxia (II)n=54
Control (III)
n=30
P valueI vs II
P valueI vs III
SGPT/ALT 25.81 ± 9.41 26.09 ± 7.9 23.47 ± 7.51 0.414
0.234
SGOT/AST 41.00 ± 13.28
40.96 ± 14.16 40.80 ± 10.80 0.679
0.171
S. LDH 385.81 ± 94.18
348.69 ± 135.46
271.90 ± 111.43
0.024
0.391
ALP 278.63 ± 71.14
271.39 ± 68.33
249.10 ± 77.10 0.846
0.746
Total Protein 5.73 ± 0.35 5.75 ± 0.44 5.81 ± 0.4122 0.203
0.521
S. Albumin 3.27 ± 0.39 3.36 ± 0.48 3.29 ± 0.39 0.122
0.752
Total Bilirubin 3.03 ± 1.53 2.59 ± 1.38 2.25 ± 1.47 0.359
0.598
Direct Bilirubin
1.21 ± 0.63 0.97 ± 0.72 0.7937 ± 0.58 0.764
0.693
PT 14.66 ± 1.42 14.70 ± 1.78 13.920 ± 1.22 0.10 0.509INR 1.12 ± 0.09 1.12 ± 0.09 1.11 ± 0.05 0.74
60.001
Mortality 3 1 0 0.01 0.014

Result
Figure 1. Comparison of serum lactate dehydrogenase (LDH) in neonates with severe asphyxia, with moderate asphyxia, and severe asphyxia with normal control (* significant difference between I and II and # significant difference between I and III).

Result
Figure 2. Comparison of total protein and serum albumin in neonates with severe asphyxia, with moderate asphyxia, and severe asphyxia with normal control (* significant difference between I and II and # significant difference between I and III).

Result
Figure 3. Comparison of serum glutamic pyruvic transaminase (SGPT)/alaninine transferase (ALT) and serum glutamic oxaloacetic transaminase (SGOT)/aspartate transferase (AST) in neonates with severe asphyxia and control (# significant difference).

Result (contd.)
Figure 4. Comparison of international normalized ratio (INR) in neonates with severe asphyxia and normal control (# significant difference).

Result (contd.)
Correlation of APGAR score for neonatal mortality Severely asphyxiated neonates compared with normal APGAR score neonates
OR* 2.2395% CI 1.42 – 3.04P = 0.03
Moderately asphyxiated neonates compared with normal APGAR score neonates
OR* 1.8795% CI# 1.64 – 2.02P = 0.04
* OR - Odds ratio, #CI - Confidence Interval

Result (contd.)
Correlation of APGAR score for Deranged Hepatic FunctionsSeverely asphyxiated neonates compared with normal APGAR score neonates
OR * 4.88 95% CI# 3.26 – 5.84 P = 0.01
Moderately asphyxiated neonates compared with normal APGAR score neonates
OR* 2.4695% CI# 1.94 – 3.32
P = 0.02* OR - Odds ratio, #CI - Confidence Interval
DiscussionKarlsson et al found increase in ALT, AST and LDH in asphyxiated neonates (26 with comparison to 56 healthy neonate) where samples were collected three times during the first 72 hours and once between days 6 and 12 after birth. On another study Karlsson et al assessed whether LDH, ALT, and AST during the first 12 hours after birth predict HIE and adverse neurodevelopment outcome in newborn term infants with intrapartum signs of fetal distress.

DiscussionSánchez-Nava et al and Chhavi et al found almost similar findings where the sample size was 122 (60 control Vs 62 cases) and 120 respectively.
Karlsson M, Blennow M, Nemeth A, Winbladh B. Dynamics of hepatic enzyme activity following birth asphyxia. Acta Paediatr. 2006;95(11):1405–11.Karlsson M, et al. Lactate dehydrogenase predicts hypoxic ischaemic encephalopathy in newborn infants: a preliminary study. Acta Paediatr. 2010;99(8):1139–44. Sánchez-Nava J et al. Increase in glutamic-oxaloacetic and glutamic-pyruvic transaminases and lactic dehydrogenase as a diagnostic aid in perinatal asphyxia. Bol Méd Hosp Infant Méx. 1990;47(6):372–5. Chhavi N, Zutshi K, Singh NK, Awasthi A, Goel A. Serum liver enzyme pattern in birth asphyxia associated liver injury. Pediatr Gastroenterol Hepatol Nutr.2014;17(3):162–9.

DiscussionThere were statistical differences between the two group by which they conclude that the quantification of these enzymes can be useful as a diagnostic tool in cases of perinatal asphyxia.

Limitation of this study Smaller sample size (severe asphyxia
only in 16 babies) Long-term neuro-developmental
outcome was not assessed to see the correlation between severity of hepatic dysfunction and neuro-developmental outcome
No differentiation mentioned on elevation of transaminase by phenytoin, phenobarbitone etc.
No correlation of markers of hepatic health was seen with other markers of stress in patients such as acidosis, ventilation, and neonatal seizure

What could be done furtherA Large scale multi-centre study can be done to evaluate further considering
Other markers of organ injuries due to asphyxia
Long term follow up for the neuro-developmental outcomes in moderately asphyxiated neonates
Interventional measures and effect of drugs on liver

ConclusionAs The severity of dysfunction correlates well with increasing severity of asphyxia and correlates well with poor APGAR score, APGAR score combined with hepatic dysfunction can be used as a prognostic marker for neonatal mortality in infants with severe asphyxia.

THANK YOU