Embed Size (px)
Citation preview
Is Radon Remediation Causing Lung Cancers?
by Mohan Doss, PhD, MCCPM
Medical Physicist
Version 1.04
Jan 27, 2015
Copyright 2015 © by Mohan Doss.
This article in its entirety may be freely copied and distributed.
Disclaimer: This presentation is based on the author’s own professional opinion
and does not necessarily represent the views of his employer or his other
affiliations. The author is an Associate Professor in the Diagnostic Imaging
Department of Fox Chase Cancer Center. The author is also a Founding Member
of Scientists for Accurate Radiation Information (SARI), an international group that
is dedicated to reducing the casualties and harm caused by the unjustified fear of
low-dose radiation.
In the first part of the presentation, the
biological effects of low-dose radiation will
be discussed in general.
In the second part, the effect of residential
radon on lung cancers will be discussed.
First Part of Presentation
Biological Effects of Low-Dose Radiation
How does a small amount of radiation affect cancer risk?
There are basically two competing arguments
as to how a small amount of radiation
affects cancer risk.
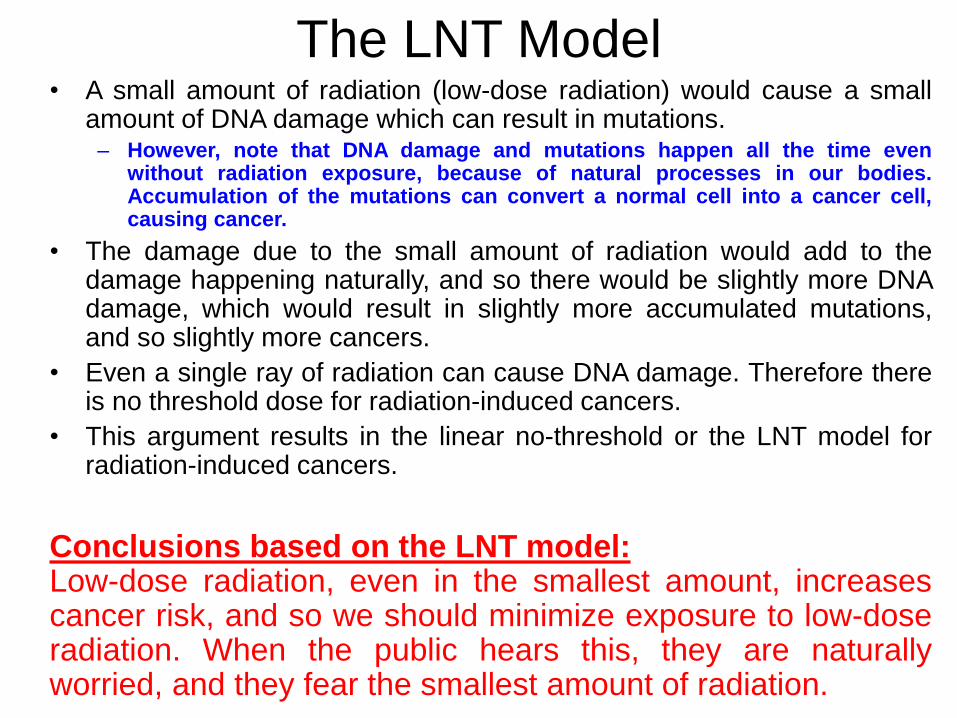
The LNT Model • A small amount of radiation (low-dose radiation) would cause a small
amount of DNA damage which can result in mutations. – However, note that DNA damage and mutations happen all the time even
without radiation exposure, because of natural processes in our bodies. Accumulation of the mutations can convert a normal cell into a cancer cell, causing cancer.
• The damage due to the small amount of radiation would add to the damage happening naturally, and so there would be slightly more DNA damage, which would result in slightly more accumulated mutations, and so slightly more cancers.
• Even a single ray of radiation can cause DNA damage. Therefore there is no threshold dose for radiation-induced cancers.
• This argument results in the linear no-threshold or the LNT model for radiation-induced cancers.
Conclusions based on the LNT model: Low-dose radiation, even in the smallest amount, increases cancer risk, and so we should minimize exposure to low-dose radiation. When the public hears this, they are naturally worried, and they fear the smallest amount of radiation.
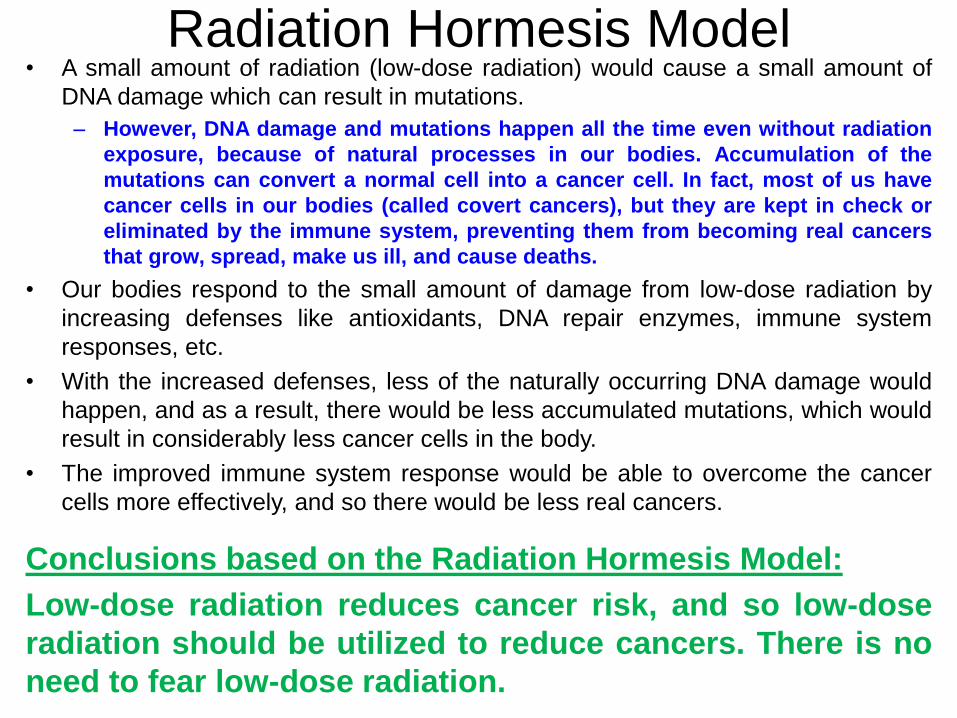
Radiation Hormesis Model • A small amount of radiation (low-dose radiation) would cause a small amount of
DNA damage which can result in mutations.
– However, DNA damage and mutations happen all the time even without radiation
exposure, because of natural processes in our bodies. Accumulation of the
mutations can convert a normal cell into a cancer cell. In fact, most of us have
cancer cells in our bodies (called covert cancers), but they are kept in check or
eliminated by the immune system, preventing them from becoming real cancers
that grow, spread, make us ill, and cause deaths.
• Our bodies respond to the small amount of damage from low-dose radiation by
increasing defenses like antioxidants, DNA repair enzymes, immune system
responses, etc.
• With the increased defenses, less of the naturally occurring DNA damage would
happen, and as a result, there would be less accumulated mutations, which would
result in considerably less cancer cells in the body.
• The improved immune system response would be able to overcome the cancer
cells more effectively, and so there would be less real cancers.
Conclusions based on the Radiation Hormesis Model:
Low-dose radiation reduces cancer risk, and so low-dose
radiation should be utilized to reduce cancers. There is no
need to fear low-dose radiation.
LNT Model vs. Radiation Hormesis Model
We have seen two competing models
on the biological effects of low-dose radiation.
How can we decide between the two models,
which make opposing predictions
for the cancer risk from low-dose radiation?
• The scientific method of deciding between competing models is to perform experiments or make observations and see which model is able to predict the results of the experiments or explain observations correctly.
• Let us review how low-dose radiation affects cancer risk by examining results from published human studies.
The next two pages show how the cancer risk (expressed in different forms) varies as a function of radiation dose, from a variety of human studies.
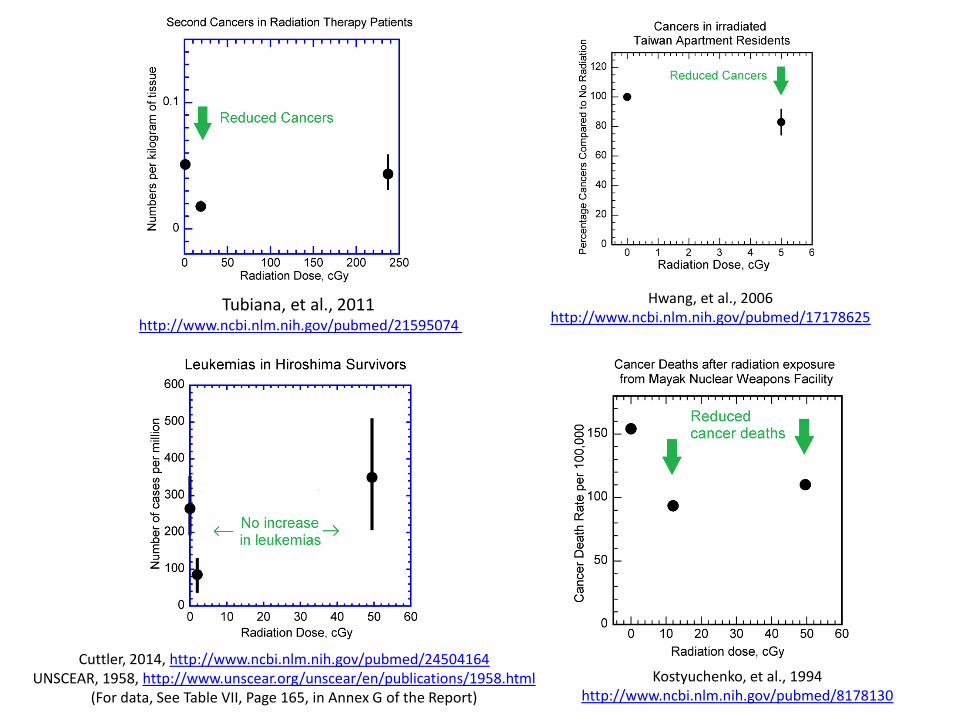
Tubiana, et al., 2011 http://www.ncbi.nlm.nih.gov/pubmed/21595074
Hwang, et al., 2006 http://www.ncbi.nlm.nih.gov/pubmed/17178625
Kostyuchenko, et al., 1994 http://www.ncbi.nlm.nih.gov/pubmed/8178130
Cuttler, 2014, http://www.ncbi.nlm.nih.gov/pubmed/24504164 UNSCEAR, 1958, http://www.unscear.org/unscear/en/publications/1958.html
(For data, See Table VII, Page 165, in Annex G of the Report)
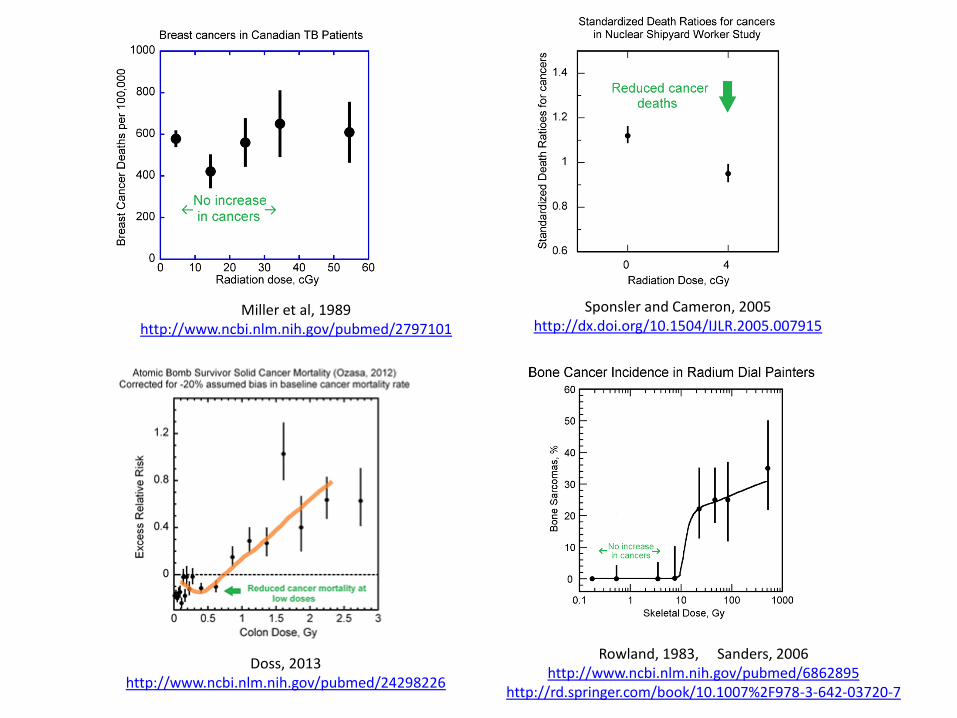
Miller et al, 1989 http://www.ncbi.nlm.nih.gov/pubmed/2797101
Doss, 2013 http://www.ncbi.nlm.nih.gov/pubmed/24298226
Sponsler and Cameron, 2005 http://dx.doi.org/10.1504/IJLR.2005.007915
Rowland, 1983, Sanders, 2006 http://www.ncbi.nlm.nih.gov/pubmed/6862895
http://rd.springer.com/book/10.1007%2F978-3-642-03720-7
All of the results displayed in the graphs above indicate the cancer risk reduced following low-dose radiation exposure or cancer risk did not increase following low-does radiation exposure, indicating there is a threshold dose for increased cancers.
These data are contrary to the LNT model but are consistent with the Radiation Hormesis model.
Evidence claimed to support the LNT Model
Notwithstanding the above published evidence against the
LNT model spanning the period from 1958 to the present,
the LNT model was adopted for radiation safety by
international and national advisory bodies in the 1950s and
repeatedly endorsed. The LNT model is used by regulatory
agencies and professional organizations.
Let us examine the main data used for estimating low-dose
radiation cancer risks in the BEIR VII Report, published in
2006 by one of the advisory bodies, National Academy of
Sciences, which endorsed the use of the LNT model.
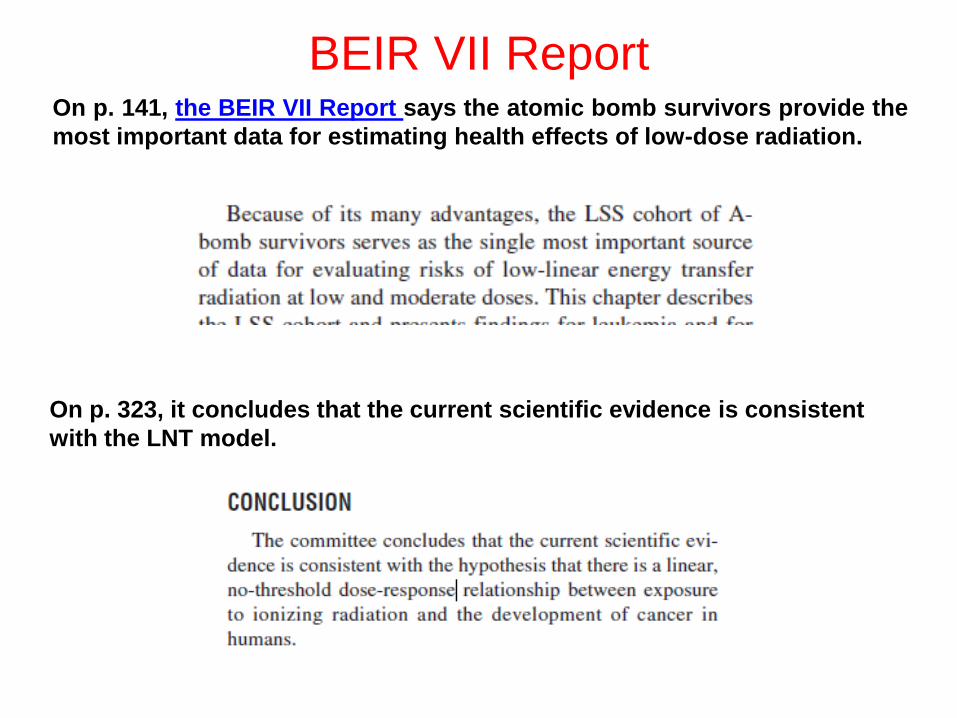
BEIR VII Report On p. 141, the BEIR VII Report says the atomic bomb survivors provide the
most important data for estimating health effects of low-dose radiation.
On p. 323, it concludes that the current scientific evidence is consistent
with the LNT model.
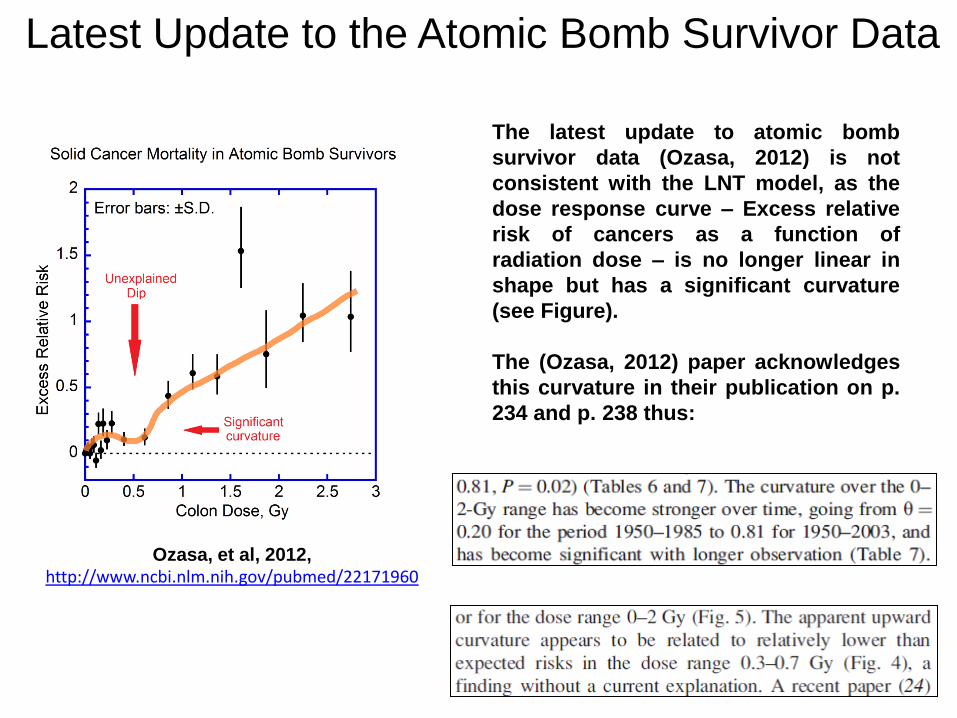
Ozasa, et al, 2012, http://www.ncbi.nlm.nih.gov/pubmed/22171960
Latest Update to the Atomic Bomb Survivor Data
The latest update to atomic bomb
survivor data (Ozasa, 2012) is not
consistent with the LNT model, as the
dose response curve – Excess relative
risk of cancers as a function of
radiation dose – is no longer linear in
shape but has a significant curvature
(see Figure).
The (Ozasa, 2012) paper acknowledges
this curvature in their publication on p.
234 and p. 238 thus:
Hence, the atomic bomb survivor data are no longer
consistent with the LNT model, and so do not provide
evidence for cancer risk of low-dose radiation.
This conclusion has been recognized by experts in this
field. For example, in the recent debate on the health
effects of low-dose radiation, the expert supporting the LNT
model and low-dose radiation cancer risk did not use the
atomic bomb survivor data to justify his claim of low-dose
radiation cancer risk in his opening statement, in contrast to
earlier such debates.
Thus, the most important data claimed as support for the
LNT model, do not support the LNT model any longer.
Many publications have made claims of evidence showing increased
cancer risk from low-dose radiation or claims of evidence supporting the
LNT model, but on closer scrutiny, they all are found to have major flaws
in their data, analysis, and/or interpretation invalidating their conclusions
or raising major doubts about their conclusions.
Please see the report entitled:
“Evaluating Claims of Increased Cancer Risk from Low-Dose Radiation”
Second Part of Presentation
The Effect of Residential Radon on Lung Cancers
LUNG CANCER • Lung Cancer is the leading cause of cancer death in the USA.
• Lung cancer is among the deadliest of the cancers. Over half
of people with lung cancer die within one year of being
diagnosed. The lung cancer five-year survival rate is lower
than many other leading cancer sites, such as the colon,
breast and prostate.
Hence, it is important to know
how residential radon affects lung cancer risk,
and take appropriate actions to reduce the risk.
Radon in Mines vs. Residential Radon
The radiation from radon and its decay products is absorbed mainly in the lungs. • Mines (in olden days with poor ventilation)
had extremely high levels of radon, which resulted in high doses of radiation to the lungs, and the miners did develop more lung cancers.
• Residential radon levels are very low compared to poorly ventilated mines of olden days. Residential radon would result in low-dose radiation exposure to the lungs.
Effect of residential radon on lung cancers.
According to the LNT model, residential radon would increase lung cancer risk.
According to the Radiation Hormesis model, residential radon would decrease lung cancer risk.
Let us now compare the residential radon and lung cancer data to determine which model is able to explain the data.
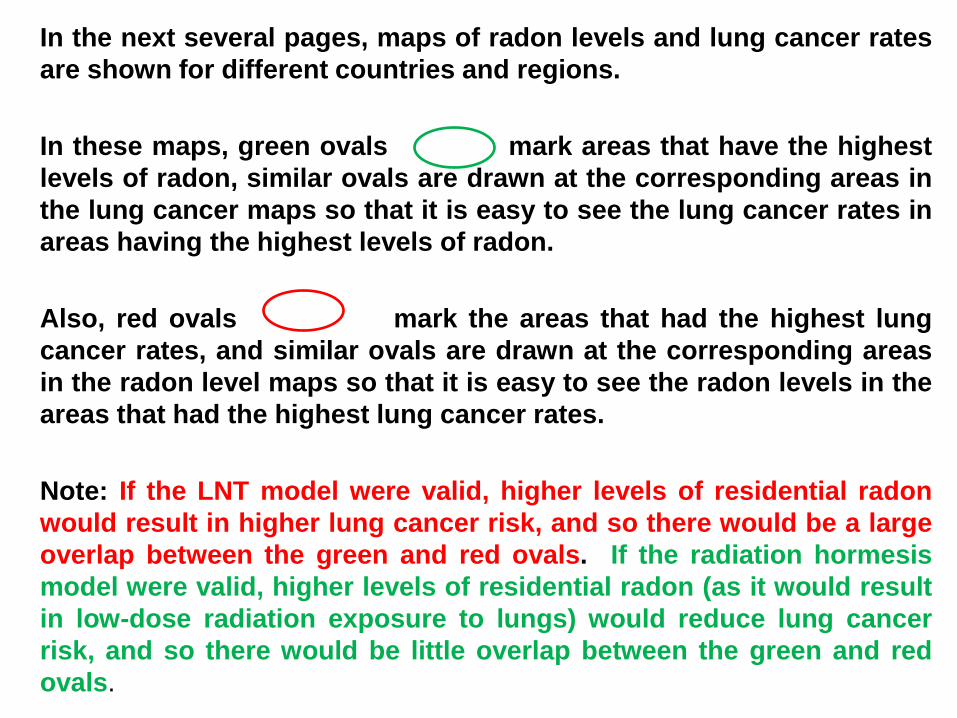
In the next several pages, maps of radon levels and lung cancer rates
are shown for different countries and regions.
In these maps, green ovals mark areas that have the highest
levels of radon, similar ovals are drawn at the corresponding areas in
the lung cancer maps so that it is easy to see the lung cancer rates in
areas having the highest levels of radon.
Also, red ovals mark the areas that had the highest lung
cancer rates, and similar ovals are drawn at the corresponding areas
in the radon level maps so that it is easy to see the radon levels in the
areas that had the highest lung cancer rates.
Note: If the LNT model were valid, higher levels of residential radon
would result in higher lung cancer risk, and so there would be a large
overlap between the green and red ovals. If the radiation hormesis
model were valid, higher levels of residential radon (as it would result
in low-dose radiation exposure to lungs) would reduce lung cancer
risk, and so there would be little overlap between the green and red
ovals.
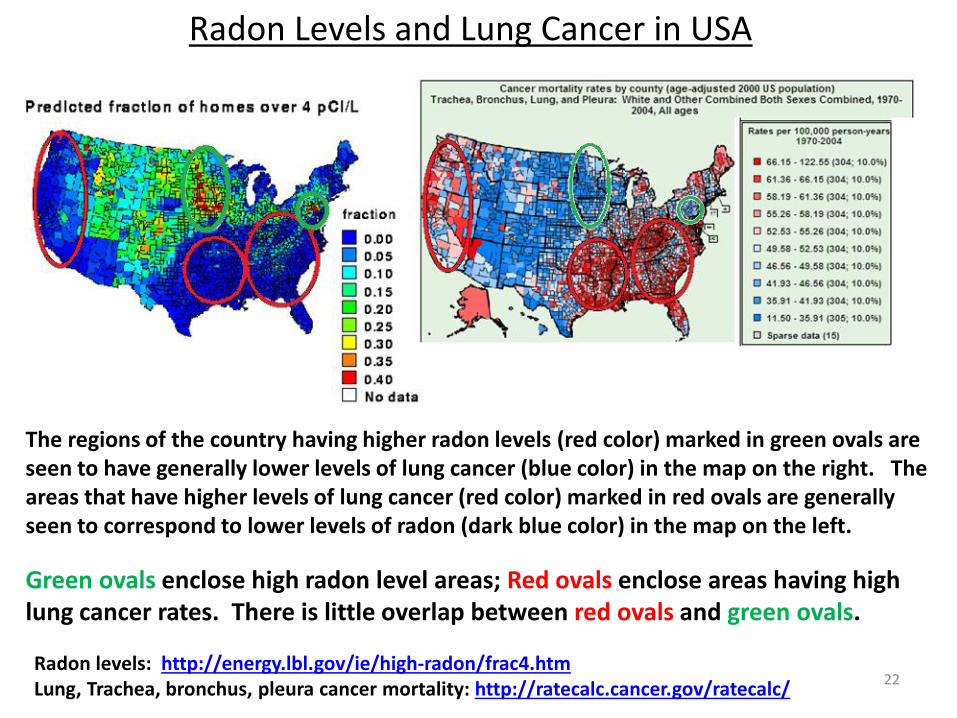
Radon levels: http://energy.lbl.gov/ie/high-radon/frac4.htm Lung, Trachea, bronchus, pleura cancer mortality: http://ratecalc.cancer.gov/ratecalc/
22
Radon Levels and Lung Cancer in USA
The regions of the country having higher radon levels (red color) marked in green ovals are seen to have generally lower levels of lung cancer (blue color) in the map on the right. The areas that have higher levels of lung cancer (red color) marked in red ovals are generally seen to correspond to lower levels of radon (dark blue color) in the map on the left.
Green ovals enclose high radon level areas; Red ovals enclose areas having high lung cancer rates. There is little overlap between red ovals and green ovals.
Now we will look at the data
for some individual states.
24
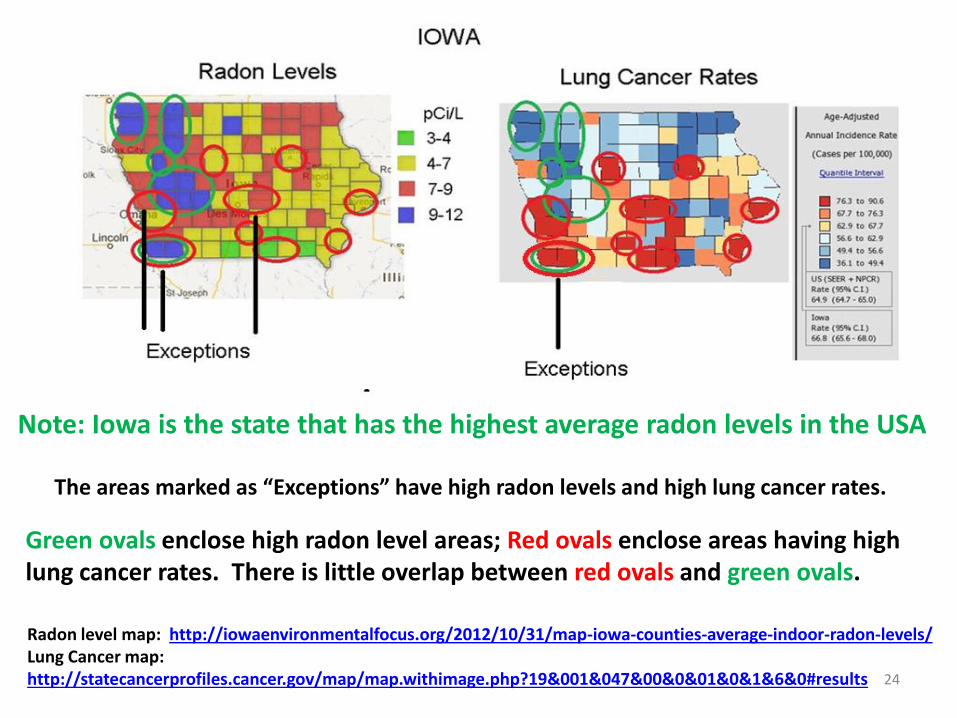
Radon level map: http://iowaenvironmentalfocus.org/2012/10/31/map-iowa-counties-average-indoor-radon-levels/ Lung Cancer map: http://statecancerprofiles.cancer.gov/map/map.withimage.php?19&001&047&00&0&01&0&1&6&0#results
Note: Iowa is the state that has the highest average radon levels in the USA
The areas marked as “Exceptions” have high radon levels and high lung cancer rates.
Green ovals enclose high radon level areas; Red ovals enclose areas having high lung cancer rates. There is little overlap between red ovals and green ovals.
Radon Level Map http://www.dshs.state.tx.us/radiation/radon.shtm Lung Cancer Map http://statecancerprofiles.cancer.gov/map/map.withimage.php?48&001&047&00&0&01&0&1&6&0#results
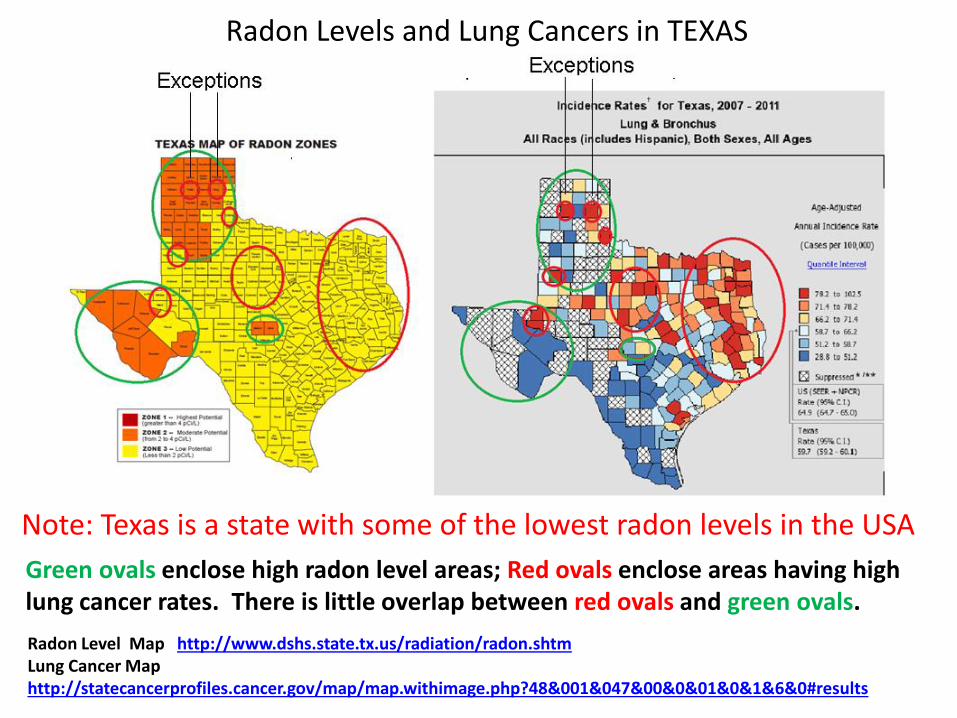
Radon Levels and Lung Cancers in TEXAS
Note: Texas is a state with some of the lowest radon levels in the USA
Green ovals enclose high radon level areas; Red ovals enclose areas having high lung cancer rates. There is little overlap between red ovals and green ovals.
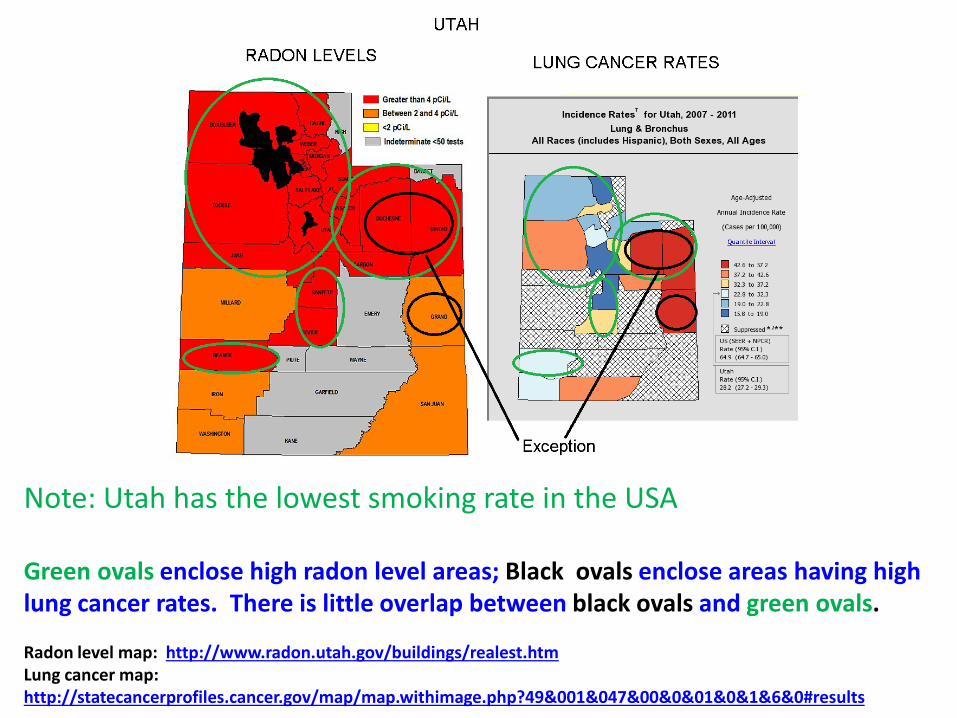
Note: Utah has the lowest smoking rate in the USA Green ovals enclose high radon level areas; Black ovals enclose areas having high lung cancer rates. There is little overlap between black ovals and green ovals. Radon level map: http://www.radon.utah.gov/buildings/realest.htm Lung cancer map: http://statecancerprofiles.cancer.gov/map/map.withimage.php?49&001&047&00&0&01&0&1&6&0#results
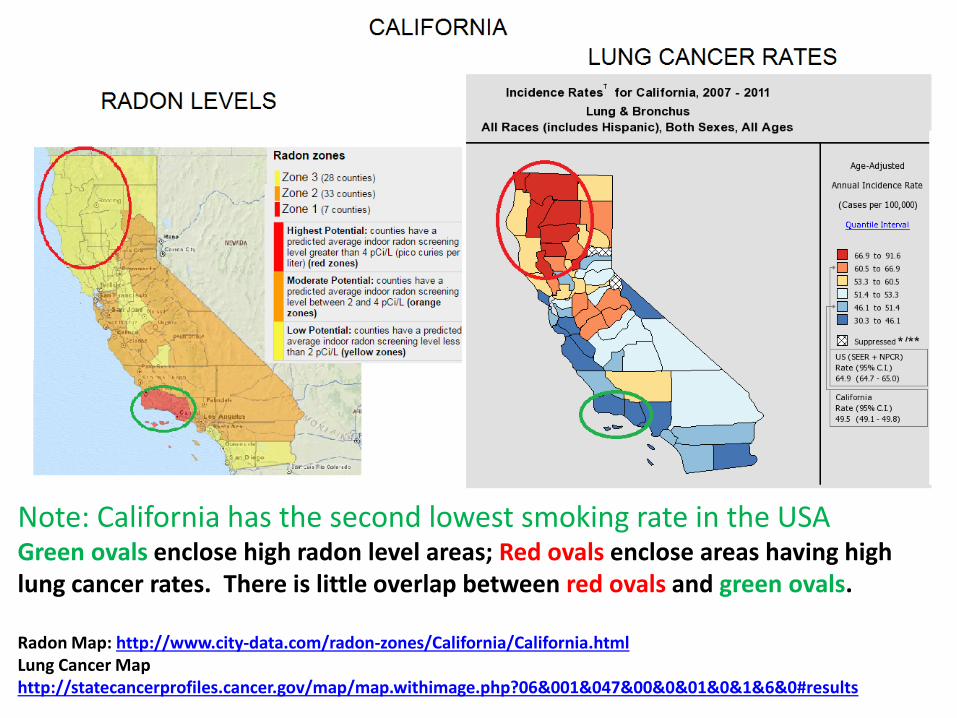
Note: California has the second lowest smoking rate in the USA Green ovals enclose high radon level areas; Red ovals enclose areas having high lung cancer rates. There is little overlap between red ovals and green ovals. Radon Map: http://www.city-data.com/radon-zones/California/California.html Lung Cancer Map http://statecancerprofiles.cancer.gov/map/map.withimage.php?06&001&047&00&0&01&0&1&6&0#results
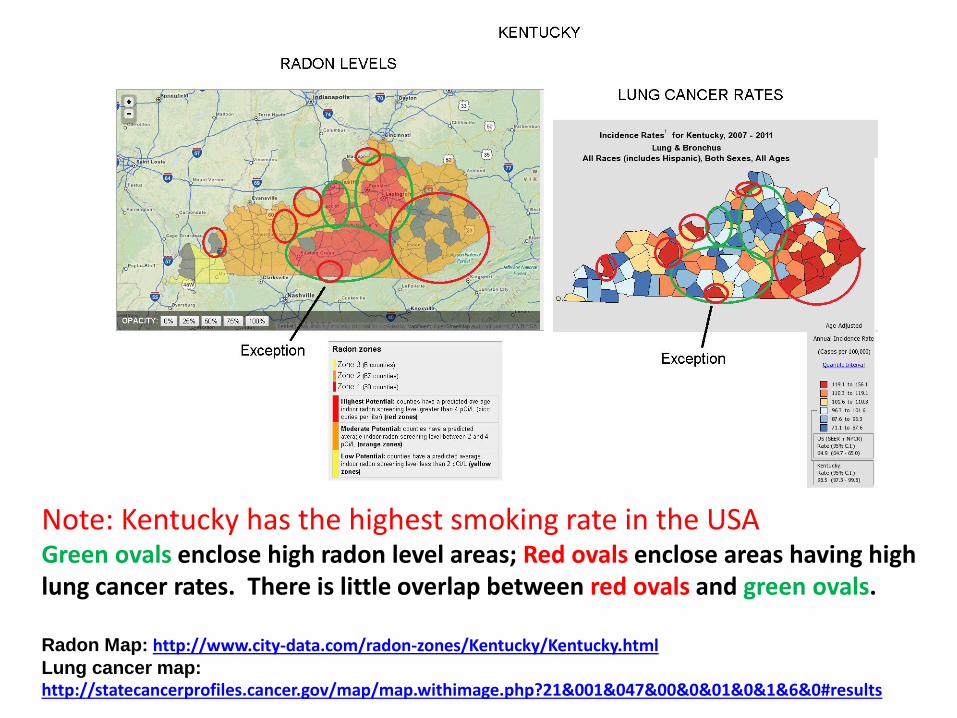
Note: Kentucky has the highest smoking rate in the USA Green ovals enclose high radon level areas; Red ovals enclose areas having high lung cancer rates. There is little overlap between red ovals and green ovals. Radon Map: http://www.city-data.com/radon-zones/Kentucky/Kentucky.html Lung cancer map: http://statecancerprofiles.cancer.gov/map/map.withimage.php?21&001&047&00&0&01&0&1&6&0#results
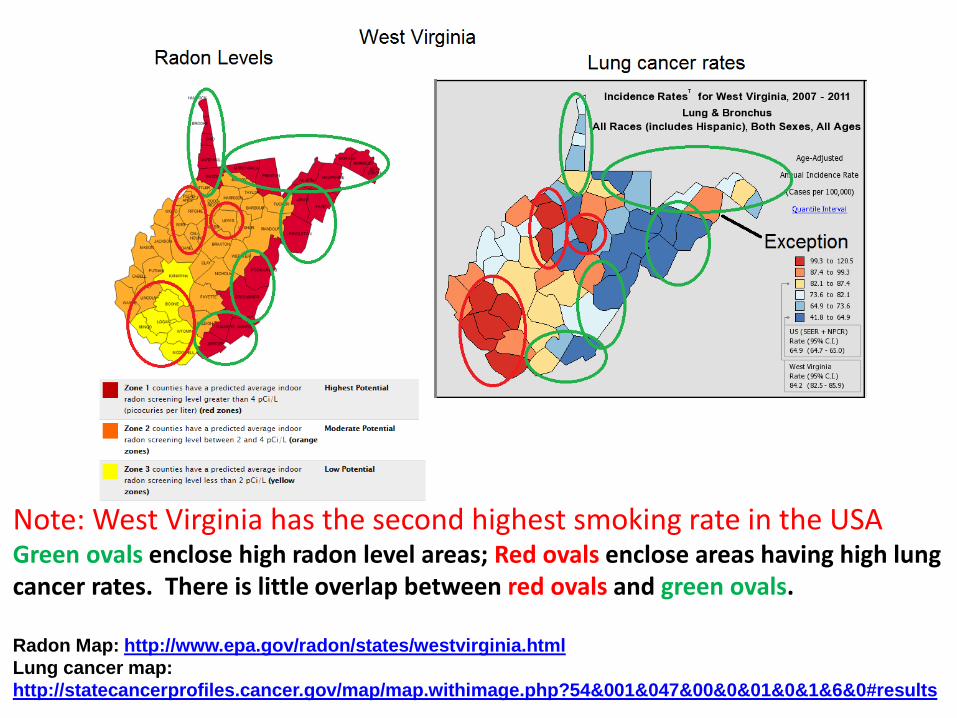
Note: West Virginia has the second highest smoking rate in the USA Green ovals enclose high radon level areas; Red ovals enclose areas having high lung cancer rates. There is little overlap between red ovals and green ovals. Radon Map: http://www.epa.gov/radon/states/westvirginia.html
Lung cancer map:
http://statecancerprofiles.cancer.gov/map/map.withimage.php?54&001&047&00&0&01&0&1&6&0#results
Now let us examine Radon and Lung Cancer Maps in a few other countries/regions
(for which the maps are
readily available on the Internet)
I wish to thank Andreas Hampe from Stuttgart, Germany for emailing me radon and lung cancer maps (and links to them) for Europe and for some countries in Europe some of which I have used in the presentation. I also thank Andreas for pointing out some errors in my interpretation of maps in earlier versions of this presentation.
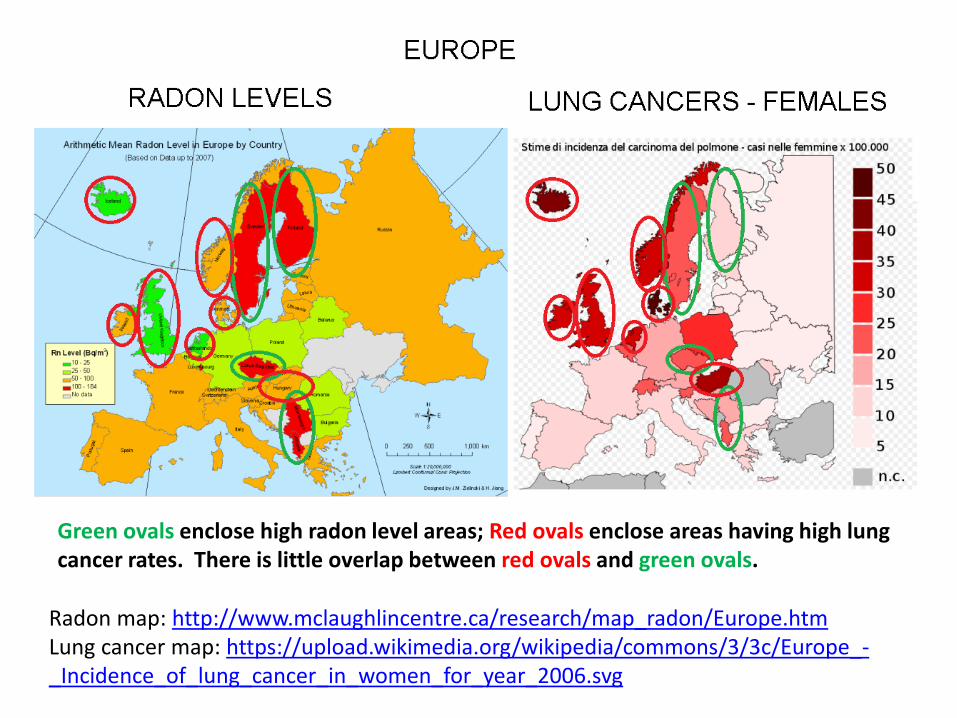
Radon map: http://www.mclaughlincentre.ca/research/map_radon/Europe.htm Lung cancer map: https://upload.wikimedia.org/wikipedia/commons/3/3c/Europe_-_Incidence_of_lung_cancer_in_women_for_year_2006.svg
Green ovals enclose high radon level areas; Red ovals enclose areas having high lung cancer rates. There is little overlap between red ovals and green ovals.
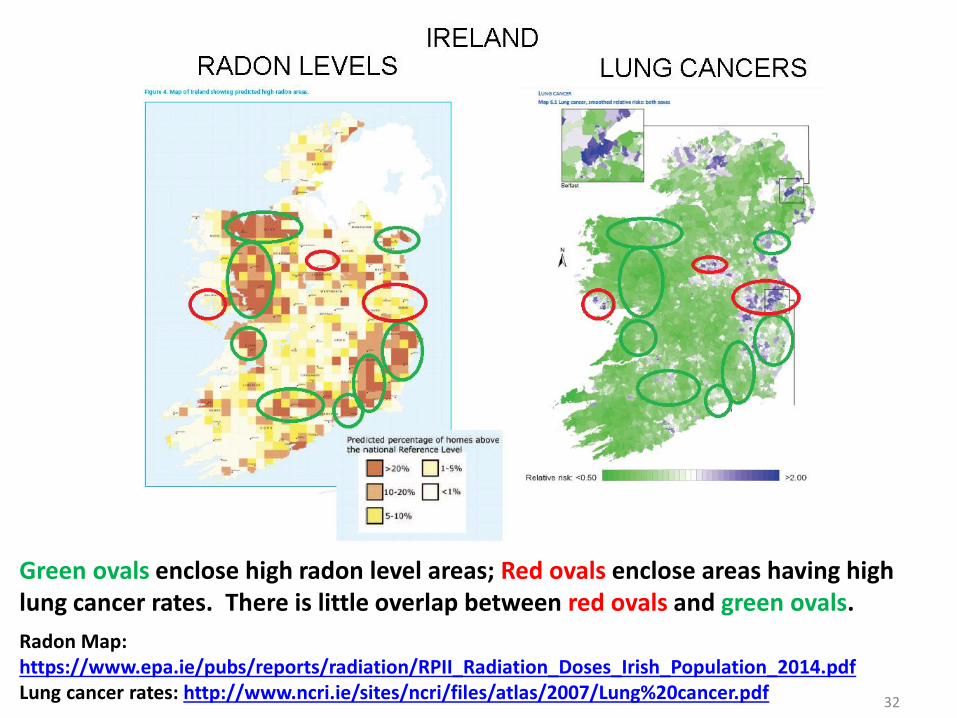
Radon Map: https://www.epa.ie/pubs/reports/radiation/RPII_Radiation_Doses_Irish_Population_2014.pdf Lung cancer rates: http://www.ncri.ie/sites/ncri/files/atlas/2007/Lung%20cancer.pdf
32
Green ovals enclose high radon level areas; Red ovals enclose areas having high lung cancer rates. There is little overlap between red ovals and green ovals.
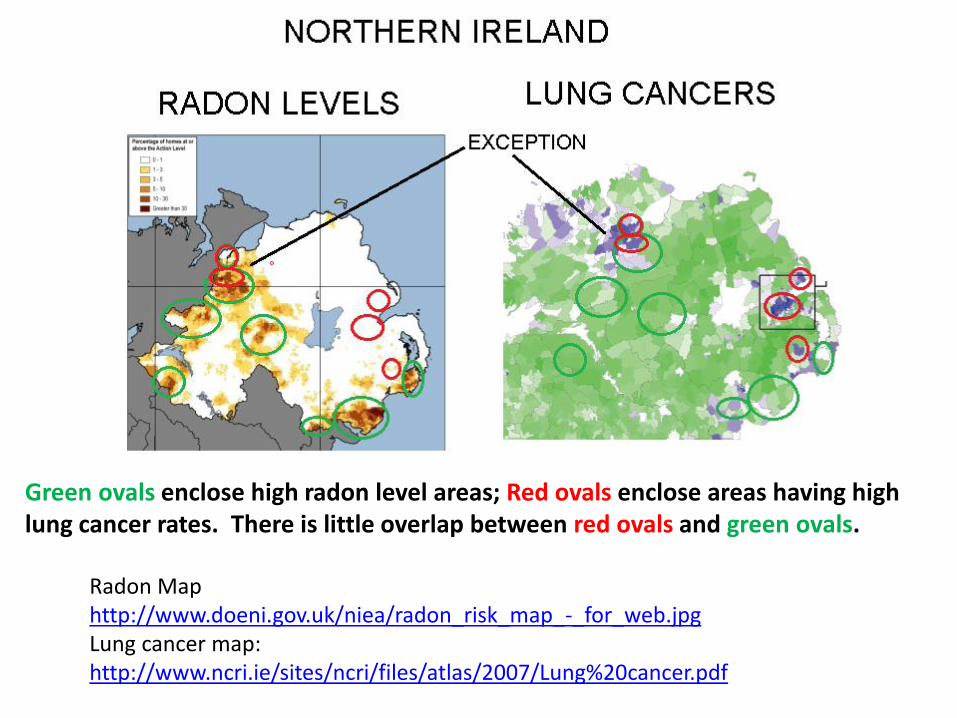
Radon Map http://www.doeni.gov.uk/niea/radon_risk_map_-_for_web.jpg Lung cancer map: http://www.ncri.ie/sites/ncri/files/atlas/2007/Lung%20cancer.pdf
Green ovals enclose high radon level areas; Red ovals enclose areas having high lung cancer rates. There is little overlap between red ovals and green ovals.
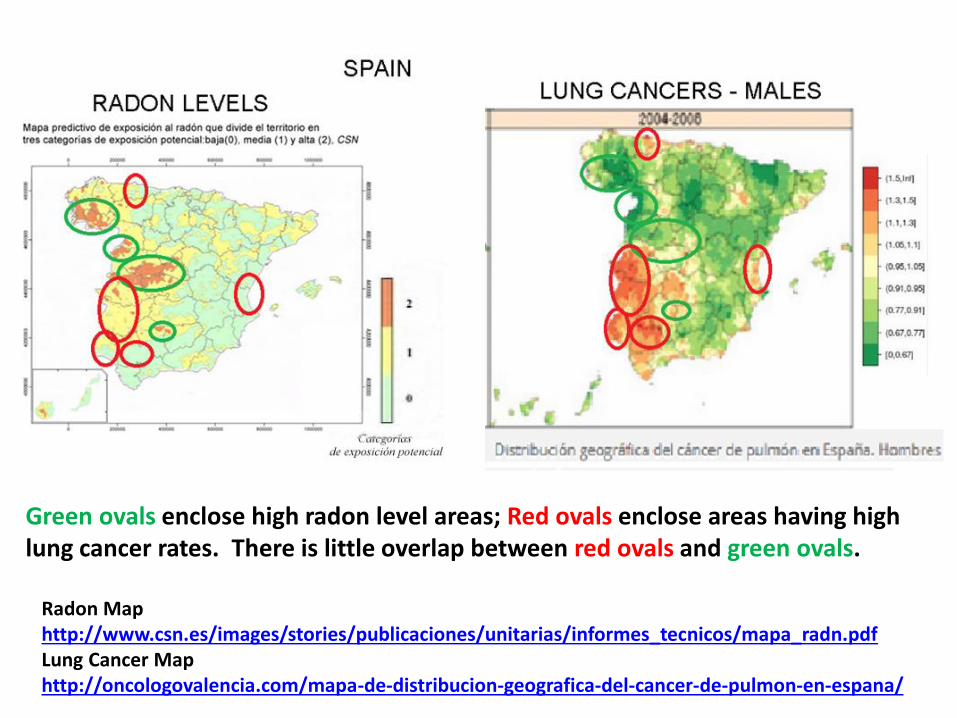
Radon Map http://www.csn.es/images/stories/publicaciones/unitarias/informes_tecnicos/mapa_radn.pdf Lung Cancer Map http://oncologovalencia.com/mapa-de-distribucion-geografica-del-cancer-de-pulmon-en-espana/
Green ovals enclose high radon level areas; Red ovals enclose areas having high lung cancer rates. There is little overlap between red ovals and green ovals.
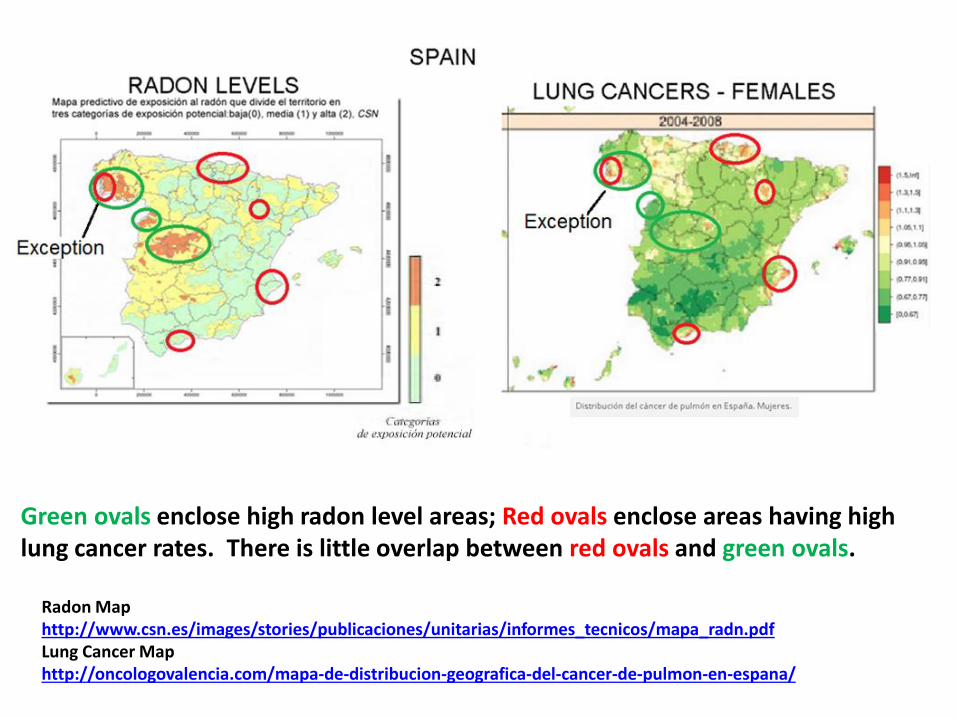
Radon Map http://www.csn.es/images/stories/publicaciones/unitarias/informes_tecnicos/mapa_radn.pdf Lung Cancer Map http://oncologovalencia.com/mapa-de-distribucion-geografica-del-cancer-de-pulmon-en-espana/
Green ovals enclose high radon level areas; Red ovals enclose areas having high lung cancer rates. There is little overlap between red ovals and green ovals.
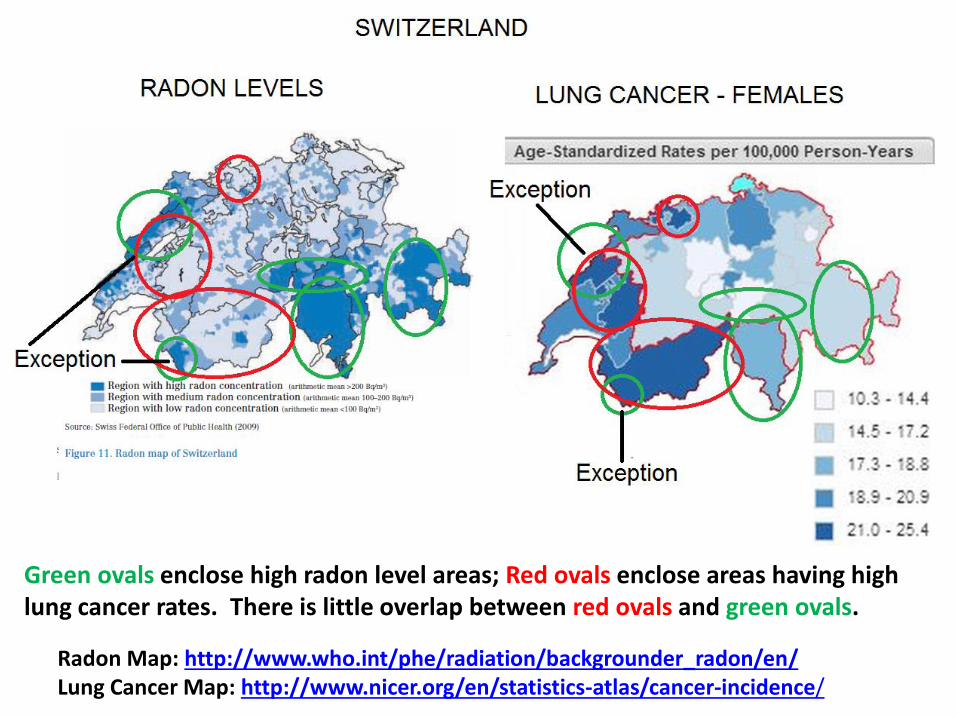
Radon Map: http://www.who.int/phe/radiation/backgrounder_radon/en/ Lung Cancer Map: http://www.nicer.org/en/statistics-atlas/cancer-incidence/
Green ovals enclose high radon level areas; Red ovals enclose areas having high lung cancer rates. There is little overlap between red ovals and green ovals.
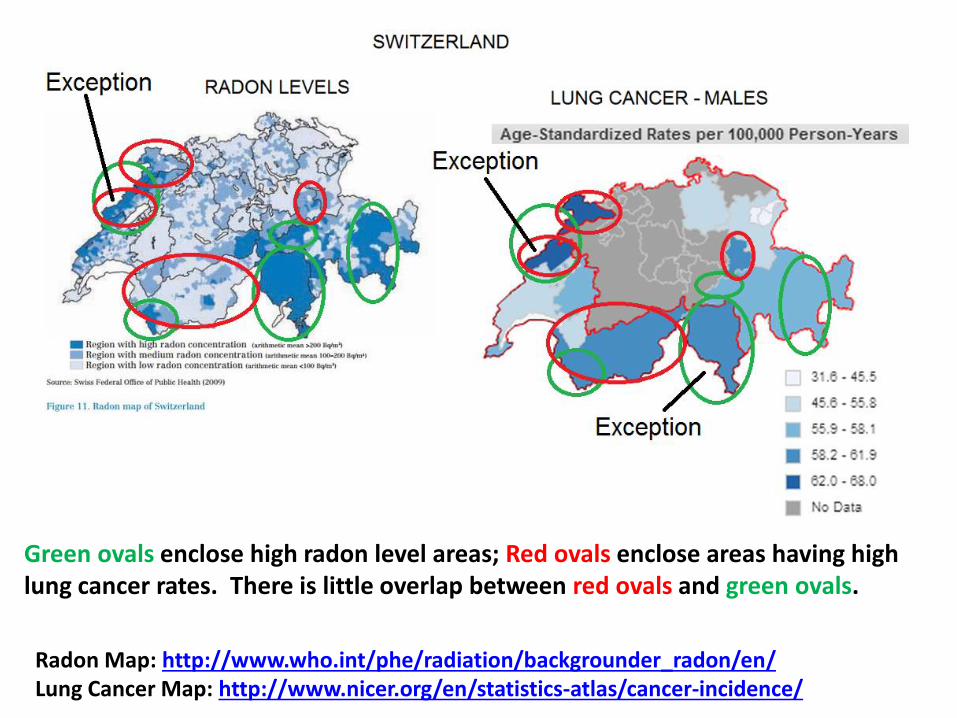
Radon Map: http://www.who.int/phe/radiation/backgrounder_radon/en/ Lung Cancer Map: http://www.nicer.org/en/statistics-atlas/cancer-incidence/
Green ovals enclose high radon level areas; Red ovals enclose areas having high lung cancer rates. There is little overlap between red ovals and green ovals.
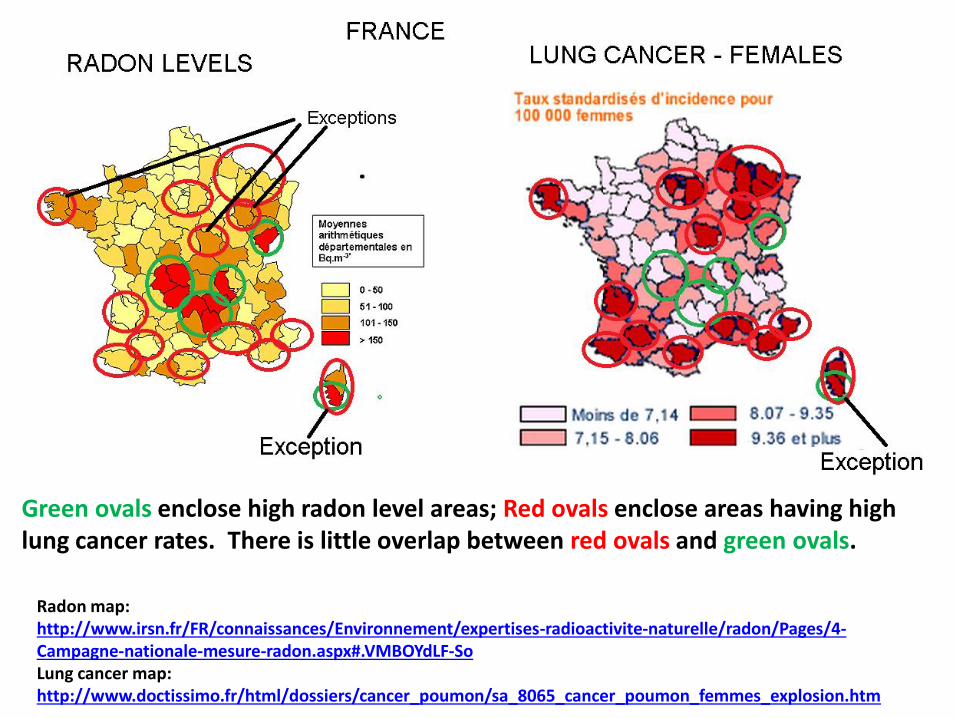
Radon map: http://www.irsn.fr/FR/connaissances/Environnement/expertises-radioactivite-naturelle/radon/Pages/4-Campagne-nationale-mesure-radon.aspx#.VMBOYdLF-So Lung cancer map: http://www.doctissimo.fr/html/dossiers/cancer_poumon/sa_8065_cancer_poumon_femmes_explosion.htm
Green ovals enclose high radon level areas; Red ovals enclose areas having high lung cancer rates. There is little overlap between red ovals and green ovals.
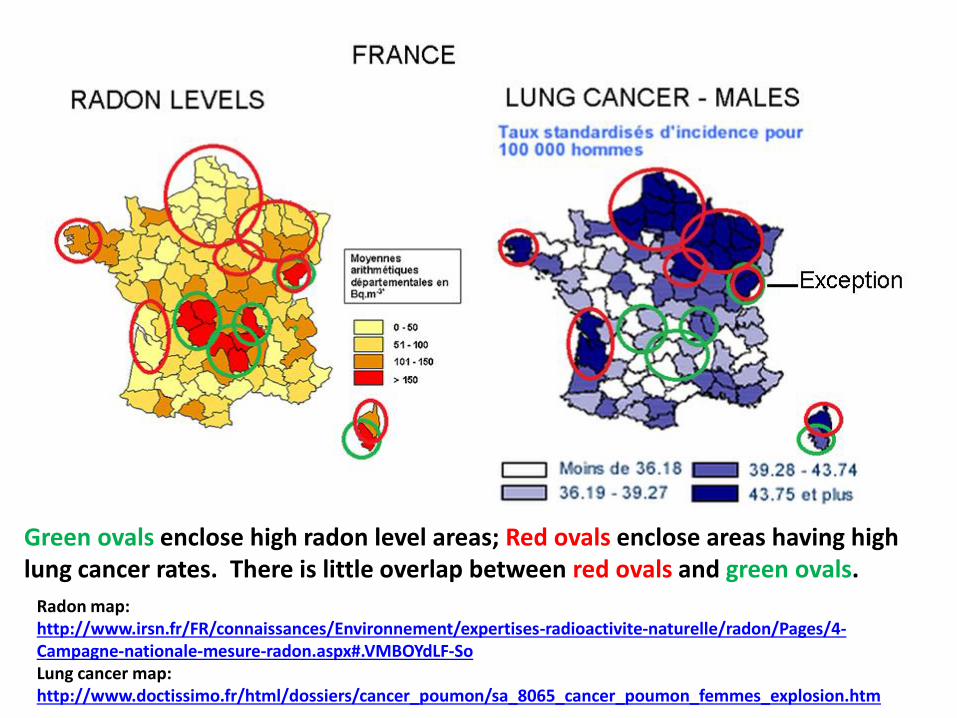
Radon map: http://www.irsn.fr/FR/connaissances/Environnement/expertises-radioactivite-naturelle/radon/Pages/4-Campagne-nationale-mesure-radon.aspx#.VMBOYdLF-So Lung cancer map: http://www.doctissimo.fr/html/dossiers/cancer_poumon/sa_8065_cancer_poumon_femmes_explosion.htm
Green ovals enclose high radon level areas; Red ovals enclose areas having high lung cancer rates. There is little overlap between red ovals and green ovals.
In these maps, we observe that the areas with the highest radon levels generally have lower lung cancer rates, and the areas with the highest lung cancer rates have lower radon levels, barring some exceptions that have been marked in the maps. The same pattern is observed in states having low radon levels (e.g. Texas) in states having high radon levels (e.g. Iowa), in states having low smoking rates (Utah, California), in states having high smoking rates (Kentucky, West Virginia), and also in different countries. The links to the maps are on each page, so you can verify the authenticity of the maps. All I have done is to draw some ovals on the maps to highlight the data. I have also highlighted the exceptions to the above pattern by marking them.
A common criticism regarding the above comparison of radon maps and lung cancer maps is that there are many confounding factors, and so it would not be appropriate to conclude residential radon decreases lung cancers. Correlation is not causation, they would say.
However, when the observed pattern of increased radon levels with reduced lung cancers occurs again and again and again….., and it occurs in states with low average radon levels, states with high average radon levels, states with low smoking prevalence, states with high smoking prevalence, many different countries, etc., these observations are consistent with other observed evidence for the cancer preventive effect of low-dose radiation, and there is a biological explanation for the phenomenon, the most plausible conclusion would be that residential radon decreases lung cancers.
Residential radon decreases lung cancers
Hence, Radon Remediation
would increase lung cancers.
CONCLUSION FROM COMPARISON OF RADON AND LUNG CANCER MAPS,
OTHER DATA, AND ARGUMENTS
A terrible mistake appears to have been committed by the advisory bodies, professional organizations, government agencies, scientists, etc. who have advised the public to do radon remediation with the claim that it would reduce lung cancer risk, but all the evidence shown indicates radon remediation would increase lung cancer risk.
The problem is that the advisory bodies have ignored the available evidence for the cancer preventive effect of low-dose radiation and have continued to base their advice on the LNT model for which there is no valid evidence.
Repeated appeals by scientists who have pointed out the evidence for the cancer preventive effect of low-dose radiation have failed to sway the advisory bodies.
Professional organizations, government agencies, and individual scientists have ignored the available evidence against the LNT model and have followed the advice of the advisory bodies in recommending radon remediation.
It is therefore important to determine, if radon remediation has indeed increased lung cancer risk.
A systematic study would need to be conducted to determine if radon remediation has increased lung cancer risk.
To obtain funding for the study, some preliminary data on radon remediation and subsequent lung cancer risk would be useful.
If your home had radon remediation performed in the past, please answer the Survey and provide some details.
If sufficient amount of evidence is found for increased lung cancers following radon remediation in this preliminary survey, a more systematic study would be proposed and funding sought for the study.
For the question posed in the title of the presentation:
“Is radon remediation causing lung cancers?”
The tentative answer is: Yes (with a high degree of confidence)
The final answer will be provided by future systematic studies.
Please give your opinion on this presentation
by taking the Survey. Thanks.


![Indoor Air Quality (IAQ) - Radon · Radon, please call your State Radon Contact or the National Radon Information Line at: 1-800-SOS-RADON [1 (800) 767-7236], or (if you have tested](https://img.pdfslide.us/doc/110x75/5fb2e8f6d1a5cc5c8d33d275/indoor-air-quality-iaq-radon-radon-please-call-your-state-radon-contact-or.jpg)


![400a - MikroM MVC201 SecurityPolicy V1.04...Introduction MVC201 – non-proprietary Security Policy may be reproduced only in its original entirety [without revision]. V1.04 [6/27]](https://img.pdfslide.us/doc/110x75/5f50da7411682d1daa136a6c/400a-mikrom-mvc201-securitypolicy-v104-introduction-mvc201-a-non-proprietary.jpg)