Embed Size (px)
Citation preview
Will the ASEAN Countries Reach the MDGs Target for Infant Mortality
Rate?
bySaad Lebaz
Abdul Hadi Ilman
Summary
• Background• Methods• Findings
- Only one country will meet the MDG target by 2015
- All countries will reach the target by 2050• Conclusion
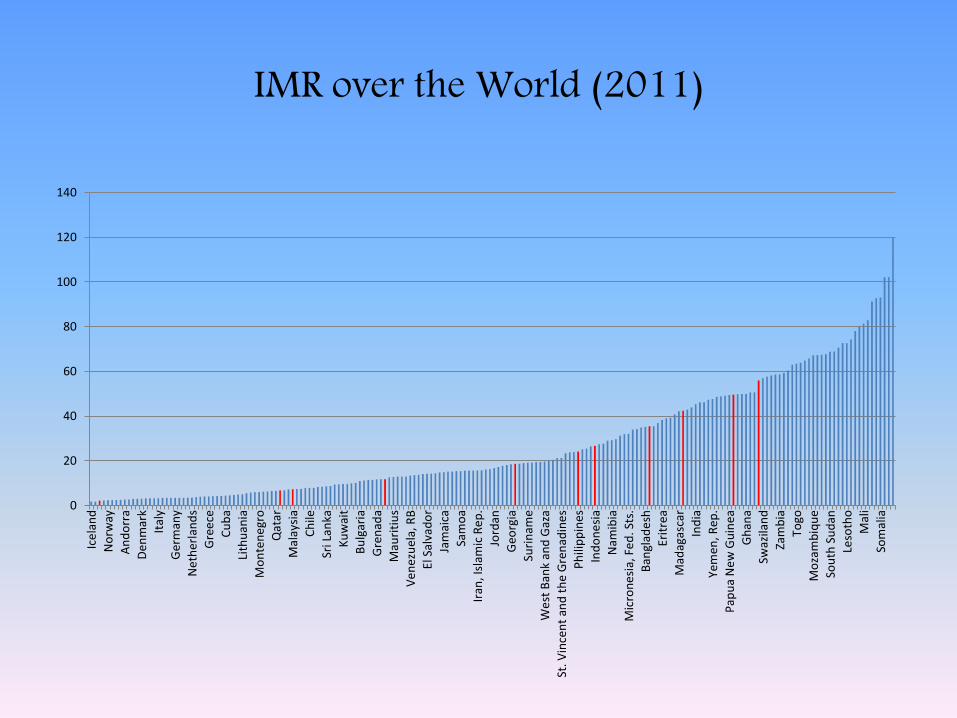
IMR over the World (2011)
0
20
40
60
80
100
120
140
Ice
lan
d
No
rway
An
do
rra
De
nm
ark
Ital
y
Ger
man
y
Net
her
lan
ds
Gre
ece
Cu
ba
Lith
uan
ia
Mo
nte
ne
gro
Qat
ar
Mal
aysi
a
Ch
ile
Sri L
anka
Ku
wai
t
Bu
lgar
ia
Gre
nad
a
Mau
riti
us
Ve
nez
uel
a, R
B
El S
alva
do
r
Jam
aica
Sam
oa
Iran
, Isl
amic
Re
p.
Jord
an
Geo
rgia
Suri
nam
e
We
st B
ank
and
Gaz
a
St. V
ince
nt
and
th
e G
ren
adin
es
Ph
ilip
pin
es
Ind
on
esi
a
Nam
ibia
Mic
ron
esi
a, F
ed
. Sts
.
Ban
glad
esh
Erit
rea
Mad
agas
car
Ind
ia
Yem
en, R
ep.
Pap
ua
Ne
w G
uin
ea
Gh
ana
Swaz
ilan
d
Zam
bia
Togo
Mo
zam
biq
ue
Sou
th S
ud
an
Leso
tho
Mal
i
Som
alia
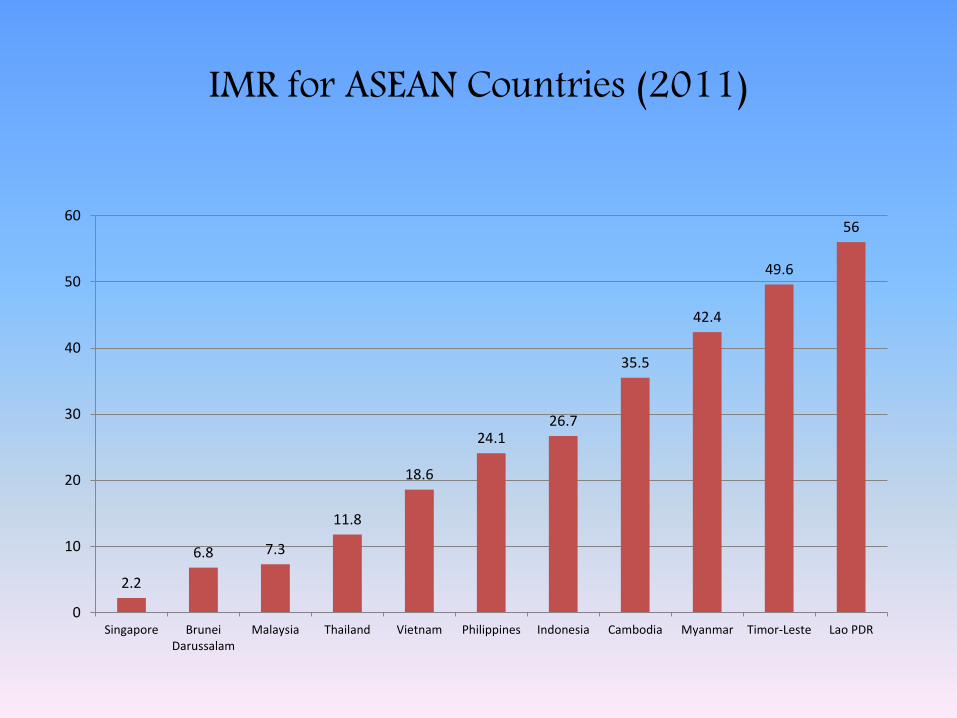
IMR for ASEAN Countries (2011)
2.2
6.8 7.3
11.8
18.6
24.126.7
35.5
42.4
49.6
56
0
10
20
30
40
50
60
Singapore BruneiDarussalam
Malaysia Thailand Vietnam Philippines Indonesia Cambodia Myanmar Timor-Leste Lao PDR

RESULT AND ANALYSIS
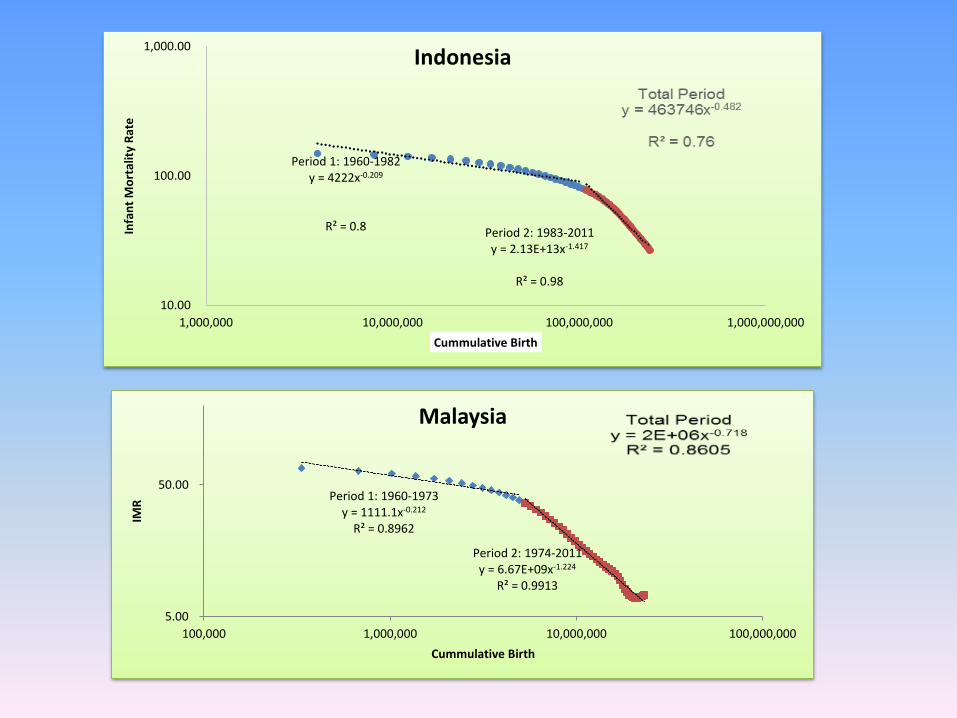
Period 1: 1960-1973y = 1111.1x-0.212
R² = 0.8962
Period 2: 1974-2011y = 6.67E+09x-1.224
R² = 0.9913
5.00
50.00
100,000 1,000,000 10,000,000 100,000,000
IMR
Cummulative Birth
Malaysia
Period 1: 1960-1982y = 4222x-0.209
R² = 0.8 Period 2: 1983-2011y = 2.13E+13x-1.417
R² = 0.98
10.00
100.00
1,000.00
1,000,000 10,000,000 100,000,000 1,000,000,000
Infa
nt
Mo
rtal
ity
Rat
e
Cummulative Birth
Indonesia
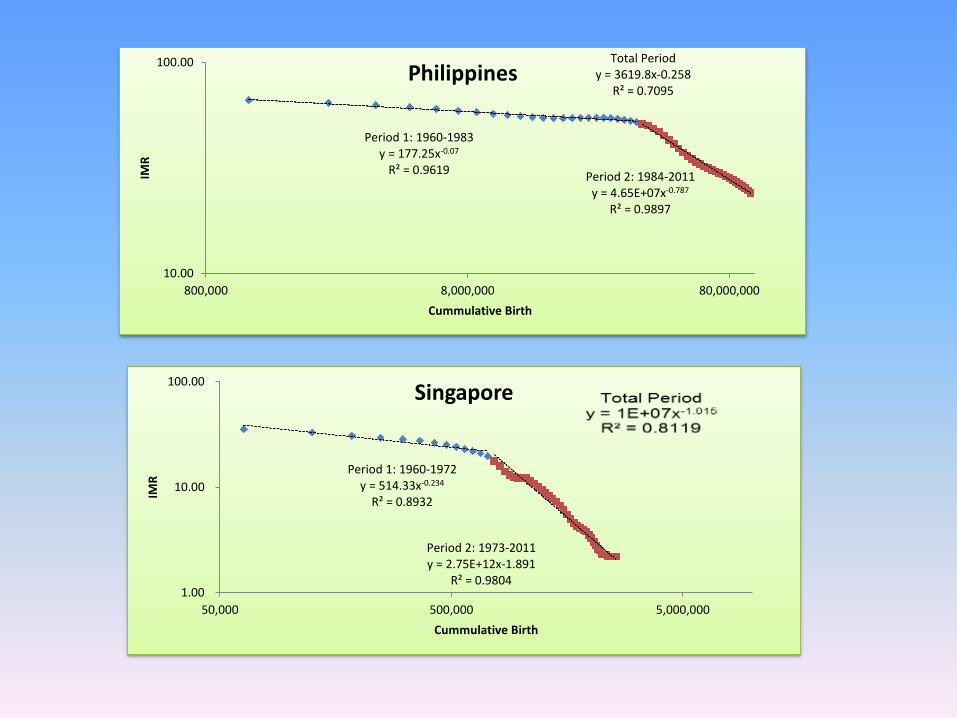
Total Periody = 3619.8x-0.258
R² = 0.7095
Period 1: 1960-1983y = 177.25x-0.07
R² = 0.9619Period 2: 1984-2011y = 4.65E+07x-0.787
R² = 0.9897
10.00
100.00
800,000 8,000,000 80,000,000
IMR
Cummulative Birth
Philippines
Period 1: 1960-1972y = 514.33x-0.234
R² = 0.8932
Period 2: 1973-2011y = 2.75E+12x-1.891
R² = 0.9804 1.00
10.00
100.00
50,000 500,000 5,000,000
IMR
Cummulative Birth
Singapore
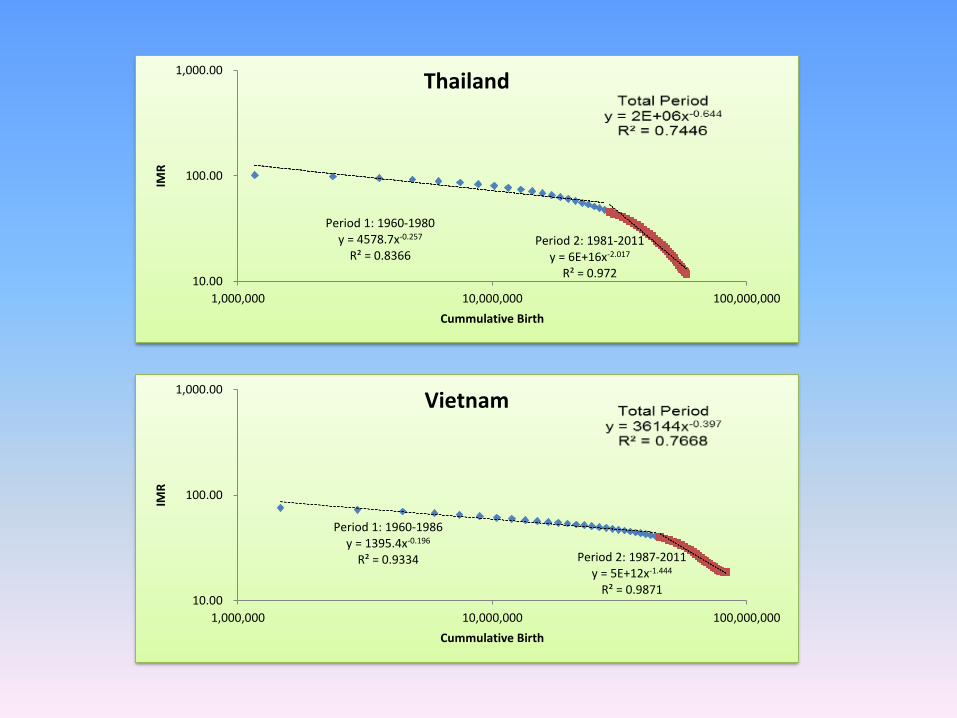
Period 1: 1960-1980y = 4578.7x-0.257
R² = 0.8366Period 2: 1981-2011
y = 6E+16x-2.017
R² = 0.972 10.00
100.00
1,000.00
1,000,000 10,000,000 100,000,000
IMR
Cummulative Birth
Thailand
Period 1: 1960-1986y = 1395.4x-0.196
R² = 0.9334 Period 2: 1987-2011y = 5E+12x-1.444
R² = 0.9871 10.00
100.00
1,000.00
1,000,000 10,000,000 100,000,000
IMR
Cummulative Birth
Vietnam
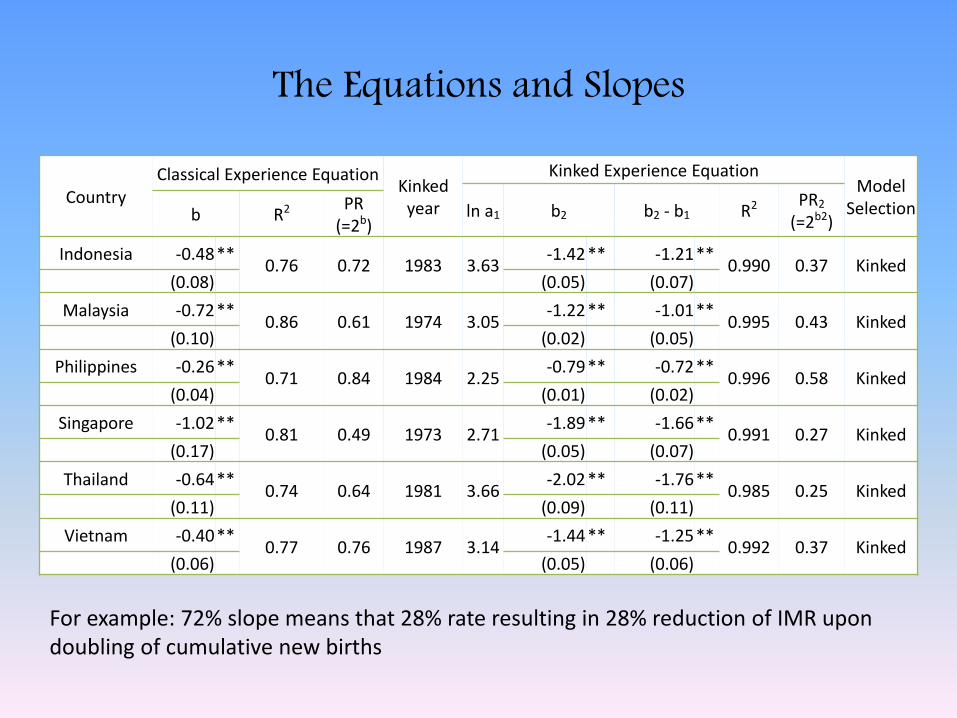
The Equations and Slopes
CountryClassical Experience Equation
Kinked year
Kinked Experience EquationModel
Selectionln a1 b2 b2 - b1 R2 PR2
(=2b2)b R2 PR (=2b)
Indonesia -0.48**0.76 0.72 1983 3.63
-1.42** -1.21**0.990 0.37 Kinked
(0.08) (0.05) (0.07)
Malaysia -0.72**0.86 0.61 1974 3.05
-1.22** -1.01**0.995 0.43 Kinked
(0.10) (0.02) (0.05)
Philippines -0.26**0.71 0.84 1984 2.25
-0.79** -0.72**0.996 0.58 Kinked
(0.04) (0.01) (0.02)
Singapore -1.02**0.81 0.49 1973 2.71
-1.89** -1.66**0.991 0.27 Kinked
(0.17) (0.05) (0.07)
Thailand -0.64**0.74 0.64 1981 3.66
-2.02** -1.76**0.985 0.25 Kinked
(0.11) (0.09) (0.11)
Vietnam -0.40**0.77 0.76 1987 3.14
-1.44** -1.25**0.992 0.37 Kinked
(0.06) (0.05) (0.06)
For example: 72% slope means that 28% rate resulting in 28% reduction of IMR upon doubling of cumulative new births
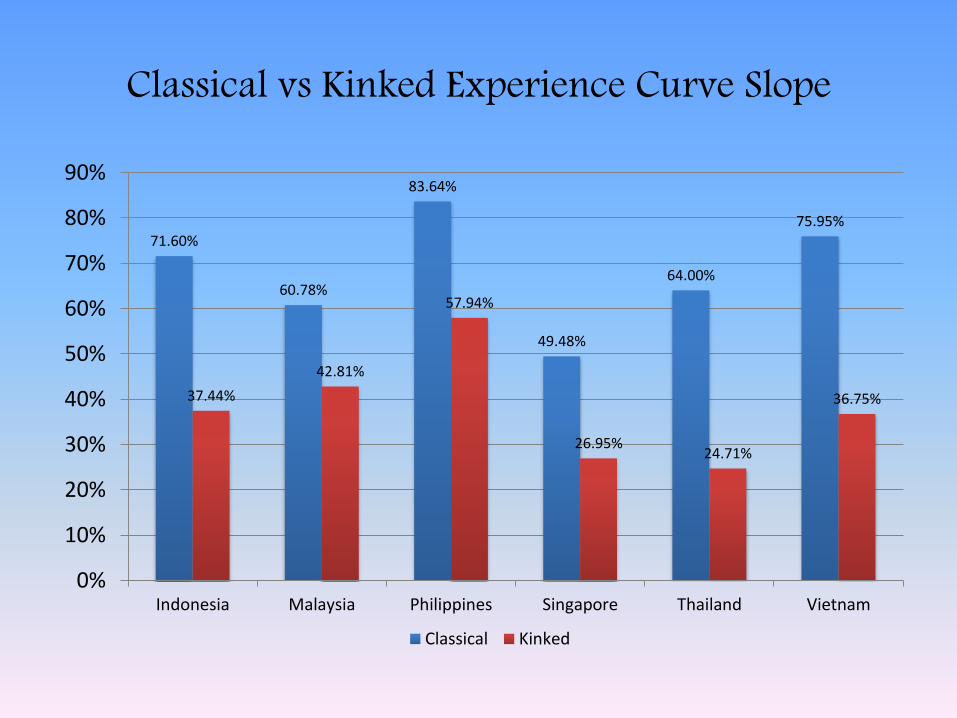
Classical vs Kinked Experience Curve Slope
71.60%
60.78%
83.64%
49.48%
64.00%
75.95%
37.44%
42.81%
57.94%
26.95%24.71%
36.75%
0%
10%
20%
30%
40%
50%
60%
70%
80%
90%
Indonesia Malaysia Philippines Singapore Thailand Vietnam
Classical Kinked
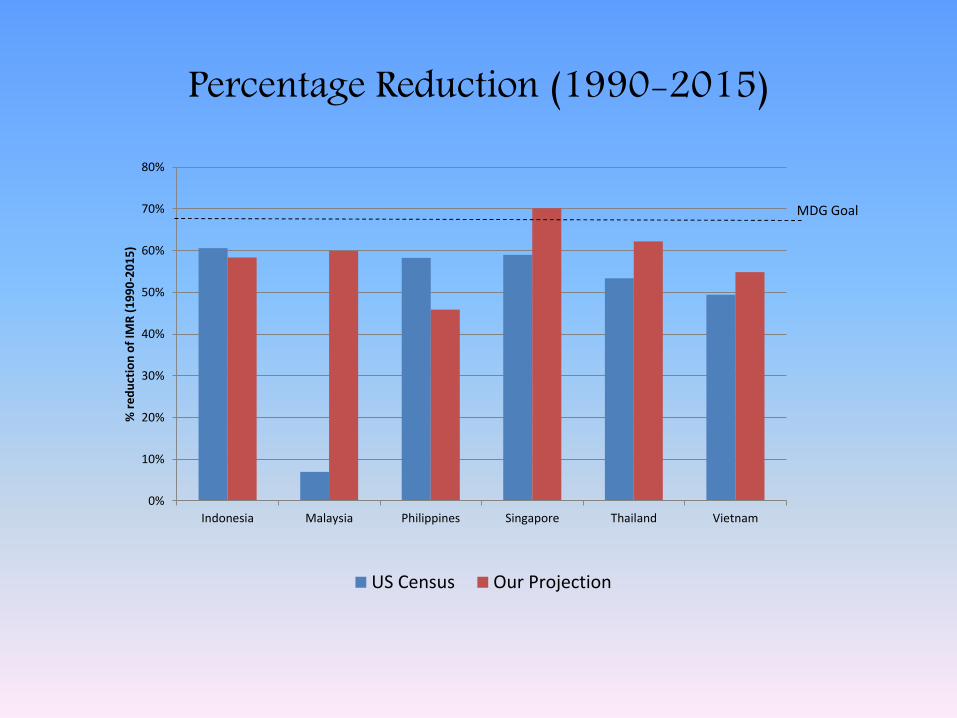
Percentage Reduction (1990-2015)
0%
10%
20%
30%
40%
50%
60%
70%
80%
Indonesia Malaysia Philippines Singapore Thailand Vietnam
% r
ed
uct
ion
of
IMR
(1
99
0-2
01
5)
US Census Our Projection
MDG Goal
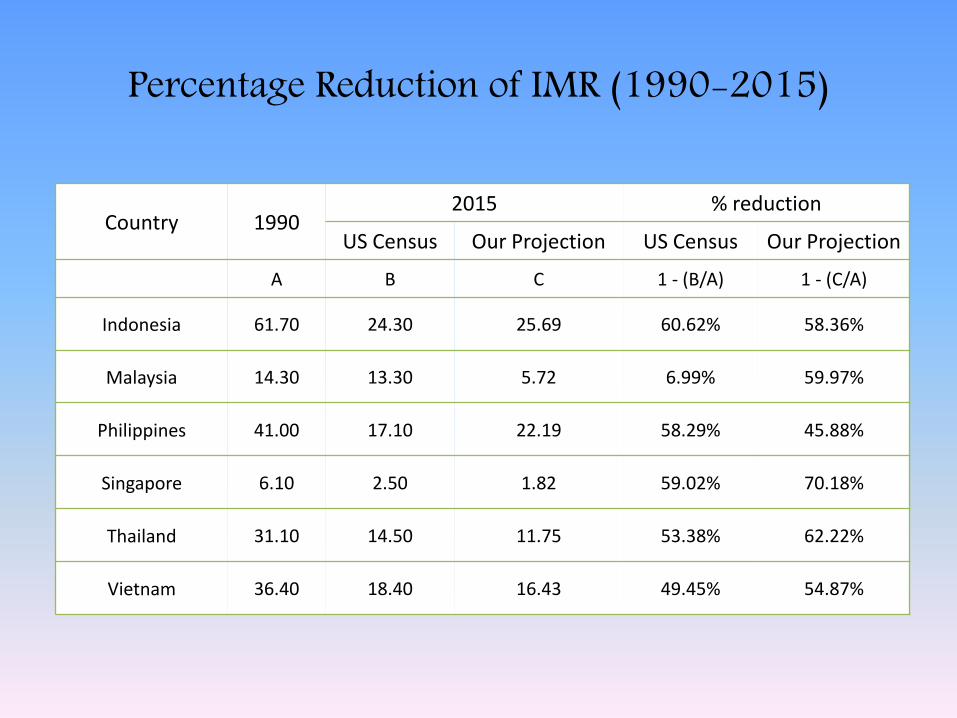
Percentage Reduction of IMR (1990-2015)
Country 19902015 % reduction
US Census Our Projection US Census Our Projection
A B C 1 - (B/A) 1 - (C/A)
Indonesia 61.70 24.30 25.69 60.62% 58.36%
Malaysia 14.30 13.30 5.72 6.99% 59.97%
Philippines 41.00 17.10 22.19 58.29% 45.88%
Singapore 6.10 2.50 1.82 59.02% 70.18%
Thailand 31.10 14.50 11.75 53.38% 62.22%
Vietnam 36.40 18.40 16.43 49.45% 54.87%
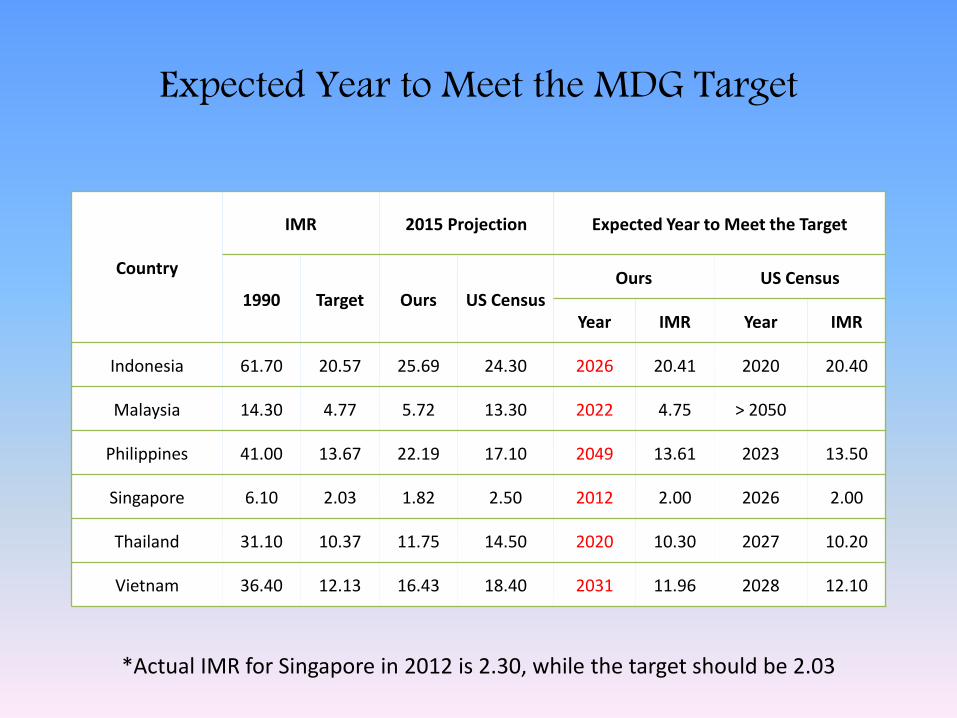
Expected Year to Meet the MDG Target
Country
IMR 2015 Projection Expected Year to Meet the Target
1990 Target Ours US CensusOurs US Census
Year IMR Year IMR
Indonesia 61.70 20.57 25.69 24.30 2026 20.41 2020 20.40
Malaysia 14.30 4.77 5.72 13.30 2022 4.75 > 2050
Philippines 41.00 13.67 22.19 17.10 2049 13.61 2023 13.50
Singapore 6.10 2.03 1.82 2.50 2012 2.00 2026 2.00
Thailand 31.10 10.37 11.75 14.50 2020 10.30 2027 10.20
Vietnam 36.40 12.13 16.43 18.40 2031 11.96 2028 12.10
*Actual IMR for Singapore in 2012 is 2.30, while the target should be 2.03
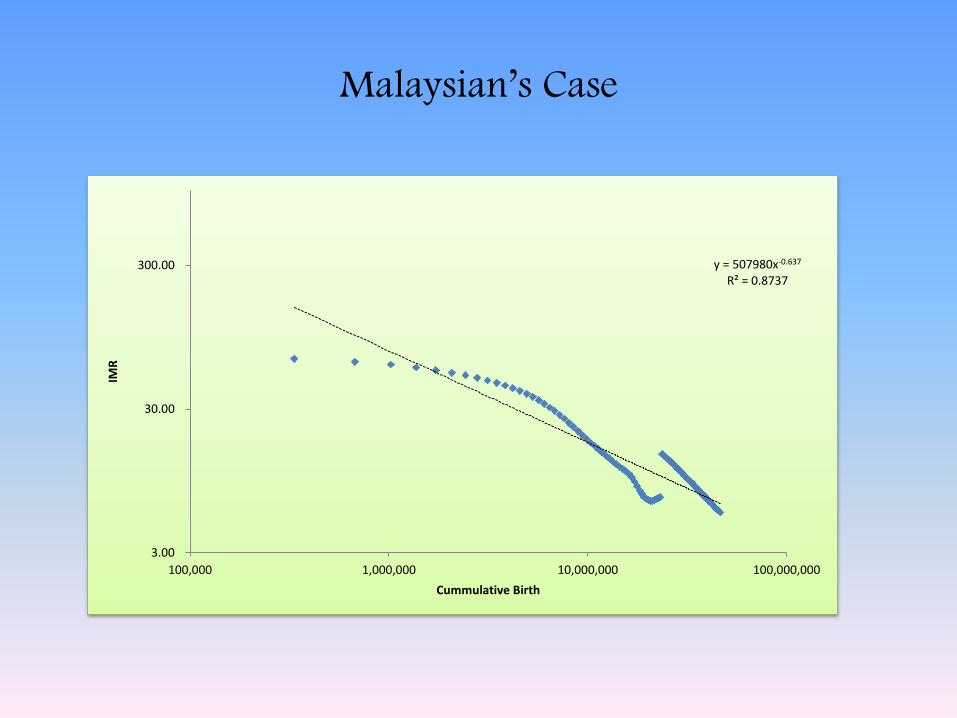
Malaysian’s Case
y = 507980x-0.637
R² = 0.8737
3.00
30.00
300.00
100,000 1,000,000 10,000,000 100,000,000
IMR
Cummulative Birth
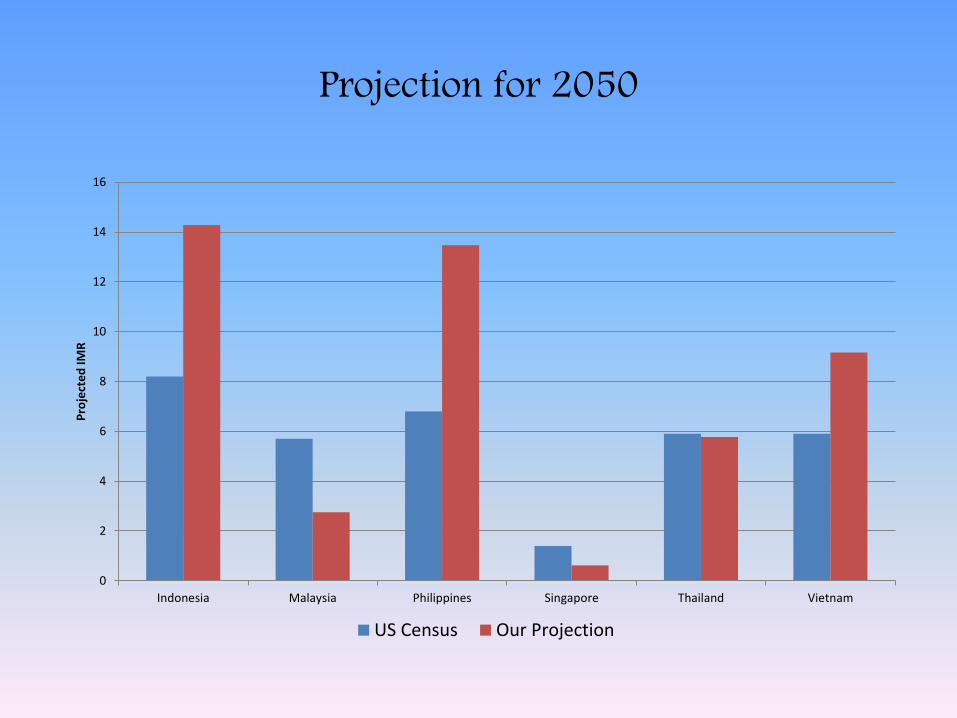
Projection for 2050
0
2
4
6
8
10
12
14
16
Indonesia Malaysia Philippines Singapore Thailand Vietnam
Pro
ject
ed
IMR
US Census Our Projection
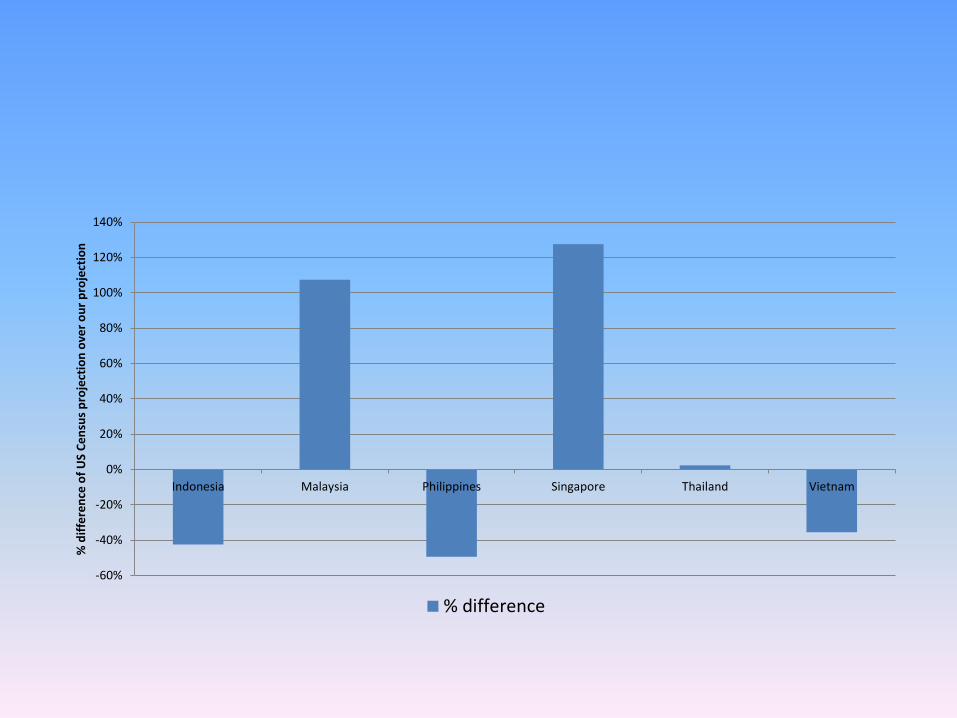
-60%
-40%
-20%
0%
20%
40%
60%
80%
100%
120%
140%
Indonesia Malaysia Philippines Singapore Thailand Vietnam
% d
iffe
ren
ce o
f U
S C
en
sus
pro
ject
ion
ove
r o
ur
pro
ject
ion
% difference

Conclusions
1. The kinked experience curve model is a more suitable methodology than the classical for the projection of IMR in ASEAN countries All countries are showing the declining trend in a specific of time The progress ratio are showing the steep slope (range from 25% to 58%)
2. From 6 ASEAN countries, only one is expected to meet the MDG target by 2015, and by 2050 all of them will reach the target.
3. We have mix conclusion about the relative differences of our projection and US Census’s projection