Embed Size (px)
Citation preview


FORTHCOMING ISSUES
May 2004
Aggressive Surgery for Lung CancerValerie W. Rusch, MD, Guest Editor
August 2004
Postoperative Quality of LifeAnthony Yim, MD, Guest Editor
October 2004
MesotheliomaDavid J. Sugarbaker, MD, andMichael Chang, MD, Guest Editors
February 2005
Thoracic Anesthesia and Pain ManagementJerome M. Klafta, MD, Guest Editor
RECENT ISSUES
November 2003
Surgery for EmphysemaKeith S. Naunheim, MD, Guest Editor
August 2003
Lung TransplantationG. Alexander Patterson, MD, Guest Editor
May 2003
Tracheal SurgeryDouglas J. Mathisen, MD, Guest Editor
February 2003
Uncommon Tumors of the Tracheobronchial Tree:Diagnosis and ManagementMelvyn Goldberg, MD, andArthur S. Patchefsky, MD, Guest Editors
THE CLINICS ARE NOW AVAILABLE ONLINE!
Access your subscription at:http://www.TheClinics.com

CONTENTS
Foreword xiMark K. Ferguson and Catherine A. Bewick
Preface xiiiNasser K. Altorki and David F. Yankelevitz
Current State of Imaging for Lung Cancer Staging 1Michael S. Kent, Jeffrey L. Port, and Nasser K. Altorki
Lung cancer remains the leading cause of cancer death among men and women in theUnited States. The primary issue in the care of patients who have non–small-cell lungcancer is a determination of the stage of their disease. Several imaging techniques areavailable to help inform the determination of a patient’s stage, including CT, positronemission tomography, bone scintigraphy, and MRI. This article reviews these imagingtechniques and their indications for use based on current guidelines of clinical practice.
Imaging of Pleural and Chest Wall Tumors 15Michael J. Weyant and Raja M. Flores
Pleural and chest wall tumors encompass the relative minority of thoracic tumors.Advances in radiographic imaging modalities have allowed more accurate evaluation ofstaging and resectability of these tumors. CT and MRI appear to be relatively equal indetermining resectability and extent of invasion. Newer imaging modalities such as 18-flouro-deoxyglucose (FDG-PET) scanning appear to be most helpful in excluding thepresence of extrathoracic metastasis before surgical resection.
Imaging of the Mediastinum: Applications for Thoracic Surgery 25Dorith Shaham, Maria G. Skilakaki, and Orly Goitein
A wide variety of imaging modalities are available for evaluating the mediastinum, includ-ing plain radiography, CT, MRI, ultrasonography, and radionuclide imaging. CT is theimaging modality of choice for evaluating a suspected mediastinal mass or a widenedmediastinum; it provides the most useful information for diagnosis, planning of treatment,and evaluation of postoperative complications.
IMAGING MODALITIES IN GENERAL THORACIC SURGERY
VOLUME 14 • NUMBER 1 • FEBRUARY 2004 vii

State-of-the-Art Screening for Lung Cancer (Part 1): The Chest Radiograph 43Matthew Freedman
The chest radiographic methods used in prior studies of lung cancer screening and incurrent prospective clinical trials of lung cancer screening do not incorporate, as part oftheir prospective design, the newer methods available for the detection of lung nodules.Digital radiography, image processing, energy subtraction, and computer-aided detec-tion have been shown to enhance lung nodule detection. Temporal subtraction is a prom-ising method but with less supporting data currently available. These techniques, aloneor in combination, do not equal the nodule detection capability of lung CT, but they are likely to benefit patients having chest radiographs for other clinically indicated pur-poses and when the detection of a nodule is incidental to the clinical indication for theradiographic study.
State-of-the-Art Screening for Lung Cancer (Part 2): CT Scanning 53David Yankelevitz and Claudia I. Henschke
There have been dramatic improvements in technology in the past decade. In conjunctionthere have also been advances in our clinical knowledge that have led to changes in thescreening regimen. These changes are expected to continue in the future as CT scannerscontinue to improve and knowledge about screening accumulates, and computer-assistedtechniques are expected to play an ever more important role. This dynamic process willlead to continued improvements in the diagnostic distribution of lung cancers detectedunder CT screening.
Imaging for Esophageal Tumors 61Robert J. Korst and Nasser K. Altorki
The treatment of malignant tumors of the esophagus is stage-dependent, making accu-rate tumor staging of paramount importance. In this regard, imaging modalities play anintegral role in the staging of these lesions and are used to help determine the extent oflocoregional and distant disease. The accuracy of imaging for esophageal neoplasms isfar from perfect, however, with most suspicious lesions requiring biopsy for definitivestaging. The role of imaging techniques in the evaluation of esophageal tumors continuesto evolve and has recently begun to include assessment of the response to therapy.
Fluorescent Bronchoscopy 71Sebastien Gilbert, James D. Luketich, and Neil A. Christie
Detection of clinically occult lung neoplasms may represent an opportunity for early cur-ative intervention. Fluorescent bronchoscopy is a sensitive technique for detecting earlyendobronchial tumors that may be combined with CT scanning as part of a comprehen-sive lung cancer screening program. Identification and longitudinal follow-up of dys-plastic endobronchial changes with fluorescent bronchoscopy should facilitate studies ofchemoprevention and further knowledge regarding the natural history of these lesions.Analysis of bronchial epithelium with novel techniques such as genomic hybridizationand gene expression arrays might provide even better predictors of progression of dys-plastic endobronchial lesions.
Virtual Bronchoscopy for Evaluation of Airway Disease 79Steven E. Finkelstein, Ronald M. Summers, Dao M. Nguyen, and David S. Schrump
Virtual bronchoscopy (VB) is a novel modality for imaging airway anatomy that appearsto be highly useful for evaluation of airway anatomy due to endoluminal turmors or
viii CONTENTS

extrinsic compression. This modality is presently not reliable for evaluation of themucosal surface of the respiratory tract. Although form can be detected, mucosal color,irregularity, or friability cannot be assessed. As such, VB cannot be used for routine sur-veillance of patients at high risk of developing airway malignancies. The developmentof novel aerosolized contrast agents or spectroscopic techniques that can discriminatebenign versus malignant mucosal tissues might enhance the sensitivity and specificity ofVB for the detection of preinvasive cancers within the respiratory tract.
Chromoendoscopy and Magnification Endoscopy for Diagnosing 87Esophageal Cancer and DysplasiaMichael J. Connor and Prateek Sharma
Two primary subtypes of esophageal carcinoma are commonly seen in the esophagus:squamous cell carcinoma and adenocarcinoma. Currently, the diagnosis of metaplasticand dysplastic mucosa within the esophagus requires endoscopy with biopsy of abnormal-appearing tissue. Current practices of performing standard endoscopy with randombiopsies are inaccurate. Magnification and chromoendoscopy are among several toolsused in the esophagus to improve detection of squamous cell dysplasia/cancer, Barrett’sesophagus, and associated dysplasia. Current studies show that these techniques arepromising, although the results are still preliminary. These techniques will hopefullyimprove detection rates, decrease the number of biopsies required, and ultimately pro-vide a real-time diagnosis.
Radionuclide Imaging of Thoracic Malignancies 95Stanley J. Goldsmith, Lale A. Kostakoglu, Serge Somrov, and Christopher J. Palestro
Over the past decade a variety nuclear medicine imaging studies have become availablethat are of considerable value to patients who have pulmonary malignancies. By far thegreatest impact on the management of patients who have thoracic malignancy has beenthe availability of 18-flouro-deoxyglucose (18FDG-PET) imaging. In the patient who hasnewly diagnosed lung carcinoma, 18FDG-PET improves the accuracy of staging the disease by identifying or excluding mediastinal disease and distant metastatic foci.18FDG-PET is superior to anatomic methods for evaluating the response to therapy andfor distinguishing recurrent disease from posttreatment changes. Studies are in progressto evaluate the role of 18FDG-PET imaging in assessing prognosis.
Imaging of Acute Pulmonary Emboli 113Arfa Khan, Aaron Darius Cann, and Rakesh D. Shah
Pulmonary embolism (PE) is a significant cause of morbidity and mortality after surgi-cal procedures. Early diagnosis and prompt, effective management of this conditionpresent considerable clinical challenges to surgeons. Imaging studies form the mainstayof diagnosis of PE and include plain radiography, ventilation–perfusion scan, venogra-phy, echocardiography, catheter pulmonary angiogram, CT pulmonary angiogram, andMR pulmonary angiogram. Each imaging modality has a role in the diagnosis of PE.
Computer-Aided Diagnostics 125Anthony P. Reeves and Bryan M. Kressler
This article reviews the role of the computer in assisting physicians in interpreting CTimages of the lungs. Four primary computer functions are considered: visualization,detection, characterization and diagnosis, and whole-lung documentation and health
CONTENTS ix

evaluation. Computer-aided methods are emerging to aid the radiologist in the tasks ofdisease detection and diagnosis. Such methods might also be suitable to aid the surgeonin preoperative planning, the surgical operation, and postsurgical evaluation.
Future Generation CT Imaging 135Deborah Walter, Bruno De Man, Maria Iatrou, and Peter M. Edic
The article outlines some of the recent technological advances that will drive future CTevolution and describes the recently enabled applications and trends in thoracic imaging.Future technological developments in CT imaging will result in improvements in spatialresolution, coverage, temporal resolution, and dose reduction. The key to realizing thispotential is to combine improved imaging capability with advanced computer-assistedtools, which will expand the usefulness of CT imaging in many areas. This article dis-cusses examples of state-of-the-art and emerging clinical application using CT in theareas of lung cancer, chronic obstructive pulmonary disease, pulmonary embolism, andinterventional procedures.
Index 151
x CONTENTS
Thorac Surg Clin 14 (2004) xi
Foreword
As most readers know, the Clinics of North Amer- and the overall size of the issue has been increased
ica series has a long and illustrious history. The
Clinics were introduced in February 1912 with the
publication of the first issue of The Surgical Clinics of
North America, then known as the Surgical Clinics of
John B. Murphy, MD, at Mercy Hospital, Chicago.
The scope of the Clinics now includes 57 separate
series, with various subspecialty surgery titles. Many
of the Clinics have a Consulting Editor who is an in-
ternationally recognized expert in the subspecialty.
They are responsible for choosing topics and identi-
fying Guest Editors for each issue. The Guest Editors
identify appropriate content for each issue and select
authors to write the individual manuscripts. This for-
mat has now achieved a venerable place in the medical
and surgical literature, and the Clinics are regarded as
an authoritative source for clinical information written
and edited by leaders in the field.
The Chest Surgery Clinics of North America
series is undergoing some important changes. During
the past year, this series introduced a new Consulting
Editor. To the founding Consulting Editor for this se-
ries, Dr. L. Penfield Faber, we express gratitude on be-
half of thousands of readers who have benefited from
the extraordinary work he did for over 12 years. That
this series is among the most popular of its kind is
due entirely to his foresight and editorial skills. Main-
taining this legacy will be a tremendous challenge,
one that we relish.
Also, to better serve the readership, beginning
in 2004, the Chest Surgery Clinics of North America
has enhanced its cover art, enlarged its format, and
adopted a different title. The updated cover design
will now include artwork relevant to the issue’s topic,
1547-4127/04/$ – see front matter D 2004 Elsevier Inc. All right
doi:10.1016/S1547-4127(04)00044-1
to accommodate tables and illustrations more effec-
tively. Finally, the title has been changed to the
Thoracic Surgery Clinics to better reflect the contents
and the international character of the readership and
the authors.
Finally, we are pleased to announce that the
Clinics are now available online at www.TheClinics.
com. Subscribers to the printed version of the Clinics
will receive access to the online version at no ad-
ditional cost. We encourage all readers to visit
TheClinics.com to explore the features of the
Web site, including full text of all issues from 2002
to the present, comprehensive search capabilities, and
links to MEDLINE and other Elsevier journals.
It is our hope that these changes will enhance the
experience of the readership by providing the same
outstanding content they are accustomed to but in a
more accessible format. We welcome your comments
regarding these changes.
Mark K. Ferguson, MD
Department of Surgery
University of Chicago Medical Center
5841 S. Maryland Ave.
Chicago, IL 60637, USA
E-mail address: [email protected]
Catherine A. Bewick
Publisher, Elsevier
Elsevier Inc., The Curtis Center
Independence Square West, Suite 300
Philadelphia, PA 19106, USA
E-mail address: [email protected]
s reserved.

Thorac Surg Clin 14 (2004) xiii –xiv
Preface
Imaging modalities in general thoracic surgery
Nasser K. Altorki, MD David F. Yankelevitz, MD
Guest Editors
This issue of the Thoracic Surgery Clinics is onstrate where we can expect the intersection of these
dedicated to thoracic imaging with emphasis on the
recent advances and their relevance to the general
thoracic surgeon. Foremost among these advances are
the dramatic improvements in cross-sectional imag-
ing, particularly as they apply to CT scanning. Multi-
slice scanners have now largely replaced the single
slice scanners of the early 1990s, allowing for faster
image acquisition and higher spatial resolution. Im-
age acquisition using 10-mm slice thickness has now
given way to 0.675-mm slice thickness, a 15-fold
increase in spatial resolution. These changes have al-
lowed the detection of even smaller nodules and lung
cancers. Alongside improved spatial resolution, com-
puter-aided approaches are slowly entering the realm
of clinical practice. Faster computers with larger
image storage capacity have allowed manipulation
of high-resolution data and three-dimensional display.
Computer-aided diagnostic techniques enhance nod-
ule detection, analysis, and growth rates as well as
detection of pulmonary emboli.
In this issue, we admittedly pay special attention
to CT and its pivotal role in thoracic imaging. This
relates to issues such as lung cancer screening and
staging and the diagnosis of pulmonary emboli. We
also have included articles on the future of CT
scanners and image processing techniques that dem-
1547-4127/04/$ – see front matter D 2004 Elsevier Inc. All right
doi:10.1016/S1547-4127(04)00043-X
technologies to lead.
Although CT imaging plays an important role, it is
by no means an exclusive one, and many other
technologies have advanced and become quite useful.
MRI, which is most useful in tissue characterization,
is discussed with emphasis on its role in the staging of
tumors both in the lung and the mediastinum. Cur-
rently, MRI plays mainly a complementary role to CT;
however, rapid advances in this technology are occur-
ring as well, and its role in imaging of pulmonary
emboli may soon surpass CT.
In selecting contributions to this issue, we chose to
include articles that give state-of-the-art reviews on
the clinical role of various imaging procedures in
common thoracic surgical problems. We have also
included articles on specific imaging techniques that
have emerged and are now becoming readily availa-
ble; this includes various endoscopic techniques such
as virtual bronchoscopy and laser-induced fluores-
cence endoscopy (LIFE) bronchoscopy for the air-
ways, as well as chromo and magnification endoscopy
for the esophagus. These powerful new imaging
techniques have already found their way into clinical
practice, and these articles discuss their respective
advantages and limitations. We also included an
article on radiolabeled imaging for thoracic tumors.
s reserved.
N.K. Altorki, D.F. Yankelevitz / Thorac Surg Clin 14 (2004) xiii–xivxiv
Although positron emission tomography using fluo-
rodeoxyglucose (FDG) is the primary agent currently
used, this entire field is changing rapidly. New tar-
geted diagnostic and therapeutic agents are being
developed. This field will be best positioned to
leverage the advances in molecular biology and in-
corporate this into sophisticated imaging strategies.
The changes that have occurred in the past 10 years
have indeed been dramatic. Diseases are being diag-
nosed earlier, allowing for development of new thera-
peutic strategies. In addition, the thoracic surgeon can
now plan for more complex procedures. Combining
the advances in imaging technology with advances in
therapeutics will undoubtedly have a major impact on
the practice of thoracic surgery.
Nasser K. Altorki, MD
Department of Cardiothoracic Surgery
Weill Medical College
Cornell University
525 East 68th Street, Suite M404
New York, NY 10021, USA
E-mail address: [email protected]
David F. Yankelevitz, MD
Department of Radiology, Chest Division
Weill Medical College
Cornell University
525 East 68th Street
New York, NY 10021, USA
E-mail address: [email protected]

Thorac Surg Clin 14 (2004) 1–13
Current state of imaging for lung cancer staging
Michael S. Kent, MDa, Jeffrey L. Port, MDb, Nasser K. Altorki, MDb,*
aDepartment of Surgery, Weill Medical College, Cornell University, 525 East 68th Street, Suite K707, New York, NY 10021, USAbDepartment of Cardiothoracic Surgery, Weill Medical College, Cornell University, 525 East 68th Street, Suite M404,
New York, NY 10021, USA
Lung cancer remains the leading cause of cancer phy (BS), and MRI. Each of these studies carries a
death among men and women in the United States.
In 2002 169,400 patients were diagnosed with lung
cancer and 155,000 deaths resulted from the disease
[1]. In part, this poor survival reflects the fact that
the majority of patients who have lung cancer pre-
sent with locally advanced or metastatic disease.
Forty-nine percent of patients who were diagnosed
lung cancer in 2002 were found to have distant me-
tastases at the time of presentation, and 26% of pa-
tients had mediastinal lymph node involvement [1].
Therefore, less than 25% of patients are candidates
for surgery as the sole method of treatment.
From the perspective of the thoracic surgeon, the
primary issue in the care of patients who have non–
small-cell lung cancer is a determination of the stage
of their disease. Stage determines the treatment pa-
tients will receive and their prognosis. Inaccurate
staging might deny patients access to potentially
curative treatment and expose them to unnecessary
therapy. In effect, accurate staging is as critical to
the care of patients who have lung cancer as their
ultimate treatment.
The critical issue in staging is to identify patients
who have extrathoracic disease, who are not candi-
dates for surgery, and to identify patients who have
N2 disease, whose survival might be improved by
induction chemotherapy followed by surgery. Sev-
eral imaging techniques are available to help inform
the determination of a patient’s stage, including CT,
positron emission tomography (PET), bone scintigra-
1547-4127/04/$ – see front matter D 2004 Elsevier Inc. All right
doi:10.1016/S1547-4127(04)00031-3
* Corresponding author.
E-mail address: [email protected]
(N.K. Altorki).
financial cost and measurable false-positive and false-
negative rates. The injudicious use of imaging leads
to excessive costs and unnecessary invasive proce-
dures. Worse, a false-positive study might deny a pa-
tient potentially curative surgery. This article reviews
these imaging techniques and their indications for
use based on current guidelines of clinical practice.
Staging the primary tumor
When a pulmonary nodule is found to be malig-
nant, the initial step in defining the clinical stage
of the tumor is to determine the tumor (T) stage.
Outside the context of clinical trials, the distinction
between T1 and T2 disease does not usually impact
on the recommendation for treatment; however, the
distinction between invasion of the chest wall or other
resectable structures (T3) versus mediastinal struc-
tures such as the trachea or heart (T4) has significant
surgical implications.
CT
Tumors that invade the chest wall are considered
to be T3 disease. The finding of chest wall invasion
at the time of surgery does not preclude curative
resection; however, the preoperative diagnosis of
chest wall invasion does allow the surgeon and pa-
tient to anticipate en-bloc resection of the chest wall
with the primary tumor and the need for subsequent
reconstruction. Several findings on CT such as ex-
tensive contact with the parietal pleura, extrapleural
soft tissue, and obliteration of the extrapleural fat
plane suggest chest wall invasion but are relatively
s reserved.

M.S. Kent et al / Thorac Surg Clin 14 (2004) 1–132
nonspecific [2,3] (Fig. 1). The only findings on CT
that have been found to be highly predictive of chest
wall invasion are destruction of adjacent ribs and
clear extension of tumor beyond the chest wall [4],
and even these signs have a sensitivity of only 20%
[5]. The most accurate predictor of T3 disease is dy-
namic CT, which can document fixation of the tumor
to the chest wall through the respiratory cycle [6]. This
specialized study is not widely available, however.
The distinction between resectable tumors, which
invade the mediastinal pleura (T3), and unresectable
tumors, which invade structures such as the heart
or trachea (T4), is difficult to make on the basis of
CT imaging alone. Frequently, tumors abut the me-
diastinum and obliterate the normal fat plane on CT
but are deemed to be resectable at the time of tho-
racotomy (Fig. 2). For example, in a retrospective
study of 180 patients who had lung cancer staged by
conventional CT, only 62% of patients staged T4 by
Fig. 1. False-positive CT scan suggesting chest wall inv
CT were found to have T4 disease at the time of sur-
gery [7]. Findings on CT that increase the likelihood
of unresectability include involvement of the carina
or encasement of more than half the circumference
of the aorta, esophagus, or proximal left and right
pulmonary arteries [8]; however, even when these
signs are strictly applied, the predictive value of CT
in determining T4 disease is quite low [9,10]. Tumors
that have equivocal signs of invasion—even with
obliteration of the normal mediastinal fat planes—
should not be considered to be unresectable on the
basis of CT imaging alone [11].
MRI
MRI has found limited applicability in the imag-
ing of lung cancer, although it might be more useful
than CT scanning in specific circumstances. In 1991
the Radiologic Diagnostic Oncology Group (RDOG)
asion. (A) Lung window, (B) mediastinal window.
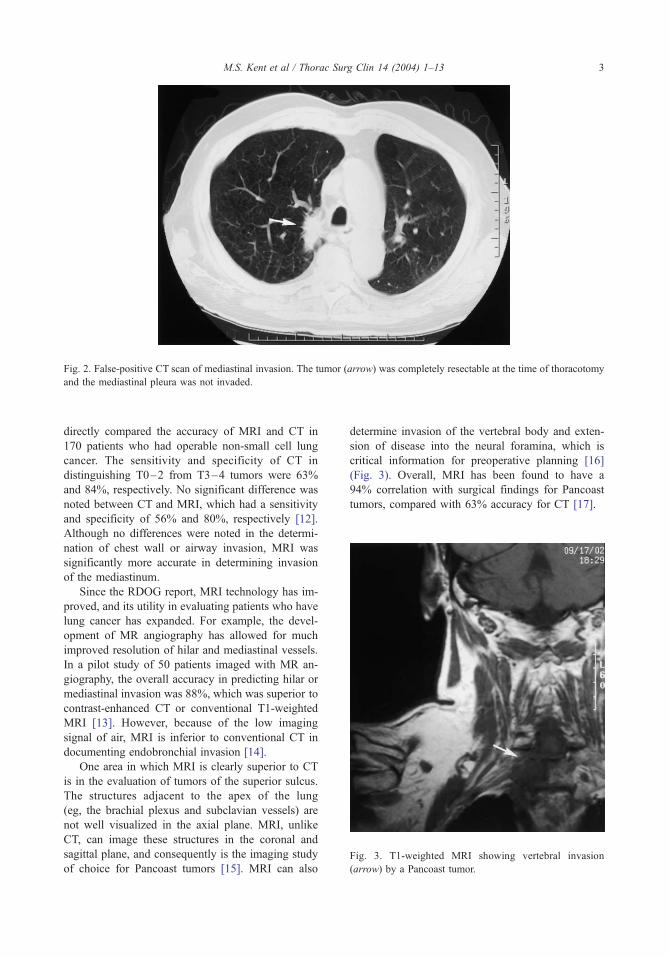
Fig. 2. False-positive CT scan of mediastinal invasion. The tumor (arrow) was completely resectable at the time of thoracotomy
and the mediastinal pleura was not invaded.
Fig. 3. T1-weighted MRI showing vertebral invasion
(arrow) by a Pancoast tumor.
M.S. Kent et al / Thorac Surg Clin 14 (2004) 1–13 3
directly compared the accuracy of MRI and CT in
170 patients who had operable non-small cell lung
cancer. The sensitivity and specificity of CT in
distinguishing T0–2 from T3–4 tumors were 63%
and 84%, respectively. No significant difference was
noted between CT and MRI, which had a sensitivity
and specificity of 56% and 80%, respectively [12].
Although no differences were noted in the determi-
nation of chest wall or airway invasion, MRI was
significantly more accurate in determining invasion
of the mediastinum.
Since the RDOG report, MRI technology has im-
proved, and its utility in evaluating patients who have
lung cancer has expanded. For example, the devel-
opment of MR angiography has allowed for much
improved resolution of hilar and mediastinal vessels.
In a pilot study of 50 patients imaged with MR an-
giography, the overall accuracy in predicting hilar or
mediastinal invasion was 88%, which was superior to
contrast-enhanced CT or conventional T1-weighted
MRI [13]. However, because of the low imaging
signal of air, MRI is inferior to conventional CT in
documenting endobronchial invasion [14].
One area in which MRI is clearly superior to CT
is in the evaluation of tumors of the superior sulcus.
The structures adjacent to the apex of the lung
(eg, the brachial plexus and subclavian vessels) are
not well visualized in the axial plane. MRI, unlike
CT, can image these structures in the coronal and
sagittal plane, and consequently is the imaging study
of choice for Pancoast tumors [15]. MRI can also
determine invasion of the vertebral body and exten-
sion of disease into the neural foramina, which is
critical information for preoperative planning [16]
(Fig. 3). Overall, MRI has been found to have a
94% correlation with surgical findings for Pancoast
tumors, compared with 63% accuracy for CT [17].

c Surg Clin 14 (2004) 1–13
Thoracoscopy
Although a detailed discussion is outside the
scope of this article, it should be mentioned that
minimally invasive techniques can be used to de-
termine resectability when imaging is equivocal.
Thoracoscopy allows for the cytologic evaluation
of pleural effusions and can determine invasion of
the chest wall and mediastinal structures by direct
visualization [18,19]. Thoracoscopy can also be used
to directly explore the pericardial cavity. In a small
study of 27 patients who had clinical T4 tumors, the
pericardial sac was explored using the same equip-
ment and port sites as for standard thoracoscopy.
This technique identified, with no complications,
six patients who were unresectable on the basis of
invasion of the heart or main pulmonary artery [20].
M.S. Kent et al / Thora4
Staging the mediastinum
The involvement of mediastinal lymph nodes
has a significant impact on the treatment and prog-
nosis of patients who have lung cancer. Mediastino-
scopy remains the gold standard to detect N2 nodal
metastases before thoracotomy. The procedure can be
performed with a complication rate well below 1%
and has a negative predictive value (NPV) of 93%
[21]. Although noninvasive modalities such as PET
have emerged to stage the mediastinum, none of
these techniques has a specificity high enough to ex-
clude patients from resection without confirmation
by tissue biopsy.
CT
The detection of nodal metastases on CT is based
on nodal size. By convention, a mediastinal node
larger than 1 cm in the short axis is considered to
be enlarged [22]; however, this convention suffers
from many limitations. First, the normal size of me-
diastinal lymph nodes varies by nodal station. Hilar
nodes can measure up to 7 mm, and benign sub-
carinal nodes can be as large as 15 mm [23]. In
addition, surrounding mediastinal structures and
volume averaging effects might make precise deter-
mination of nodal size difficult. Consequently, inter-
observer variability in the measurement of nodal size
is relatively high. Most importantly, normal-sized
nodes might harbor micrometastatic disease and en-
larged nodes might be reactive because of infection or
inflammatory processes rather than malignancy. The
accuracy of CT scanning, therefore, is relatively low.
In a meta-analysis of more than 20 studies with
3438 evaluable patients, the pooled sensitivity and
specificity of CT was 57% and 82%, respectively
[24]. There was marked heterogeneity between
studies, however, which was in part attributable to
variability between study populations. For instance,
the incidence of micrometastases to mediastinal
lymph nodes is higher in adenocarcinomas compared
with squamous cell cancers. As a consequence, the
false-negative rate of CT scans is significantly higher
in this group of patients [25]. Furthermore, the
specificity of CT varies with the location where the
study is performed. For example, the false-positive
rate will be higher in areas where sarcoidosis or other
granulomatous diseases are endemic [26].
MRI
MR signal characteristics and relaxation times
are unable to discriminate benign from malignant
nodes; therefore, the only criterion used to determine
nodal involvement in standard MR imaging is that
of size [27]. Consequently, the overall accuracy of
MRI in detecting nodal metastases is no better than
that of CT [9,12]. Other limitations in the imaging of
thoracic lymph nodes are unique to MRI. For exam-
ple, MRI is unable to visualize calcification within a
lymph node, a finding that would suggest a benign
etiology for nodal enlargement on CT. Because of the
poor spatial resolution of MRI, a group of normal-
sized nodes might be interpreted as a single node,
which would falsely raise the suspicion of metastatic
disease [28].
Refinements in MRI might make this modality
more useful for determining nodal stage in the future.
It has been shown in a small pilot study that the
pattern of enhancement of malignant nodes with
gadolinium is significantly different than for benign
nodes [29]. Although larger, confirmatory studies are
needed, this technique might prove to be a relatively
simple way to discriminate patients who have nodal
disease. Another emerging technology is that of MR
lymphography, in which superparamagnetic iron ox-
ide particles are used as the contrast agent. Iron oxide
particles are readily phagocytosed by macrophages in
normal nodal tissue and lower the signal intensity of
the node on T2-weighted sequences. Nodes that
harbor metastatic disease do not accumulate the
contrast agent as readily and therefore have greater
signal intensity on T2 images [30]. Early studies of
MR lymphography have demonstrated high sensi-
tivity and specificity in patients who have urologic
malignancies [31]; however, only small studies on
patients who have bronchogenic carcinoma have
been reported so far [32].

c Surg Clin 14 (2004) 1–13 5
Positron emission tomography
Without question, PET scanning using fluordeoxy
glucose (FDG) has shown the greatest promise in
staging the mediastinum noninvasively (Fig. 4). In
some centers PET scanning has become an almost
routine component of the preoperative evaluation of
patients who have lung cancer. This practice is
justified by several meta-analyses that have demon-
strated the superiority of PET over CT in staging the
mediastinum [20,33,34]. In a representative meta-
analysis [20] that included 1045 patients enrolled in
18 studies, the pooled sensitivity and specificity of
PET scanning were 84% and 89%, respectively. A
M.S. Kent et al / Thora
Fig. 4. Mediastinal spread of a right lower lobe lung cancer. (A) Su
tumor is also visible (arrowhead). (B) An axial FDG-PET scan dem
the subcarinal space.
direct comparison of PET and CT by receiver oper-
ating characteristic analysis demonstrated PET scan-
ning to be significantly more accurate. Perhaps the
most relevant measure of a staging study is the nega-
tive predictive value (NPV) of the test, which defines
the likelihood that a patient who has a negative test
result does not have the disease. The NPV of PET
scanning to stage the mediastinum in this study was
93%, compared with only 83% for CT scanning.
Several studies have documented the high impact
and cost-effectiveness of PET scanning on clinical
decision-making [35,36]. In addition to these retro-
spective series, the utility of PET scanning has been
evaluated in a prospective, randomized trial. The
bcarinal lymphadenopathy (arrow) on chest CT. The primary
onstrating increased glucose uptake in the primary tumor and

M.S. Kent et al / Thorac Surg Clin 14 (2004) 1–136
results of this trial, known as the PET in Lung Cancer
Staging Study (PLUS) were reported in 2002 [37].
In this trial 188 patients who had suspected or proven
non-small cell lung cancer were assigned to a con-
ventional workup (as determined by local practice)
or a conventional workup plus a PET scan. The end-
point of the study was a reduction in the number
of futile thoracotomies, which was defined as thora-
cotomy for benign disease, thoracotomy without
resection, unsuspected N2 or T4 disease, or relapse
within 12 months of surgery. In the conventional
workup group 41% of patients had a futile thora-
cotomy compared with 21% in the PET group, which
represents a relative reduction of 51%, which is
highly significant. One criticism of this study is that
the extent of the conventional workup was not
specified in the protocol. For example, it is not clear
whether or not the percentage of patients in whom the
suspicion of lung cancer was confirmed by a needle
biopsy was similar in both groups. Such a difference
might explain the observation that the number of
thoracotomies for benign disease was three times
higher in the conventional group than the PET scan
group. In centers in which needle biopsy is practiced
routinely, the impact of PET scans would be less than
that reported by the PLUS trialists.
There are other limitations of PET scanning. The
test carries considerable cost and limited availability.
In the United States the cost of a PET scan is ap-
proximately $2000. Furthermore, given a half-life of
110 minutes, the radioisotope must be produced by
an onsite cyclotron or be manufactured within 200 km
Fig. 5. A CT/PET fusion of a le
of the imaging center. Clinicians must also be cau-
tioned that not all PET scan centers use the same
technology. The published literature demonstrating
the superiority of PET to stage the mediastinum is
based on the use of dedicated PET scanners. Com-
peting systems using gamma cameras have been
introduced in an effort to lower the cost of the study.
It is estimated that there are nearly twice as many
camera-based scanners than dedicated PET scanners
currently in use [38]; however, imaging based on
gamma cameras is clearly less sensitive than that of a
dedicated PET system, and the overall accuracy might
not be much higher than standard CT alone [39].
Even with the use of dedicated systems, the
accuracy of PET scans should not be assumed in all
clinical situations. The spatial resolution of PET scans
is clearly inferior to that of CT, and PET is particu-
larly poor at documenting N1 disease [31]. In addi-
tion, the utility of PET in restaging patients after
induction chemotherapy has not been well estab-
lished. To date, two studies reporting on a total of
90 patients have been published with contradictory
findings [40,41]. In the authors’ experience PET did
not predict nodal status accurately in more than half
of patients restaged after induction chemotherapy,
with an equal proportion over- and understaged [42].
CT/positron emission tomography fusion
Interpretation of a PET scan in the presence of
CT images clearly improves the sensitivity and spec-
ft lower lobe lung cancer.

M.S. Kent et al / Thorac Surg Clin 14 (2004) 1–13 7
ificity of the study [43]. The development of hy-
brid PET/CT scanners is a natural outgrowth of this
observation (Fig. 5). The first prototype, which used
a single-detector CT scanner combined with a par-
tial-ring rotating PET scanner, was introduced re-
cently [44]. The benefits of this new technology
have not yet been clarified. Experience with a more
advanced scanner using multidetector CT combined
with a full-ring detector PET scanner was reported
in 2002. In this study of 53 patients who had a variety
of malignancies including lung cancer, PET/CT fu-
sion was felt to significantly improve diagnostic ac-
curacy over PET alone [45]. Another variation of
this technology is the combination of CT with a
camera-based PET scanner. A small study of 21 pa-
tients who had thoracic malignancies showed that
the accuracy of this system was equal to that of a
dedicated PET scanner [46]. If replicated in larger
studies, this finding might obviate the need for dedi-
cated PET scanners, which are more expensive and
limited in availability.
Endoscopic ultrasound
While mediastinoscopy is a proven tool for stag-
ing patients who have non-small cell lung cancer,
the technique has recognized limitations. Although
mediastinoscopy is an outpatient procedure, the pro-
cedure requires general anesthesia, is difficult to per-
form more than once, and has a small but defined
complication rate. Certain nodal stations such as
levels VIII and IX are also difficult to access by
standard mediastinoscopy. Endoscopic ultrasound
(EUS) has been proposed as an alternative to media-
stinoscopy in specific circumstances. The technique is
no different than EUS used for staging esophageal
cancer and involves the use of an ultrasound probe
placed at the tip of a modified endoscope. EUS
provides excellent visualization of the subcarinal
space and nodes in the inferior mediastinum. Suspi-
cious nodes are identified on the basis of size and
by disruption of the normal architecture, and they can
be sampled by fine-needle aspiration (FNA). In a
pooled analysis of five studies, the reported sensitivity
for this technique was 78% and the specificity was
71% [20]; however, a recent study in which all nodes
were sampled regardless of appearance showed that
the stage of 42% of patients was changed by EUS/
FNA [47]. A significant drawback of this technique is
its inability to visualize right-sided paratracheal
nodes. Given this limitation, it is likely that EUS will
at best complement, rather than replace, staging by
CT, PET, or mediastinoscopy.
The search for extrathoracic disease
The central questions in the search for extrathora-
cic disease are when such an investigation is worth-
while and to what extent it should be pursued.
Patients who have clinical signs or symptoms of
distant disease should undergo a full metastatic
workup; however, in the absence of clinical findings
the yield of such a workup is quite low. For example,
the incidence of silent metastases in patients who
have clinical stage I lung cancer is as low as 1% [48].
A uniform policy of imaging for extrathoracic dis-
ease in this group of patients would therefore incur
considerable expense, unnecessary invasive proce-
dures, and perhaps a significant delay in definitive
treatment [49].
The ability of a thorough clinical evaluation to
exclude metastatic disease has been well studied. Se-
venteen studies have been published in which clini-
cal evaluation was compared with the gold standard
of CT imaging of the brain. The pooled NPV among
1784 patients studied was 94% [20]. In the same
meta-analysis of studies evaluating the presence of
abdominal or bony metastases by the clinical exam-
ination (including routine serum chemistry), the NPV
was 95% and 90%, respectively [20].
If the search for silent metastases is restricted to
patients who have more advanced-stage disease, the
yield will be substantially higher. Approximately
25% of patients who have clinical N2 disease will
harbor metastatic disease [50], and patients who have
tumors greater than 3 cm are more likely to have brain
metastases when screened by MRI. Tumor histology
alone is not an independent risk factor for metastatic
disease [42]. Consequently, there is no indication that
patients who have adenocarcinoma require a more
thorough evaluation than patients who have squamous
cell cancer in the absence of clinical findings.
The single randomized study to address the issue
of screening for metastases in patients who have
non–small-cell lung cancer was reported by the
Canadian Lung Oncology Group in 2001 [51]. In
this study all patients were evaluated with a CT of
the chest and mediastinoscopy. Patients were then
randomized to immediate thoracotomy or additional
evaluation by bone scintigraphy and dedicated CT
scans of the abdomen and brain. The hypothesis
of the study was that additional evaluation would
lead to a lower rate of thoracotomies without cure,
defined as an incomplete resection or thoracotomy
with subsequent recurrence. Among the 634 patients
who were randomized, thoracotomy without cure
occurred in 73 patients in the limited investigation
group and in 58 patients in the full investigation

M.S. Kent et al / Thorac Surg Clin 14 (2004) 1–138
group. This trend was not statistically significant (P =
0.20) and no difference in survival was observed
between the two groups. An economic analysis cal-
culated less cost in the full investigation group
because of the avoidance of additional surgical
procedures; however, it is not clear whether or
not this would hold true in the United States’ health
care system.
Should a metastatic workup be deemed neces-
sary, some organ-specific considerations are dis-
cussed herein, followed by the authors’ current
imaging recommendations.
Brain
Central nervous system (CNS) metastases occur
in less than 3% of all asymptomatic lung cancer
patients [52]. Furthermore, in one study routine
CNS scanning led to a false-positive rate of 11%
[53]. While asymptomatic patients need not be
screened for brain metastases, the definition of what
constitutes symptoms differs widely among physi-
cians. Often, patients who have mild symptoms such
as headache of dizziness are classified as asymptom-
atic, although these patients are clearly documented
to have a higher rate of brain metastases [54].
CT and MRI are both suitable imaging studies for
evaluating for brain metastases. Gadolinium-en-
hanced MRI can detect smaller lesions and has a
higher sensitivity than a CT with contrast. Although
MRI can detect more lesions in a single patient, it has
not been shown to upstage a greater number of
Fig. 6. CT scan with contrast demonstrating
patients compared with CT [55]. Consequently, the
detection of smaller metastases by MRI is rarely of
clinical significance. Prolonged survival in patients
whose lesions were detected by MRI over CT is
likely caused by lead-time bias rather than a true
survival benefit [56].
Adrenal
Adrenal lesions are common in the general popu-
lation and most often represent adrenal adenomas
[57]. The assumption that an adrenal mass in a can-
cer patient represents a metastasis is not always valid.
Although an adrenal mass is more likely to be malig-
nant in patients who have advanced-stage disease
[58], adenomas predominate in patients who have
clinical stage IA cancer [59]. It is therefore critical
that these lesions be characterized precisely. A patient
can be denied potentially curative surgery if an
adenoma is mistakenly presumed to represent meta-
static disease. On the other hand, select patients might
be candidates for synchronous adrenalectomy and
pulmonary resection if a definitive diagnosis is made.
Typically, an adrenal mass is diagnosed on the
lower cuts of a contrast-enhanced chest CT per-
formed to evaluate the primary tumor (Fig. 6). Char-
acteristics of an adenoma include a low attenuation
lesion of less than 5 cm with a smooth, high attenua-
tion rim. A definitive diagnosis based on these crite-
ria is not always possible, however, and further
assessment becomes necessary [60]. One option is
to acquire delayed images to observe the pattern of
bilateral adrenal metastases (arrows).

Fig. 7. FDG-PET demonstrating multiple sites of meta-
static disease.
M.S. Kent et al / Thorac Surg Clin 14 (2004) 1–13 9
contrast washout. Adenomas typically display mod-
erate contrast enhancement with substantial washout
after 15 minutes. Adrenal metastases show the oppo-
site pattern: intense enhancement and little washout.
This technique has a reported sensitivity and speci-
ficity of 96% [61].
Another option is to repeat the CT without con-
trast. Adenomas are characterized by their high fat
content and consequently have a low attenuation
value on nonenhanced CT. The specificity of the
method will vary with the threshold used to define
malignancy. In a meta-analysis of 10 studies, the
specificity varied from 100% at a cutoff of 2 Houns-
field units (HU) to 87% at 20 HU. This study re-
commended that a threshold of 10 HU be used [62].
MRI has also been used to differentiate adenomas
from malignant disease on the basis of fat content.
Initial experience with MRI has suggested that
adenomas can be identified by their low signal on
T2-weighted images [63]. Further evaluation has
shown that this finding is relatively nonspecific, and
newer techniques using MR spectroscopy have sup-
planted routine MR imaging. Using chemical shift
imaging and dynamic gadolinium enhancement, MRI
was shown to have a specificity of 100% and spec-
ificity of 81% [64]. Unfortunately, this specialized
examination is not widely available.
Finally, PET scanning can also be used to char-
acterize adrenal masses. In three studies evaluating
88 patients who had a variety of malignancies, PET
scanning was shown to have a sensitivity of 100%
and a specificity between 80% and 100% [65–67].
Thus, an adrenal mass seen on CT that is negative on
PET is unlikely to be malignant. However, because
of a small but defined false-positive rate, patients
should undergo a confirmatory percutaneous needle
biopsy if the PET scan suggests an adrenal metastasis.
Bone
Routine BS in asymptomatic patients leads to
positive results in up to 40% of cases [68], however
bone scans are relatively nonspecific and have a
false-positive rate as high as 40% because of the
prevalence of preexisting traumatic or degenerative
skeletal disease [69]. MRI is also plagued by a high
number of false-positive scans, and it does not seem
that the overall accuracy of MRI surpasses that of
standard BS [70]. Although there are fewer studies of
PET scanning in this setting, they suggest that its
sensitivity and specificity are at least equal to, if not
superior to, bone scans [71,72]. In one study PETwas
shown to have an equivalent sensitivity but a superior
specificity (98% versus 61%) to bone scans, but
direct comparison between these techniques is diffi-
cult because of a flawed study design. In the majority
of reports a suspicious lesion was not definitively
diagnosed by a fine needle biopsy, so the true false-
positive rate could not be established.
Extrathoracic staging with positron emission
tomography
The hope that whole-body PET might replace the
standard metastatic workup for patients who have
lung cancer deserves special mention (Fig. 7). The
accuracy of PET in imaging metastases to the bone or
solid organs excluding the brain equals or surpasses
that of standard imaging. PET has been shown to de-
tect extrathoracic metastases in 11% to 14% of patients
who were thought to have localized disease by con-
ventional imaging [61,73]. Furthermore, negative PET
scans can exclude metastatic disease suggested by CT
scans with a reported 1% false-negative rate [61,63].
PET has some limitations in whole-body staging,
however. PET cannot replace standard imaging of
the brain. Because of the high metabolic rate of nor-

Fig. 8. False-positive FDG-PET of an early-stage lung
cancer. Supraclavicular lymph node biopsy revealed scle-
rosing lymphadenitis.
M.S. Kent et al / Thorac Surg Clin 14 (2004) 1–1310
mal brain tissue, PET is extremely poor at detecting
cerebral metastases, with a sensitivity of only 60%
[61]. There is also a concern regarding the wide-
spread application of whole-body imaging in an
asymptomatic population. As more patients who
have early-stage lung cancer are staged by PET, the
issue of false-positive studies becomes more relevant
(Fig. 8). If every asymptomatic patient was screened
with PET, which has a specificity between 80% and
100% for bone and adrenal lesions, a significant
number of invasive and perhaps unnecessary diag-
nostic procedures would result.
Summary
Proper selection and interpretation of imaging
studies is essential to provide optimal treatment to
patients who have lung cancer. The following com-
bines the recommendations of the American College
of Chest Physicians [74] and the authors’ current
clinical practice guidelines:
� All patients who have known or suspected lung
cancer should undergo a CT of the chest and
upper abdomen.� An FDG-PET study should be performed, if
available.� Mediastinoscopy should be performed in all
patients except those who have peripheral small
(<2 cm) tumors and no evidence of N2 disease
on CT or PET imaging.� MRI should be performed for tumors of the
superior sulcus to define the relationship of the
tumor to adjacent neurovascular structures.� Patients who have neurologic signs or symp-
toms should undergo a brain imaging study (CT
or MRI).� Screening for extrathoracic disease is not nec-
essary in asymptomatic patients who have clini-
cal stage I or II disease.
References
[1] Jemal A, Thomas A, Murray T, et al. Cancer statistics,
2002. CA Cancer J Clin 2002;52:23–47.
[2] Ratto GB, Piacenza G, Frola C, et al. Chest wall
involvement by lung cancer: computed tomographic
detection and results of operation. Ann Thorac Surg
1991;51:182–8.
[3] Pennes DR, Glazer GM, Wimbish KJ, et al. Chest wall
invasion by lung cancer: limitations of CT evaluation.
Am J Roentgenol 1985;144:507–11.
[4] Quint LE, Francis IR, Wahl RL, Gross BH, et al. Pre-
operative staging of non-small cell carcinoma of the
lung: imaging methods. Am J Roentgenol 1995;164:
1349–59.
[5] Pearlberg JL, Sandler MA, Beute GH, et al. Limita-
tions of CT in evaluation of neoplasms involving the
chest wall. J Comput Assist Tomogr 1987;11:290–3.
[6] Murata K, Takahashi M, Mori M, et al. Chest wall and
mediastinal invasion by lung cancer: evaluation with
multisection expiratory dynamic CT. Radiology 1994;
191:251–5.
[7] Cetinkaya E, Turna A, Yildiz P, et al. Comparison of
clinical and surgical–pathological staging of patients
with non-small cell lung carcinoma. Eur J Cardio-
thorac Surg 2002;22:1000–5.
[8] Gat SB, Black WB, Armstrong P, et al. Chest CT
of unresectable lung cancer. Radiographics 1988;8:
735–48.
[9] Martini N, Heelan R, Westcott J, et al. Comparative
merits of conventional computed tomographic and
magnetic resonance imaging in assessing medias-
tinal involvement in surgically confirmed lung carci-
noma. J Thorac Cardiovasc Surg 1985;90:639–48.
M.S. Kent et al / Thorac Surg Clin 14 (2004) 1–13 11
[10] Glazer HS, Kaiser LR, Anderson DJ, et al. Indetermi-
nate mediastinal invasion in bronchogenic carcinoma:
CT evaluation. Radiology 1989;173:37–42.
[11] White PG, Adams H, Crane MD, et al. Preoperative
staging of carcinoma of the bronchus: can computed
tomographic staging readily identify stage III tumors?
Thorax 1994;49:951–7.
[12] Webb WR, Gatsonis C, Zerhouni EA, et al. CT and
MR imaging in staging non-small cell broncho-
genic carcinoma: report of the Radiologic Diagnostic
Oncology Group. Radiology 1991;178(3):705–13.
[13] Ohno Y, Adachi S, Motoyama A, et al. Multiphase
ECG-triggered 3D contrast-enhanced MR angiogra-
phy; utility for evaluation of hilar and mediastinal
invasion of bronchogenic carcinoma. J Magn Reson
Imaging 2001;13:215–24.
[14] Mayr B, Heywang S, Ingrisch H, et al. Comparison
of CT with MR imaging of endobronchial tumors.
J Comput Assist Tomogr 1987;11:43–8.
[15] McCloud T, Filion R, Edelman R, et al. MR imaging
of superior sulcus carcinoma. J Comput Assist Tomogr
1989;13:233–9.
[16] Freundlich I, Chasen M, Varma D. Magnetic reso-
nance imaging of pulmonary apical tumors. J Thorac
Imaging 1996;11:210–22.
[17] Heelan R, Demas B, Caravelli J, et al. Superior sul-
cus tumors: CT and MR imaging. Radiology 1989;170:
637–41.
[18] Eggeling S, Martin T, Bottger J, et al. Invasive staging
of non-small cell lung cancer—a prospective study.
Eur J Cardiothorac Surg 2002;22:679–84.
[19] Waller D, Clarke S, Tsang G. Is there a role for
video-assisted thoracoscopy in the staging of non-
small cell lung cancer? Eur J Cardiothorac Surg
1997;12:214–7.
[20] Loscertales J, Jimenez-Merchan R, Congregado-Lo-
scertales M, et al. Usefulness of videothoracoscopic
intrapericardial examination of pulmonary vessels
to identify resectable clinical T4 lung cancer. Ann
Thorac Surg 2002;73:1563–6.
[21] Patterson G, Ginsberg R, Poon P, et al. A prospective
evaluation of magnetic resonance imaging, computed
tomography, and mediastinoscopy in the preopera-
tive assessment of mediastinal node status in broncho-
genic carcinoma. J Thorac Cardiovasc Surg 1987;94:
679–84.
[22] Grenier P, Dubray B, Carette M, et al. Pre-operative
staging of lung cancer: CT and MR evaluation. Diagn
Interv Radiol 1989;1:23–30.
[23] Genereux G, Howie J. Normal mediastinal lymph
node size and number: CT and anatomic study. Am J
Roentgenol 1984;142:1095–100.
[24] Toloza E, Harpole L, McCroy D. Noninvasive stag-
ing of non-small cell lung cancer: a review of the cur-
rent evidence. Chest 2003;1(S):137–45.
[25] Vallieres E, Waters P. Incidence of mediastinal node
involvement in clinical T1 bronchogenic carcinomas.
Can J Surg 1987;30:341–2.
[26] Brudin L, Valind S, Rhodes C, et al. Fluorine-18 de-
oxyglucose uptake in sarcoidosis measured with posi-
tron emission tomography. Eur J Nucl Med 1994;21:
297–305.
[27] Glazer G, Orringer M, Chenevert T, et al. Mediastinal
lymph nodes: relaxation time/pathologic correlation
with implications in staging of lung cancer with MR
imaging. Radiology 1988;168:429–31.
[28] Boiselle P. MR imaging of thoracic lymph nodes.
MRI Clin N Am 2000;8:33–41.
[29] Laissey J, Gay-Depassier P, Soyer P, et al. Enlarged
mediastinal lymph nodes in bronchogenic carcinoma:
assessment with dynamic contrast-enhanced MR
imaging. Radiology 1994;191:263–7.
[30] Vassallo P, Matei C, Heston W, et al. AMI-227-
enhanced MR lymphography: usefulness for differ-
entiating reactive from tumor-bearing lymph nodes.
Radiology 1994;193:501–6.
[31] Bellin M, Roy C, Kinkel K, et al. Lymph node meta-
stases: safety and effectiveness of MR imaging
with ultrasmall superparamagnetic iron oxide par-
ticles—initial clinical experience. Radiology 1998;
207:799–808.
[32] Nguyen B, Stanford W, Thompson B, et al. Multicenter
clinical trial of ultrasmall superparamagnetic iron
oxide in the evaluation of mediastinal lymph nodes
in patients with primary lung carcinoma. J Magn
Reson Imaging 1999;10:468–73.
[33] Dwamena B, Sonnad S, Angobaldo J, et al. Metastases
from non-small cell lung cancer: mediastinal staging
in the 1990s—meta-analytic comparison of PET and
CT. Radiology 1999;213:530–6.
[34] Hellwig D, Ukena D, Paulsen F, et al. Meta-analysis
of the efficacy of positron emission tomography with
F-18 fluorodeoxyglucose in lung tumors. Pneumologie
2001;55:367–77.
[35] Hicks R, Kalff V, MacManus M, et al. 18F-FDG PET
provides high-impact and powerful prognostic stratifi-
cation in staging newly-diagnosed non-small cell lung
cancer. J Nucl Med 2001;42:1596–604.
[36] Vesselle H, Pugsley J, Vallieres E, Wood D. The im-
pact of F18 positron-emission tomography on the sur-
gical staging of non-small cell lung cancer. J Thorac
Cardiovasc Surg 2002;124:511–9.
[37] Tinteren H, Hoekstra O, Smit E, et al. Effectiveness
of positron emission tomography in the preopera-
tive assessment of patients with suspected non-small
cell lung cancer: the PLUS multicentre trial. Lancet
2002;359:1388–92.
[38] Coleman R, Tesar R. Clinical PET: are we ready?
J Nucl Med 1997;38:5N–9N.
[39] Stevens H, Bakker P, Schlosser N, et al. Use of a dual-
head coincidence camera and 18F-FDG for detection
and nodal staging of non-small cell lung cancer: accu-
racy as determined by 2 independent observers. J Nucl
Med 2003;44:336–40.
[40] Akhurst T, Downey R, Ginsberg M, et al. An initial
experience with FDG-PET in the imaging of residual

M.S. Kent et al / Thorac Surg Clin 14 (2004) 1–1312
disease after induction therapy for lung cancer. Ann
Thorac Surg 2002;73:259–64.
[41] Cerfolio R, Ojha B, Mukherjee S, et al. Positron emis-
sion tomography scanning with 2-fluoro-2-deoxy-
D-glucose as a predictor of response of neoadjuvant
treatment for non-small cell carcinoma. J Thorac Car-
diovasc Surg 2003;125:938–44.
[42] Port JL, Kent M, Kerestzes R, et al. Positron emission
tomography scanning poorly predicts response to pre-
operative chemotherapy in non-small cell lung cancer.
Ann Thorac Surg 2004;77:254–9.
[43] Weng E, Tran L, Rege S, et al. Accuracy and clinical
staging of mediastinal lymph node staging with FDG-
PET imaging in potentially respectable lung cancer.
Am J Clin Oncol 2000;23:47–52.
[44] Kluetz P, Villemagne V, Metzer G, et al. The case for
PET/CT: experience at the University of Pittsburgh
[abstract]. Clin Positron Imaging 2000;3:174.
[45] Hany T, Steinert H, Goerres G, et al. PET diagnostic
accuracy: improvement with in-line PET-CT system:
initial results. Radiology 2002;225:575–81.
[46] D’Amico T, Wong T, Harpole D, et al. Impact of com-
puted tomography–positron emission tomography fu-
sion in staging patients with thoracic malignancies.
Ann Thorac Surg 2002;74:160–3.
[47] Wallace M, Silvestri G, Sahai A, et al. Endoscopic
ultrasound-guided fine-needle aspiration for staging
patients with carcinoma of the lung. Ann Thorac Surg
2001;72:1861–7.
[48] Tanaka K, Kubota K, Kodama T, et al. Extrathoracic
staging is not necessary for non-small cell lung cancer
with clinical stage T1–2 N0. Ann Thorac Surg 1999;
68:1039–42.
[49] Billings J, Wells F. Delays in the diagnosis and surgical
management of lung cancer. Thorax 1996;51:903–6.
[50] Grant D, Edwards D, Goldstraw P. Computed tomog-
raphy of the brain, chest, and abdomen in the pre-
operative assessment of non-small cell lung cancer.
Thorax 1988;43:883–6.
[51] The Canadian Lung Oncology Group. Investigating
extrathoracic disease in patients with apparently
operable lung cancer. Ann Thorac Surg 2001;75:
425–34.
[52] American Thoracic Society. Pretreatment in the evalua-
tion of non-small cell lung cancer. Am J Respir Crit
Care Med 1997;156:320–32.
[53] Patchell R, Tibbs P, Walsh J, et al. A randomized trial
of surgery in the treatment of single metastases to
the brain. N Engl J Med 1990;322:494–500.
[54] Guyatt G, Cook D, Griffith L, et al. Surgeon’s assess-
ment of symptoms suggesting extrathoracic metastases
in patients with lung cancer. Ann Thorac Surg 1999;
68:309–15.
[55] Davis P, Hudgins P, Peterman S, et al. Diagnosis of
cerebral metastases: double-dose delayed CT vs. con-
trast-enhanced MR imaging. AJR Am J Roentgenol
1991;156:1039–46.
[56] Yokoi K, Kamiya N, Matsuguma H, et al. Detection
of brain metastasis in potentially operable non-small
cell lung cancer: a comparison of CT and MRI. Chest
1999;115:714–9.
[57] Glazer H, Weyman P, Sagel S, et al. Non functioning
adrenal masses: incidental discovery on computed
tomography. AJR Am J Roentgen 1982;139:81–5.
[58] Eggesbo H, Glazer G, Gross B, et al. Clinical impact
of adrenal expansive lesions in bronchial carcinoma.
Acta Radiol 1996;37:343–7.
[59] Pearlberg J, Sandler M, Beute G, et al. T1N0M0 bron-
chogenic carcinoma: assessment by CT. Radiology
1985;157:187–90.
[60] Gillams A, Roberts C, Shaw P, et al. The value of
CT scanning and percutaneous fine needle aspiration
of adrenal masses in biopsy-proven lung cancer. Clin
Radiol 1992;46:18–22.
[61] Korobkin M, Brodeur F, Francis I, et al. CT time-
attenuation washout curves of adrenal adenomas
and nonadenomas. AJR Am J Roentgenol 1998;170:
747–52.
[62] Boland G, Lee M, Gazelle G, et al. Characterization of
adrenal masses using unenhanced CT: an analysis of
the CT literature. Am J Roentgenol 1998;171:201–4.
[63] Glazer G, Woolsey E, Borrello J. Adrenal tissue
characterization using MR imaging. Radiology 1986;
158:73–9.
[64] Korobkin M, Lombardi T, Aisen M, et al. Characteri-
zation of adrenal masses with chemical shift and gado-
linium-enhanced MR imaging. Radiology 1995;197:
411–8.
[65] Erasmus J, Patz E, McAdams H, et al. Evaluation
of adrenal masses in patients with bronchogenic
carcinoma using 18F-fluorodeoxyglucose positron
emission tomography. AJR Am J Roentgenol 1997;
168:1357–60.
[66] Boland G, Goldberg M, Lee M, et al. Indeterminate
adrenal mass in patients with cancer: evaluation at
PET with 2-F-18-fluor-2-deoxy-D-glucose. Radiology
1995;194:131–4.
[67] Yun M, Kim W, Alnafisi N, et al. 18F-FDG PET
in characterizing adrenal lesions detected on CT or
MRI. J Nucl Med 2001;42:1795–9.
[68] Tornyos K, Garcia O, Karr B, et al. A correlation study
of bone scanning with clinical and laboratory find-
ings in the staging of non-small cell lung cancer. Clin
Nucl Med 1991;16:107–9.
[69] Quinn D, Ostrow L, Porter D, et al. Staging of non-
small cell bronchogenic carcinoma: relationship of
the clinical evaluation to organ scans. Chest 1986;89:
270–5.
[70] Earnest I, Ryu J, Miller G, et al. Suspected non-small
cell lung cancer: incidence of occult brain and skeletal
metastases and effectiveness of imaging for detec-
tion-pilot study. Radiology 1999;211:137–45.
[71] Marom E, McAdams H, Erasmus J, et al. Staging non-
small cell lung cancer with whole body PET. Radiol-
ogy 1998;168:187–94.
[72] Durski J, Srinivas S, Segall G. Comparison of FDG-

M.S. Kent et al / Thorac Surg Clin 14 (2004) 1–13 13
PET and bone scans for detecting skeletal metastases
in patients with non-small cell lung cancer. Clin Posi-
tron Imag 2000;3:97–105.
[73] Valk P, Pounds T, Hopkins D, et al. Staging non-small
cell lung cancer by whole-body positron emission
tomographic imaging. Ann Thorac Surg 1995;60:
1573–82.
[74] Silvestri G, Tanoue L, Margolis M, et al. The nonin-
vasive staging of non-small cell lung cancer: the guide-
lines. Chest 2003;123:147S–56S.
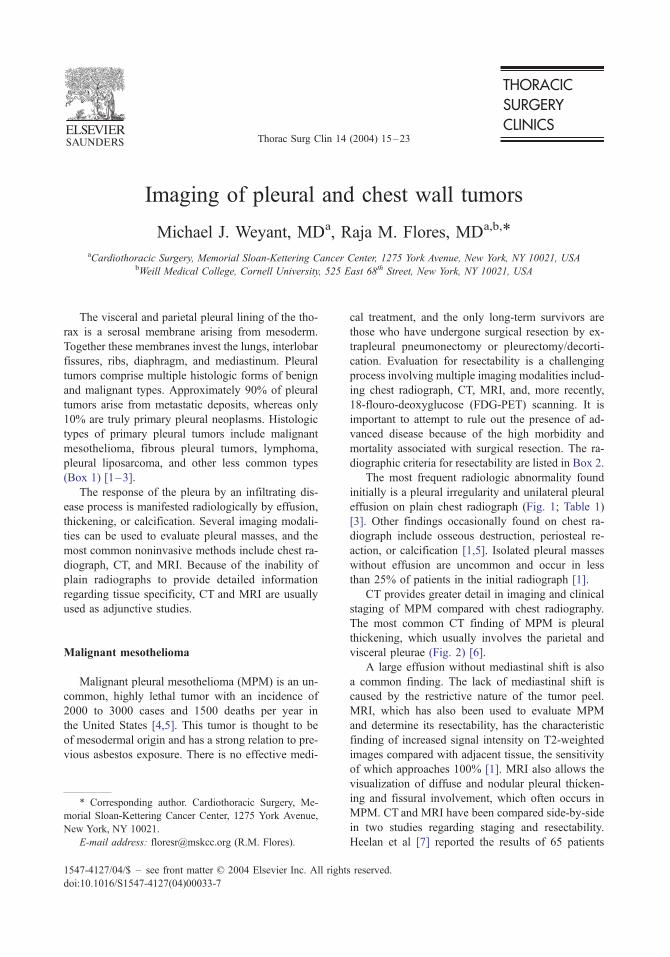
Thorac Surg Clin 14 (2004) 15–23
Imaging of pleural and chest wall tumors
Michael J. Weyant, MDa, Raja M. Flores, MDa,b,*
aCardiothoracic Surgery, Memorial Sloan-Kettering Cancer Center, 1275 York Avenue, New York, NY 10021, USAbWeill Medical College, Cornell University, 525 East 68th Street, New York, NY 10021, USA
The visceral and parietal pleural lining of the tho- cal treatment, and the only long-term survivors are
rax is a serosal membrane arising from mesoderm.
Together these membranes invest the lungs, interlobar
fissures, ribs, diaphragm, and mediastinum. Pleural
tumors comprise multiple histologic forms of benign
and malignant types. Approximately 90% of pleural
tumors arise from metastatic deposits, whereas only
10% are truly primary pleural neoplasms. Histologic
types of primary pleural tumors include malignant
mesothelioma, fibrous pleural tumors, lymphoma,
pleural liposarcoma, and other less common types
(Box 1) [1–3].
The response of the pleura by an infiltrating dis-
ease process is manifested radiologically by effusion,
thickening, or calcification. Several imaging modali-
ties can be used to evaluate pleural masses, and the
most common noninvasive methods include chest ra-
diograph, CT, and MRI. Because of the inability of
plain radiographs to provide detailed information
regarding tissue specificity, CT and MRI are usually
used as adjunctive studies.
Malignant mesothelioma
Malignant pleural mesothelioma (MPM) is an un-
common, highly lethal tumor with an incidence of
2000 to 3000 cases and 1500 deaths per year in
the United States [4,5]. This tumor is thought to be
of mesodermal origin and has a strong relation to pre-
vious asbestos exposure. There is no effective medi-
1547-4127/04/$ – see front matter D 2004 Elsevier Inc. All right
doi:10.1016/S1547-4127(04)00033-7
* Corresponding author. Cardiothoracic Surgery, Me-
morial Sloan-Kettering Cancer Center, 1275 York Avenue,
New York, NY 10021.
E-mail address: [email protected] (R.M. Flores).
those who have undergone surgical resection by ex-
trapleural pneumonectomy or pleurectomy/decorti-
cation. Evaluation for resectability is a challenging
process involving multiple imaging modalities includ-
ing chest radiograph, CT, MRI, and, more recently,
18-flouro-deoxyglucose (FDG-PET) scanning. It is
important to attempt to rule out the presence of ad-
vanced disease because of the high morbidity and
mortality associated with surgical resection. The ra-
diographic criteria for resectability are listed in Box 2.
The most frequent radiologic abnormality found
initially is a pleural irregularity and unilateral pleural
effusion on plain chest radiograph (Fig. 1; Table 1)
[3]. Other findings occasionally found on chest ra-
diograph include osseous destruction, periosteal re-
action, or calcification [1,5]. Isolated pleural masses
without effusion are uncommon and occur in less
than 25% of patients in the initial radiograph [1].
CT provides greater detail in imaging and clinical
staging of MPM compared with chest radiography.
The most common CT finding of MPM is pleural
thickening, which usually involves the parietal and
visceral pleurae (Fig. 2) [6].
A large effusion without mediastinal shift is also
a common finding. The lack of mediastinal shift is
caused by the restrictive nature of the tumor peel.
MRI, which has also been used to evaluate MPM
and determine its resectability, has the characteristic
finding of increased signal intensity on T2-weighted
images compared with adjacent tissue, the sensitivity
of which approaches 100% [1]. MRI also allows the
visualization of diffuse and nodular pleural thicken-
ing and fissural involvement, which often occurs in
MPM. CT and MRI have been compared side-by-side
in two studies regarding staging and resectability.
Heelan et al [7] reported the results of 65 patients
s reserved.

Box 1. Classification of pleural and chestwall tumors
Pleural tumors
Malignant pleural mesotheliomaSolitary fibrous tumorPleural liposarcomaPleural metastasis
Chest wall tumors
Soft tissue sarcomasCartilaginous tumorsPrimary bone tumorsMetastatic lesionsTumors invading from contiguous
organs
Fig. 1. Plain radiograph demonstrating left side pleural effu-
sion in a patient who had MPM.
M.J. Weyant, R.M. Flores / Thorac Surg Clin 14 (2004) 15–2316
who underwent CT, MRI, and attempt at surgical re-
section in an effort to determine the accuracy of CT
and MRI with specific correlation to staging. The
accuracy of CT and MRI was relatively poor in most
areas. Their accuracy, respectively, to assess visceral
pleural involvement was 67% versus 58%; diffuse
chest wall involvement 65% versus 52%; invasion of
diaphragm 55% versus 82%; and invasion of lung
parenchyma 46% versus 69%. The ability to detect
Box 2. Imaging criteria for resectability inmalignant pleural mesothelioma
Resectable tumors
Preserved extrapleural fat planesNormal CT attenuation values and
MR signal intensity of adjacentstructures
Absence of extrapleural soft tissuemasses
Smooth inferior diaphragmatic surface
Unresectable tumors
Tumor encasement of the diaphragmInvasion of extrapleural soft tissueInfiltration or displacement of ribs by
tumorInvasion of essential mediastinal
structures
nodal involvement is even worse: 49% for CT versus
51% for MRI. The authors attribute these low accu-
racy rates to the diffuse nature of the tumor. MRI
was found to be slightly better in revealing solitary
foci of chest wall invasion, endothoracic fascia in-
volvement, and diaphragmatic muscle invasion.
These findings did not affect surgical decision-mak-
ing, and the authors advocate the routine use of
CT, not MRI, because of the increased cost of MRI.
Patz et al [4] performed a study comparing CT and
MRI in 41 patients to determine the resectability of
MPM. The unresectability rate of patients undergoing
thoracotomy was 30%. There was no significant dif-
ference in the predictive values of these modalities,
Table 1
Most common CT findings of malignant pleural mesothe-
lioma
Finding % Cases
Pleural thickening 92
Thickening of interlobar fissures 86
Pleural effusion 74
Loss of volume of involved hemithorax 42
Pleural calcification 20
Invasion of chest wall 18
Data from Refs. [2,6,18].
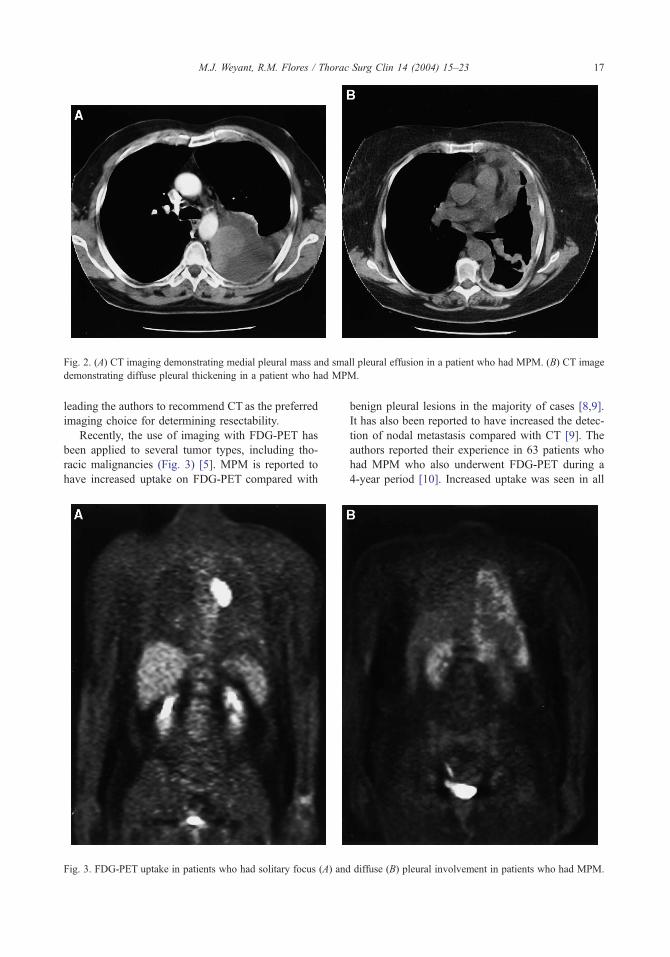
Fig. 2. (A) CT imaging demonstrating medial pleural mass and small pleural effusion in a patient who had MPM. (B) CT image
demonstrating diffuse pleural thickening in a patient who had MPM.
M.J. Weyant, R.M. Flores / Thorac Surg Clin 14 (2004) 15–23 17
leading the authors to recommend CT as the preferred
imaging choice for determining resectability.
Recently, the use of imaging with FDG-PET has
been applied to several tumor types, including tho-
racic malignancies (Fig. 3) [5]. MPM is reported to
have increased uptake on FDG-PET compared with
Fig. 3. FDG-PET uptake in patients who had solitary focus (A) and
benign pleural lesions in the majority of cases [8,9].
It has also been reported to have increased the detec-
tion of nodal metastasis compared with CT [9]. The
authors reported their experience in 63 patients who
had MPM who also underwent FDG-PET during a
4-year period [10]. Increased uptake was seen in all
diffuse (B) pleural involvement in patients who had MPM.

M.J. Weyant, R.M. Flores / Thorac Surg Clin 14 (2004) 15–2318
but one tumor. PET findings yielded sensitivities of
only 19% and 11% in determining tumor (T) and
node (N) status, respectively. A high standard uptake
value (SUV) did, however, correlate with the pres-
ence of N2 disease. The authors’ results demonstrated
that although FDG-PET is a poor predictor of stage, it
identified occult stage IV disease that was otherwise
undetected by CT scan alone in 10% of patients.
In addition to the benefit of identifying patients
who have stage IV disease, PET scans might have
prognostic significance. The authors evaluated their
now-larger cohort of 85 patients who underwent PET
scanning with the diagnosis of malignant pleural
mesothelioma and found that there was a linear rela-
tionship between increasing SUV and poor median
survival time. In addition, the relative risk of death in
patients who had an SUV of greater than four when
compared with an SUVof less than four was 3.3 (P =
0.03), which is a clinically significant finding that is
equivalent to impact of histology on survival. The
relative risk of death for nonepithelial histology com-
pared with epithelial histology was 3.2 (P = 0.03).
These findings suggest that PET can be used to strat-
ify patients for treatment [11].
Pleural plaques
Pleural plaques, which are usually a result of as-
bestos exposure, can present as diffuse thickening of
the visceral and parietal pleural layers. These lesions
can vary from diffuse, nodular lesions on the pleural
surface to lesions as wide as 6 cm. The coalescence
of pleural surfaces and the propensity for the lower
hemithorax can cause these lesions to be clinically
mistaken for diffuse MPM. These plaques are thought
to be formed by lymphatic transport of asbestos fi-
bers from the visceral to the parietal pleura, with the
fibers undergoing phagocytosis by macrophages that
secrete substances stimulating submesothelial fibro-
Fig. 4. (A, B) Solitary fibrous tumor attached to sta
blasts [12]. The physician should remember that it is
not uncommon for mesothelioma and pleural plaques
to be present simultaneously.
The distinction between benign pleural plaques
and mesothelioma can generally be recognized easily
by CT scan. Calcifications are usually present in pa-
tients who have a history of asbestos exposure, and
extensive calcification usually indicates benign pleu-
ral pathology [13]. In certain cases PET scans have
been useful in distinguishing between benign and
malignant pleural pathology [14]; however, when a
significant question arises, the gold standard in dis-
tinguishing a benign from a malignant pleural pro-
cess is surgical biopsy, preferably by way of the video
assisted thoracic surgery (VATS) technique.
Solitary fibrous tumor
Solitary fibrous tumors are thought to arise from
submesothelial mesenchymal cells. They compromise
only 10% of primary pleural tumors [15]. The inci-
dence of these tumors is highest in patients older
than 50 years of age [1]. Approximately 50% of be-
nign fibrous tumors of the pleura are asymptomatic
and are found incidentally on routine chest radio-
graphs. Symptomatic patients might present with
chest pain, cough, dyspnea, and fever. Pierre-Marie-
Bamberg syndrome (pulmonary osteoarthropathy and
clubbing) has been described in approximately 15%
of cases from the tumor production of hyaluronic acid
[16]. Doege-Potter Syndrome (refractory hypogly-
cemia) has been described in approximately 5% of
cases; these lesions might secrete an insulin-like sub-
stance [17].
The typical radiographic appearance is a rounded
or oval, frequently lobulated mass abutting the pleu-
ral surface. Calcification might be present in ap-
proximately 5% of cases. The location might be in
the fissure (30%), adjoining the mediastinal pleura
lk. Note change in position with respiration.
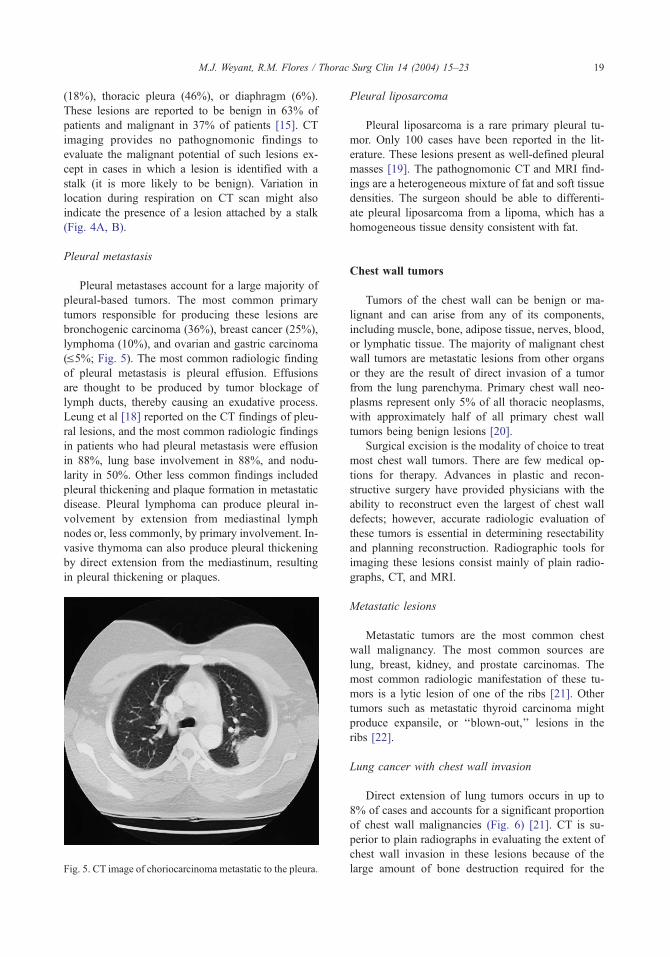
M.J. Weyant, R.M. Flores / Thorac
(18%), thoracic pleura (46%), or diaphragm (6%).
These lesions are reported to be benign in 63% of
patients and malignant in 37% of patients [15]. CT
imaging provides no pathognomonic findings to
evaluate the malignant potential of such lesions ex-
cept in cases in which a lesion is identified with a
stalk (it is more likely to be benign). Variation in
location during respiration on CT scan might also
indicate the presence of a lesion attached by a stalk
(Fig. 4A, B).
Pleural metastasis
Pleural metastases account for a large majority of
pleural-based tumors. The most common primary
tumors responsible for producing these lesions are
bronchogenic carcinoma (36%), breast cancer (25%),
lymphoma (10%), and ovarian and gastric carcinoma
(V5%; Fig. 5). The most common radiologic finding
of pleural metastasis is pleural effusion. Effusions
are thought to be produced by tumor blockage of
lymph ducts, thereby causing an exudative process.
Leung et al [18] reported on the CT findings of pleu-
ral lesions, and the most common radiologic findings
in patients who had pleural metastasis were effusion
in 88%, lung base involvement in 88%, and nodu-
larity in 50%. Other less common findings included
pleural thickening and plaque formation in metastatic
disease. Pleural lymphoma can produce pleural in-
volvement by extension from mediastinal lymph
nodes or, less commonly, by primary involvement. In-
vasive thymoma can also produce pleural thickening
by direct extension from the mediastinum, resulting
in pleural thickening or plaques.
Fig. 5. CT image of choriocarcinoma metastatic to the pleura.
Pleural liposarcoma
Pleural liposarcoma is a rare primary pleural tu-
mor. Only 100 cases have been reported in the lit-
erature. These lesions present as well-defined pleural
masses [19]. The pathognomonic CT and MRI find-
ings are a heterogeneous mixture of fat and soft tissue
densities. The surgeon should be able to differenti-
ate pleural liposarcoma from a lipoma, which has a
homogeneous tissue density consistent with fat.
Surg Clin 14 (2004) 15–23 19
Chest wall tumors
Tumors of the chest wall can be benign or ma-
lignant and can arise from any of its components,
including muscle, bone, adipose tissue, nerves, blood,
or lymphatic tissue. The majority of malignant chest
wall tumors are metastatic lesions from other organs
or they are the result of direct invasion of a tumor
from the lung parenchyma. Primary chest wall neo-
plasms represent only 5% of all thoracic neoplasms,
with approximately half of all primary chest wall
tumors being benign lesions [20].
Surgical excision is the modality of choice to treat
most chest wall tumors. There are few medical op-
tions for therapy. Advances in plastic and recon-
structive surgery have provided physicians with the
ability to reconstruct even the largest of chest wall
defects; however, accurate radiologic evaluation of
these tumors is essential in determining resectability
and planning reconstruction. Radiographic tools for
imaging these lesions consist mainly of plain radio-
graphs, CT, and MRI.
Metastatic lesions
Metastatic tumors are the most common chest
wall malignancy. The most common sources are
lung, breast, kidney, and prostate carcinomas. The
most common radiologic manifestation of these tu-
mors is a lytic lesion of one of the ribs [21]. Other
tumors such as metastatic thyroid carcinoma might
produce expansile, or ‘‘blown-out,’’ lesions in the
ribs [22].
Lung cancer with chest wall invasion
Direct extension of lung tumors occurs in up to
8% of cases and accounts for a significant proportion
of chest wall malignancies (Fig. 6) [21]. CT is su-
perior to plain radiographs in evaluating the extent of
chest wall invasion in these lesions because of the
large amount of bone destruction required for the

Fig. 6. T3 lung cancer demonstrating invasion of chest
wall on CT imaging.
Fig. 7. Pancoast MRI demonstrating invasion of lower
trunk of brachial plexus.
M.J. Weyant, R.M. Flores / Thorac Surg Clin 14 (2004) 15–2320
lesion to become visible on plain radiographs [21].
MRI has also been studied to evaluate the extent of
chest wall invasion. Padovani et al [23] evaluated
34 patients who had bronchogenic carcinoma and re-
ported a sensitivity of 90% by MRI for evaluat-
ing chest wall invasion. Webb et al [24] performed
a study comparing the accuracy of CT and MRI in
evaluating tumor classification and found that there
was no difference in the ability of MRI versus CT
in delineating chest wall invasion; however, they did
find that MRI might be superior in identifying
mediastinal invasion. Identifying lung cancers that
invade into the chest wall is essential to the pre-
operative planning and the clinical staging of these
patients, particularly since these tumors became clas-
sified as T3.
Pancoast tumors
Bronchogenic carcinomas that develop in the apex
of the lung and invade the superior pulmonary sulcus
were described in 1932 by Pancoast, who noted their
association to the clinical findings of Horner’s syn-
drome, unilateral arm pain, and wasting [25]. This
type of tumor represents less than 5% of all lung
cancers, and the survival rate is reported to range
from 15% to 56% (Fig. 7) [26,27]. Vital structures
such as the subclavian artery and vein, brachial
plexus, and vertebral bodies can be invaded early
in the course of growth of superior sulcus tumors.
Surgical resection is an important predictor of cure.
Accurate radiologic assessment of these tumors is
essential to ensure appropriate selection of patients
as candidates for resection to avoid the morbidity
associated with surgery.
These cancers are most often found on plain ra-
diograph, but more detailed studies are required to
delineate the extent of tumor invasion. CT and MRI
are used extensively, and crucial therapeutic deci-
sions are made based on these initial imaging studies.
The critical anatomic areas to be addressed include
(1) the apical layer of fat between the pleura and
the subclavian artery and vein, (2) tumor invasion
into the supraclavicular area, (3) invasion into the
subclavian vein and artery, (4) brachial plexus inva-
sion, and (5) involvement of adjacent ribs or verte-
bral bodies [28]. The decision to offer preoperative
chemotherapy or radiation therapy is based on deter-
mining invasion into these specific areas.
Heelan et al [29] reported experience with 31 pa-
tients who had superior sulcus tumors at Memorial
Sloan Kettering Cancer Center, comparing CT and
MRI in all patients. MRI was superior to CT, with an
accuracy of 94% compared with 63% in determining
invasion extending beyond the apex of the lung. This
increased accuracy is believed to be caused by MRI’s
ability to image in different planes, particularly the
coronal and sagittal planes. Laissy et al [30] reported
experience and efficacy with MR angiography to de-
termine the presence of vessel involvement. Other
authors reported that there might be an advantage to
CT in delineating vertebral body and rib destruction
[28]. The authors find that most patients initially
obtain a CT because of its convenience and availa-

Fig. 9. CT imaging of osteosarcoma arising from the lateral
chest wall.
M.J. Weyant, R.M. Flores / Thorac Surg Clin 14 (2004) 15–23 21
bility. MRI has been demonstrated to be superior in
many aspects when compared with CT and should be
employed in this group of patients.
Primary osseous and cartilaginous lesions
Fibrous dysplasia is the most common benign tu-
mor arising from bone. These tumors account for ap-
proximately 30% of benign tumors of the chest wall
[21,22]. These fibrous tumors are slow-growing and
are usually seen in the lateral or posterior aspect of
one of the ribs. The tumor progresses by filling in the
medullary cavity with fibrous tissue, which can be
demonstrated on CT or MRI [21]. The usual radio-
logic finding is an expanding lytic lesion in one of
the ribs with a ground-glass appearance [22]. Osteo-
chondroma and chondromas together comprise an-
other 30% to 40% of benign chest wall tumors and
usually arise at the sternocostal junction.
Chondrosarcoma is the most common malignant
lesion arising from the bone, most frequently from
the anterior portion of the ribs and less frequently
from the sternum, scapula, or clavicle (Fig. 8) [20].
Chondrosarcomas frequently appear as a large, lobu-
lated mass arising from a rib with scattered calcifi-
cations consistent with a bony matrix [22]. These
lesions might be similar radiographically with their
benign counterparts, enchondromas, osteochondro-
mas, and osteoblastomas, therefore necessitating tis-
sue biopsy for diagnosis. The size of the lesion can be
used as a predictor of malignancy; lesions larger than
Fig. 8. CT imaging of chondrosarcoma arising from the
chest wall.
4 cm are considered to be malignant [21,22]. Osteo-
sarcomas are true malignant bony primary tumors and
usually arise from a rib. These tumors carry a worse
prognosis and have similar radiologic findings to
chondrosarcomas (Fig. 9).
Soft tissue tumors
Soft tissue tumors of the chest wall arise from
muscular, connective, or neural tissue. The most com-
mon soft tissue primary malignant tumors of the chest
wall include fibrosarcoma, malignant fibrous histio-
cytoma, and neurofibrosarcoma [20]. These lesions
appear radiographically similar and present as masses
of soft tissue density that might be associated with a
low-density necrotic area and areas of focal calcifica-
tion. Malignant schwannomas, rarer tumors, often
appear as rounded or elliptical masses adjacent to a
rib [21].
The most common benign soft tissue lesion of the
chest wall is the lipoma. These lesions can have in-
trathoracic and extrathoracic components, a dumb-
bell-shaped appearance, and tissue density consistent
with fat, which makes these lesions easy to identify
using CT or MRI. Neurogenic tumors are often be-
nign and usually appear radiographically to originate
from intercostal nerve roots. MRI is extremely useful
in identifying lesions that encroach on the neural
foramen. Hemangiomas are soft tissue masses that
are occasionally found in the chest wall and are
identified radiographically by the presence of phlebo-
liths and irregular tissue density [22]. Other rare le-
sions include plasmacytomas and desmoid tumors.
The imaging modalities used most frequently to
evaluate chest wall tumors include plain radiographs,

M.J. Weyant, R.M. Flores / Thorac Surg Clin 14 (2004) 15–2322
CT, and MRI. CT and MRI clearly provide supe-
rior resolution to plain radiographs; however, most
tumors are detected initially by a plain radiograph.
Because of its broad diagnostic spectrum, low sus-
ceptibility to artifacts, wide availability, and lower
cost, CT is usually the preferred initial imaging
choice in most institutions [31]. Although MRI is
expensive, time-consuming, and can be susceptible
to motion artifacts, it has several qualities that make it
desirable for evaluation of chest wall tumors. Multi-
planar imaging and superior soft tissue resolution
allow MRI to visualize the relations of tumors to
vessels and planes of tissue, which is helpful when
evaluating the extent of invasion of a tumor into
the chest wall [21,31]. The ability of MRI to help
determine the position of a neurogenic tumor in re-
lation to the neural foramen is also an advantage.
Lastly, the lack of iodinated contrast material allows a
viable option for imaging in patients who had allergic
reactions to standard intravenous contrast solutions.
Summary
MPM is a difficult disease to characterize radio-
graphically because of its diffuse nature and propen-
sity to infiltrate between tissue planes. Although
significant information is obtained by CT, MRI, and
PET, correlation with intraoperative findings is in-
consistent. Overall, CT and MRI are similar in pre-
dicting surgical resectability of pleural and chest wall
malignancies. MRI has a slight advantage in select
situations such as Pancoast tumors; however, CT
is less expensive and is sufficient in the majority of
cases. Because radiologic imaging cannot differenti-
ate benign from malignant lesions with 100% accu-
racy, surgical biopsy remains the gold standard for
diagnosis. Newer imaging modalities such as PET
scan and combined PET/CT might provide greater
information and warrant further study in the pre-
operative evaluation of pleural and chest wall tumors.
References
[1] Bonomo L, Feragalli B, Sacco R, Merlino B, Storto
ML. Malignant pleural disease. Eur J Radiol 2000;34:
98–118.
[2] Dynes MC, White EM, Fry WA, Ghahremani GG.
Imaging manifestations of pleural tumors. Radio-
graphics 1992;12:1191–201.
[3] Schmutz GR, Fisch-Ponsot C, Regent D, Sylvestre J.
Computed tomography (CT) and magnetic resonance
imaging (MRI) of pleural masses. Crit Rev Diagnost
Imaging 1993;34:309–83.
[4] Patz Jr EF, Shaffer K, Piwnica-Worms DR, Jochelson
M, Sarin M, Sugarbaker DJ, et al. Malignant pleu-
ral mesothelioma: value of CT and MR imaging in
predicting resectability. Am J Roentgenol 1992;159:
961–6.
[5] Marom EM, Erasmus JJ, Pass HI, Patz Jr EF. The
role of imaging in malignant pleural mesothelioma.
Semin Oncol 2002;29:26–35.
[6] Ng CS, Munden RF, Libshitz HI. Malignant pleural
mesothelioma: the spectrum of manifestations on CT
in 70 cases. Clin Radiol 1999;54(7):415–21.
[7] Heelan RT, Rusch VW, Begg CB, Panicek DM, Cara-
velli JF, Eisen C. Staging of malignant pleural meso-
thelioma: comparison of CT and MR imaging. Am J
Roentgenol 1999;172:1039–47.
[8] Schneider DB, Clary-Macy C, Challa S, Sasse KC,
Merrick SH, Hawkins R, et al. Positron emission to-
mography with f18-fluorodeoxyglucose in the stag-
ing and preoperative evaluation of malignant pleural
mesothelioma. J Thorac Cardiovasc Surg 2000;120:
128–33.
[9] Benard F, Sterman D, Smith RJ, Kaiser LR, Albelda
SM, Alavi A. Metabolic imaging of malignant pleural
mesothelioma with fluorodeoxyglucose positron emis-
sion tomography. Chest 1998;114:713–22.
[10] Flores RM, Akhurst T, Gonen M, Larson SM, Rusch
VW. Positron emission tomography defines metastatic
disease but not locoregional disease in patients with
malignant pleural mesothelioma. J Thorac Cardiovasc
Surg 2003;126:11–6.
[11] Flores R, Akhurst T, Gonen M, Larson S, Rusch V.
FDG-PET predicts survival in patients with malignant
pleural mesothelioma. ASCO Proceedings, Chicago,
IL, 2003.
[12] Hillerdal G. The pathogenesis of pleural plaques and
pulmonary asbestosis: possibilities and impossibilities.
Eur J Respir Dis 1980;61:129–38.
[13] Tiitola M, Kivisaari L, Zitting A, Huuskonen MS,
Keleva S, Tossavainen A, et al. Computed tomography
of asbestos-related pleural abnormalities. Int Arch
Occupat Environ Health 2002;75:224–8.
[14] Benard F, Sterman D, Smith RJ, Kaiser LR, Albelda
SM, Alavi A. Metabolic imaging of malignant pleural
mesothelioma with fluorodeoxyglucose positron emis-
sion tomography. Chest 1998;114:713–22.
[15] England DM, Hochholzer L, McCarthy MJ. Localized
benign and malignant fibrous tumors of the pleura.
A clinicopathologic review of 223 cases. Am J Surg
Pathol 1989;13:640–58.
[16] Cardillo G, Facciolo F, Cavazzana A, Capece G, Gas-
parri R, Martelli M. Localized (solitary) fibrous tumors
of the pleura: an analysis of 55 patients. Ann Thorac
Surg 2000;70:1808–12.
[17] Chamberlain M, Taggart D. Solitary fibrous tumor as-
sociated with hypoglycemia: an example of the Doege-
Potter syndrome. J Thorac Cardiovasc Surg 2000;119:
185–7.

M.J. Weyant, R.M. Flores / Thorac Surg Clin 14 (2004) 15–23 23
[18] Leung AN, Muller NL, Miller RR. CT in differential
diagnosis of diffuse pleural disease. Am J Roentgenol
1990;154:487–92.
[19] Munk PL, Muller NL. Pleural liposarcoma: CT diag-
nosis. J Comput Assist Tomogr 1988;12:709–10.
[20] Incarbone M, Pastorino U. Surgical treatment of chest
wall tumors. World J Surg 2001;25:218–30.
[21] Schaefer PS, Burton BS. Radiographic evaluation of
chest-wall lesions. Surg Clin N Am 1989;69:911–45.
[22] Jeung MY, Gangi A, Gasser B, Vasilescu C, Massard
G, Wihlm JM, et al. Imaging of chest wall disorders.
Radiographics 1999;19:617–37.
[23] Padovani B, Mouroux J, Seksik L, Chanalet S, Sedat J,
Rotomondo C, et al. Chest wall invasion by broncho-
genic carcinoma: evaluation with MR imaging. Radi-
ology 1993;187:33–8.
[24] Webb WR, Gatsonis C, Zerhouni EA, Heelan RT,
Glazer GM, Francis IR, et al. CT and MR imaging
in staging non-small cell bronchogenic carcinoma: re-
port of the Radiologic Diagnostic Oncology Group.
Radiology 1999;178:705–13.
[25] Komaki R, Putnam Jr JB, Walsh G, Lee JS, Cox JD.
The management of superior sulcus tumors. Surg
Oncol 2000;18:152–64.
[26] Beale R, Slater R, Hennington M, Keagy B. Pancoast
tumor: use of MRI for tumor staging. South Med J
1992;85:1260–3.
[27] Komaki R, Roth JA, Walsh GL, Putnam JB, Vaporciyan
A, Lee JS, et al. Outcome predictors for 143 patients
with superior sulcus tumors treated by multidisciplinary
approach at the University of Texas M.D. Anderson
Cancer Center. Int J Radiat Oncol Biol Phys 2000;48:
347–54.
[28] Kuhlman JE, Bouchardy L, Fishman EK, Zerhouni
EA. CT and MR imaging evaluation of chest wall
disorders. Radiographics 1994;14:571–95.
[29] Heelan RT, Demas BE, Caravelli JF, Martini N, Bains
MS, McCormack PM, et al. Superior sulcus tumors:
CT and MR imaging. Radiology 1989;170:637–41.
[30] Laissy JP, Soyer P, Sekkal SR, Tebboune D, Servois V,
Sibert A, et al. Assessment of vascular involvement
with magnetic resonance angiography (MRA) in
Pancoast syndrome. Magn Reson Imaging 1995;13:
523–30.
[31] Landwehr P, Schulte O, Lackner K. MR imaging of
the chest: mediastinum and chest wall. Eur Radiol
1999;9:1737–44.

Thorac Surg Clin 14 (2004) 25–42
Imaging of the mediastinum: applications for
thoracic surgery
Dorith Shaham, MDa,*, Maria G. Skilakaki, MDb, Orly Goitein, MDa
aDepartment of Radiology, Hadassah University Hospital, Ein-Kerem, Jerusalem 91120, IsraelbDepartment of Radiology, Evangelismos General Hospital, 45–47 Ipsiladou Street, 10675 Athens, Greece
The mediastinum is a complex anatomic division pericardial reflection and posteriorly by the posterior
of the thorax, extending from the thoracic inlet
superiorly to the diaphragm inferiorly. The mediasti-
num is bordered anteriorly by the sternum, poste-
riorly by the vertebral column, and laterally by the
parietal pleura.
The mediastinum is further subdivided into supe-
rior, anterior, middle, and posterior divisions. The
exact anatomic borders of these divisions are unclear,
and different authors have different definitions [1].
Additionally, these borders do not have clear-cut
implications to the development of disease and do
not form barriers to the spread of disease; however,
each compartment of the mediastinum has its own
most common lesions, and knowing the location of
the mass, the patient’s age, and the presence or ab-
sence of symptoms considerably narrows the range of
possible diagnoses [2,3].
The complex anatomy of the mediastinum is best
understood by cross-sectional images provided by CT
or MRI.
According to Gray’s anatomy [4], the mediasti-
num is divided into superior and inferior compart-
ments by an imaginary line from the lower border of
the manubrium to the lower border of the fourth
thoracic vertebra. The anterior mediastinum lies an-
terior to the pericardium and ascending aorta. The
posterior mediastinum is bounded in front by the
trachea, the pulmonary vessels, and the pericardium
and behind by the vertebral column. The middle
mediastinum is bordered anteriorly by the anterior
1547-4127/04/$ – see front matter D 2004 Elsevier Inc. All right
doi:10.1016/S1547-4127(04)00039-8
* Corresponding author.
E-mail address: [email protected] (D. Shaham).
pericardial reflection.
The bulk of the mediastinum is composed of the
heart and blood vessels. The carina, major airways,
and the esophagus are also identified easily in the
normal mediastinum and are surrounded by a variable
amount of fatty areolar tissue.
The contents of the anterosuperior mediastinum
include the thymus gland, the aortic arch and its
branches, the great veins, and the lymphatics. The
middle mediastinum contains the heart, pericardium,
phrenic nerves, carina and main bronchi, hila, and
lymph nodes. The contents of the posterior medias-
tinum include the esophagus, vagus nerves, sympa-
thetic nervous chain, thoracic duct, descending aorta,
azygos and hemiazygos veins, and paravertebral
lymph nodes.
Various imaging modalities
Almost half of all mediastinal masses do not
produce symptoms and are discovered on imaging
examinations obtained for other reasons [2,5,6]. In
recent years several developments in radiographic
techniques and immunohistochemistry have led to
more accurate preoperative delineation and histologic
diagnosis of mediastinal lesions. Today the presur-
gical evaluation of a mediastinal mass often involves
an array of imaging modalities and percutaneous or
transbronchial biopsy techniques [3,7].
Plain chest radiography
The standard posterior–anterior and lateral chest
roentgenogram continue to form the cornerstone of
s reserved.

D. Shaham et al / Thorac Surg Clin 14 (2004) 25–4226
diagnostic imaging [3]. High kilovoltage techniques
[>120 peak kilovoltage (KVp)] have significant ad-
vantages over low kilovoltage techniques (f70–
90 KVp) for demonstrating mediastinal interfaces
and providing better penetration of the mediastinum
[6]. In most cases deformation of the mediastinal
contours must be present for the radiologist to iden-
tify a mass, manifested as focal or widespread dis-
placement of normal structures or of the mediastinal
pleura [8]. Other features to be evaluated include
lesion shape, margins, location, the presence of single
or multifocal masses, the presence and type of cal-
cification (eg, rim-like calcification suggests a cystic
or vascular lesion), and associated findings such
as pleural involvement [9,10]. Mediastinal masses
are typically rounded and well circumscribed with
smooth margins. Occasionally they might be insepa-
rable from adjacent mediastinal structures and have
an obtuse angle or interface. A poor margin at the
pulmonary interface usually indicates invasiveness of
the lesion, but the most reliable sign of malignancy is
spread of disease [6,11].
Old films, if available, are often helpful. Obser-
vation of growth rate, duration, and change in nature
of the mass can contribute greatly to diagnostic
accuracy and guide further investigation [7,9].
CT
After an initial assessment using plain chest ra-
diography, the next step in radiologic evaluation is
CT. CT is extremely valuable in the radiographic
evaluation of the mediastinum and might be the only
imaging modality needed in the investigation of a
mediastinal mass [3,9,10,12–14]. CT is commonly
used to define and further characterize a mediastinal
abnormality diagnosed on plain chest radiographs.
Additionally, CT is also often used to evaluate the
mediastinum in patients who have normal chest
radiographs but a clinical reason to suspect medias-
tinal disease [12,14]. CT can depict vascular abnor-
malities and small masses that do not deform the
mediastinal contour on chest radiographs following
intravenous administration of contrast material [9].
The attenuation of a mediastinal lesion, as mea-
sured in Hounsfield units (HU), allows detection of
cysts, fat, soft tissue masses, calcification, and air and
is extremely important in the differential diagnosis of
mediastinal masses [15–17]. Masses can be catego-
rized according to their attenuation [12].
Fat attenuation
Fat attenuation (�70 to �100 HU) masses include
lesions composed primarily of or partially containing
fat or lipid-rich tissues. Abnormalities of fat distribu-
tion can be diffuse, as in mediastinal lipomatosis, or
focal, as in lipoma, thymolipoma, and lipoblastoma.
Most fatty masses are seen in the peridiaphragmatic
areas, and they most often represent herniation of
abdominal fat. As a general rule, the fatty nature of a
mediastinal mass is a strong indication toward benig-
nancy [12,17–19].
Low attenuation
Low attenuation (about �20 to +20 HU) masses
have a density greater than fat but less than muscle.
These masses are usually cystic and include con-
genital benign cysts (bronchogenic, esophageal du-
plication, neurenteric, pericardial, and thymic cysts),
meningocele, mature cystic teratoma, and lymphan-
gioma. Additionally, many tumors can undergo cys-
tic degeneration, especially after radiation therapy
or chemotherapy, and demonstrate mixed solid and
cystic components at CT, including thymoma, lym-
phoma, germ cell tumors, mediastinal carcinoma,
metastases to lymph nodes, and nerve root tumors.
Sometimes, when degeneration is extensive, such
tumors might mimic the appearance of congenital
cysts; however, clinical history and other manifesta-
tions allow correct diagnosis in most cases. Finally, a
mediastinal abscess or pancreatic pseudocyst might
also appear as a fluid-containing mediastinal cystic
mass [12,14,20–22].
High attenuation
High attenuation masses have a density greater
than that of muscle (>60 HU). The high density can
be attributed to calcium (calcified lymph nodes,
partially calcified primary neoplasms including
germ-cell tumors, thymoma, and neurogenic tumors,
calcified goiter, calcified vascular lesions) or to the
presence of fresh blood in a mediastinal hematoma
[12,16].
Enhancement
Enhancing masses show a significant increase in
attenuation following the injection of contrast. These
lesions are highly vascular and include substernal
thyroid, parathyroid glands, carcinoid tumor, para-
ganglioma, Castleman’s disease, lymphangioma, and
hemangioma [12,23–26].
In recent years the advent of spiral (helical) CT
has fundamentally revised the approach to scanning
the mediastinum [12]. Spiral CT data sets coupled
with a real-time volume-rendering technique allow
creation of accurate three-dimensional images, which,
although they are not required for diagnosis, can

D. Shaham et al / Thorac Surg Clin 14 (2004) 25–42 27
aid radiologists and referring clinicians by dem-
onstrating anatomic relationships and the extent of
disease. Volume-rendered images can be helpful in
assessing chest wall extension and collateral vessels
caused by obstruction of the superior vena cava [27].
Spiral CT also allows two-dimensional imaging in
various planes, including coronal, sagittal, and vari-
ous angled planes.
MRI
MRI is used less frequently compared with CT
in the evaluation of mediastinal masses, mainly
because of its lesser availability and higher cost
[3,10,28]; however, MRI has a capacity for multi-
planar imaging and the ability to image vessels, and it
can provide better tissue characterization than CT.
Additionally, MRI is excellent in the evaluation of
regions of complex anatomy such as the thoracic inlet,
the perihilar, paracardiac, and peridiaphragmatic
regions, and for the assessment of posterior mediasti-
nal or paravertebral masses [6,12,29]. MRI has com-
pletely replaced myelography for the evaluation of
potential spinal involvement of posterior neurogenic
tumors [3].
MRI is the primary imaging modality for investi-
gating mediastinal abnormalities that are suspected to
be vascular. Additionally, the difference in signal
between flowing blood and stationary tissues can be
used to demonstrate invasion or narrowing of the
large arteries and veins of the mediastinum. In se-
lected cases magnetic resonance angiography can be
used to demonstrate vascular disorders and distortion,
displacement, or stenosis of vessels by mediastinal
masses [6,12,30,31]. Conventional angiography and
venography, previously performed routinely in the
preoperative assessment of invasive primary medias-
tinal tumors, are now only occasionally used [7].
Additional indications for MRI include the diagnosis
of cystic lesions not of cystic attenuation on CT scans
(ie, identification of fluid with high protein content)
[9,29] and the differential diagnosis between residual
tumor and fibrous tissue in a patient who has lym-
phoma or carcinoma that has been treated [6,9,12,29].
Ultrasonography
Ultrasonography (US) is not commonly used in
the evaluation of mediastinal lesions, but it has been
reported as a useful alternative to more costly tech-
niques in the assessment of mediastinal masses in
selected cases, especially in children [3,9,10,32].
Transesophageal US has been introduced recently
to demonstrate mediastinal lesions adjacent to the
esophagus, particularly subcarinal lymph nodes and
cysts [33,34].
This method can determine whether or not a
lesion is cystic and demonstrate its relationship to
adjacent structures. Transesophageal US appears to
be the best method to verify if an esophageal impres-
sion is intramural or extrinsic to the esophageal wall,
thus giving additional information about the origin of
a mediastinal cyst [34].
Radionuclide imaging
Radionuclide imaging can be helpful in the differ-
ential diagnosis of certain mediastinal lesions. Iodine
scanning using iodine-123 or iodine-131 can demon-
strate functioning thyroid tissue while scanning with
technetium-99m (Tc-99) sestamibi can detect para-
thyroid tissue [21,35].
Preoperative differentiation between thymoma
and thyroid hyperplasia or between recurrent tumor
and scar tissue can be facilitated by somatostatin
receptor scintigraphy with indium-111-octreotide.
Additionally, thallium-201 scintigraphy has been
reported to enable distinction between normal thy-
mus, lymphoid follicular hyperplasia, and thymoma
in patients who have myasthenia gravis [35–38].
Metaiodobenzylguanidine (a precursor of epi-
nephrine) scans detect pheochromocytomas and neu-
roblastomas, and Tc-99 pertechnate scans can help
identify gastric mucosa in suspected neuroenteric
cysts [3,6].
Radionuclide scintigraphy has met with variable
success in the assessment of malignant lymphomas
over the past 30 years. The appearance of the anterior
mediastinum after treatment is quite variable, and
neither CT nor MRI has proven to be reliable in
excluding the presence of active disease in certain
cases. Gallium-67 citrate and thallium-201 scintigra-
phy have been reported recently as being highly
sensitive and specific in the detection of residual or
recurrent disease [39,40].
Finally, the role of fluorodeoxyglucose (FDG)
positron emission tomography (PET) in the assess-
ment of the extent of malignant mediastinal tumors
and its utility for initial staging and for predicting
prognosis are under investigation [6,38,41–43], and
initial results seem to be promising [38]. Recently,
combined PET-CT scanners have been introduced
that might further facilitate the diagnosis and fol-
low-up of mediastinal masses.
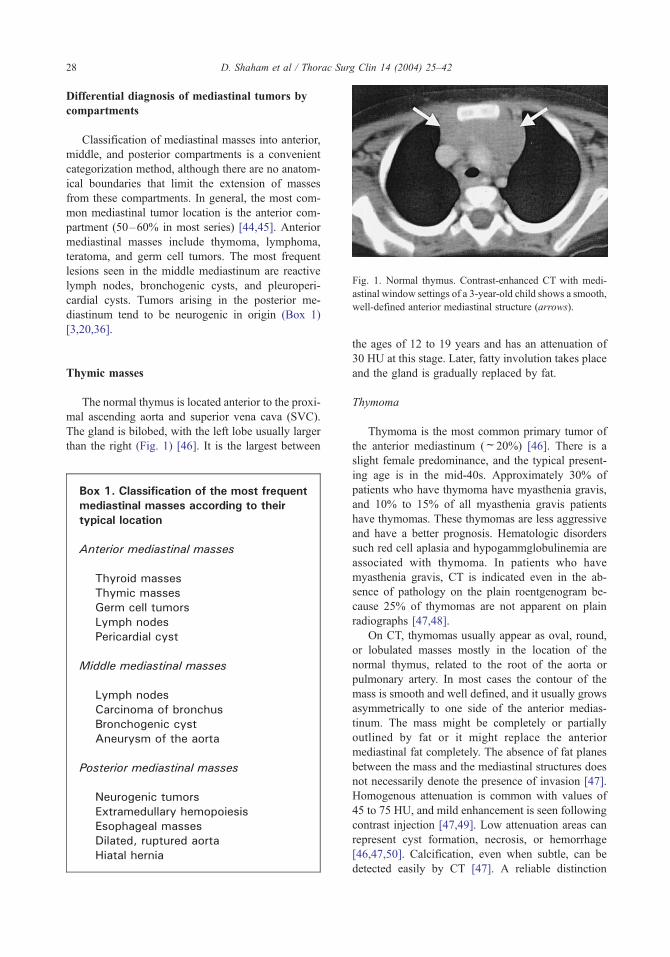
Fig. 1. Normal thymus. Contrast-enhanced CT with medi-
astinal window settings of a 3-year-old child shows a smooth,
well-defined anterior mediastinal structure (arrows).
D. Shaham et al / Thorac Surg Clin 14 (2004) 25–4228
Differential diagnosis of mediastinal tumors by
compartments
Classification of mediastinal masses into anterior,
middle, and posterior compartments is a convenient
categorization method, although there are no anatom-
ical boundaries that limit the extension of masses
from these compartments. In general, the most com-
mon mediastinal tumor location is the anterior com-
partment (50–60% in most series) [44,45]. Anterior
mediastinal masses include thymoma, lymphoma,
teratoma, and germ cell tumors. The most frequent
lesions seen in the middle mediastinum are reactive
lymph nodes, bronchogenic cysts, and pleuroperi-
cardial cysts. Tumors arising in the posterior me-
diastinum tend to be neurogenic in origin (Box 1)
[3,20,36].
Thymic masses
The normal thymus is located anterior to the proxi-
mal ascending aorta and superior vena cava (SVC).
The gland is bilobed, with the left lobe usually larger
than the right (Fig. 1) [46]. It is the largest between
Box 1. Classification of the most frequentmediastinal masses according to theirtypical location
Anterior mediastinal masses
Thyroid massesThymic massesGerm cell tumorsLymph nodesPericardial cyst
Middle mediastinal masses
Lymph nodesCarcinoma of bronchusBronchogenic cystAneurysm of the aorta
Posterior mediastinal masses
Neurogenic tumorsExtramedullary hemopoiesisEsophageal massesDilated, ruptured aortaHiatal hernia
the ages of 12 to 19 years and has an attenuation of
30 HU at this stage. Later, fatty involution takes place
and the gland is gradually replaced by fat.
Thymoma
Thymoma is the most common primary tumor of
the anterior mediastinum (f20%) [46]. There is a
slight female predominance, and the typical present-
ing age is in the mid-40s. Approximately 30% of
patients who have thymoma have myasthenia gravis,
and 10% to 15% of all myasthenia gravis patients
have thymomas. These thymomas are less aggressive
and have a better prognosis. Hematologic disorders
such red cell aplasia and hypogammglobulinemia are
associated with thymoma. In patients who have
myasthenia gravis, CT is indicated even in the ab-
sence of pathology on the plain roentgenogram be-
cause 25% of thymomas are not apparent on plain
radiographs [47,48].
On CT, thymomas usually appear as oval, round,
or lobulated masses mostly in the location of the
normal thymus, related to the root of the aorta or
pulmonary artery. In most cases the contour of the
mass is smooth and well defined, and it usually grows
asymmetrically to one side of the anterior medias-
tinum. The mass might be completely or partially
outlined by fat or it might replace the anterior
mediastinal fat completely. The absence of fat planes
between the mass and the mediastinal structures does
not necessarily denote the presence of invasion [47].
Homogenous attenuation is common with values of
45 to 75 HU, and mild enhancement is seen following
contrast injection [47,49]. Low attenuation areas can
represent cyst formation, necrosis, or hemorrhage
[46,47,50]. Calcification, even when subtle, can be
detected easily by CT [47]. A reliable distinction

D. Shaham et al / Thorac Surg Clin 14 (2004) 25–42 29
between benign and malignant thymoma based on
CT characteristics is often impossible. Nevertheless,
some CT features are considered to be suspicious of
tumor invasion, including heterogeneous mass atten-
uation, complete obliteration of fat planes, pericardial
thickening, encasement of mediastinal vessels, irregu-
lar interface with the adjacent lung, and focal or
diffuse pleural thickening (Fig. 2) [47,51]. Extension
of invasive thymomas into the posterior mediastinum,
retrocrural space, and retroperitoneum has been de-
scribed [51,52].
Treatment consists of surgical excision. Maintain-
ing clear surgical margins is of paramount importance
because even noninvasive thymomas can recur if not
excised completely.
Lymphoma
Mediastinal lymphadenopathy can be a manifesta-
tion of Hodgkin’s disease (HD), non-Hodgkin’s lym-
phoma (NHL), infection, metastases, or sarcoidosis
(Fig. 3) [2]. Lymphoma accounts for 20% of anterior
mediastinal abnormalities in adults and 50% in chil-
dren. Patients might experience chest pain, dyspnea,
dysphagia, shoulder pain, congestive heart failure,
hypotension, and SVC syndrome. HD involves the
anterior mediastinum or paratracheal region in 90% to
100% of patients. HD typically spreads in contiguous
lymph node groups then spreads to the anterior
mediastinal compartment [46,53]. Additional thoracic
manifestations include pleural or pericardial effusion,
sternal erosion, and chest wall erosion. Pulmonary
involvement occurs in up to 11% of patients [54]. Low
attenuation areas associated with necrosis are seen in
Fig. 2. Invasive thymoma. (a) Contrast-enhanced CT with mediasti
mass with solid (short, white arrow) and fluid (black arrow) atten
hemithorax. (b) Section at the level of the heart demonstrates invas
the rib cage (long, thin arrow) and muscle infiltration (thick arro
arrow). The patient had previously undergone thoracotomy for res
20% to 50% of newly diagnosed cases of HD. The
presence of necrotic nodes has no prognostic value
[55]. NHL in the chest characteristically involves the
middle mediastinum. Extrathoracic disease is also
present in 90% of patients. Adenopathy in the cardio-
phrenic angle is typical for NHL and an unusual site
for HD [56].
Lymphoma is treated nonsurgically by chemother-
apy and radiotherapy. Calcification can be seen in HD
after treatment.
Thyroid masses
Substernal thyroid abnormality is defined as the
presence of thyroid tissue below the thoracic inlet.
Goiter
Substernal goiter represents 10% of mediastinal
masses. Most thyroid tumors (75–80%) arise from a
lower pole or the isthmus and extend into the anterior
mediastinum. The remaining 20% to 25% arise from
the posterior aspect of each lobe and involve the
posterior mediastinum.
Characteristic imaging features include a well-
defined mass with a spherical or lobulated border
continuous with the thyroid gland in the neck [50].
Thyroid tissue has high density before contrast injec-
tion (>100 HU) and undergoes intense immediate and
prolonged enhancement after contrast injection. At-
tenuation of intrathoracic goiter is usually higher than
muscle but less than that of the thyroid gland itself.
Low-density areas representing cysts or hemorrhage
are identified easily on postcontrast scans because
they do not enhance, contrary to normal thyroid tissue.
nal window settings demonstrates an extensive heterogenous
uation occupying the left and the right (long, white arrow)
ion into the left anterior chest wall, including destruction of
w). Also note invasion of the left pericardium (short, thin
ection of an invasive thymoma; this is a recurrent tumor.
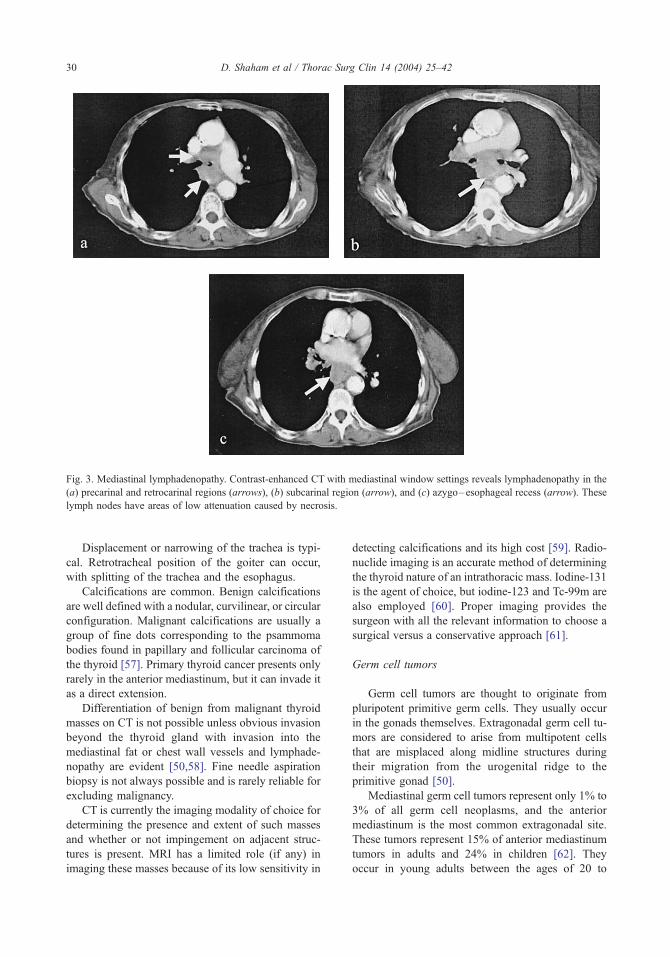
Fig. 3. Mediastinal lymphadenopathy. Contrast-enhanced CT with mediastinal window settings reveals lymphadenopathy in the
(a) precarinal and retrocarinal regions (arrows), (b) subcarinal region (arrow), and (c) azygo–esophageal recess (arrow). These
lymph nodes have areas of low attenuation caused by necrosis.
D. Shaham et al / Thorac Surg Clin 14 (2004) 25–4230
Displacement or narrowing of the trachea is typi-
cal. Retrotracheal position of the goiter can occur,
with splitting of the trachea and the esophagus.
Calcifications are common. Benign calcifications
are well defined with a nodular, curvilinear, or circular
configuration. Malignant calcifications are usually a
group of fine dots corresponding to the psammoma
bodies found in papillary and follicular carcinoma of
the thyroid [57]. Primary thyroid cancer presents only
rarely in the anterior mediastinum, but it can invade it
as a direct extension.
Differentiation of benign from malignant thyroid
masses on CT is not possible unless obvious invasion
beyond the thyroid gland with invasion into the
mediastinal fat or chest wall vessels and lymphade-
nopathy are evident [50,58]. Fine needle aspiration
biopsy is not always possible and is rarely reliable for
excluding malignancy.
CT is currently the imaging modality of choice for
determining the presence and extent of such masses
and whether or not impingement on adjacent struc-
tures is present. MRI has a limited role (if any) in
imaging these masses because of its low sensitivity in
detecting calcifications and its high cost [59]. Radio-
nuclide imaging is an accurate method of determining
the thyroid nature of an intrathoracic mass. Iodine-131
is the agent of choice, but iodine-123 and Tc-99m are
also employed [60]. Proper imaging provides the
surgeon with all the relevant information to choose a
surgical versus a conservative approach [61].
Germ cell tumors
Germ cell tumors are thought to originate from
pluripotent primitive germ cells. They usually occur
in the gonads themselves. Extragonadal germ cell tu-
mors are considered to arise from multipotent cells
that are misplaced along midline structures during
their migration from the urogenital ridge to the
primitive gonad [50].
Mediastinal germ cell tumors represent only 1% to
3% of all germ cell neoplasms, and the anterior
mediastinum is the most common extragonadal site.
These tumors represent 15% of anterior mediastinum
tumors in adults and 24% in children [62]. They
occur in young adults between the ages of 20 to

Fig. 4. Teratoma. Contrast-enhanced CT with mediastinal
window settings reveals a well-defined, encapsulated (dotted
arrow points to capsule) anterior mediastinal mass with
heterogeneous density consisting of fluid (thick arrow) and
fat (thin arrow).
D. Shaham et al / Thorac Surg Clin 14 (2004) 25–42 31
40 years. Women tend to develop benign tumors,
whereas men are prone to developing the malignant
germ cell tumors (Fig. 4) [46,63].
Neurogenic tumors
Most neurogenic tumors arise in the paraspinal
region, originating in an intercostal or sympathetic
nerve. Tumors of neural tissue origin represent 20%
of all primary mediastinal tumors in adults and 35%
in children [50].
Peripheral nerve tumors
The majority of peripheral nerve tumors arise
from an intercostal nerve. Histologic classification
includes neurilemoma (schwannoma), neurofibroma
(plexiform and nonplexiform types), and neurogenic
sarcoma (malignant schwannoma; Fig. 5).
Most peripheral nerve tumors are benign, and com-
plete surgical excision is associated with excellent
prognosis. When malignant, these tumors are aggres-
sive and commonly present with metastases, mainly to
the lungs [64–66].
Sympathetic ganglia tumors
Tumors of sympathetic ganglia the include gan-
glioneuroma, ganglioneuroblastoma, and neuroblas-
toma, a histologic continuum from differentiated
benign tissue to frank malignancy. Ganglioneu-
roma is a benign tumor occurring in children and
young adults [65]. Ganglioneuroblastoma includes
varying degrees of malignancy and occurs in children
younger than 10 years of age. Neuroblastoma is a
highly malignant tumor occurring in children younger
than 5 years of age, and in this age group a posterior
mediastinal mass is considered to be a neuroblastoma
until proven otherwise [50]. Vanillymendelic acid, ho-
movanillymendelic acid, and cystathionine are found
to be elevated in 90% of patients who have neu-
roblastomas [65]. Radiographically, they present as
elongated, elliptical masses extending over three to
five vertebral bodies. The elongated tapering config-
uration of sympathetic ganglia tumors help distin-
guish them from other neurogenic tumors. On CT
scans they appear well margined with homogeneous
or heterogeneous attenuation. Calcifications are dem-
onstrated in 25% of patients. Erosion of the nearby
vertebral bodies or ribs is seen more frequently in
malignant tumors [67,68]. Neuroblastomas can also
show invasion of posterior mediastinal structures and
a tendency to cross the midline.
Ganglioneuromas are benign and slow-growing,
and surgical excision offers a cure. Neurobalstomas
are highly aggressive, presenting as metastatic dis-
ease to regional lymph nodes, skeleton, and liver in
some patients, in whom 5-year survival does not
exceed 30%. The prognosis for ganglioneuroblas-
toma varies and relates to the patient’s age (younger
patients show a better outcome), stage, and histologic
tumor type [50].
Mediastinal cysts
Cystic masses of the mediastinum are well-de-
fined, round, epithelium-lined masses that contain
fluid. Mediastinal cysts represent 15% to 20% of
mediastinal masses [21].
Bronchogenic cyst
Bronchogenic cyst is a congenital abnormality
caused by ventral budding of the tracheobronchial
tree during embryogenesis (Figs. 6). Pseudostrati-
fied columnar respiratory epithelium lines these cysts,
and cartilage, smooth muscle, and mucous glands are
evident in the walls. The content of these cysts is
serous fluid or a mixture of mucus and protein. They
occur mainly near the carina but can also be found in
the middle or posterior mediastinum. Bronchogenic
cysts can also be found within the lung parenchyma,
pleura, or diaphragm [21]. Other congenital abnor-
malities such as lobar emphysema, pulmonary seques-
tration, or a pedicle attaching the cyst to adjacent
structures can also be seen. Most patients are asymp-
tomatic, but compression of adjacent structures can
cause symptoms such as chest pain, cough, dysp-
nea, fever, and purulent sputum [20,21]. CT scans
demonstrate a round mass with an imperceptible wall.
Attenuation values of the cyst content vary from
clear fluid to soft tissue attenuation values resulting

Fig. 5. Malignant peripheral nerve sheath tumor. (a) Posterior–anterior chest radiograph demonstrates a spherical mass arising
from the mediastinum on the left (arrows). (b) Lateral chest radiograph confirms that the mass is posterior (arrows). (c) Non-
contrast-enhanced CT with mediastinal window settings shows a large, round mass (thick arrows) in the left paraspinal region
with scoliosis and enlargement of the neural foramen on this side (thin arrow). (d) Coronal T1-weighted MRI. A large mass
isointense to muscle is noted in the left paraspinal region abutting the vertebral bodies. (e) Coronal T1-weighted MRI follow-
ing gadolinium administration. The aforementioned mass demonstrates heterogeneous enhancement. Scalloping of the left
lateral aspects of the midthoracic vertebrae is also seen. Scoliosis curving toward the left side is evident. (Courtesy of Paul
Cronin, MD, University of Michigan, Ann Arbor, MI.)
D. Shaham et al / Thorac Surg Clin 14 (2004) 25–4232

Fig. 5 (continued ).
Fig. 7. Neuroenteric cyst. Contrast-enhanced CT with medi-
astinal window settings shows a posterior mediastinal mass
with viscous content measuring 65 HU abutting the de-
scending aorta and esophagus (arrows).
D. Shaham et al / Thorac Surg Clin 14 (2004) 25–42 33
from a high content of protein debris or hemorrhage.
Cysts containing calcifications have also been de-
scribed [69].
Surgical excision is indicated in symptomatic
patients. Young patients are also advised to remove
these cysts because of the low surgical risk and the
possibility of complications such as infection, hem-
orrhage, and neoplasia.
Gastroenteric (neuroenteric) cyst
Esophageal duplication cysts are uncommon. The
majority occur within the wall of the esophagus or
Fig. 6. Bronchogenic cyst. Contrast-enhanced CT with
mediastinal window settings shows a well-defined poste-
rior mediastinal mass with clear fluid content and an im-
perceptible wall (arrows). The mass is located adjacent to
the trachea.
adjacent to it (see Fig. 7), and they are usually lined
entirely or partially by gastric or small intestine
mucosa. The term neuroenteric cyst designates the
association with spinal column abnormalities [70].
The presence of ectopic gastric mucosa (50% of
patients) can cause hemorrhage, perforation, or in-
fection. On CT it resembles a bronchogenic cyst, the
only clue being the esophageal proximity or a thicker
wall. Patent communication to the gastrointestinal
tract is rare when cysts are connected to the esopha-
gus. Upper gastrointestinal barium studies demon-
strate extrinsic or intramural esophageal compression
[70]. Radionuclide studies with Tc-99 sodium per-
technetate can identify the ectopic gastric mucosa
existing in 50% of patients [71]. Neuroenteric cysts
demonstrate a fibrous connection to the spine or an
intraspinal component [50]. Association with verte-
bral body anomalies is common. The majority of
cysts present in the posterior mediastinum above the
level of the carina [21]. CT and MRI characteristics
are similar to other foregut cysts. MRI optimally
demonstrates the extent and degree of the spinal
involvement [72].
Pericardial cyst
Pericardial (mesothelial) cysts are a result of
aberrations in the formation of coelomic cavities.
The cysts usually contain clear fluid and the walls
are composed of a single layer of mesothelial cells
and connective tissue [21]. The majority of patients
are asymptomatic and discovered incidentally. Peri-
cardial cysts vary in size and shape. Seventy percent

D. Shaham et al / Thorac Surg Clin 14 (2004) 25–4234
of the cysts arise in the right and the remainder in the
left cardiophrenic angle or the superior portion of the
mediastinum [73]. On CT scans they appear as
round–oval cystic masses abutting the pericardium.
The benign nature of these lesions can be ascertained
by echocardiography, CT, and MRI.
Meningocele
Intrathoracic meningocele results from an abnor-
mal herniation of leptomeninges through either an
intervertebral foramen or a vertebral defect. The ma-
jority of meningoceles are diagnosed in adults, and
association with neurofibromatosis is frequent [74].
CT demonstrates a well-circumscribed, paraverte-
bral, low attenuation mass with distension of the
intervertebral foramina and rib anomalies, vertebral
anomalies, or scoliosis. When scoliosis is present, the
lesion occurs on the convex side [74]. MRI depicts
the continuity between the cerebrospinal fluid in the
thecal sac and the meningocele [28]. CT myelogra-
phy following intraspinal injection of contrast can
confirm the diagnosis by demonstrating filling of the
meningocele [72].
Invasion of mediastinal structures
Malignant primary mediastinal tumors remain a
relatively uncommon finding, although their inci-
dence seems to be increasing over the past decades;
however, when a malignant mediastinal tumor is
present, possible invasion of mediastinal structures
has to be determined preoperatively because a deci-
sion to resect the mass along with involved neighbor-
ing structures must be weighed against the morbidity
of such a procedure. In addition, the potential long-
term survival benefit must be considered [7].
In general, absolute contraindications to resection
of mediastinal masses are invasion of the myocar-
dium or the great vessels and invasion of a long
tracheal segment [7]. Overdiagnosis of invasion
should be avoided; direct contact between the tumor
and mediastinal structures and the absence of cleav-
age planes are not strictly reliable criteria for pre-
dicting invasion. Conversely, clear definition of fat
planes surrounding a tumor indicates the absence of
macroscopic invasion of adjacent structures [6,12].
Thymomas, germ-cell tumors, lymphomas, and
neurogenic tumors account for the vast majority of
primary mediastinal tumors in adults. Approximately
30% to 35% of thymomas, 20% of germ-cell tumors,
and 15% of nerve sheath tumors are invasive
[6,12,14]. Radical excision is the standard of care
for invasive thymic tumors and tumors of nerve
sheath origin, whereas chemotherapy is the primary
treatment modality for invasive germ-cell tumors. A
combination of chemotherapy and radiation therapy
is required in most cases of lymphoma [7,13,75–77].
In a recent study focused specifically on patients
who had malignant mediastinal tumors invading
adjacent organs or structures [7], the most commonly
invaded structure of the mediastinum was the peri-
cardium, followed by the pleura, the lung (mainly
invasion of the anterior segments of the upper lobes
or lingula), the phrenic nerve, and the SVC. In cases
of massive invasion of the pulmonary hilum or
extensive subpleural and pulmonary thymoma metas-
tases, a pneumonectomy cannot be avoided. When
clinical SVC syndrome is present and the vein is
invaded extensively by the tumor, total SVC replace-
ment is indicated. Widespread collateral venous cir-
culation or extensive thrombosis of subclavian veins
increases the likelihood of postoperative thrombosis
[7,78].
Invasive thymomas infiltrate adjacent structures
including the SVC, great vessels, airways, lungs, and
chest wall. An irregular interface with the adjacent
lung is suggestive of invasion [47]. There can also be
spread to the pericardium and pleura along pleural
reflections and along the aorta through the diaphragm
into the abdomen and retroperitoneum, usually on one
side of the body only (see Fig. 2) [9,12]. It is therefore
important, when investigating a potentially invasive
thymoma, to include the deep pleural reflections and
the upper abdomen on any imaging examination [6,9].
Rarely, thymoma might appear as predominantly
pleural disease, usually unilateral, with nonspecific
radiographic patterns such as pleural thickening,
pleural masses, or diffuse, nodular, circumferential
pleural thickening that encases the ipsilateral lung.
The latter manifestation mimics malignant mesothe-
lioma or metastatic adenocarcinoma [6,47].
Neural tumors in the posterior mediastinum usu-
ally arise close to the spine and can extend through the
neural exit foramina into the spinal canal. This intra-
dural extension is not necessarily a sign of malig-
nancy, but it requires a combined neurosurgical and
thoracic surgical approach [6,79]. Bone invasion,
when present, is a strong indication of malignancy [9].
When a nerve sheath tumor is localized it is not
possible to distinguish between benign and malig-
nant tumors [6]. Tumors that grow on intercostal
nerves can cause rib erosion. When a sclerotic bor-
der is present, the possibility of malignancy is low.
Conversely, spreading of multiple ribs with erosion
or frank destruction is suggestive of a malignant
lesion [6,9].

D. Shaham et al / Thorac Surg Clin 14 (2004) 25–42 35
Vascular supply of mediastinal tumors
The vascular supply of mediastinal tumors depends
on their anatomic location, extent, and histopathologic
features. In general, congenital mediastinal cysts and
the majority of neurogenic tumors are hypovascular
lesions, most commonly supplied by the intercostal
vessels [13,34,45,79,80]. Anterior intercostal arteries
arise from the internal mammary (thoracic) artery and
posterior intercostal arteries arise from the thoracic
Table 1
Definition of 1996 American Joint Committee on Cancer/Union
mediastinal lymph nodes
Number Name L
1 Highest mediastinal nodes A
br
to
2 Upper paratracheal nodes A
m
of
3A
3P
Prevascular and
Retrotracheal nodes
A
an
4 Lower paratracheal nodes O
be
m
ri
lo
en
O
a
ao
br
br
co
5 Subaortic nodes (aortopulmonary window) L
le
of
pl
6 Paraaortic nodes (ascending aorta or phrenic) A
ar
a
7 Subcarinal nodes C
lo
8 Paraesophageal nodes A
le
su
9 Pulmonary ligament nodes W
po
10 Hilar nodes P
pl
in
Lymph node stations 1–9 are N2 nodes and lie with the mediasina
N1 nodes that are distal to the mediastinal pleural reflection and w
aorta [81]. In each intercostal space there are one
posterior and two anterior intercostal veins. The
anterior veins drain into the internal mammary veins,
the superior four posterior veins drain into the bra-
chiocephalic (innominate) veins, and the lower eight
posterior intercostal veins drain into the azygos vein
on the right and the accessory hemiazygos and hemi-
azygos veins on the left [81,82].
Thymomas are supplied by the internal mammary
arteries [44], which are located within the adipose and
Internationale Contre le Cancer classification of regional
ocation
bove a horizontal line at the upper rim of the left
achiocephhalic (innominate) vein where it ascends
the left, crossing in front of the trachea at its midline
bove a horizontal line drawn tangential to the upper
argin of the aortic arch and below the inferior boundry
number 1 nodes
nterior to the aortic arch branches (3A)
d posterior to the trachea (3P)
n the right: to the right of the midline of the trachea
tween a horizontal line drawn tangential to the upper
argin of the aortic arch and a line extending across the
ght main bronchus at the upper margin of the right upper
be bronchus and contained within the mediastinal pleural
velope; azygos nodes are included in this station
n the left: to the left of the midline of the trachea between
horizontal line drawn tangential to the upper margin of the
rtic arch and a line extending across the left main
onchus at the upper margin of the left upper lobe
onchus medial to the ligamentum arteriosum and
ntained within the mediastinal pleural envelope
ateral to the ligamentum arteriosum or the aorta or
ft pulmonary artery and proximal to the the first branch
the left pulmonary artery and within the mediastinal
eural envelope
nterior and lateral to the ascending aorta and the aortic
ch or brachiocephalic or the brachiocephalic artery, beneath
line tangential to the upper margin of the aortic arch
audad to the tracheal carina but not associated with the
wer lobe bronchi or arteries within the lung
djacent to the wall of the esophagus and to the right or
ft of the midline below the tracheal carina, excluding
bcarinal nodes
ithin the pulmonary ligament, including those in the
sterior wall and lower part of the inferior pulmonary vein
roximal to lobar nodes and distal to the mediastinal
eural reflection and the nodes adjacent to the bronchus
termedius on the right
l pleural envelope. Lymph node station 10 is included in the
ithin the visceral pleura.

D. Shaham et al / Thorac Surg Clin 14 (2004) 25–4236
connective tissues bordered anteriorly by the costal
cartilage and intercostal muscles and posteriorly
by the endothoracic fascia and transverse thoracic
muscles [83]. Occasionally the arterial supply of
thymic tumors can be derived from the inferior
thyroid arteries [4]. Venous drainage of the thymic
gland is through a variable number of thin vessels
(veins of Keynes) that drain the thymus from its
posterior surface into the anterior aspect of the left
innominate vein. Frequently, one or more veins might
join together to form a common trunk before opening
into the left innominate vein [4,13,84]. Additionally,
one or two small veins from the upper pole of thymus
end in the inferior thyroid veins [4].
Intrathoracic goiters receive blood supply from
the superior and inferior thyroid arteries. The superior
thyroid arteries arise from the external carotids and
the inferior thyroid arteries arise from the thyrocer-
vical trunks [4,13,84]. Venous drainage is through the
superior, middle, and inferior thyroid veins. The
superior and middle thyroid veins end in the internal
jugular veins, and the inferior thyroid veins end in the
brachiocephalic veins. Sometimes the inferior thyroid
veins might join together to form a common trunk
ending in the left brachiocephalic vein [4,84].
Since the advent of cisplatin-based chemotherapy,
the role of surgery as the primary treatment of germ
cell tumors has been more limited [7,75]. Following
initial chemotherapy, persistent radiographic abnor-
malities accompanied by elevated marker levels in
the serum that continue to rise denote persistent car-
cinoma; these patients should be treated with an
alternative chemotherapy regimen [75]. Resection of
Fig. 8. Mediastinal lymphadenopathy. (a) Noncontrast CT with
paratracheal lymph nodes (dotted arrow, station 4R) and bilateral
lymph nodes are seen on the left (thin arrow, station 6). (b) Non
lymphadenopathy further down in the lower paratracheal region (
axilla (thick arrows).
residual masses after chemotherapy has been advo-
cated in patients whose marker levels have normal-
ized [7,75,85 – 87]. The blood supply of these
residual tumors varies according to their size, precise
anatomic location, histopathology, and the degree of
postchemotherapy necrosis.
Sampling procedures for mediastinal lymph nodes
Lymph nodes are widely distributed throughout
the mediastinum. Two systems that have been in used
for classifying regional lymph node stations for lung
cancer staging were unified in 1996 [88,89]. These
were the American Joint Committee on Cancer
(AJCC) classification, adapted from the work of
Naruke [90], and the classification of the American
Thoracic Society and the North American Lung
Cancer Study Group [91]. The unified classification
was adopted by the AJCC and the Prognostic TNM
Committee of the Union Internationale Contre le
Cancer. The following discussion of lymph node
sampling is according to this unified classification
(Table 1).
Surgical procedures used for mediastinal lymph
node sampling include cervical mediastinoscopy, an-
terior mediastinotomy, and video-assisted thoraco-
scopic surgery (VATS).
Regional lymph nodes accessible by cervical
mediastinoscopy include stations 1, 2, 4, and 7 (an-
terior and superior nodes). When performing anterior
or parasternal mediastinoscopy, lymph node stations
5 and 6 can be sampled. VATS offers a panoramic
mediastinal window settings demonstrates enlarged lower
axillary lymphadenopathy (thick arrows). Small para-aortic
contrast CT with mediastinal window settings demonstrates
thin arrow, station 4R). Lymphadenopathy is noted in both

D. Shaham et al / Thorac Surg Clin 14 (2004) 25–42 37
view of the ipsilateral hemithorax including the
hilum, mediastinum, visceral pleura, and chest wall.
Lymph node stations accessible by VATS in the right
hemithorax include 4R, 9R, and 10R; in the left
hemithorax 5, 6, 9L, and 10L are accessible. Right-
sided thoracoscopy allows sampling of lymph node
stations 3A, 3P, 7 (posterior and inferior nodes), and 8
(Fig. 8) [92].
In studies documenting the size of normal medias-
tinal lymph nodes by CT, 95% of these lymph nodes
were less than 10 mm in diameter [93,94]. The short
axis nodal diameter is used for measuring mediastinal
lymph nodes because it was found to be the best CT
predictor of nodal volume [95]. FDG-PET scanning
adds to the accuracy of detecting lymph node involve-
ment in lung cancer staging and has a particularly high
negative predictive value [96–98].
Postoperative complications
Postoperative mediastinal complications include
mediastinal hemorrhage, mediastinitis, and chylo-
thorax.
Significant hemorrhage can follow thoracic opera-
tions, particularly procedures involving the heart and
great vessels, which require cardiopulmonary bypass.
The clinical presentation is variable and might in-
clude retrosternal pain radiating to the back and neck.
With increased accumulation of blood in the medias-
tinum, signs and symptoms related to compression of
Fig. 9. Postoperative mediastinal hematoma. (a) Contrast-enhanc
rosternal dense fluid collection (short, thick arrow) measuring 50 H
collection anterior to it (long, thick arrow). These fluid collections
small, bilateral pleural effusions. (b) Contrast-enhanced CT with m
in the chest. A dense fluid collection is seen anterior to the ascendin
arrow). Two anterior air bubbles are also seen (thin arrows), cons
mediastinal structures, particularly veins, can occur
and manifest as dyspnea and cyanosis. With further
accumulation of blood, mediastinal tamponade can
develop, presenting with circulatory compromise
[6,99].
Plain chest radiographs might demonstrate widen-
ing of the mediastinal shadow, which can be focal or
general. The blood might also track extrapleurally
over the lung apices and give rise to apical capping
[100]. Severe hemorrhage can rupture into the pleural
cavity. Rapid widening of the mediastinum on serial
films is an important clue to the diagnosis of medias-
tinal hemorrhage. CT can show the characteristic
appearance of blood, the high density related to a
fresh clot, and the relationship of the hematoma to
adjacent mediastinal structures (Fig. 9).
Infection of the mediastinum is a relatively rare,
serious, and potentially fatal condition that currently
occurs most frequently following median sternotomy
for open-heart surgery. Postoperative mediastinitis
usually occurs between 3 days and 3 weeks following
surgery, but delayed manifestations can occur up to
months later. The clinical manifestations of mediasti-
nitis are fever, tachycardia, and chest pain, and when it
occurs postoperatively there might be wound ery-
thema, pain, effusion, and an unstable sternum [99].
The radiologic features of acute mediastinitis
include mediastinal widening and pneumomediasti-
num. On the lateral chest radiograph, an abnormal
soft tissue density, air – fluid levels (representing
abscess formation), and sternal dehiscence might be
seen. Accompanying pleural effusion on one side or
ed CT with mediastinal window settings demonstrates ret-
U. Note the sternotomy site (thin arrow) and a similar fluid
are consistent with postoperative hematomas. Also note the
ediastinal window settings. This slice is slightly lower down
g aorta and the pulmonary trunk, abutting the sternum (thick
istent with postoperative air.

D. Shaham et al / Thorac Surg Clin 14 (2004) 25–4238
bilaterally are common. These findings are recognized
more easily on CT scan. CT can also show associated
findings such as venous thrombosis or pericardial
effusion and contiguous infections such as emphyma,
subphrenic abscess, or cervical soft tissue infection
[6,99].
Distinguishing retrosternal hematomas from reac-
tive granulation tissue or cellulitis might be difficult,
as is differentiating osteomyelitis from postsurgical
changes in the sternum. Substernal fluid collections
and minimal amounts of air are normal for up to
20 days following sternotomy (Fig. 9). Air can be
seen on chest radiographs in the presternal or retro-
sternal soft tissues for up to 50 days following
sternotomy, so only newly appearing air collections
or collections that increase in size can be diagnosed
as gas-forming infections [101].
Mediastinitis should be diagnosed as early as
possible; delays in diagnosing this condition and
initiating treatment result in increased morbidity and
mortality. Treatment options include incision, de-
bridement and drainage of the involved area, the use
of closed irrigation systems, and using a tissue flap
(pectoralis or rectus abdominis muscle or omen-
tum) [99].
Chylothorax can develop 1 to 2 weeks following a
surgical procedure in the region of the aorta, esopha-
gus, or posterior mediastinum. The anatomy of the
thoracic duct is constant only in its variability [102].
The duct originates from the cysterna chili, a globular
structure 3 to 4 cm long and 2 to 3 cm in diameter
that lies adjacent to the vertebral column between
L3 and T10, just to the right of the aorta. Usually a
single thoracic duct enters the chest through the aortic
hiatus at the level of T12 to T10, just to the right of
the aorta. Above the diaphragm the duct lies on the
anterior surface of the vertebral column behind the
esophagus and between the aorta and the azygos vein.
At the level of T5 the duct courses to the left and
ascends behind the aortic arch into the left side of the
posterior mediastinum, where it passes adjacent to
the left side of the esophagus. In the root of the neck,
the thoracic duct passes behind the left carotid sheath
and jugular vein and enters the venous system at the
left jugulo–subclavian junction. There are several
anastomoses between the duct and the azygos, inter-
costals, and lumbar veins. This normal anatomic
description exists in slightly more than half of indi-
viduals. In the remainder there are two or more main
ducts in some part of its course [103].
Injury to the duct has occurred in almost every
known thoracic operation. The duct is most vulne-
rable in the upper part of the left side of the chest,
particularly during procedures that involve mobiliza-
tion of the aortic arch, left subclavian artery, or
esophagus. Because of the course of the duct, injury
below the level of T5 to T6 usually causes a right-
sided chylothorax, whereas injury above this level
results in a left-sided chylothorax [103].
There is usually an interval of 2 to 10 days
between rupture of the thoracic duct and the onset
of a chylous pleural effusion. This delay is caused by
the accumulation of lymph in the posterior mediasti-
num until the mediastinal pleura ruptures [103].
Chylous effusion is typically (but not necessarily)
milky, particularly during starvation, as might occur
following surgery. The diagnosis of chylous effusion
is made by measuring the triglyceride levels of the
effusion; levels above 110 mg/dL are regarded as
positive. Chylothorax should be differentiated from
pseudochylothorax, which is also milky but caused
by high levels of cholesterol or lecitin–globulin com-
plexes in the effusion. This condition characteris-
tically occurs in chronic pleural disease with pleural
thickening and chronic encysted effusion [104].
A chylous effusion on a plain chest radiograph
cannot be distinguished from pleural effusion result-
ing from other causes. It can be large or small,
unilateral or bilateral. On CT, the density of chyle
is indistinguishable from that of other effusions de-
spite the high fat content because it is also protein-
rich; therefore, the density of the effusion is not as
low as would be expected based on the rich fat con-
tent [104].
Conservative therapy for chylothorax includes
thoracostomy tube drainage, correction of fluid losses,
prevention of electrolyte imbalance, and parenteral
nutritional support. Surgical therapy is indicated when
the chylous effusion does not respond to conservative
management and there is no contraindication to sur-
gery. Surgery includes a combination of direct closure
of the thoracic duct–pleural fistula, suturing of the
leaking mediastinal pleura, and supradiaphragmatic
ligation of the duct [103].
Summary
The diagnostic approach to patients who have
mediastinal masses should include thorough preoper-
ative imaging. Once limited to plain radiographic
techniques, the radiologist now has a wide variety
of imaging modalities to aid in the evaluation of the
mediastinum. CT is the imaging modality of choice
for evaluating a suspected mediastinal mass or a
widened mediastinum, and it provides the most useful
information for the diagnosis, treatment, and evalua-
tion of postoperative complications.
D. Shaham et al / Thorac Surg Clin 14 (2004) 25–42 39
References
[1] Armstrong P. Normal chest. In: Armstrong P, Wilson
AG, Dee P, Hansell DM, editors. Imaging of diseases
of the chest. 2nd edition. St. Louis (MO): Mosby;
1995. p. 15–47.
[2] Fraser RS, Pare JAP, Fraser RG, Pare PD. Diseases
of the mediastinum. In: Fraser RS, Pare JAP, Fraser
RG, Pare PD, editors. Synopsis of diseases of the
chest. Philadelphia: WB Saunders; 1994. p. 896–942.
[3] Kohman LJ. Approach to the diagnosis and staging
of mediastinal masses. Chest 1993;103:328S–30S.
[4] Williams PL, Warwick R, Dyson M, et al. Gray’s
anatomy. 37th edition. Edinburgh: Churchill Living-
stone; 1989.
[5] Wychulis AR, Payne WS, Clagett OT, Woolner
LB. Surgical treatment of mediastinal tumors. A
40-year experience. J Thorac Cardiovasc Surg 1971;
62:379–92.
[6] Armstrong P. Mediastinal and hilar disorders. In:
Armstrong P, Wilson AG, Dee P, Hansell DM, edi-
tors. Imaging of diseases of the chest. London:
Mosby; 2000. p. 789–892.
[7] Bacha EA, Chapelier AR, Macchiarini P, Fadel E,
Dartevelle PG. Surgery for invasive primary medias-
tinal tumors. Ann Thorac Surg 1998;66:234–9.
[8] Shaffer K, Pugatch RD. Diseases of the mediastinum.
In: Freundlich IM, Bragg DG, editors. A radiologic
approach to diseases of the chest. Baltimore: Williams
& Wilkins; 1992. p. 171–85.
[9] Templeton PA. Mediastinal lesions. In: Greene R,
Muhm JR, editors. Syllabus: a categorical course in
diagnostic radiology. Chest radiology. Oak Brook, IL:
Radiological Society of North America Inc; 1992.
p. 273–86.
[10] Merten DF. Diagnostic imaging of mediastinal
masses in children. AJR 1992;158:825–32.
[11] Pugatch R, Spirn PW. Mediastinal neoplasms. In:
Taveras JM, Ferrucci JT, editors. Radiology: diagno-
sis—imaging—intervention, Vol 1. Philadelphia: Lip-
pincott; 1995.
[12] Naidich DP, Webb WR, Muller NL, Krinsky GA, Zer-
houni EA, Siegelman SS. Mediastinum. In: Naidich
DP, Webb WR, Muller NL, Krinsky GA, Zerhouni
EA, Siegelman SS, editors. Computed tomography
and magnetic resonance of the thorax. Philadelphia:
Lippincott Williams & Wilkins; 1999. p. 37–159.
[13] Roviaro G, Rebuffat C, Varoli F, Vergani C, Macio-
cco M, Scalambra SM. Videothroacoscopic excision
of mediastinal masses: indications and technique.
Ann Thorac Surg 1994;58:1679–84.
[14] Tecce PM, Fishman EK, Kuhlman JE. CT evaluation
of the anterior mediastinum: spectrum of disease.
Radiographics 1994;14:973–90.
[15] Dedrick CG. Non-neoplastic disorders of the medias-
tinum. In: Taveras JM, Ferrucci JT, editors. Radi-
ology: diagnosis—imaging—intervention, Vol 1.
Philadelphia: Lippincott; 1995.
[16] Glazer HS, Molina PL, Siegel MJ, Sagel SS. Pictorial
essay: high-attenuation mediastinal masses on unen-
hanced CT. AJR 1991;156:45–50.
[17] Glazer HS, Wick MR, Anderson DJ, Semenkovich
JW, Molina PL, Siegel MJ, et al. CT of fatty thoracic
masses. AJR 1992;159:1181–7.
[18] Gaerte SC, Meyer CA, Winer-Muram HT, Tarver RD,
Conces Jr DJ. Fat-containing lesions of the chest.
Radiographics 2002;22:S61–78.
[19] Mullins ME, Stein J, Saini SS, Mueller PR. Preva-
lence of incidental Bochdalek’s hernia in a large adult
population. AJR 2001;177:363–6.
[20] McAdams HP, Kirejczyk WM, Rosado-de-Christen-
son ML, Matsumoto S. Bronchogenic cyst: imaging
features with clinical and histopathologic correlation.
Radiology 2000;217:441–6.
[21] Jeung MY, Gasser B, Gangi A, Bogorin A, Charneau
D, Wihlm JM, et al. Imaging of cystic masses of the
mediastinum. Radiographics 2002;22:S79–93.
[22] Kawashima A, Fishman EK, Kuhlman JE, Nixon MS.
CT of the posterior mediastinal masses. Radio-
graphics 1991;11:1045–67.
[23] Spizarny DL, Rebner M, Gross BH. CT of enhancing
mediastinal masses. J Comput Assist Tomogr 1987;
11:990–3.
[24] Doppman JL, Skarulis MC, Chen CC, et al. Parathy-
roid adenomas in the aortopulmonary window. Radi-
ology 1996;201:456–62.
[25] McAdams HP, Rosado-de-Christenson ML, Moran
CA. Mediastinal hemangioma: radiographic and CT
features in 4 patients. Radiology 1994;193:399–402.
[26] Kirsch CFE, Webb EM, Webb WR. Multicentric Cas-
tleman’s disease and POEMS syndrome: CT findings.
J Thorac Imaging 1997;12:75–7.
[27] Johnson PT, Fishman EK, Duckwall JR, Calhoun PS,
Heath DG. Interactive three-dimensional volume ren-
dering of spiral CT data: current applications in the
thorax. Radiographics 1998;18:165–87.
[28] Webb WR, Sostman HD. MR imaging of thoracic
disease: clinical uses. Radiology 1992;182:621–30.
[29] Zerhouni EA. MR imaging in chest disease: present
status and future applications. In: Green R, Muhm JR,
editors. Syllabus: a categorical course in diagnostic
radiology. Chest radiology. Oak Brook, IL: Radiologi-
cal Society of North America Inc; 1992. p. 25–41.
[30] Ho VB, Prince HR. Thoracic MR aortography: imag-
ing techniques and strategies. Radiographics 1998;18:
287–309.
[31] Leung DA, Debatin JF. Three-dimensional contrast-
enhanced magnetic resonance angiography of the tho-
racic vasculature. Eur Radiol 1997;7:981–9.
[32] Wernecke K, Vassallo P, Potte R, Lukener HG, Peters
PE. Mediastinal tumors: sensitivity of detection with
sonography compared with CT and radiography.
Radiology 1990;175:137–43.
[33] Gress FG, Savides TJ, Sandler A, Kesler K, Conces
D, Cummings O, et al. Endoscopic ultrasonography,
fine-needle aspiration biopsy guided by endoscopic
ultrasonography, and computed tomography in the
preoperative staging of non–small-cell lung cancer:

D. Shaham et al / Thorac Surg Clin 14 (2004) 25–4240
a comparative study. Ann Intern Med 1997;127:
604–12.
[34] Cioffi U, Bonavina L, De Simone M, Santambrogio
L, Pavoni G, Testori A, et al. Presentation and surgical
management of bronchogenic and esophageal dupli-
cation cysts in adults. Chest 1998;113:1492–6.
[35] Nguyen BD. Parathyroid imaging with Tc-99m sesta-
mibi planar and SPECT scintigraphy. Radiographics
1999;19:601–14.
[36] Santana L, Givica A, Camacho C. Thymoma. Radio-
graphics 2002;22:S95–102.
[37] Lastoria S, Vergara E, Palmieri G, Acampa W, Var-
rella P, Caraco C, et al. In vivo detection of malignant
thymic masses by indium-111-DTPA-D-Phe1-octreo-
tide scintigraphy. J Nucl Med 1998;39:634–9.
[38] Higuchi T, Taki J, Kinuya S, Yamada M, Kawasuji M,
Matsui O, et al. Thymic lesions in patients with my-
asthenia gravis: characterization with thallium-201
scintigraphy. Radiology 2001;221:201–6.
[39] Waxman AD, Eller D, Ashook G, Ramanna L, Brach-
man M, Heifetz L, et al. Comparison of gallium-
67-citrate and thallium-201 scintigraphy in peripheral
and intrathoracic lymphoma. J Nucl Med 1996;37:
46–50.
[40] Fletcher BD, Xiong X, Kauffman WM, Kaste SC,
Hudson MM. Hodgkin disease: use of T1-201 to
monitor mediastinal involvement after treatment.
Radiology 1998;209:471–5.
[41] Kubota K, Yamada S, Kondo T, Yamada K, Fukuda
H, Fujiwara T, et al. PET imaging of primary medi-
astinal tumors. Br J Cancer 1996;73:882–6.
[42] Sadato N, Tsuchida T, Nakaumra S, Waki A, Uematsu
H, Takahashi N, et al. Non-invasive estimation of the
net influx constant using the standardized uptake
value for quantification of FDG uptake of tumors.
Eur J Nucl Med 1998;25:559–64.
[43] Sasaki M, Kuwabara Y, Ichiya Y, Akashi Y, Yoshida T,
Nakagawa M, et al. Differential diagnosis of thymic
tumors using a combination of 11c-methionine PET
and FDG PET. J Nucl Med 1999;40:1595–601.
[44] Landreneau RJ, Dowling RD, Castillo WM, Ferson
PF. Thoracoscopic resection of an anterior mediasti-
nal tumor. Ann Thorac Surg 1992;54:142–4.
[45] Sugarbaker DJ. Thoracoscopy in the management of
anterior mediastinal masses. Ann Thorac Surg 1993;
56:653–6.
[46] Tecc PM, Fishman EK, Kuhlman JE. CT evaluation
of the anterior mediastinum: spectrum of disease.
Radiographics 1994;14(5):973–90.
[47] Rosado-de-Christenson ML, Galobardes J, Moran
CA. From the archives of the AFIP. Thymoma: ra-
diologic pathologic correlation. Radiograpgics 1992;
12:151–68.
[48] Morgenthaler TI, Brown LR, Clby TV. Thymoma.
Mayo Clin Proc 1993;68:110–1123.
[49] Santana L, Givica A, Camacho C. Best cases from the
AFIP thymoma. Radiograhpics 2002;22:S95–102.
[50] Fraser RS, Muller N, Colman N, Pare PD. Mediastinal
disease. In: Fraser RS, Muller N, Colman N, Pare PD,
editors. Fraser and Pare’s diagnosis of diseases of the
chest. Philadelphia: Saunders; 1999. p. 2875–974.
[51] Zerhouni EA, Scott WW, Baker RR. Invasive thymo-
mas: diagnosis and evaluation by computed tomogra-
phy. J Coput Assist Tomogr 1982;6:92.
[52] Scatarige JC, Fishman EK, Zerhouni EA. Transdia-
phragmatic extension of invasive thymoma. AJR
1985;144:31.
[53] Diehl L, Hopper K, Giguere J, Garnger E, Lesar M.
The pattern of intrathoracic Hodgkin’s disease as-
sessed by computed tomography. J Clin Oncol 1991;
9:438–43.
[54] Guermazi A, Brice P, de Kerviler E, Ferme C,
Hennequin C, Meignin V, et al. Extranodal Hodgkin
disease: spectrum of disease. Radiographics 2001;21:
161–79.
[55] Salonen O, Kivisaari L, Somer K. Differential diag-
nosis of anterior upper mediastinal expansions by
contrast-enhanced computed tomography. Comut
Radiol 1984;8:217–22.
[56] Filly R, Blank N, Castellino R. Radiographic distri-
bution of intrathoracic disease in previously untreated
patients with Hodgkin’s disease and non Hodgkin’s
lymphoma. Radiology 1976;120:277–81.
[57] Kowolafe F. Radiological patterns and significance
of thyroid calcifications. Clin Radiol 1981;32:571–5.
[58] Takashima S, Morimoto S, Ikezoe J. CT evaluation
of anaplastic thyroid carcinoma. AJR 1990;154:1079.
[59] Jennings A. Evaluation of substernal goiters using
computed tomography and MR imaging. Endocrinol
Metab Clin N Am 2001;30(2):401–14.
[60] Park HM, Traver RD, Siddiqui AR. Efficacy of thy-
roid scintigraphy in the diagnosis of intrathoracic goi-
ter. AJR 1987;148:527.
[61] Sanders LE, Rossi RL, Shahian DM, Willamson WA.
Medaistinal goiters. The need for an aggressive ap-
proach. Arch Surg 1992;127(5):609–13.
[62] Rosado-de-Christenson ML, Tempelton PA, Moran
CA. From the archives of the AFIP—mediastinal
germ cell tumors: radiologic pathologic correlation.
Radiogarphics 1992;12:1013–30.
[63] Nichols CR. Mediastinal germ cell tumors: clini-
cal features and biologic correlates. Chest 1991;99:
472–9.
[64] Wood DE. Mediastinal germ cell tumors. Semin
Thorac Cardiovasc Surg 2000;12(4):278–89.
[65] Gale AW, Jelihovsky T, Grant AF. Neurogenic tu-
mors of the mediastinum. Ann Thorac Surg 1974;
17:434.
[66] Kawashima A, Fishman EK, Kuhlman J, Nixon M.
CT of posterior mediastinal masses. Radiographics
1991;11:1045–67.
[67] Bourgouin PM, Shepard JO, Moore EH. Plexiform
neurofibromatosis of the mediastinum: CT appear-
ance. AJR 1992;159:279.
[68] Reed JC, Kagan-Hallett K, Feigin DS. Neural tumors
of the thorax: subject review from the AFIP. Radiol-
ogy 1978;126:9.
[69] Mendelson DS, Rose SJ, Efermidis SC, Kirschner

D. Shaham et al / Thorac Surg Clin 14 (2004) 25–42 41
PA, Cohen BA. Bronchogenic cysts with high CT
numbers. AJR 1983;140:463–5.
[70] Azzie G, Beasley S. Diagnosis and treatment of fore-
gut duplications. Semin Pediatr Surg 2003;12(1):
46–54.
[71] Salo JA, Ala-Kulju K. Congenital esophageal cyst in
adults. Ann Thorac Surg 1987;44:135–8.
[72] Erasmus JJ, Mcadams HP, Donnelly LF, Spritzer CE.
MR imaging of mediastinal masses. Magn Reson
Imaging Clin N Am 2000;8(1):59–89.
[73] Feigin DS, Fenoglio JJ, Mcalsiter HA, Medawell JE.
Pericardial cysts: a radiographic pathologic correla-
tion and review. Radiology 1977;25:15–20.
[74] Aughenbaugh GL. Thoracic manifestations of neu-
rocutaneous diseases. Radiol Clin N Am 1984;22:
741–56.
[75] Kantoff P. Surgical and medical management of germ
cell tumors of the chest. Chest 1993;103:331S–3S.
[76] Costello P. Chest lymphoma. In: Greene R, Muhm
JR, editors. Syllabus: a categorical course in diag-
nostic radiology: Chest radiology. Oak Brook, IL:
Radiological Society of North America Inc; 1992.
p. 245–58.
[77] Gawrychowski J, Rokicki M, Gabriel A. Thymoma
the usefulness of some prognostic factors for diagno-
sis and surgical treatment. Eur J Surg Oncol 2000;26:
203–8.
[78] Dartavelle PG, Chapelier AR, Pastorino U, Corbi P,
Lenot B, Cerrina J, et al. Long-term follow-up after
prosthetic replacement of the superior vena cava com-
bined with resection of mediastinal–pulmonary ma-
lignant tumors. J Thorac Cardiovasc Surg 1991;102:
259–65.
[79] Naunheim KS. Video throacoscopy for masses of the
posterior mediastinum. Ann Thorac Surg 1993;56:
657–8.
[80] Demmy TL, Krasna MJ, Detterbeck FC, Kline GG,
Kohman LJ, DeCamp Jr MM, et al. Multicenter
VATS experience with mediastinal tumors. Ann
Thorac Surg 1998;66:187–92.
[81] Sobotta J. In: Ferner H, Staubesant J, editors. Atlas
der anatomie des menschen [atlas of human anato-
my], Vol. 2. Munich: Uran-Schwarzenberg; 1972.
p. 27–39 [in German].
[82] Lawler LP, Corl FM, Fishman EK. Multi-detector row
and volume-rendered CT of the normal and accessory
flow pathways of the thoracic systemic and pulmo-
nary veins. Radiographics 2002;22:S45–60.
[83] Kuzo RS, Ben-Ami TE, Yousefzadeh DK, Ramirez
JG. Internal mammary compartment: window to the
mediastinum. Radiology 1995;195:187–92.
[84] DeCamp Jr MM, Swanson SJ, Sugarbaker DJ. The
mediastinum. In: Baue AE, Geha AS, Hammond GL,
et al, editors. Glenn’s thoracic and cardiovascular sur-
gery. 6th edition. Stanford: Appleton & Lange; 1996.
p. 643–63.
[85] Toner GC, Panicek DM, Heelan RT, Geller NL, Lin
SY, Bajorin D, et al. Adjunctive surgery after chemo-
therapy for nonseminomatous germ cell tumors:
recommendations for patients selection. J Clin Oncol
1990;8:1683–94.
[86] Nichols CR, Saxman S, Williams SD, Loehrer PJ,
Miller ME, Wright C, et al. Primary mediastinal non-
seminomatous germ cell tumors: a modern single
institution experience. Cancer 1990;65:1641–6.
[87] Wright CD, Kesler KA, Nichols CR, Mahomed Y,
Einhorn LH, Miller ME, et al. Primary mediastinal
nonseminomatous germ cell tumors. Results of a
multimodality approach. J Thorac Cardiovasc Surg
1990;99:210–7.
[88] Mountain CF, Dresler CM. Regional lung cancer clas-
sification for lung cancer staging. Regional lymph
node classification in lung cancer staging. Chest
1997;111:1718–23.
[89] Mountain CF. Revisions in the international system
for staging lung cancer. Chest 1997;111:1710–7.
[90] American Joint Committee on Cancer. Lung. In:
Beahrs OH, Henson DE, Hutter RVP, et al, editors.
Manual for staging cancer. 4th edition. Philadelphia:
Lippincott; 1992. p. 115–21.
[91] American Thoracic Society. Medical section of the
American Lung Association. Clinical staging of
primary lung cancer. Am Rev Respir Dis 1983;127:
659–64.
[92] Cymbalista M, Waysberg A, Zacharias C, Ajavon Y,
Riquet M, Rebibo G, et al. Demonstration of the
1996 AJCC-UICC regional lymph node classifica-
tion for lung cancer staging. Radiographics 1999;
19:899–900.
[93] Genereux GP, Howie JL. Normal mediastinal lymph
node size and number: CT and anatomic study. AJR
Am J Roentgenol 1984;142(6):1095–100.
[94] Quint LE, Glazer GM, Orringer MB, Francis IR,
Bookstein FL. Mediastinal lymph node detection
and sizing at CT and autopsy. AJR Am J Roentgenol
1986;147(3):469–72.
[95] Glazer GM, Gross BH, Quint LE, Francis IR, Book-
stein FL, Orringer MB. Normal mediastinal lymph
nodes: number and size according to American
Thoracic Society mapping. AJR Am J Roentgenol
1985;144(2):261–5.
[96] Graeter TP, Hellwig D, Hoffmann K, Ukena D,
Kirsch CM, Schafers HJ. Mediastinal lymph node
staging in suspected lung cancer: comparison of
positron emission tomography with F-18-fluoro-
deoxyglucose and mediastinoscopy. Ann Thorac
Surg 2003;75(1):231–5 [discussion 235–6].
[97] von Haag DW, Follette DM, Roberts PF, Shelton D,
Segel LD, Taylor TM. Advantages of positron emis-
sion tomography over computed tomography in me-
diastinal staging of non-small cell lung cancer. J Surg
Res 2002;103(2):160–4.
[98] Kernstine KH, Mclaughlin KA, Menda Y, Rossi NP,
Kahn DJ, Bushnell DL, et al. Can FDG-PET reduce
the need for mediastinoscopy in potentially respect-
able nonsmall cell lung cancer? Ann Thorac Surg
2002;73(2):394–401 [discussion 401–2].
[99] Davis RD, Oldham HN, Sabiston DC. The mediasti-

D. Shaham et al / Thorac Surg Clin 14 (2004) 25–4242
num. In: Sabiston DC, Spencer FC, editors. Surgery
of the chest. 6th edition. Philadelphia: WB Saunders;
1995. p. 576–611.
[100] Simeone JF, Minagi H, Putman CE. Traumatic dis-
ruption of the thoracic aorta: significance of the
left apical extrapleural cap. Radiology 1975;117:
265–8.
[101] Carter AR, Sostman HD, Curtis AM, Swett HA. Tho-
racic alterations after cardiac surgery. AJR Am J
Roentgenol 1983;140:475–81.
[102] Davis HK. A statistical study of the thoracic duct in
man. Am J Anat 1915;17:211.
[103] Cohen RG, DeMeester TR, Lafontaine E. The pleura.
In: Sabiston DC, Spencer FC, editors. Surgery of the
chest. 6th edition. Philadelphia: WB Saunders; 1995.
p. 523–75.
[104] Wilson AG. Pleura and pleural disorders. In: Arm-
strong P, Wilson AG, Dee P, Hansell DM, editors.
Imaging of diseases of the chest. 2nd edition.
St. Louis (MO): Mosby; 1995. p. 641–716.

Thorac Surg Clin 14 (2004) 43–52
State-of-the-art screening for lung cancer (part 1):
the chest radiograph
Matthew Freedman, MD, MBA
Lombardi Cancer Center & Imaging Science and Information Systems (ISIS) Research Center,
Georgetown University Medical Center, Lombardi Building S150, Box 20057- 1465, 3800 Reservoir Road,
NW, Washington, DC 20057-1465, USA
A series of studies performed primarily in the ing of CR and DR CXRs. Other cancers can be
1970s have been interpreted to show that the chest
radiograph (CXR) is not an effective method for
reducing mortality from lung cancer. While a stage
shift was seen for the detected cancers, compared with
current or historic controls, mortality was not shown
to decrease. Since the 1970s, when these studies were
performed, there have been substantial improvements
in the technologies for CXRs and for the detection of
small nodules on these radiographs. New develop-
ments include computed radiography (CR), direct
digital radiography (DDR), image processing, energy
subtraction (ES), temporal subtraction of serial radio-
graphs (TS), and computer-aided detection (CAD). In
this article the term digital radiography (DR) will be
used to include CR and DDR. Examples of DR, ES,
and CAD are shown in Figs. 1 and 2.
Identified causes of missed lung cancer
Analyses of CXRs for missed cancers [1–4] show
that there are identifiable causes for missing lung
cancer on CXRs. Small lesions can lie in lightly or
darkly exposed portions of the CXR, a problem that
can be at least partially overcome by image process-
1547-4127/04/$ – see front matter D 2004 Elsevier Inc. All right
doi:10.1016/S1547-4127(04)00036-2
The author is Clinical Director and a stockholder in Deus
Technologies Limited Liability Corporation, Rockville, MD.
E-mail address: [email protected]
hidden partially or completely behind bony structures,
a problem that is decreased by energy subtraction
imaging, in which bone structures are made less
visible. Other cancers might be simply overlooked,
a problem that is partially corrected by CAD, a
computer program that alerts the radiologist to find-
ings that might represent lung nodules. These major
changes in available techniques for chest radiography
have not been incorporated into current lung cancer
screening trials. DR, ES, and CAD have been shown
to enhance the detection of lung nodules on CXRs
when compared with conventional chest radiographic
techniques. Most studies to date have reported on
synthetic nodules, nodules representing metastases to
the lungs, or mixtures of primary and metastatic
cancer. CR, DDR, ES, and CAD have received U.S.
Food and Drug Administration (FDA) approval. CR
has been used in lung cancer screening trials in Japan
and at some sites in the United States. The combina-
tions of DR with ES, DR with CAD, and DR with ES
and CAD have not been used in prospective studies
for lung cancer detection.
Several methods of statistical analysis have been
applied in the prior reported studies. Receiver oper-
ating characteristic (ROC) is a standard method for
analyzing the effect of new methods of imaging on
radiologists’ interpretation. The most commonly ap-
plied statistic for this is the area under the ROC curve
(Az). For practical purposes, the Az range is 0.5 to
1.0. The higher the value, the better the system. Az
can be interpreted as the sensitivity averaged at all
possible levels of specificity. When clinicians write of
improvements in sensitivity improvements in an ROC
s reserved.

Fig. 1. Case 1. (A) Small nodule in the left midlung. (B) Circle drawn by CAD program. (C) Nodule on ES image. (D) Nodule on
ES image outlined by CAD program. The CAD product used (RS2000D) is FDA approved for use with digitally acquired CXRs
but not for use with ES CXRs. (Courtesy of Deus Technologies LLC, Rockville, MD.)
M. Freedman / Thorac Surg Clin 14 (2004) 43–5244
study, this average improvement in sensitivity for all
possible specificity levels is being referenced. Some
studies have used free ROC (FROC) and alternate
FROC (AFROC), methods that allow multiple find-
ings (in this case one or more nodules) on each image.
Identification of the location of the finding is impor-
tant. There are various methods of reporting the
FROC and AFROC statistic. In each case the maxi-
mum value is 1.0, and higher values are better.
Digital radiography
CR and DR are different methods for acquiring
digital radiographs of the chest. DR with image
processing is FDA-approved, and with certain types
of image processing it has been shown to increase
radiologists’ ability to detect pulmonary nodules. It is
designed to correct for exposure differences among
subjects and within a single subject. Intersubject and
intrasubject image optical density is better controlled
with digital methods [5–8]. It is well recognized that
there is an optimal range of optical densities on chest
images for the detection of minimal findings such as
small lung nodules. The International Labor Organi-
zation has provided standards for conventional CXRs,
and similar settings have been recommended by the
American College of Radiology [9,10]. The reason
for these limits is that film is a nonlinear recorder of
exposure, and if the image is too light or too dark the
contrast of a small object might be so decreased that it
cannot be seen.
DR uses an x-ray sensing system that allows a
wider range of exposures to be recorded. This wider
range of exposures can then be adjusted by computer
vision techniques (usually referred to as image pro-
cessing) to produce images of optimal exposure (if
displayed on film) or luminance (if displayed on a
monitor). There are several types of DR that fall into
two categories: (1) CR (also referred to in the literature
as storage phosphor radiography [SR]) and (2) DDR.
There are analog and digital image processing
methods. Fundamental changes that can be produced
include changes in optical density, contrast, unsharp
masking to balance or correct optical density, spatial
frequency filtering, and mathematical methods to
enhance specific frequencies in images, resulting
in improved contrast for objects of specific sizes or
shapes, edge enhancement, and image noise reduc-
tion. These processing methods can be applied across
the entire image (global processing) or to specific por-
tions of an image (adaptive processing). The process-
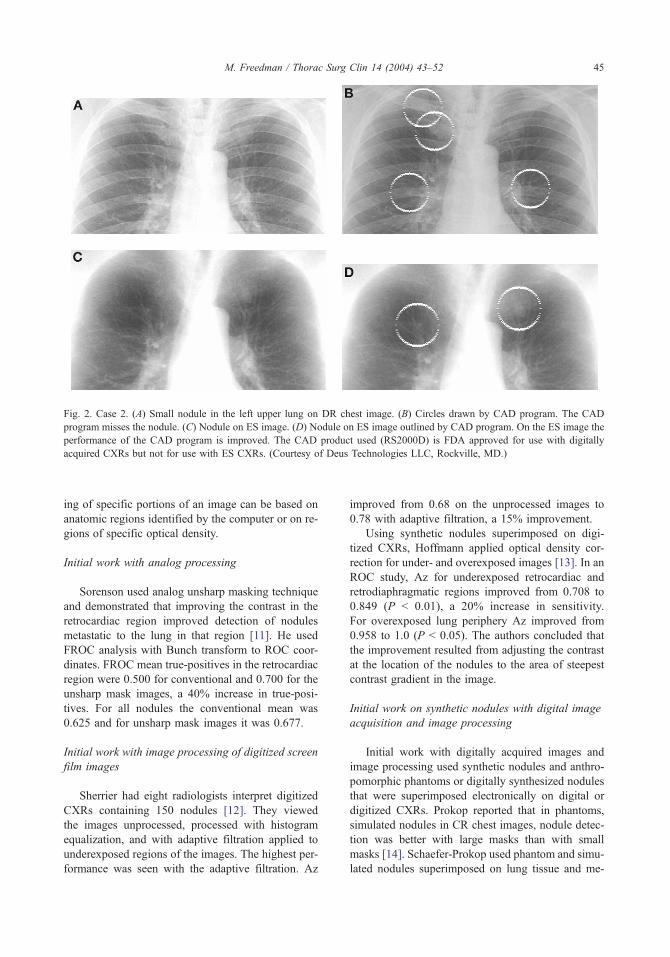
Fig. 2. Case 2. (A) Small nodule in the left upper lung on DR chest image. (B) Circles drawn by CAD program. The CAD
program misses the nodule. (C) Nodule on ES image. (D) Nodule on ES image outlined by CAD program. On the ES image the
performance of the CAD program is improved. The CAD product used (RS2000D) is FDA approved for use with digitally
acquired CXRs but not for use with ES CXRs. (Courtesy of Deus Technologies LLC, Rockville, MD.)
M. Freedman / Thorac Surg Clin 14 (2004) 43–52 45
ing of specific portions of an image can be based on
anatomic regions identified by the computer or on re-
gions of specific optical density.
Initial work with analog processing
Sorenson used analog unsharp masking technique
and demonstrated that improving the contrast in the
retrocardiac region improved detection of nodules
metastatic to the lung in that region [11]. He used
FROC analysis with Bunch transform to ROC coor-
dinates. FROC mean true-positives in the retrocardiac
region were 0.500 for conventional and 0.700 for the
unsharp mask images, a 40% increase in true-posi-
tives. For all nodules the conventional mean was
0.625 and for unsharp mask images it was 0.677.
Initial work with image processing of digitized screen
film images
Sherrier had eight radiologists interpret digitized
CXRs containing 150 nodules [12]. They viewed
the images unprocessed, processed with histogram
equalization, and with adaptive filtration applied to
underexposed regions of the images. The highest per-
formance was seen with the adaptive filtration. Az
improved from 0.68 on the unprocessed images to
0.78 with adaptive filtration, a 15% improvement.
Using synthetic nodules superimposed on digi-
tized CXRs, Hoffmann applied optical density cor-
rection for under- and overexposed images [13]. In an
ROC study, Az for underexposed retrocardiac and
retrodiaphragmatic regions improved from 0.708 to
0.849 (P < 0.01), a 20% increase in sensitivity.
For overexposed lung periphery Az improved from
0.958 to 1.0 (P < 0.05). The authors concluded that
the improvement resulted from adjusting the contrast
at the location of the nodules to the area of steepest
contrast gradient in the image.
Initial work on synthetic nodules with digital image
acquisition and image processing
Initial work with digitally acquired images and
image processing used synthetic nodules and anthro-
pomorphic phantoms or digitally synthesized nodules
that were superimposed electronically on digital or
digitized CXRs. Prokop reported that in phantoms,
simulated nodules in CR chest images, nodule detec-
tion was better with large masks than with small
masks [14]. Schaefer-Prokop used phantom and simu-
lated nodules superimposed on lung tissue and me-

M. Freedman / Thorac Surg Clin 14 (2004) 43–5246
diastinum and found no differences between screen
film (SF), CR, and a selenium system (Thoravision,
Philips Medical Systems, Shelton, Connecticut) in the
phantoms but did find an improvement in the detec-
tion of micronodules and thin simulated lines with the
selenium system [15]. Leppert compared SF, asym-
metric SF, and Fuji AC-1, (Fuji Medical Systems,
Stamford, Connecticut) images using synthetic nod-
ules placed on human volunteers before obtaining the
CXRs [16]. This work showed that the asymmetric SF
system was best overall for pulmonary nodules and
that the Fuji system and the asymmetric SF combi-
nation were better than conventional SF images for
synthetic nodules superimposed on the mediastinum.
In 1994 (1 year before this report) the Fuji AC-1 was
in the process of being replaced by newer Fuji
systems (FCR 9000 and AC-3) that had better signal
to noise characteristics and new image processing
methods that produced images similar to those pro-
duced with the asymmetric SF system. It would be
expected that these technical advances would result in
improved nodule detection. Li used 5 and 10 mm
synthetic nodules of two compositions and shapes to
simulate dense and less dense nodules in an anthro-
pomorphic phantom [17]. This work showed that
image processing changes had no effect on the de-
tection of 10 mm nodules but improved detection of
5 mm nodules. They recommend processing with un-
sharp masking with midrange frequency suppression
and low frequency enhancing filters.
This important work with synthetic nodules super-
imposed on anthropomorphic phantoms or on digi-
tized or digital CXRs showed that image processing
applied to digital images enhanced the detection of
smaller nodules, particularly when they occurred in
regions of the image that had low contrast (ie, in
lightly or heavily exposed regions).
Studies in subjects who had actual lung nodules
confirmed by CT
Van Heesewijk obtained SF and selenium images
of the chest in patients who had several types of CT-
confirmed pulmonary and pleural diseases (eg, pul-
monary opacities, interstitial disease, mediastinal
disease, and pleural disease) [18]. The patients had
12 solitary nodules less than 2 cm. No differences
were found between SF and Thoravision, but the
authors might not have stressed the difference with
the use of small nodules. No range of nodule size
was given.
Muller reported a complex experiment in which
he compared two SF systems (200 and 400 speed),
digital CR images obtained at the same two expo-
sures, and six filtering masks for the digital images
[19]. Two hundred eighty-four CT-documented nod-
ules were evaluated with these methods and rated by
six observers. A nodule detectability score was used,
with 0 points for nondetection of a nodule and
20 points for a well-visualized nodule; mean nodule
detectability scores were then calculated. Overall, CR
processed with large kernel sizes was superior to CR
processed with small kernel sizes. CR was superior to
SF for nodules superimposed on the heart, dia-
phragm, and mediastinum and for smaller nodules.
Properly processed CR was always at least as good as
SF and sometimes better. For nodules in lung fields,
the mean nodule detectability score for SF was 12.52;
for CR it was 14.26. For nodules obscured by the
heart, diaphragm, or mediastinum, mean values were
8.63 for SF and 12.81 for CR. Nodules were also
studied by size. For nodules less than 10 mm, the
mean score was 11.9 for SF and 13.5 for CR. For
nodules that were 10 to 20 mm and greater than
20 mm, SF at 200 speed and CR performed the same.
For SF at 400 speed, CR at 400 speed was better
than SF (SF 9.6, CR 13.2 for nodules 10–20 mm).
An improvement in detectability score indicates that
the nodules were more conspicuous, but it does not
indicate that more nodules were detected.
Woodard compared chest images obtained with the
selenium Thoravision and system-optimized SF im-
ages obtained at 150 kilovoltage peak (KVp). Sele-
nium and SF images were obtained in 34 subjects
who had 78 lung nodules that were identified by
CT previously [20]. The nodule size range was 0.5 to
3.5 cm with an average size of 1.5 cm. Overall there
was no significant difference in nodule detection
(64% SF, 66% digital). For the subgroup of 19 nod-
ules that were less than 1 cm, radiologists detected
53% of the nodules on the selenium images and only
46% on the asymmetric SF images, a 15% increase in
nodules detected, which was not significant at the
small sample size (P = 0.69). For the 13 nodules that
were obscured on the postero-anterior (PA) view
because they were superimposed on the heart or
diaphragm, radiologists detected 46% on the sele-
nium system images and 36% on the asymmetric SF
system, a 28% increase in nodules detected, which was
not significant at the small sample size of 13 cases.
Krupinski reported a study in which six radiol-
ogists compared unprocessed images with five dif-
ferent image processing methods on 168 CR cases of
disease that were initially missed on interpreta-
tion [21]. There were 38 subtle nodules among the
168 cases. No difference was shown in the Az for
these cases or for individual subsets. Enhanced confi-
dence ratings were shown with the use of image
M. Freedman / Thorac Surg Clin 14 (2004) 43–52 47
processing (P < 0.0001), but it is not known if en-
hanced confidence ratings enhanced disease detection.
Diagnostic decisions were not changed in this case.
Yang studied 18 patients who had CT-detected
nodules less than 20 mm. Regius CR (Konica, Tokyo,
Japan) was used for data acquisition with the original
image and two degrees of unsharp mask [22]. Overall,
no significant difference was shown. Radiologists
interpreting the standard image had an Az of 0.65;
with each of the filters the Az was 0.68. Sensitivity
increased with tumor size (P < 0.5). Tumors that had
alveolar lining growth were less visible than those
that were solid. While the authors showed no statis-
tically significant difference, eight of the ten measure-
ments showed nonsignificant improvement in Az for
the filtered images and one was equivalent.
Awai reported a comparison of CR to selenium-
based radiography in 31 patients who had CT-docu-
mented solitary noncalcified lung nodules that were
5 to 30 mm [23]. Nineteen nodules were smaller than
10 mm. Five radiologists interpreted the images,
comparing the CR and selenium images. Az was
0.64 with the CR system and 0.72 with the selenium
system (P < 0.05).
Overall, these reports support the assertion that
radiologists interpreting images of patients who have
lung nodules show improved performance in nodule
detection when digital images with appropriate image
processing are used when compared with nodule
detection with SF systems. The benefit of digital
imaging is greatest with the smallest nodules and
for those that are obscured by the heart or diaphragm.
Energy subtraction
ES radiography (also called dual energy radiogra-
phy in the literature) is a well-established research
imaging technique that has been implemented in
clinical systems over the past 7 years. Energy sub-
traction is an FDA-approved method for chest imag-
ing and has been shown in several clinical studies to
improve the detection of noncalcified nodules super-
imposed on bony structures.
There are now at least two FDA-approved sys-
tems. For clinical use it is still considered to be novel,
and no large United States trial has used it for lung
cancer screening. With ES, two images of the chest are
obtained simultaneously (in CR systems) or in rapid
succession (in DR systems). Because of the underly-
ing physical properties of atoms, the ratio of the x-ray
absorption of water and calcium varies at different
x-ray energies. Because this ratio varies at different
energies, image processing methods can be used to
take a low and a high energy radiographic image and
present them to the viewer as a bone emphasis and a
water emphasis image. The work of Stitik [1,2] and
Austin [3] show that many cancers missed on CXR
screening in clinical practice are missed because they
are small or because they are hidden behind ribs or
the clavicles. Limited clinical studies have confirmed
that ES increases the conspicuity of lung nodules.
Ho evaluated the effect of ES imaging on nodule
detection in images of anthropomorphic phantoms
that had simulated nodules using analog film as the
detector [24]. He compared two methods for ES. He
demonstrated that readers of the conventional SF
image had an Az of 0.876, those who read dual-
exposure ES had an Az 0.945 (an increase of 8% in
the mean sensitivity for all potential specificities),
and those who read single-exposure ES had an Az
of 0.929. Both ES methods were statistically signifi-
cantly superior to the conventional SF image.
Ishigaki performed an experiment in which 140
subjects had CR ES images taken. In two studies a
total of nine radiologists reviewed the images [25].
Sixty images showed primary lung cancer and 34 had
metastatic nodules. The others were normal or had
nonmalignant findings confirmed by biopsy or fol-
low-up. In the first experiment the sensitivity for
nodule detection was 0.47 for CR and 0.72 for ES
(P < 0.05). Specificity also improved from 0.74 to
0.86 (P < 0.05). For the second experiment nodule
sensitivity improved from 0.45 to 0.67 (P < 0.05) and
specificity improved from 0.80 to 0.92 (P < 0.05).
While improved sensitivity was shown for all nod-
ules, the effect was greater for those that projected
under a rib. For these nodules the sensitivity im-
proved from 0.17 to 0.73 in the first study and from
0.13 to 0.68 in the second study (P < 0.05). In the
second study the radiologists were asked to determine
if the nodule showed benign calcification. Sensitivity
for calcium detection improved from 0.29 to 0.96
on the ES images.
Kelcz reported on a study of 116 CT nodules in
50 patients [26]. Conventional SF and CR single-
exposure ES images were compared. Five observers
showed improvements in Az for nodule detection and
for characterization of the nodules as calcified. For
nodule detection the average Az was 0.597 for SF and
0.695 for ES (P < 0.005). For detecting nodule
calcification, the Az was 0.815 for SF and 0.958
for ES (P < 0.05).
Kido reported a comparison of standard CR with
an older and a newer method for detecting CT-con-
firmed lung nodules [27]. Forty nodules 5 to 20 mm in
size were seen in 22 subjects. Fourteen radiologists
interpreted the images. AFROC methods of data

M. Freedman / Thorac Surg Clin 14 (2004) 43–5248
analysis were used. For all nodules, the average Az for
the radiologists was 0.61 with CR, 0.72 with the new
ES method (P < 0.01), and 0.66 with the older ES
method (P < 0.01). For nodules that were super-
imposed on ribs, the average Az for the radiologists
was 0.55 on standard CR, 0.71 with the new ES
method (P < 0.05), and 0.63 with the older ES method
(P < 0.05). No improvement or decrement was shown
among the three methods for the nodules that were
not superimposed on the ribs (Az of 0.69, 0.69, and
0.72, respectively).
This evidence demonstrates that ES imaging pro-
vides improved lung nodule detection. Sensitivity is
improved for the detection of all nodules, but particu-
larly for those that are obscured by ribs. The detection
of calcification in nodules is also improved. Patients
who had calcified nodules were less likely to be
classified as having potentially malignant lesions.
Computer-aided detection
CAD of solitary pulmonary nodules is an FDA-
approved method for application to digitized SF and
digitally acquired CXRs. The FDA-approved ver-
sion was validated on primary non-small cell lung
cancer (NSCLC) 9 to 27 mm in size.
Computer analysis of radiographs for nodules has
been shown to be an effective method for increasing
radiologists’ detection of small lung nodules. With
CAD, the computer searches the image for findings
that could indicate the presence of a lung nodule. The
radiologist first views the image without CAD infor-
mation, then the CAD information is provided. If the
CAD system indicates sites that contain nodules that
the radiologist has overlooked and if the radiologist
accepts the information, the radiologist’s detection
rate for nodules improves. Many of the articles to
date cover technical details of the development of
these systems. In the fields of computer-aided diag-
nosis of lung cancer, two types of organizations
(academic and commercial) have been conducting
investigations for more than a decade. A group of
outstanding researchers led by Dr. Kunio Doi has
done substantial work [28,29] in pulmonary nodule
detection and CAD in other diseases at the University
of Chicago [30–32]. Doi’s group has presented two
effective lung nodule detection methods: (1) evalua-
tion of circularity with incremental thresholding, and
(2) evaluation of circularity using a morphological
open operation. Their results indicate that these meth-
ods achieve a true-positive detection rate of ap-
proximately 70% with an average of three to four
false-positive detections per chest image [33,34].
The clinical studies are reviewed below. One of the
benefits of CAD is that the marking of the lesion
appears to enhance its conspicuity. Krupinski reported
that the placement of a solid circular boundary around
a lung nodule enhanced its detection significantly
[35]. When no circle was provided the Az was
0.523; with a dashed circle it was 0.690 and with a
solid circle it was 0.800.
Kobayashi assessed the improvement in radiolo-
gists’ performance using a case sample of 60 normal
patients and 60 patients who had a single pulmonary
nodule [36]. The mean pulmonary nodule size was
14 mm. Thirty-seven percent of the nodules were
confirmed primary lung cancer and 42% had solitary
metastases. Sixteen radiologists participated and
ROC analysis was used. The Az without CAD was
0.894, and with CAD it was 0.940 (P < 0.001), a 5%
improvement. MacMahon reported the results of a
study in which 20 CXRs containing a single pulmo-
nary nodule and 20 normal CXRs were interpreted
with and without CAD [37]. On hundred forty-six
observers participated. Chest radiologists’ Az im-
proved from 0.825 to 0.889, an 8% improvement;
other radiologists’ Az improved from 0.810 to 0.876,
an 8% improvement. Radiology residents’ Az im-
proved from 0.774 to 0.855, and nonradiologists’ Az
improved from 0.697 to 0.808. All of these improve-
ments were highly statistically significant.
Recently, Deus Technologies LLC received FDA
approval for a CAD system for enhanced lung nodule
detection on CXRs (FDA PMA000041). The system
was validated on cases of NSCLC from the Johns
Hopkins Early Lung Cancer Trial, one of the major
lung cancer screening trials from the 1970s. Using the
RS-2000 (Deus Technologies, Rockville, Maryland)
radiologists showed that at their operating points (the
point of sensitivity and specificity at which they
decided on the need for diagnostic CT averaged for
the 15 study radiologists) there was an average in-
crease in cancer detection of 11% for primary NSCLC
9 to 27 mm, 21% for NSCLC 9 to 14.5 mm, and
38% for cancers that had been missed prospectively
[38–41]. As defined for this study, a cancer was a
missed cancer if the two radiologists at Johns Hopkins
who subspecialized in chest radiography both missed
the cancer on the film obtained approximately 1 year
before actual detection. In ROC numbers the radiolo-
gists, on average, went from Az 0.829 to 0.865 for all
cancers, from Az 0.798 to 0.848 for cancers 9 to
14 mm, and from Az 0.702 to 0.744 for the missed
cancers. The improvement for all cancers and for the
cancers 9 to 14 mm in size was statistically significant
(P < 0.05). For missed cancers the results were not
statistically significant for the sample size. The im-

M. Freedman / Thorac Surg Clin 14 (2004) 43–52 49
provement demonstrated in this retrospective study
suggests that a prospective screening trial using
CAD would result in improved (ie, earlier) detection
of NSCLC. A new version of the CAD system, the
RS2000D, which uses digitally acquired CXRs, has
also received FDA approval.
Fig. 3. TS of CXRs. (A) Prior CXR. (B) CXR obtained 1 year later.
apex can be identified as a white focal nodule. This method is exp
S-C Ben Lo, Hui Zhao, and Matthew Freedman, Imaging Scienc
Computer-aided detection on energy subtraction
images
In 2002 Kido provided two reports of CAD on ES
images. In the first report [42] 12 patients had CT-
confirmed nodules, eight of whom had bronchogenic
(C) Subtraction image on which the nodule in the right lung
erimental and has not received FDA approval. (Courtesy of
e Center, Georgetown University, Washington DC.)

M. Freedman / Thorac Surg Clin 14 (2004) 43–5250
cancer (presumed to have one nodule each, although
this is not stated in the article). Four patients had
metastases to the lung [42]. In only one of the
12 patients (one patient who had several nodules)
did the four radiologists, on average, detect more true-
positive nodules than the CAD. In seven patients they
were equivalent, and in four patients the CAD system
detected nodules that one or more radiologists missed.
Overall, the average was 1.60 [standard deviation
(SD) 1.03] for the radiologists and 1.83 (SD 1.34)
for the CAD system.
In 2002 Kido also reported a study of 25 images of
chest phantoms with nylon nodules of three degrees of
thickness producing different degrees of contrast on
the image [43]. Twenty-five nodules were present.
Each lung was viewed separately so there were 25
lungs with nodules and 25 lungs without nodules.
Digital chest x-radiograph (D-CXR) and digital chest
x-radiograph with energy subtraction (D-CXR-ES)
images were studied. For the D-CXR without ES, the
CAD system detected 14 of 25 nodules; the 12 ra-
diologists, on average, detected 13.3 of the 25 nod-
ules (SD 2.6; not significant). If one looked at the
maximum potential improvement that radiologists
could have had if they tested with CAD, the 12 ra-
diologists would have detected 17.7 (SD 1.4) of the
25 nodules, a potential improvement of 4.4 nodules.
On the ES images, CAD detected 23 nodules com-
pared with 14 without ES (P < 0.005). The average
detections of the 12 radiologists on the D-CXR-ES
images were 21.2 (SD 2.1) compared with 13.3
(SD 2.6) without ES (P < 0.005). If the radiologists
had used CAD, the maximum potential nodule detec-
tions would have increased from 21.2, on average, to
24.4 (SD 0.5). These articles show the potential
contribution of ES when added to D-CXR and CAD
when added to D-CXR with ES.
A series of studies have been reported in which
evidence is presented that (1) DR CXR with appro-
priate image processing is superior to standard CXR
for nodule detection, (2) DR CXR with ES is superior
to DR CXR without ES, (3) CXR and DR CXR with
CAD is superior to CXR and DR CXR, and (4)
preliminary data suggest that CAD might provide
further potential improvements when added to DR
CXR with ES.
Temporal subtraction
TS is an important proposed method for enhancing
the detection of lung nodules on serial CXRs. In this
method two studies of the chest are taken at different
times. The older image is then subtracted from the
newer image, resulting in increased conspicuity of any
change that might have occurred over time. The
method is complex because of differences in position-
ing of the chest on the two radiographs and because
of differences in the degree of lung inflation. An
example of TS is shown in Fig. 3.
Kakeda reported on a study in which a temporal
series of D-CXR images containing 20 solitary lung
nodules (10 benign and 10 lung cancers, all less than
30 mm) were assessed by four radiologists and four
radiology residents [44]. The radiologists showed
improved Az from 0.873 to 0.969 with the use of
temporally subtracted images. The residents’ Az im-
proved from 0.825 to 0.958. The combined improve-
ment was significant (P = 0.027). Similar results for
lung infiltrates were reported by Tsubamoto [45].
In a study of sequential radiographs in 30 patients
who had CT-confirmed solitary pulmonary nodules,
Johkoh [46] showed that temporal subtraction pairs
resulted in improved performance among residents
but not attending radiologists. The residents’ perfor-
mance improved from Az 0.855 to 0.907 (P < 0.05).
For the attending radiologists, the Az was 0.964
without and 0.907 with the TS images.
Preliminary data suggest that TS imaging might,
in the future, provide additional benefit in the detec-
tion of lung nodules, but additional investigation and
improvements in this method are needed.
Summary
The chest radiographic methods used in prior
studies of lung cancer screening and in current pro-
spective clinical trials of lung cancer screening do not
incorporate, as part of their prospective design, the
newer methods available for the detection of lung
nodules. DR, image processing, ES, and CAD have
been shown to enhance lung nodule detection. TS is a
promising method but with less supporting data cur-
rently available. These techniques, alone or in com-
bination, do not equal the nodule detection capability
of lung CT, but they are likely to benefit patients
having CXRs for other clinically indicated purposes
and when the detection of a nodule is incidental to the
clinical indication for the radiographic study.
References
[1] Stitik F, Tockman M. Radiographic screening in the
early detection of lung cancer. Radiol Clin N Am
1978;216:347–66.
[2] Stitik F, Tockman M, Khouri N. Chest radiology. In:

M. Freedman / Thorac Surg Clin 14 (2004) 43–52 51
Miller AB, editor. Screening for cancer. New York:
Academic Press; 1985. p. 163–91.
[3] Austin JHM, Romney BM, Goldsmith LS. Missed
bronchogenic carcinoma: radiographic findings in
27 patients with a potentially resectable lesion evident
in retrospect. Radiology 1992;182:115–22.
[4] Quekel L, Kessels A, Goei R, van Engelshoven J. Miss
rate of lung cancer on the chest radiograph in clinical
practice. Chest 1999;115:720–4.
[5] Freedman MT, Lo SCB, Nelson M, Horii SC, Mun SK.
Tests of the AGFA Phosphor Plate Imaging System in
chest imaging. In: Heshiki A, Mun SK, editors. Pro-
ceedings of IMAC 91, Kyoto, Japan, April 11–13,
1991. Los Alamitos, CA: IEEE Computer Society
Press; p. 425–9.
[6] Freedman M, Leftridge C, Nelson M, Lo S-CB, Mun
SK. Tests of the AGFA ADC Phosphor Plate Imaging
System in Pediatrics. In: Brody WR, Johnson GS, edi-
tors. SCAR 92, Symposium for Computer Assisted
Radiology, Baltimore MD (June 14–17, 1992). Carls-
bad, CA: Symposia Foundation; p. 716–7.
[7] Freedman MT, Lo SCB, Nelson M, Horii SC, Mun SK.
Tests of the AGFA ADC Phosphor Plate Imaging
System. In: Brody WR, Johnson GS, editors. Proceed-
ings of SCAR 92: Symposium for Computer Assisted
Radiology. Baltimore, MD, June 14–17, 1992. Carls-
bad, CA: Symposia Foundation; p. 718–9.
[8] Freedman MT, Lo SCB, Nelson M, Pe E, Mun SK.
Comparative tests of two storage phosphor plate imag-
ing systems: the AGFA ADC and the Fuji AC-1+.
SCAR 92. In: Brody WR, Johnson GS, editors. Pro-
ceedings of Symposium for Computer Assisted Radi-
ology. Baltimore, MD, June 14–17, 1992. Carlsbad,
CA: Symposia Foundation; p. 203–9.
[9] International Labor Organization. Guidelines for the
use of the international classification of radiographs
of pneumoconiosis. Geneva (Switzerland): Interna-
tional Labor Organization; 1992.
[10] American College of Radiology. Standards 2002.
Reston (VA): American College of Radiology; 2002.
[11] Sorenson JA, Mitchell CR, Armstrong JDN, Mann H,
Bragg DG, Mann FA, et al. Effects of improved con-
trast on lung-nodule detection. A clinical ROC study.
Invest Radiol 1987;22(10):772–80.
[12] Sherrier RH, Chiles C, Wilkinson WE, Johnson GA,
Ravin CE. Effects of image processing on nodule de-
tection rates in digitized chest radiographs: ROC
study of observer performance. Radiology 1988;
166(2):447–50.
[13] Hoffmann KR, MacMahon H, Doi K, Metz CE, Yao L,
Abe K. Evaluation of an enhanced digital film-du-
plication system by receiver operating characteristic
analysis. Invest Radiol 1993;28(12):1134–8.
[14] Prokop M, Schaefer CM, Oestmann JW, Galanski M.
Improved parameters for unsharp mask filtering of digi-
tal chest radiograph. Radiology 1993;187(2):521–6.
[15] Schaefer-Prokop CM, Prokop M, Schmidt A, Neitzel
U, Galanski M. Selenium radiography versus storage
phosphor and conventional radiography in the detection
of simulated chest lesions. Radiology 1996;201(1):
45–50.
[16] Leppert AG, Prokop M, Schaefer-Prokop CM, Galan-
ski M. Detection of simulated chest lesions: compari-
son of a conventional screen-film combination, an
asymmetric screen-film system, and storage phosphor
radiography. Radiology 1995;195(1):259–63.
[17] Li F, Sone S, Kiyono K. Lung nodule conspicuity
using unsharp mask filters with storage-phosphor-
based computed radiography. Acta Radiol 1997;
38(1):99–103.
[18] van Heesewijk HP, van der Graaf Y, de Valois JC, Vos
JA, Feldberg MA. Chest imaging with a selenium de-
tector versus conventional film radiography: a CT-con-
trolled study. Radiology 1996;200(3):687–90.
[19] Muller RD, Von Koschitzki T, Hirche H, John V, Her-
ing K, Gocke C, et al. Frequency-filtered image post-
processing of digital luminescence radiographs in
pulmonary nodule imaging. Clin Radiol 1996;51(8):
577–86.
[20] Woodard PK, Slone RM, Sagel SS, Fleishman MJ,
Gutierez FR, Reiker GG, et al. Detection of CT-proved
pulmonary nodules: comparison of selenium-based
digital and conventional screen-film chest radiographs.
Radiology 1998;209:705–9.
[21] Krupinski EA, Evanoff M, Ovitt T, Standen JR, Chu
TX, Johnson J. Influence of image processing on
chest radiograph interpretation and decision changes.
Acad Radiol 1998;5(2):79–85.
[22] Yang ZG, Sone S, Li F, Takashima S, Maruyama Y,
Hasegawa M, et al. Detection of small peripheral lung
cancer by digital chest radiography. Performance of
unprocessed versus unsharp mask-processed images.
Acta Radiol 1999;40(5):505–9.
[23] Awai K, Komi M, Hori S. Selenium-based digital ra-
diography versus high-resolution storage phosphor ra-
diography in the detection of solitary pulmonary
nodules without calcification: receiver operating char-
acteristic curve analysis. AJR Am J Roentgenol 2001;
177(5):1141–4.
[24] Ho JT, Kruger RA. Comparison of dual-energy and
conventional chest radiography for nodule detection.
Invest Radiol 1989;24(11):861–8.
[25] Ishigaki T, Sakuma S, Ikeda M. One-shot dual-energy
subtraction chest imaging with computed radiography:
clinical evaluation of film images. Radiology 1988;
168(1):67–72.
[26] Kelcz F, Zink FE, Peppler WW, Kruger DG, Ergun
DL, Mistretta CA. Conventional chest radiography vs
dual-energy computed radiography in the detection and
characterization of pulmonary nodules. AJR Am J
Roentgenol 1994;162(2):271–8.
[27] Kido S, Ikezoe J, Naito H, Arisawa J, Tamura S,
Kozuka T, et al. Clinical evaluation of pulmonary
nodules with single-exposure dual-energy subtraction
chest radiography with an iterative noise-reduction
algorithm. Radiography 1995;194:407–12.
[28] Katsuragawa S, Doi K, MacMahon H. Image feature
analysis and computer-aided diagnosis in digital radi-
M. Freedman / Thorac Surg Clin 14 (2004) 43–5252
ography: classification of normal and abnormal lungs
with interstitial disease in chest images. Med Phys
1989;16(1):38–44.
[29] Doi K, Giger ML, MacMahon H, Hoffmann KR, Nish-
ikawa RM, Schmidt RA, et al. Computer-aided di-
agnosis: development of automated schemes for
quantitative analysis of radiographic images. Semin
Ultrasound CT MR 1992;13(2):140–52.
[30] Giger M, Doi K, MacMahon H. Image feature analysis
and computer-aided diagnosis in digital radiography. 3.
Automated detection of nodules in peripheral lung
field. Med Phy 1988;15:158–66.
[31] Giger M, Ahn N, Doi K, MacMahon H, Metz C. Com-
puterized detection of pulmonary nodules in digital
chest images: use of morphological filters in reducing
false-positive detections. Med Phys 1990;17:861–5.
[32] MacMahon H, Sanada S, Doi K, Giger M, Xu X, Yin
F, et al. Direct comparison of conventional and com-
puted radiography with a dual-image recording tech-
nique. Radiographics 1991;11:259–68.
[33] Iinuma T, Tateno Y, Matsumoto T, Yamamoto S, Mat-
sumoto M. Basic idea of lung cancer screening CT
(LSCT) and its preliminary evaluation. Jap J Radio
Med 1992;52:182–90.
[34] Xu X, Doi K, Kobayashi T, MacMahon H, Giger M.
Development of an improved CAD scheme for auto-
mated detection of lung nodules in digital chest
images. Med Phys 1997;24:1395–403.
[35] Krupinski EA, Nodine CF, Kundel HL. A perceptually
based method for enhancing pulmonary nodule recog-
nition. Invest Radiol 1993;28(4):289–94.
[36] Kobayashi T, Xu XW, MacMahon H, Metz CE, Doi K.
Effect of a computer-aided diagnosis scheme on radi-
ologists’ performance in detection of lung nodules on
radiographs. Radiology 1996;199(3):843–8.
[37] MacMahon H, Engelmann R, Behlen FM, Hoffmann
KR, Ishida T, Roe C, et al. Computer-aided diagnosis
of pulmonary nodules: results of a large-scale observer
test. Radiology 1999;213:723–6.
[38] Freedman MT, Lo SCB, Lure F, Xu XW, Lin J, Zhao
H, et al. Computer aided detection of lung cancer on
chest radiographs. Algorithm performance vs radi-
ologists’ performance by size of cancer. Proceedings
of SPIE medical imaging: visualization, display, and
image-guided procedures 2001;4319:150–9.
[39] Freedman M, Benedict Lo S, Osicka T, Lure F, Xu X,
Lin J, et al. Computer aided detection of lung cancer
on chest radiographs: effect of machine CAD false
positive locations on radiologists’ behavior. Proceed-
ings of the Society of Photo-Optical Instrumentation
Engineers 2002;4684:1311–9.
[40] Freedman M, Osicka T, Benedict Lo S, Lure F, Xu X,
Lin J, et al. Methods for identifying changes in radiol-
ogists’ behavioral operating point of sensitivity–speci-
ficity trade-offs within an ROC Study of the use of
computer aided detection of lung cancer. Proceedings
of the Society of Photo-Optical Instrumentation Engi-
neers 2002;4324:184–94.
[41] Freedman MT. Digital chest radiography. In: Boiselle
P, White C, editors. New techniques in thoracic imag-
ing. New York: Marcel Dekker, Inc; 2002. p. 315–48.
[42] Kido S, Nakamura H, Ito W, Shimura K, Kato H.
Computerized detection of pulmonary nodules by
single-exposure dual-energy computed radiography of
the chest (part 1). Eur J Radiol 2002;44(3):198–204.
[43] Kido S, Kuriyama K, Kuroda C, Nakamura H, Ito W,
Shimura K, et al. Detection of simulated pulmonary
nodules by single-exposure dual-energy computed
radiography of the chest: effect of a computer-aided
diagnosis system (part 2). Eur J Radiol 2002;44(3):
205–9.
[44] Kakeda S, Nakamura K, Kamada K, Watanabe H,
Nakata H, Katsuragawa S, et al. Improved detection
of lung nodules by using a temporal subtraction tech-
nique. Radiology 2002;224(1):145–51.
[45] Tsubamoto M, Johkoh T, Kozuka T, Tomiyama N,
Hamada S, Honda O, et al. Temporal subtraction for
the detection of hazy pulmonary opacities on chest
radiography. AJR Am J Roentgenol 2002;179(2):
467–71.
[46] Johkoh T, Kozuka T, Tomiyama N, Hamada S, Honda
O, Mihara N, et al. Temporal subtraction for detection
of solitary pulmonary nodules on chest radiographs:
evaluation of a commercially available computer-aided
diagnosis system. Radiology 2002;223(3):806–11.

Thorac Surg Clin 14 (2004) 53–59
State-of-the-art screening for lung cancer: (part 2):
CT scanning
David Yankelevitz, MD*, Claudia I. Henschke, PhD, MD
Department of Radiology, Weill Medical College, Cornell University, 525 East 68th Street,
New York, NY 10021, USA
Starting in 1993 two groups independently began On annual repeat 2.5% of patients had an abnormal-
exploring the use of CT scans as the initial test in
screening protocols for lung cancer. These groups
were the National Cancer Center in Tokyo, Japan [1]
and the Early Lung Cancer Action Project (ELCAP)
at Weill Medical College of Cornell University [2].
The Japanese group had an active clinical screen-
ing program using chest radiography. They intro-
duced CT for an additional cost of $350 in 1993.
The patients’ ages ranged between 38 and 83 and
most had a 20 pack-year smoking history, although
smoking history was not required. The results of
1369 baseline screens and 2088 semiannual repeat
screens were reported by Kaneko et al [1]. Among
the 3457 screens, positive findings were present in
20% (701) of patients, and 15 of these subjects had
malignant results. The overall yield of CT was 0.43%
(15/3457) compared with 0.12% (4/3457) with
chest radiography.
At Weill Medical College, a prospective study
called ELCAP was started in 1992. Starting in 1993
1000 high-risk subjects aged 60 and older who had at
least a 10 pack-year smoking history were enrolled
for baseline and annual repeat screening. The median
age at enrollment was 67 and the median pack-years
smoked was 47. Baseline results were published in
1999 [2], and annual repeat results were published in
2001 [3]. At baseline, 23% (233) of patients had an
abnormality, of which 27 were found to be malignant,
which yielded an overall rate of 2.7% (27/1000), of
which 0.7% (7/1000) were seen on chest radiography.
1547-4127/04/$ – see front matter D 2004 Elsevier Inc. All right
doi:10.1016/S1547-4127(04)00035-0
* Corresponding author.
E-mail address: [email protected]
(D. Yankelevitz).
ity, of which seven were found to be malignant,
yielding an overall rate of 0.6% (7/1184). Chest
radiography was not performed for the repeat studies.
Starting in 1996 a third study, also in Japan, com-
pared CT with chest radiography [4]. Using a mobile
CT unit, Sone et al [4] performed baseline screening
on 5483 individuals from the general population in
Japan aged 40 to 74 years; 3967 also had miniature
flourophotography. They found that 5% (279/5483)
had a positive result, and the malignancy rate was
0.48% (19/5483) on CT compared with 0.3% on chest
radiography. A follow-up report on the results of
their annual repeat screening using only CT showed
that 3.8% (309/8303) had a positive result and that
the malignancy rate was 0.41% (34/8303) [5]. An
additional follow-up through 2001 showed that for
baseline screening the malignancy rate was 0.51%
(40/7847) and on annual repeat screening it was 0.4%
(40/10,045) [6].
These studies demonstrated that CT screening for
lung cancer was superior to the chest radiograph in
detecting lung cancer. They also showed that a pos-
itive result on baseline screening was more common
than on repeat screening. In the ELCAP study, which
had the highest median age and smoking history, the
lung cancer rate was also the highest, confirming that
age and smoking history are key risk indicators of
lung cancer.
Since these early studies several other groups have
reported their results. None of them used chest radi-
ography. These studies were done at University of
Muenster in Muenster, Germany [7], Japan [8], and,
more recently, in the Mayo Clinic in Rochester Min-
nesota [9] and Milan, Italy [10]. The Mayo group
reported that screening with sputum cytology and CT
s reserved.

D. Yankelevitz, C.I. Henschke / Thorac Surg Clin 14 (2004) 53–5954
scanning found that on baseline screening 76% of
non–small-cell lung cancer was stage I. On annual
repeat screening this proportion was 55%. The Milan
group found 55% that of their baseline cancers were
stage I, whereas 100% of the annual repeat cancers
were stage I. These studies showed a consistent pat-
tern of finding a high proportion of early-stage cancers
on baseline screening and annual repeat screening.
Screening regimen
To study CT screening for lung cancer mean-
ingfully, a regimen needs to be described, including
specification of the type of scanner, the scanning
protocol, the definition of a positive result, and the
Fig. 1. Starting in 1993 CT screening was performed using a 10 mm
were obtained while covering the same volume in a single breath-h
(A) 10 mm slice thicknesses. (B) 5 mm slice thickness. (C) 2.5 m
workup of the positive result (both for baseline and
annual repeat). It is important to think of screening as
the pursuit of early diagnosis with a view toward early
treatment. In this way screening is not merely the
application of a single test. In the case of CT screening
for lung cancer, CT is merely the initial test. Without
considering the regimen of subsequent diagnostic tests
that follow, the results of the initial test are not
meaningful. Entirely different results will be found
following the initial test when different algorithms
for workup are used. Thus, there is a need to specify
the entire regimen. Each feature of the regimen is
important. The ELCAP protocol for the diagnostic
workup is updated to incorporate increasing knowl-
edge about screening and technologies advances
as they occur [11].
slice thickness. With advances in technology, thinner slices
old. Effect of slice thickness on visibility of a stable nodule:
m slice thickness. (D) 1.25 mm slice thickness.

D. Yankelevitz, C.I. Henschke / Thorac Surg Clin 14 (2004) 53–59 55
As for the initial CT, technological advances have
come at a rapid pace. In 1993, when the initial CT
screening studies began, images were obtained with a
10 mm slice thickness. At that time only single slice
scanners existed. To scan the entire chest in a single
breath hold, a 10 mm thickness was necessary. With
the advent of multislice scanners, this practice has
changed dramatically. With the constraint of scan-
ning the entire chest in a single breath, slice thickness
has decreased progressively from 10 mm to 5 mm to
2.5 mm to current standards of 1.25 mm (Fig. 1). The
newest generation of scanners even allow for proto-
cols using a 0.675 mm slice thickness. The basic
principle is that use of thinner slice images allows for
the detection of smaller nodules. This trend toward
Fig. 2. (A) A 10 mm nodule was identified on CT. (B) Three-dimen
CT data. (C) One month later. The nodule has grown during thi
determined by use of an image processing technique, correspondin
thinner slices will continue; there are now prototype
units that can produce images with 0.1 mm resolu-
tion. Nevertheless, along with the improved resolu-
tion comes the additional burden of having the
radiologist interpret many more images per scan.
Currently, more than 300 images are obtained for
each study when using these thinner section images.
While this increase has become a concern for the
radiologist, it has opened the door for computer-
assisted techniques, which perform much better with
higher-resolution images. Computer-assisted tech-
niques include techniques that are used to measure
the volume of pulmonary nodules so that growth
rates can be determined and techniques that allow for
automated nodule detection (Fig. 2) [12].
sional volumetric reconstruction was performed on the initial
s short interval. An increase in volume was 22% has been
g to a malignant growth rate.

D. Yankelevitz, C.I. Henschke / Thorac Surg Clin 14 (2004) 53–5956
Diagnostic distribution
On the first baseline screen, it is expected that
more cancers will be found than on any single repeat
screening cycle. It is assumed that the malignancies
reported on baseline screening were those found in
nodules detected on the baseline screening, even
though the actual diagnosis of malignancy might be
made as much as several years later.
The diagnostic distribution is summarized by the
relevant prognostic categories, defined as determi-
nants of the long-term outcome of these cases. For
lung cancer, these categories include stage, size, and
histology. Given this definition it can be expected
that the diagnostic distribution will be differ from
baseline screening compared with annual repeat
screening. An additional important consideration is
that with each round of annual repeat screening the
diagnostic distribution should remain relatively con-
stant [13], which is of great importance because with a
large enough population of patients being studied, the
distribution of cancers can be determined with two
rounds of screening. It also means that the results of
each round of annual repeat screening can be pooled
to learn the actual diagnostic distribution with greater
confidence. An additional consideration in regard to
the diagnostic distribution relates to the relative risk
of the population being studied. It can be expected
that for a given risk there will be a different overall
frequency of detected cancer; however, it can also be
expected that even though the overall frequency of
cancers might be different, the proportion of the
various subtypes should remain the same. In other
words, in a high-risk population compared with a low-
risk population, many more cancers might be detected
with a particular regimen of screening; however, the
proportion of stage I cancers will remain constant.
Ultimately, this method allows for pooling of data
from various sources, providing that the same regimen
of screening is followed, which has been an underly-
ing principle in the ongoing International Early Lung
Cancer Action Project (I-ELCAP) study, in which
approximately 35 institutions around the world have
agreed to follow the same protocol and pooling of
data. To date, approximately 25,000 cases are in the
pooled database [6].
False-positive diagnosis
The issue of false-positive diagnosis has been
brought up as a concern in regard to CT screening
for lung cancer. One group reported that up to 99%
of the nodules identified represent false-positive
findings [14], but this is a misleading number. This
group defined screening cases with nodules less than
4 mm in diameter as being negative results, yet a
high proportion of their false-positives included these
4 mm or smaller nodules [15]. Thus, they interpreted
scans as being negative when they contained false-
positive findings.
A rational definition of a positive result of screen-
ing is to provide for sufficient sensitivity to not
miss too many of the cancers while not having too
many false-positive findings. For instance, one would
not consider the result of a stool guiac study to be
positive if a single red blood cell was found; rather,
there is some threshold at which the study is consid-
ered to be positive. Similarly, in regard to CT screen-
ing there is some small size threshold where every
person being scanned will have at least one nodule. Its
size can be less than 1 mm, but it would not make
sense to call each of these nodules false-positives
because they occur so frequently as to be noncontribu-
tory in terms of discriminating between subjects who
have or who do not have the target illness. In regard to
screening, the definition of a false-positive result
becomes a bit more complex because screening for
lung cancer can be thought of as a year-to-year
process. It is envisioned that when a person enrolls
in a screening program they will come back for an
annual repeat study. Under these circumstances, a
person who has a small nodule, say less than 5 mm
on baseline screening, might simply be told to return
for annual repeat screening without any intervening
workup. The reason for this might be that in nodules
this small it might be so difficult to make a diagnosis
in less than 1 year because growth determinations or
other diagnostic tests are so inaccurate that it is
impractical to pursue each of these nodules. Never-
theless, the nodules cannot be ignored. The patients
are merely told to return for their routinely scheduled
annual repeat study; they can, thus, be thought of as
perhaps representing a different type of positive
finding but not a false-positive finding in the sense
of leading to additional workup.
The ELCAP group reviewed their results recently
and found that on baseline screening it was not
practical to obtain a diagnosis of cancer in less than
1 year for nodules smaller than 5 mm [16]. ELCAP’s
current definition of a positive result of baseline
screening does not include subjects whose largest
nodule is less than 5 mm [11]. Using this definition
they have been able to reduce the number of subjects
who have positive baseline screening results to be-
low 15%.
It is also important to distinguish between the find-
ings of baseline screening and annual repeat screen-

D. Yankelevitz, C.I. Henschke / Thorac Surg Clin 14 (2004) 53–59 57
ing. While a nodule less than 5 mm on baseline
screening does not prompt additional workup in the
new ELCAP protocol, a 5 mm nodule found on annual
repeat screening that was not present on the prior
study does prompt immediate further workup. In this
situation one now has the additional information
that because the nodule was not present previously,
it now is, and therefore it is growing. The growth of a
nodule from being invisible to visible in the range of
3 to 5 mm in 1 year is suggestive of a malignant
growth rate and needs to be thought of differently than
a nodule that is of a similar size and only found on
baseline screening, in which no additional information
regarding its growth rate is available.
Curability of early lung cancer
While CT screening for lung cancer provides for
early diagnosis (especially when compared with wait-
ing for symptom prompting), the ultimate goal is to
allow for early treatment. Thus, the issue in regard
to the benefit of lung cancer screening relates to
answering two component questions. First, how fre-
quently does a particular regimen of screening lead to
early diagnosis? Second, how curable are those can-
cers? When these component issues have been under-
stood, the benefit in terms of reducing death from lung
cancer can be derived.
Critical to the concept of curability of lung cancer
is learning what proportion of lung cancers are gen-
Fig. 3. Subsolid nodules. (A) Nonsolid nodule contains no solid elem
parenchyma, and vessels can still be identified. (B) Part-solid nod
uine cancers and not overdiagnosed ones. A genuine
cancer is one that would lead to death in the absence
of intervention. It is not reasonable to think in terms
of curing a cancer if in the absence of treatment it
was not fatal.
For traditional radiography, a great deal has been
learned in regard to issues of genuineness and cur-
ability of screen detected lung cancer. Flehinger et al
studied this issue directly in the chest radiography
screening studies performed as part of the National
Cancer Institute Cooperative Early Lung Cancer De-
tection Project (Mayo Lung Project, New York Lung
Project at Memorial Sloan-Kettering Cancer Center,
and the Johns Hopkins Lung Project) [17]. When
focusing on 45 untreated cases that were stage I, they
showed that 5-year fatality rates in the absence and
presence of treatment were 90%, which implies that
at least 90% are genuine with at most 10% being
indolent. Among the cases of stage I cancer that
underwent treatment (resection), the corresponding
fatality rate was only 30%. Therefore, the overall
curability rate for the genuine lung cancers was
(90�30)/90, or 67%. Because cases of unresected
malignancies might be understaged, Flehinger extend-
ed her evaluation to include patients who had sus-
pected mediastinal metastases and found qualitatively
similar results.
In further support of these data, a recently pub-
lished review of screen-detected cancers in stage I in
two of these studies (the Mayo Lung Project and the
New York Project) found that they fit the profile of
genuine (ie, fatal if not treated) cancers. The study
ents. The lesion does not completely obscure the underlying
ule, which contains solid and nonsolid elements.

D. Yankelevitz, C.I. Henschke / Thorac Surg Clin 14 (2004) 53–5958
evaluated the growth rates of these tumors and found
that they were typical of those found in usual clinical
practice [18].
In the context of radiographic screening (even at
4-month intervals), stage I diagnosis was achieved in
only 29% of the cases [19]. With CT-based screening
the proportion has increased markedly. It is now
approximately 80%. This shift to a higher frequency
of early diagnosis should translate to improved
curability because the tumors diagnosed under CT
screening are smaller than those found with radiog-
raphy. An important remaining question to be an-
swered in the context of CT screening is the
proportion of stage I lung cancers that are not
genuine. This is a more serious concern in regard
to CT screening because a new class of lung cancers
has now been described called subsolid nodules [20].
Subsolid nodules include the nonsolid and the part-
solid nodules (Fig. 3). While they are seen primarily
on baseline screening, there is strong evidence to
suggest that some of the nonsolid ones are indolent,
as manifested in their relatively slow growth rates,
their appearance nearly restricted to baseline screen-
ing, and the near 100% absence of fatality when they
are actually resected [21,22]. Future studies on this
topic should help clarfiy the overall proportion of
these lesions that are indolent, thus allowing for un-
derstanding the overall curability the CT screen-
detected lung cancer.
Summary
There have been dramatic improvements in tech-
nology in the past decade. In conjunction there have
also been advances in our clinical knowledge that
have led to changes in the screening regimen. These
changes are expected to continue in the future as CT
scanners continue to improve and knowledge about
screening accumulates, and computer-assisted techni-
ques are expected to play an ever more important role.
This dynamic process will lead to continued improve-
ments in the diagnostic distribution of lung cancers
detected under CT screening.
References
[1] Kaneko M, Eguchi K, Ohmatsu H, Kakinuma R,
Naruke T, Suemasu K, et al. Peripheral lung cancer:
screening and detection with low-dose spiral CT ver-
sus radiography. Radiology 1996;201(3):798–802.
[2] Henschke CI, McCauley DI, Yankelevitz DF, Naidich
DP, McGuinness G, Miettinen OS, et al. Early Lung
Cancer Action Project: overall design and findings from
baseline screening. Lancet 1999;354(9173):99–105.
[3] Henschke CI, Naidich DP, Yankelevitz DF, McGuin-
ness G, McCauley DI, Smith JP, et al. Early lung
cancer action project: initial findings on repeat screen-
ings. Cancer 2001;92(1):153–9.
[4] Sone S, Takashima S, Li F, Yang Z, Honda T, Maru-
yama Y, et al. Mass screening for lung cancer with
mobile spiral computed tomography scanner. Lancet
1998;351(9111):1242–5.
[5] Sone S, Li F, Yang ZG, Honda T, Maruyama Y, Taka-
shima S, et al. Results of three-year mass screening
programme for lung cancer using mobile low-dose
spiral computed tomography scanner. Br J Cancer
2001;84(1):25–32.
[6] International Collaboration to Screen for Lung Can-
cer. Proceedings of the International Conferences on
Screening for Lung Cancer. New York, NY. Available
at: http://ICScreen.med.cornell.edu. Accessed Decem-
ber 1, 2003.
[7] Diederich S, Wormanns D, Semik M, Thomas M, Len-
zen H, Roos N, et al. Screening for early lung cancer
with low-dose spiral CT: prevalence in 817 asympto-
matic smokers. Radiology 2002;222(3):773–81.
[8] Nawa T, Nakagawa T, Kusano S, Kawasaki Y, Suga-
wara Y, Nakata H. Lung cancer screening using low-
dose spiral CT: results of baseline and 1-year follow-up
studies. Chest 2002;122(1):15–20.
[9] Swensen SJ, Jett JR, Hartman TE, Midthun DE, Sloan
JA, Sykes AM, et al. Lung cancer screening with
CT: Mayo Clinic experience. Radiology 2003;226(3):
756–61.
[10] Pastorino U, Bellomi M, Landoni C, De Fiori E, Ar-
naldi P, Picchio M, et al. Early lung-cancer detection
with spiral CT and positron emission tomography in
heavy smokers: 2-year results. Lancet 2003;362(9384):
593–7.
[11] Protocol I-ELCAP. Available at: http://icscreen.med.
cornell.edu/ielcap.pdf. Accessed December 1, 2003.
[12] Yankelevitz DF, Reeves AP, Kostis WJ, Zhao B,
Henschke CI. Small pulmonary nodules: volumetri-
cally determined growth rates based on CT evaluation.
Radiology 2000;217(1):251–6.
[13] Henschke CI, Miettinen OS, Yankelevitz DF, Libby
DM, Smith JP. Radiographic screening for cancer. Pro-
posed paradigm for requisite research. Clin Imaging
1994;18(1):16–20.
[14] Swensen SJ. CT screening for lung cancer. AJR Am J
Roentgenol 2002;179(4):833–6.
[15] Contemporary Screening for the Detection of
Lung Cancer. Available at: http://acrin.org/pdf_file2.
html?file=protocol_docs/A6654protocol.pdf. p. 29.
Accessed December 1, 2003.
[16] Henschke CI, Yankelevitz DF, Miettinen OS. CT
screening for lung cancer: suspiciousness of nodules
at baseline according to size. Radiology2003; [in press].
[17] Flehinger BJ, Kimmel M, Melamed MR. The effect
of surgical treatment on survival from early lung can-

D. Yankelevitz, C.I. Henschke / Thorac Surg Clin 14 (2004) 53–59 59
cer. Implications for screening. Chest 1992;101(4):
1013–8.
[18] Yankelevitz DF, Kostis WJ, Henschke CI, Heelan RT,
Libby DM, Pasmantier MW, et al. Overdiagnosis in
chest radiographic screening for lung carcinoma: fre-
quency. Cancer 2003;97(5):1271–5.
[19] Fontana RS, Sanderson DR, Woolner LB, Taylor WF,
Miller WE, Muhm JR. Lung cancer screening: the
Mayo program. J Occup Med 1986;28(8):746–50.
[20] Henschke CI, Yankelevitz DF, Mirtcheva R, McGuin-
ness G, McCauley D, Miettinen OS, ELCAP Group.
CT screening for lung cancer: frequency and signifi-
cance of part-solid and nonsolid nodules. AJR Am J
Roentgenol 2002;178(5):1053–7.
[21] Aoki T, Nakata H, Watanabe H, Nakamura K, Kasai T,
Hashimoto H, et al. Evolution of peripheral lung
adenocarcinomas: CT findings correlated with histol-
ogy and tumor doubling time. AJR Am J Roentgenol
2000;174(3):763–8.
[22] Noguchi M, Morikawa A, Kawasaki M, Matsuno Y,
Yamada T, Hirohashi S, et al. Small adenocarcinoma
of the lung. Histologic characteristics and prognosis.
Cancer 1995;75(12):2844–52.

Thorac Surg Clin 14 (2004) 61–69
Imaging for esophageal tumors
Robert J. Korst, MD, Nasser K. Altorki, MD*
Division of Thoracic Surgery, Department of Cardiothoracic Surgery, Weill Medical College, Cornell University,
525 E. 58th Street, New York, NY 10021, USA
Carcinoma of the esophagus comprises the vast process, with specific imaging modalities being use-
majority of malignant esophageal tumors and repre-
sents the seventh most common malignancy world-
wide, with its incidence reaching endemic proportions
in specific geographic locations in Asia and Africa
[1]. Although esophageal cancer is presently respon-
sible for only approximately 13,000 deaths annually
in the United States [2], the incidence of adenocarci-
noma of the esophagus is rising faster than any other
malignant tumor in the United States [3]. Because
the majority of patients present with advanced dis-
ease, only roughly 12% of patients diagnosed with
this tumor will survive more than 5 years after diag-
nosis [2].
The treatment of carcinoma of the esophagus is
stage-dependent (Table 1). While patients who have
widely metastatic disease are not treated with curative
intent (ie, only palliative chemotherapy or supportive
care), most clinicians would agree that patients who
have early (superficial, node-negative) cancers should
undergo surgical resection for cure; however, the
ideal treatment of locally advanced (transmural,
node-positive) disease remains controversial, with
some clinicians advocating surgical resection alone,
others supporting preoperative neoadjuvant therapy
followed by surgery, and still others backing defini-
tive chemoradiation without surgery.
Given the stage dependency of therapeutic options
for patients who have esophageal cancer, it is essen-
tial to determine the extent of disease accurately be-
fore formulating the treatment plan. Imaging plays an
integral role in guiding the clinician in this staging
1547-4127/04/$ – see front matter D 2004 Elsevier Inc. All right
doi:10.1016/S1547-4127(04)00038-6
* Corresponding author.
E-mail address: [email protected]
(N.K. Altorki).
ful for the evaluation of distant disease, locoregional
disease, or both. Certain imaging techniques have
proven to be useful in guiding biopsy procedures,
such as fine needle aspiration (FNA) of suspicious
lesions; however, the accuracy of some of these tech-
niques seems to rely, at least in part, upon the ex-
perience of the operator [4]. Finally, individual
imaging algorithms and the preference of one modal-
ity versus another varies with device availability,
individual experience, and geographic location.
Imaging of distant metastatic disease
In the United States, approximately 20% to 30%
of patients who have carcinoma of the esophagus
have distant metastatic disease at the time of presen-
tation [2,5]. The most common visceral metastatic
sites include, in decreasing order of prevalence, liver,
lung, bone, and adrenal glands [5,6]. As a result,
imaging for patients who have esophageal cancer
should evaluate these sites. The brain is an uncom-
mon site of metastases from esophageal cancer,
occurring in less than 2% of patients who have
metastatic disease [5,6]. Further, it is uncommon for
patients who have carcinoma of the esophagus to
present with solitary metastatic lesions; most possess
multiple numbers of metastases, albeit usually in a
single organ [5,6]. In these cases of metastatic disease
in a pattern consistent with esophageal cancer, often-
times histologic confirmation by means of biopsies is
not necessary; however, a second, corroborating
imaging study should be performed. In the uncom-
mon situation in which a patient presents with a
single metastatic lesion radiographically, or a pattern
inconsistent with that typically seen with esophageal
s reserved.

Table 1
Staging scheme for carcinoma of the esophagus
Stage Characteristics
Primary tumor (T)
TX Tumor cannot be assessed
T0 No evidence of tumor
Tis Carcinoma in situ/high grade dysplasia
T1 Confined to mucosa or submucosa, not
into muscularis proporia
T2 Invades into muscularis propria
T3 Invades through muscularis propria but not
into adjacent organs
T4 Invades adjacent structures/organs
Nodal status (N)
NX Regional nodes cannot be assessed
N0 No regional nodal metastases
N1 Regional nodal metastases
Distant metastases (M)
MX Distant metastases cannot be assessed
M1a Metastatic cervical nodes/upper thoracic
esophageal tumor
Metastatic celiac nodes/lower thoracic
esophageal tumor
M1b Any tumor location with visceral/bony
metastases
Any tumor location with nodal metastases
beyond N1 or M1a
Stage groupings
0 TisN0M0
I T1N0M0
IIA T2-3N0M0
IIB T1-2N1M0
III T3N1M0
T4 Any N
IVA Any T Any N M1a
IVB Any T Any N M1b
Fig. 1. Intravenous contrast-enhanced CT image of the liver
of a patient who had carcinoma of the esophagus. The
encircled region demonstrates a large, hypodense, irregu-
larly bordered lesion representing the typical appearance
of metastasis.
R.J. Korst, N.K. Altorki / Thorac Surg Clin 14 (2004) 61–6962
cancer, confirmatory biopsy should be performed
more routinely to ensure that the patient does not
have potentially curable (resectable) disease or an-
other distinct disease process. Nearly all potentially
metastatic foci can technically be assessed cytologi-
cally by means of image-guided FNA [4].
Because carcinoma of the esophagus is still an
uncommon disease relative to other tumor types in
the United States, little published data exist regarding
accuracy of many imaging modalities (eg, radio-
nuclide bone scan) exclusively for the detection of
distant metastases in patients who have esophageal
cancer; however, multiple published reports con-
cerning the accuracy of these imaging techniques
exist for carcinomatous tumors in general. Intrave-
nous contrast-enhanced CT remains the workhorse
for imaging patients who have carcinoma of the
esophagus to rule out distant metastatic lesions be-
cause it allows assessment of the three most common
sites of distant metastases. Scans should be obtained
from the base of the neck (thoracic inlet) through the
liver and adrenal glands in the upper abdomen.
Metastatic deposits in the liver usually appear as
hypodense, ill-defined lesions on contrast-enhanced
CT scans (Fig. 1) [7,8]. As with any liver imaging
modality, the sensitivity of the CT scan for detecting
metastatic liver disease depends on the size of the
lesion [7,8]. While the vast majority of lesions larger
than 1 cm are detected using CT scan, the sensitivity
drops precipitously for metastatic deposits less than
1 cm in diameter or if the scan is performed without
intravenous contrast. Similarly, if the lesions are of
adequate size ( > 1 cm), CT is useful for distinguish-
ing metastases from benign entities, most notably
cysts and hemangiomas, with the former possessing
the density of fluid and the latter demonstrating pe-
ripheral enhancement with delayed washout of intra-
venous contrast [7,8].
Other imaging modalities that are useful in assess-
ing the status of the liver include ultrasound (US) and
MRI. Although transabdominal US is inexpensive
and distinguishes between cystic and solid liver le-
sions accurately, its sensitivity in detecting metastatic
liver deposits in general is clearly inferior to that of
CT [7,8]. Laparoscopic US is potentially more sen-
sitive than the transcutaneous approach [9], but it is
an invasive procedure that tends to be especially user-
dependent, with published data suggesting only lim-
ited benefit for patients who have cancer of the
esophageal body [9,10]. MRI can be beneficial when
CT demonstrates liver lesions and further characteri-

R.J. Korst, N.K. Altorki / Thorac Surg Clin 14 (2004) 61–69 63
zation is needed. Gadolinium contrast agents might
enhance the sensitivity of MRI, which is an effective
modality for distinguishing metastases from benign
liver lesions, including cysts and hemangiomas [7,8].
Pulmonary metastases are also seen in patients
who have esophageal carcinoma. Suspicious pulmo-
nary nodules are usually round, smooth-bordered,
and noncalcified on CT scan. Given the high preva-
lence of incidental, benign pulmonary nodules seen in
smokers over the age of 60 [11], any suspicious lung
lesion should be biopsied using FNA or a thoraco-
scopic approach. Further, given the role of smoking
in carcinogenesis of the lung and esophagus and the
concept of field cancerization, primary lung cancer
also needs to be ruled out in these situations, particu-
larly if the pulmonary lesion is solitary [12].
Because bone is a common site for metastases
from carcinoma of the esophagus, routine radionu-
clide bone scanning can be performed in these pa-
tients. In general, in patients who have cancer, a scan
showing multiple areas of uptake strongly suggests
metastases; however, only 50% of solitary foci rep-
resent metastases, even in patients who have a history
of cancer [13]. Tracer accumulation can occur at any
skeletal site with an elevated rate of bone turnover.
As a result, corroborative studies are required in the
majority of cases of a positive bone scan, which
include MRI (which is especially useful for evalua-
tion of the spine), plain radiographs, and even a CT
scan. The radiographic evaluation of adrenal lesions
has been the subject of many reported studies involv-
ing the use of CT and MRI. While primary malignant
lesions of the adrenal glands are uncommon, the
prevalence of benign adrenal adenomas in the general
population is significant and might approach 7% by
age 70 [14]. Because of the high intracellular lipid
content in adenomas, thin-cut (3 mm), noncontrast
CT and MRI have been reported to possess specificity
rivaling that of FNA with cytologic examination for
distinguishing metastases from adenomas [15].
Positron emission tomography ([18F]2-flouro2-
deoxyglucose positron emission tomography [FDG]-
PET) is a new imaging modality that is gaining
popularity in staging patients who have many types
of malignant disease. Based on the finding that
malignant cells possess higher rates of glucose uptake
compared with normal cells, several small studies
have demonstrated that FDG-PET has been shown to
radiographically detect occult distant metastatic dis-
ease in approximately 20% of patients who have
esophageal cancer [16,17]. Given these encouraging
preliminary findings, this concept is presently being
evaluated in a large, multicenter, prospective study.
Drawbacks of FDG-PET are related to its lack of
sensitivity for detecting small (<1 cm) metastatic
lesions and its relative lack of anatomic detail. The
latter problem can be at least partially addressed by
the advent of newer PET/CT fusion scanners, in
which a composite image is generated incorporating
FDG-PET and CT images. It is important to note that
until larger, confirmatory studies are performed ex-
amining the utility of FDG-PET for detection of
metastatic disease, FDG-PET findings in patients
who have esophageal cancer should be confirmed
with a second imaging technique or a biopsy depend-
ing on the individual clinical scenario. This guideline
is especially true in the assessment of potentially
metastatic pulmonary lesions because although the
FDG-PET scan is frequently positive in pulmonary
metastases, a number of benign pulmonary lesions
(mainly inflammatory) can also be glucose avid [18].
Imaging of the primary tumor
Carcinoma of the esophagus originates in the
epithelial lining and spreads into and through the
wall of the esophagus and throughout the draining
lymphatics to lymph nodes. Esophageal carcinoma
readily disseminates hematogenously to distant sites.
Published data have confirmed that the presence of
lymph node metastases is a powerful predictor of
prognosis in these patients and is a marker for sys-
temic spread of the disease [19,20]. Similarly, the
depth of penetration of the primary tumor into the
esophageal wall predicts the presence or absence of
lymph node metastases, with approximately 85% of
T3 tumors being associated with lymphatic spread
[1]. Accurate imaging of the primary tumor in pa-
tients who have esophageal carcinoma is therefore
important, not only for determining resectability in
patients who have locally advanced disease but also
predicting prognosis in patients who have disease that
appears to be limited to the esophagus.
In past decades, primary tumors of the esophagus
were imaged using barium esophagography. Not only
could the location and longitudinal extent of the tumor
be determined, estimations of resectability could be
made based on the esophagram. In this regard, Aki-
yama and colleagues found that 74% of transmural
tumors caused distortion of the normal axis of the
esophagus [21]. This distortion is caused by tethering
of the esophagus in the region of the tumor.
The two most commonly used contemporary im-
aging procedures for assessing the primary tumor are
CT and endoscopic ultrasound (EUS). Given its lack
of anatomic detail, FDG-PET is unable to provide any
definition of the esophageal wall or periesophageal

Fig. 2. CT/PET fusion study depicting esophageal carci-
noma in the distal third of the esophagus. The lesion is
encircled in each panel. (A) Noncontrast CT image. (B)
FDG-PET image. (C) CT/PET fusion image.
R.J. Korst, N.K. Altorki / Thorac Surg Clin 14 (2004) 61–6964
tissues, making it of limited utility in assessing the
primary tumor (Fig. 2B). Similarly, CT does not
provide adequate resolution in distinguishing the
layers of the esophageal wall; however, information
can be gained concerning neighboring organ involve-
ment, or, more specifically, the lack thereof (Fig. 2A).
Preservation of fat planes surrounding the tumor has
been proposed and is supported as radiographic ex-
clusion of a T4 tumor [22,23]. Conversely, loss of fat
planes might indicate neighboring organ involvement.
When the tumor compresses the membranous left
main bronchus or trachea, bronchoscopy should be
performed to definitively establish airway invasion.
As with the airway, invasion of the descending tho-
racic aorta is difficult to predict using CT. Some
published evidence suggests that the greater the cir-
cumference of the aorta abutted by the tumor, the
more likely the tumor will be unresectable [24]. In
summary, although T4 tumors can be excluded reli-
ably by the preservation of peritumoral fat planes, the
definitive establishment of neighboring organ inva-
sion is difficult to predict with CT and on most
occasions operative exploration is required.
EUS is an imaging modality that is gaining popu-
larity in the preoperative assessment of patients who
have esophageal tumors. The great strength of EUS
lies in its ability to visualize the esophageal wall in
greater detail than any other imaging modality. The
esophageal wall is seen as four distinct layers using
EUS: mucosa, muscularis mucosa, submucosa, and
muscularis propria. A fifth layer corresponding to
periesophageal fat is also readily discernable using
EUS. A standard EUS examination usually involves
evaluation of the tumor with 7.5 MHz and 12 MHz
probes and is considered to be the most accurate
means by which to estimate tumor invasion. In this
regard, large review series place the accuracy of EUS
in determining the depth of invasion of esophageal
carcinoma at approximately 85% [25,26], with the
identification of T2 tumors being the least accurate
(Figs. 3, 4) [25,26].
Drawbacks of EUS include the relatively steep
learning curve [27] and the inability to pass the trans-
ducer completely through the tumor in up to 50% of
cases [25]. Newer probes are being developed con-
tinuously to address this problem, some being thin
enough to pass through the instrument channel of the
endoscope [28]. Other recent developments in EUS
technology include probes that allow for helical
scanning with subsequent three-dimensional recon-
struction of EUS images [29] and the use of high-
frequency transducers. These latter probes tend to be
useful in imaging superficial tumors of the esophagus
by providing more detail, and they can differentiate

Fig. 3. Elderly patient who had T1 adenocarcinoma of
the distal esophagus. (A) Endoscopic appearance. (B) EUS
image demonstrating lack of penetration into the muscularis
propria (MP).
Abbreviation: T, tumor.
R.J. Korst, N.K. Altorki / Thorac Surg Clin 14 (2004) 61–69 65
between T1A and T1B successfully [30]. This dis-
tinction might be of importance in locations in which
esophageal cancer screening is performed and lesions
are detected at earlier stages more routinely.
Similar to EUS, preliminary data suggest that
investigational techniques such as endoluminal MRI
might be able to visualize the layers of the esophageal
wall accurately [31]. Whether or not this technique
will earn a role in the future of imaging for carcinoma
of the esophagus requires further investigation.
Fig. 4. EUS image of T2 squamous cell carcinoma of the
esophagus. Note the tumor (T) is indistinguishable from the
muscularis propria (MP).
Imaging of lymphatic metastases
It is generally agreed that the presence of lymph
node metastases (N1 disease) associated with resect-
able carcinoma of the esophagus is the strongest
known predictor of recurrence and mortality follow-
ing definitive therapy for this disease [19,20]. As
with some other types of malignancies, the degree of
lymph node involvement might also be of prognostic
value, with published studies demonstrating that pa-
tients who have less than three to five metastatic
nodes survive appreciably longer than those who
have more than 10 involved nodes following a
potentially curative resection [19,32]. Given this
information, the determination of lymph node status
before definitive therapy might be of importance be-
cause patients who have more advanced locoregional
disease could be enrolled in trials of novel or multi-
modal therapies.
Historically, clinicians have attempted to image
lymph node metastases using multiple modalities
with limited success. The accuracy of the CT scan
for staging this aspect of the disease has been well
described in multiple literature reports. Because the
detection of metastatic nodes using CT depends pri-
marily on size criteria, its sensitivity and specificity in
detecting metastatic disease in the lymph nodes varies
with the definition of an abnormally enlarged node.
Sensitivity is enhanced if smaller size criteria are
used, but specificity is sacrificed. Conversely, large
lymph nodes on CT are more likely to be metastatic;
however, many metastatic nodes are only mini-
mally—if at all—enlarged, which hampers sensitivi-
ty. Using the common size criterion of 1 cm to define
an enlarged node, most studies report that the sensi-
tivity of CT is poor (30–60%) [17,33] and does not
appear to be enhanced with helical scanning [34]. In
contrast, specificity tends to be somewhat better, but
still suboptimal (60–80%). In summary, if CT sug-

Fig. 5. CT/PET fusion study depicting malignant perieso-
phageal lymph node. The arrow indicates the malignant
node in each panel. (A) Noncontrast CT image. (B) FDG-
PET image. (C) CT/PET fusion image.
R.J. Korst, N.K. Altorki / Thorac Surg Clin 14 (2004) 61–6966
gests the presence of metastatic lymph nodes, tissue
confirmation should be obtained if the treatment plan
will be affected.
In recent years the role of FDG-PET has been
evaluated for the detection of lymph node metastases
in patients who have esophageal cancer. FDG-PET is
a physiologic examination that has poor anatomic
definition, which severely affects its ability to predict
N1 disease accurately in the peritumoral location
[33,35]. In this regard, most esophageal tumors are
intensely FDG avid, further inhibiting the resolution
of the study and making it easy to miss metastatic
nodes that are adjacent to the primary tumor. In
contrast, when metastatic lymph nodes are located
more remotely, the accuracy of FDG-PET increases
[33,35]. The differentiation of FDG-avid peritumoral
nodes from the primary tumor might be aided by the
development of CT/PET fusion scanners (Fig. 5), in
which the anatomic detail of CT is combined with the
physiologic nature of FDG-PET, but this scenario
remains to be seen.
Given these spatial limitations of FDG-PET, it is
not surprising that the sensitivity of this modality in
detecting peritumoral metastatic lymph nodes is poor
(20–50%) in most contemporary series [17,33,35];
however, sensitivities as high as 90% have been
reported in the detection of metastatic nodes in distant
locations such as the abdomen and the neck [33,35].
In distinct contrast, the specificity of FDG-PET in
lymph node evaluation tends to be high, exceeding
90% in many series [17,33,35].
US, transcutaneous and endoscopic, is used fre-
quently to stage the N descriptor in patients who have
esophageal carcinoma. US relies not only on size
criteria to determine metastasis but also on the in-
ternal echo characteristics of individual nodes. Well-
demarcated, larger, hypoechoic nodes with scattered
large, internal echoes are more likely to represent
metastases (Fig. 6) [36,37]. The use of transcutaneous
US to image cervical and supraclavicular lymph
nodes has become routine in some regions, especially
in Asia, where reported accuracy is approximately
70% to 80% [36,38]; however, other reports have not
been able to confirm these results [35].
The accuracy of EUS in detecting metastatic
lymph nodes in patients who have esophageal carci-
noma has also been investigated and reported in
many series (Fig. 6). Wide variations of sensitivity
and specificity have been reported in these series,
ranging from 40% to 100% [39]. Similar to the ability
to detect T stage, the ability of EUS to stage the N
descriptor effectively is highly user-dependent. Cen-
ters that perform large numbers of procedures report
higher accuracy rates [37], which have not been
reproducible in other studies [35], which leads one
to question the accuracy of EUS in routine practice
settings. To address this issue, EUS has been com-
bined with FNA of suspicious lymph nodes. The
addition of FNA to EUS has been shown by some
investigators to markedly enhance the specificity of
EUS alone, especially in the region of the celiac axis
[40,41]. Whether or not these excellent results can be

Fig. 6. EUS image of a typical metastatic lymph node in a
patient who had carcinoma of the esophagus. The metastatic
node is seen as a large, hypoechoic structure in the peri-
esophageal location (arrow).
Abbreviations: Ao, descending thoracic aorta; T, tumor.
R.J. Korst, N.K. Altorki / Thorac Surg Clin 14 (2004) 61–69 67
achieved and reproduced routinely remains to be
determined and will influence the applicability of
this technique in routine practice situations.
Assessment of response to therapy
Given the relatively poor prognosis of patients
who have carcinoma of the esophagus who undergo
surgical resection alone for locally advanced disease,
preoperative (induction) chemotherapy or chemora-
diotherapy are being investigated as means to obtain
higher cure rates. Data from these clinical trials have
suggested that patients who are complete pathologic
responders to induction therapy seem to reap the most
benefit from multimodal treatment protocols [42,43],
so it might be advantageous to determine which
patients would benefit most from surgery before
resection. The accuracy of imaging modalities in this
capacity is now being investigated, with some pre-
liminary results published in recent literature.
Jones and colleagues compared the response to
preoperative chemoradiation as determined by repeat
CT scanning to pathological response rates pros-
pectively in 50 patients [44]. Using standard ra-
diographic response criteria, CT was found to be
ineffective for determining pathologic tumor response
or disease stage in this setting. Similarly, EUS was
unable to stage patients accurately after induction
therapy [45,46]; however, some evidence suggested
that measurements of tumor size using EUS might
correlate with response to chemoradiotherapy [47].
Some recent data suggest that a reduction in FDG
uptake by esophageal tumors after induction chemo-
radiotherapy might correlate with pathologic response
to therapy [48] and even improved survival in these
patients [49]. The use of imaging studies to assess the
response to therapy in patients who have esophageal
carcinoma is an emerging field, and it requires ex-
tensive investigation in future studies.
Summary
Carcinoma of the esophagus must be staged
accurately before a treatment plan is initiated, and
imaging studies play a major role in this process.
Imaging for esophageal carcinoma involves evalua-
tion of the locoregional extent of the tumor and
distant metastatic disease. A CT scan of the chest
and upper abdomen provides the most comprehensive
information about esophageal carcinoma; however,
accurate assessment of the depth of primary tumor
invasion and lymph node status remains limited, even
with newer generation scanners. Endoscopic US is a
user-dependent modality that has emerged as a highly
accurate technique in experienced hands to evaluate
the depth of penetration of esophageal tumors, but its
ability to detect metastatic lymph nodes is less im-
pressive, leading some investigators to perform con-
firmatory needle aspiration of suspicious nodes.
FDG-PET is a physiologic examination that is the
subject of intense investigation in patients who have
esophageal carcinoma. Preliminary studies have sug-
gested that FDG-PET can detect otherwise radio-
graphically occult distant metastatic disease in these
patients, and changes in FDG uptake might correlate
with the response to therapy. These findings need to
be confirmed in larger studies. More sophisticated
technology continues to be developed for imaging
carcinoma of the esophagus, which will more than
likely affect staging algorithms in the future.
References
[1] Korst RJ, Altorki NK. Esophageal cancer. In: Winches-
ter DP, Daly JM, Jones RS, Murphy GP, editors. Can-
cer surgery for the general surgeon. Philadelphia:
Lippincott-Raven; 1999. p. 155–72.
[2] Greenlee RT, Murray T, Bolden S, Wingo PA. Cancer
statistics, 2000. CA 2000;50:7–33.
[3] Devesa SS, Blot WJ, Fraumeni Jr JF. Changing pat-

R.J. Korst, N.K. Altorki / Thorac Surg Clin 14 (2004) 61–6968
terns in the incidence of esophageal and gastric carci-
noma in the United States. Cancer 1998;83:2049–53.
[4] Long BW. Image-guided percutaneous needle biopsy:
an overview. Radiol Technol 2000;71(4):335–59.
[5] Quint LE, Hepburn LM, Francis IR, Whyte RI,
Orringer MB. Incidence and distribution of distant
metastases from newly diagnosed esophageal carci-
noma. Cancer 1995;76(7):1120–5.
[6] Christie NA, Rice TW, DeCamp MM, Goldblum JR,
Adelstein DJ, Zuccaro Jr G, et al. M1a/M1b esopha-
geal carcinoma: clinical relevance. J Thorac Cardio-
vasc Surg 1999;118(5):900–7.
[7] Paulson EK. Evaluation of the liver for metastatic dis-
ease. Semin Liver Dis 2001;21:225–36.
[8] Robinson PJA. Imaging liver metastases: current limi-
tations and future prospects. Br J Radiol 2000;73:
234–41.
[9] Bemelman WA, van Delden OM, van Lanschot JJ, de
Wit LT, Smits NJ, Fockens P, et al. Laparoscopy and
laparoscopic ultrasonography in staging of carcinoma
of the esophagus and gastric cardia. J Am Coll Surg
1995;181(5):421–5.
[10] van Dijkum EJ, de Wit LT, van Delden OM, Kruyt PM,
van Lanschot JJ, Rauws EA, et al. Staging laparoscopy
and laparoscopic ultrasonography in more than 400 pa-
tients with upper gastrointestinal carcinoma. J Am Coll
Surg 1999;189(5):459–65.
[11] Henschke CI, McCauley DI, Yankelevitz DF, Naidich
DP, McGuinness G, Miettinen OS, et al. Early Lung
Cancer Action Project: overall design and findings from
baseline screening. Lancet 1999;354(9173):99–105.
[12] Margolis ML, Howlett P, Bubanj R. Pulmonary nod-
ules in patients with esophageal carcinoma. J Clin Gas-
troenterol 1998;26:245–8.
[13] Rosenthal DI. Radiologic diagnosis of bone metas-
tases. Cancer 1997;80(8 Suppl):1595–607.
[14] Reincke M. Mutations in adrenocortical tumors. Horm
Metab Res 1998;30(6–7):447–55.
[15] Lockhart ME, Smith JK, Kenney PJ. Imaging of adre-
nal masses. Eur J Radiol 2002;41(2):95–112.
[16] Luketich JD, Friedman DM, Weigel TL, Meehan MA,
Keenan RJ, Townsend DW, et al. Evaluation of distant
metastases in esophageal cancer: 100 consecutive
positron emission tomography scans. Ann Thorac Surg
1999;68(4):1133–6.
[17] Block MI, Patterson GA, Sundaresan RS, Bailey MS,
Flanagan FL, Dehdashti F, et al. Improvement in stag-
ing of esophageal cancer with the addition of positron
emission tomography. Ann Thorac Surg 1997;64(3):
770–6.
[18] Croft DR, Trapp J, Kernstine K, Kirchner P, Mullan B,
Galvin J, et al. FDG-PET imaging and the diagnosis of
non-small cell lung cancer in a region of high histoplas-
mosis prevalence. Lung Cancer 2002;36(3):297–301.
[19] Korst RJ, Rusch VW, Venkatraman E, Bains MS, Burt
ME, Downey RJ, et al. Proposed revision of the stag-
ing classification for esophageal cancer. J Thorac Car-
diovasc Surg 1998;115(3):660–9.
[20] Altorki N, Kent M, Ferrara C, Port J. Three-field lymph
node dissection for squamous cell and adenocarcinoma
of the esophagus. Ann Surg 2002;236(2):177–83.
[21] Akiyama H, Kogure T, Itai Y. The esophageal axis and
its relationship to the resectability of carcinoma of the
esophagus. Ann Surg 1972;176:30–6.
[22] Rice TW. Clinical staging of esophageal carcinoma.
CT, EUS, and PET. Chest Surg Clin N Am 2000;
10(3):471–85.
[23] Thompson WM, Halvorsen RA. Staging esophageal
carcinoma II. CT and MRI. Semin Oncol 1994;21:
447–52.
[24] Picus D, Balfe DM, Koehler RE, Roper CL, Owen JW.
Computed tomography in the staging of esophageal
carcinoma. Radiology 1983;146(2):433–8.
[25] Lightdale CJ. Staging esophageal carcinoma I. En-
doscopic ultrasonography. Semin Oncol 1994;21:
438–46.
[26] Rosch T. Endosonographic staging of esophageal can-
cer: a review of literature results. Gastrointest Endosc
Clin N Am 1995;5:537–47.
[27] Schlick T, Heintz A, Junginger T. The examiner’s
learning effect and its influence on the quality of en-
doscopic ultrasonography in carcinoma of the esopha-
gus and gastric cardia. Surg Endosc 1999;13:894–8.
[28] Silverstein FE, Martin RW, Kimmey MB, Jiranek GC,
Franklin DW, Proctor A. Evaluation of an endoscopic
ultrasound probe: in vitro and in vivo canine studies.
Gastroenterology 1989;96:1058–62.
[29] Tokiyama H, Yanai H, Nakamura H, Takeo Y, Yoshida
T, Okita K. Three-dimensional endoscopic ultrasonog-
raphy of lesions of the upper gastrointestinal tract using
a radial – linear switchable thin ultrasound probe.
J Gastroenterol Hepatol 1999;14(12):1212–8.
[30] Waxman I. Endosonography in columnar-lined esoph-
agus. Gastroenterol Clin N Am 1997;26(3):607–12.
[31] Ozawa S, Imai Y, Suwa T, Kitajima M. What’s new in
imaging? New magnetic resonance imaging of esoph-
ageal cancer using an endoluminal surface coil and
antibody-coated magnetite particles. Recent Results
Cancer Res 2000;155:73–87.
[32] Eloubeidi MA, Desmond R, Arguedas MR, Reed CE,
Wilcox CM. Prognostic factors for the survival of
patients with esophageal carcinoma in the US: the im-
portance of tumor length and lymph node status. Can-
cer 2002;95(7):1434–43.
[33] Kato H, Kuwano H, Nakajima M, Miyazaki T, Yoshi-
kawa M, Ojima H, et al. Comparison between positron
emission tomography and computed tomography in the
use of the assessment of esophageal carcinoma. Cancer
2002;94(4):921–8.
[34] Romagnuolo J, Scott J, Hawes RH, Hoffman BJ, Reed
CE, Aithal GP, et al. Helical CT versus EUS with fine
needle aspiration for celiac nodal assessment in patients
with esophageal cancer. Gastrointest Endosc 2002;
55(6):648–54.
[35] Lerut T, Flamen P, Ectors N, Van Cutsem E, Peeters M,
Hiele M, et al. Histopathologic validation of lymph
node staging with FDG-PET scan in cancer of the
esophagus and gastroesophageal junction: a prospec-

R.J. Korst, N.K. Altorki / Thorac Surg Clin 14 (2004) 61–69 69
tive study based on primary surgery with extensive
lymphadenectomy. Ann Surg 2000;232(6):743–52.
[36] Natsugoe S, Nakashima S, Matsumoto M, Sakita H,
Sakamoto F, Okumura H, et al. Biologic and imaging
diagnosis of lymph node metastasis in esophageal car-
cinoma. J Surg Oncol 2002;81(1):25–32.
[37] CatalanoMF, Sivak Jr MV, Rice T, Gragg LA, Van Dam
J. Endosonographic features predictive of lymph node
metastasis. Gastrointest Endosc 1994;40(4):442–6.
[38] Natsugoe S, Yoshinaka H, Shimada M, Shirao K,
Nakano S, Kusano C, et al. Assessment of cervical
lymph node metastasis in esophageal carcinoma using
ultrasonography. Ann Surg 1999;229(1):62–6.
[39] Kelly S, Harris KM, Berry E, Hutton J, Roderick P,
Cullingworth J, et al. A systematic review of the stag-
ing performance of endoscopic ultrasound in gastro-
oesophageal carcinoma. Gut 2001;49(4):534–9.
[40] Eloubeidi MA, Wallace MB, Reed CE, Hadzijahic N,
Lewin DN, Van Velse A, et al. The utility of EUS and
EUS-guided fine needle aspiration in detecting celiac
lymph node metastasis in patients with esophageal can-
cer: a single-center experience. Gastrointest Endosc
2001;54(6):714–9.
[41] Parmar KS, Zwischenberger JB, Reeves AL, Waxman
I. Clinical impact of endoscopic ultrasound-guided fine
needle aspiration of celiac axis lymph nodes (M1a dis-
ease) in esophageal cancer. Ann Thorac Surg 2002;
73(3):916–20.
[42] Urba SG, Orringer MB, Turrisi A, Iannettoni M, For-
astiere A, Strawderman M. Randomized trial of preop-
erative chemoradiation versus surgery alone in patients
with locoregional esophageal carcinoma. J Clin Oncol
2001;19(2):305–13.
[43] Bosset JF, Gignoux M, Triboulet JP, Tiret E, Mantion
G, Elias D, et al. Chemoradiotherapy followed by sur-
gery compared with surgery alone in squamous-cell
cancer of the esophagus. N Engl J Med 1997;337(3):
161–7.
[44] Jones DR, Parker Jr LA, Detterbeck FC, Egan TM.
Inadequacy of computed tomography in assessing
patients with esophageal carcinoma after induction
chemoradiotherapy. Cancer 1999;85(5):1026–32.
[45] Beseth BD, Bedford R, Isacoff WH, Holmes EC,
Cameron RB. Endoscopic ultrasound does not accu-
rately assess pathologic stage of esophageal cancer af-
ter neoadjuvant chemoradiotherapy. Am Surg 2000;
66(9):827–31.
[46] Mallery S, DeCamp M, Bueno R, Mentzer SJ, Sug-
arbaker DJ, Swanson SJ, et al. Pretreatment staging
by endoscopic ultrasonography does not predict com-
plete response to neoadjuvant chemoradiation in pa-
tients with esophageal carcinoma. Cancer 1999;86(5):
764–9.
[47] Willis J, Cooper GS, Isenberg G, Sivak Jr MV, Levitan
N, Clayman J, et al. Correlation of EUS measurement
with pathologic assessment of neoadjuvant therapy re-
sponse in esophageal carcinoma. Gastrointest Endosc
2002;55(6):655–61.
[48] Kato H, Kuwano H, Nakajima M, Miyazaki T, Yo-
shikawa M, Masuda N, et al. Usefulness of positron
emission tomography for assessing the response of
neoadjuvant chemoradiotherapy in patients with esoph-
ageal cancer. Am J Surg 2002;184(3):279–83.
[49] Downey RJ, Akhurst T, Ilson D, Ginsberg R, Bains
MS, Gonen M, et al. Whole body 18FDG-PET and
the response of esophageal cancer to induction ther-
apy: results of a prospective trial. J Clin Oncol 2003;
21(3):428–32.

Thorac Surg Clin 14 (2004) 71–77
Fluorescent bronchoscopy
Sebastien Gilbert, MD, James D. Luketich, MD, Neil A. Christie, MD*
Division of Thoracic and Foregut Surgery, University of Pittsburgh Medical Center, 200 Lothrop Street,
Suite C800, Pittsburgh, PA 15213, USA
Long-term lung cancer survival in North America patients [5–7]. Based on these results, there are cur-
remains less than 15% and has not changed appre-
ciably over the past several decades [1]. It is antici-
pated that the number of patients who have lung
cancer will continue to rise in North America over the
next 15 years despite the gradual decrease in the
proportion of people who smoke because the risk of
lung cancer remains elevated in previous smokers. If
current smoking trends continue to show a decline,
the majority of cancers seen in the future will be in
previous smokers [2]. Given the ineffectiveness of
treatment for advanced cancer, early lung cancer
detection and treatment offer the greatest potential
for achieving a decrease in lung cancer mortality.
Detection of lung cancer at an earlier stage should
result in improved survival and the opportunity for
less invasive therapy such as thoracoscopic resection
of peripheral tumors and endobronchial ablative ther-
apy for central airway tumors. Experience with
screening and early diagnosis and treatment in other
epithelial organs such as the cervix have shown that
early detection and treatment of lesions can be
accomplished with improved cure rates [3]. Based
on calculations of estimated tumor doubling times, it
is estimated that a tumor will grow for months or
even years before reaching a size detectable with
standard imaging techniques [4], which should allow
a significant window of time in which to detect early
tumors in high-risk patients. Large lung cancer
screening trials evaluating sputum cytology and chest
radiography resulted in earlier diagnosis with im-
proved survival in identified patients, but no differ-
ence in overall survival when compared with control
1547-4127/04/$ – see front matter D 2004 Elsevier Inc. All right
doi:10.1016/S1547-4127(04)00041-6
* Corresponding author. Shadyside Medical Center,
5200 Center Avenue, Suite 715, Pittsburgh, PA 15232.
E-mail address: [email protected] (N.A. Christie).
rently no recommendations for lung cancer screen-
ing. There has been a resurgence of interest in
screening for lung cancer, however, with the advent
of more sensitive screening tests such as CT and
fluorescent bronchoscopy. While CT scans can iden-
tify subcentimeter parenchymal nodules accurately,
early endobronchial lesions and central tumors are
not seen well [8]. Sputum cytologic analysis offers
the detection of clinically occult lesions, but it can-
not localize the lesion in the airway. In situ and
microinvasive cancers might not produce visible ab-
normalities on standard white-light bronchoscopy
(WLB). Even with multiple bronchoscopies or se-
lective segmental bronchial brushing, the source
of cytologically abnormal cells can be difficult to
localize. Fluorescent bronchoscopy offers the poten-
tial for more accurate discovery and localization of
early tumors and premalignant epithelial changes
which are generally not well seen with WLB. In a
study by Woolmer [9], only 29% of carcinoma in situ
(CIS) detected by sputum cytology examination
could be localized by conventional WLB.
Fluorescent bronchoscopy
Fluorescent bronchoscopy uses the observation
that dysplastic tissue and areas of CIS demonstrate
weaker green fluorescence than normal tissues when
illuminated with blue light. Fluorescent properties of
human tissues have been the object of scientific
interest since the early 1920s [10]. Early attempts at
endobronchial surveillance used fluorescent dyes.
Current fluorescent bronchoscopy exploits the auto-
fluorescence characteristics of premalignant and ma-
lignant lesions of the bronchial mucosa, and no
exogenous dyes are required. The best-known fluo-
s reserved.
S. Gilbert et al / Thorac Surg Clin 14 (2004) 71–7772
rescent bronchoscope that works on this principle is
the lung imaging fluorescence endoscope (LIFE,
Xillix Technologies Corp, Vancouver, British Colum-
bia, Canada), which was developed by Dr. Stephen
Lam at the British Columbia Cancer Agency [11].
The LIFE system uses tissue fluorescence to localize
suspicious lesions in the tracheobronchial tree. A
helium–cadmium laser light source projects light at
a wavelength of 442 nm [12] to induce tissue fluo-
rescence. Two cameras, one with a red filter and one
with a green filter, capture the fluorescent signal. The
ratio between the red and green fluorescence is
used to distinguish benign from malignant tissue.
Real-time digitized images are constructed using
the relative intensities of red and green fluores-
cence, and a nonlinear analysis combines the red
and green fluorescence intensity values to create a
single number that discriminates between normal and
abnormal tissue sites. A computer-enhanced pseudo-
image is created, allowing the delineation of abnor-
mal areas when displayed on the monitor. Suspicious
areas appear reddish-brown and normal areas appear
green. Abnormal-appearing mucosa can then be
biopsied to identify dysplastic areas, CIS, or micro-
invasive cancers.
LIFE bronchoscopy represents the evolution and
refinement of existing fluorescence imaging concepts
and techniques rather than a novel diagnostic imaging
modality. Normal tissue produces significantly higher
fluorescence intensity than dysplastic lesions or CIS,
particularly in the green region of the emission
spectrum [11,12]. Decrease in the autofluorescence
in early cancer or dysplastic tissue is likely a result of
multiple factors. Most of the fluorescent signal origi-
nates from the submucosa. The loss of autofluores-
cence, as evidenced by a reddish-brown image on the
LIFE endoscope, might be related to destruction of
the extracellular matrix by metalloproteinases [13].
Increased bronchial microvascular density and im-
paired transmission of fluorescent signal through a
thickened malignant or dysplastic epithelium might
also contribute [14].
The SAFE 1000 (Pentax, Asahi Optical, Tokyo,
Japan) and the D-light (Storz, Tuttlingen, Germany)
are other commercially available systems.
Bronchoscopic technique
Bronchoscopy is performed on an outpatient basis
using local anesthesia with or without intravenous
sedation. It is combined with a conventional WLB
examination and adds approximately 15 minutes to
the overall procedure time [15]. An Olympus BF20
(Olympus America, Melville, New York) is used.
During a LIFE examination, areas of normal green
fluorescence are labeled class I (normal), whereas
areas of increased redness with indistinct borders are
labeled class II (abnormal). Class III lesions (suspi-
cious) show deeper red coloration and distinct bor-
ders. This classification scheme was described by
Lam in 1998 [15]. Most LIFE bronchoscopists would
agree that there is a learning curve of approximately
20 examinations, during which accuracy improves
consistently. The biopsy specimens obtained during
LIFE bronchoscopy should be interpreted by lung
pathologists according to defined criteria published in
the World Health Organization lung tumor classifica-
tion [16]. Preneoplastic lesions include squamous
dysplasia and CIS. Four grades of preneoplastic
lesions have been defined (ie, mild, moderate, severe
dysplasia, and CIS) based on the distribution of
atypical cells and mitotic figures. Although the re-
producibility of this system remains to be established,
it is part of a concerted effort to achieve a standard-
ized framework for classification [16]. Inconsistency
in pathologic classification can confound study re-
sults, and some studies have shown interobserver
variability on the pathologic classification.
Prebronchoscopy risk stratification
The success of any screening program depends on
the prescreening risk of cancer in the group being
evaluated. Although 80% of lung cancers are attrib-
uted to smoking, less than 20% of smokers develop
lung cancer in their lifetime. The yearly incidence of
lung cancer in the general population of the United
States is 0.05% to 0.09% [1]. Epidemiologic studies
show that an increased risk of lung cancer is seen in
patients who have more extensive smoking histories.
Presence of chronic obstructive pulmonary disease
has also been associated with an increased risk of
lung cancer. Previously treated primary lung cancer
also represents a risk factor for second primary lung
cancer. Clinically significant second primary lung
cancers are diagnosed in patients who have prior
non–small-cell lung cancer at a rate of 1% to 3%
per patient per year. Despite postoperative follow-up
care, only 50% of second primaries are resectable. At
the time of diagnosis 19% of these cancers are locally
advanced, 65% are associated with metastatic dis-
ease, and 20% occur in patients who are not surgical
candidates because of insufficient pulmonary reserve.
The 5-year survival rate after complete resection of a
second primary lung cancer is only 20% [17]. Sputum
screening with conventional cytology can identify

S. Gilbert et al / Thorac Surg Clin 14 (2004) 71–77 73
patients who are at high risk for endobronchial
neoplasia or dysplasia, and sputum immunostaining
promises even greater sensitivity. Experiments with
monoclonal antibody 703D4 have shown that over-
expression of an RNA binding protein, hnRNP
A2/B1, is a powerful predictor of early subclinical
cancer in high-risk groups [18].
Chemoprevention
Saccomanno observed in longitudinal studies that
abnormal bronchial epithelial cell changes predated
development of invasive lung cancer [19,20]. It is
now believed that lung cancers develop through a
series of sequential morphologic changes from meta-
plasia to dysplasia to CIS before the development of
invasive cancer. Bronchoscopic identification of these
premalignant lesions can be used to identify patients
for chemopreventative therapy or sequential monitor-
ing. Longitudinal monitoring of these patients should
identify early cancers when and if they appear and
allow clinicians to observe the natural history of these
lesions. Ten percent of patients who have moderate
dysplasia and 40% to 83% of patients who have
severe dysplasia progress to invasive cancer [21].
Based on autopsy studies of the tracheobronchial tree
of smokers performed in the 1960s and 1970s, the
incidence of CIS is probably between 2.2% and
22.5% [22]. The exact proportion of patients who
have CIS in whom disease will progress to invasive
cancer is not known. There have been reports that
some individuals continue to show malignant cells in
sputum for several years without symptoms or ab-
normality on chest radiograph. Frost showed that
only 43% of smokers who had marked dysplasia on
sputum cytology developed cancer over a 10-year
follow-up period. Saccomanno noted progression
from dysplasia to cancer in only three of 16 uranium
workers [23]. This variability underlines the lack of
knowledge of the natural history of premalignant
changes in the tracheobronchial tree. The variability
in incidence might reflect a lack of standardization in
the pathological definition of CIS over the years. It is
possible that a significant proportion of these lesions
were initially misclassified and that the prevalence of
CIS in the tracheobronchial tree of smokers has been
overestimated. This theory is corroborated by the
observed incidence of lung cancer, which is much
lower than the reported rate of CIS. The incidence of
second primary lung cancers should also be higher
than the reported 1% to 4% per year [17,24,25]. A
more recent observational study of bronchial CIS
suggested that such lesions almost uniformly prog-
ress to microinvasive carcinoma. LIFE should allow
localization, and longitudinal follow-up of these le-
sions which will allow clinicians to learn about the
natural history of these lesions and their risks of
progressing to invasive cancer.
Improved identification of dysplastic premalig-
nant lesions will provide an opportunity to intervene
with chemoprevention therapy to try to halt the
progression from dysplasia or CIS to invasive cancer
[26]. Chemoprevention, treatment directed at stop-
ping the progression of multistep lung carcinogene-
sis, will require a better understanding of the biology
of premalignant bronchial lesions and the develop-
ment of effective chemopreventative agents. Identifi-
cation of patients who have early endobronchial
lesions can be used to validate less invasive assays
on sputum or blood, which can be evaluated in
parallel to the pathologic and cytologic changes
occurring in bronchial epithelium and epithelial cells.
Clinical trials with lung imaging fluorescence
endoscope bronchoscopy
A large experience with LIFE bronchoscopy has
been reported in the literature. Generally, it attests to
the improved sensitivity of LIFE bronchoscopy over
standard WLB in detecting dysplasia and CIS. One
study involving 173 high-risk patients from seven
centers in the United States and Canada demonstrated
that the combination of WLB and LIFE bronchos-
copy improved clinicians’ ability to detect prema-
lignant and early-stage malignant bronchial lesions
endoscopically [15]. In that group of patients, WLB
had a sensitivity of 9% for detecting moderate/
severe dysplasia or CIS and a sensitivity of 65% for
detecting intraepithelial neoplasms and microinvasive
carcinoma. The addition of LIFE bronchoscopy to
WLB yielded sensitivity values of 56% and 95% for
preinvasive and invasive lesions, respectively, which
represents a 6.3-fold increase in the detection of
intraepithelial lesions and a 1.5-fold increase in the
detection of preneoplastic lesions. These results con-
firm the difficulties in detecting early neoplastic
lesions by conventional bronchoscopy alone. Thirty-
nine percent of patients who have abnormal sputum
cytology will require more than one WLB to identify
an associated neoplastic lesion, even if more than half
of these lesions have progressed beyond the CIS stage
[27]. LIFE bronchoscopy can help overcome this lack
of sensitivity and allow histologic follow-up of pre-
malignant lesions that would otherwise be undetect-
able with WLB. This information will be helpful in
characterizing the natural history of these lesions.

S. Gilbert et al / Thorac Surg Clin 14 (2004) 71–7774
LIFE bronchoscopy has also been compared with
WLB in a randomized fashion [28]. The aim of the
trial was to assess the efficiency of each technique in
detecting premalignant lesions of the airways. It
included 55 patients who were considered to be at
high risk for lung cancer because of smoking history
(age >30; 7.1 pack-years mean smoking history),
documented airflow obstruction, and abnormal spu-
tum cytology (87%) or a past history of lung cancer.
Each patient was randomized to LIFE or WLB, and
each examination was performed by a different bron-
choscopist. The operator was blinded to the results of
the previous examination. A mean of seven biopsy
specimens was retrieved per patient. The sensitivities
of LIFE alone (68.8%) and that of LIFE combined
with WLB (81.3%) were significantly higher than
that of WLB alone (21.9%), but the combined exami-
nation was significantly less specific than WLB alone
(47.8% versus 78.3%). In this trial, neither the order
in which the procedures were performed nor the
bronchoscopist had a significant impact on sensitivity
and specificity.
Other published studies corroborate the enhanced
ability of LIFE to detect premalignant lesions [29,30].
On average, LIFE examination leads to more biopsies
because more areas of mucosa appear abnormal. An
argument can be made that the improved sensitivity
is merely related to the fact that more areas of the
airway are biopsied during LIFE. When specificity is
taken into account, however, and detection ratios of
LIFE and WLB are compared, the difference in
effectiveness remains significant [29]. Similar results
have been published by other groups [25,26,31–33].
The sensitivity of LIFE ranged from 73% to 89%,
and the specificity ranged from 46% to 61%. Once
again, the addition of LIFE to WLB improved the sen-
sitivity of the bronchoscopic examination [29–31,33].
One study failed to demonstrate increased sensitivity
with LIFE bronchoscopy [34]; however, this might be
explained by the selection of a relatively low-risk
population compared with other trials (ie, >20 pack-
years smoking history alone).
The performance of LIFE bronchoscopy is related
directly to the operator’s skill and experience with the
technique. Scope-induced trauma or other artifacts
can easily be mistaken for an area of abnormal fluo-
rescence. Although biopsy of these areas will un-
doubtedly help maintain a high sensitivity, it will
potentially increase the number of false-negatives
(ie, decrease sensitivity). In the authors’ experience,
the incidence of fluorescent anomalies might be
higher when LIFE is performed after WLB, which
is most likely related to scope-induced mucosal
trauma. Lastly, the problem of low specificity is not
unique to LIFE as a screening test. CT scanning for
early lung cancer, mammography for breast cancer,
and prostate specific antigen (PSA) for prostate can-
cer are noteworthy examples of relatively nonspecific
screening tests [8,31]. The result of decreased sensi-
tivity is the taking of additional biopsies that do not
pose a significant risk to the patient. The develop-
ment of quantitative fluorescence and the use of
nebulized photosensitizers and endobronchial ultra-
sonography might help overcome some of the speci-
ficity limitations.
Lung imaging fluorescence endoscope
bronchoscopy for cancer staging
A recent study found that LIFE bronchoscopy
was useful in staging early endobronchial lesions and
determining which lesions were amenable to endo-
bronchial therapy as opposed to more invasive therapy
[35]. Twenty-three patients who had radiologically
occult tumors who were referred for endobronchial
therapy were evaluated with LIFE bronchoscopy. On
high-resolution CT scanning, radiologically apparent
disease (lymph nodes or primary tumor) was detected
in four patients. The remaining 19 patients were
evaluated with fluorescent bronchoscopy. Six patients
had tumors less than 1 cm in diameter, and the distal
margin of the lesion could be seen bronchoscopically.
These patients were treated with endobronchial ther-
apy. The remaining patients had more extensive dis-
ease on LIFE bronchoscopy. Six of the 13 patients
underwent surgical resection of T1 or T2 node-nega-
tive tumors. On patient had stage II N1 disease. The
remaining patients were medically inoperable and
were treated with external beam radiation (n = 4) or
endoluminal therapy (n = 3). Of the localized tumors
treated with endoluminal therapy, no recurrence was
seen within a 30- to 50-month follow-up period.
High-resolution CT and fluorescent bronchoscopy
offer the ability to better stage patients who have
radiologically occult lung cancer, preventing and
identifying the subset of patients who can be treated
endobronchially with a good expectation of cure.
Another circumstance in which LIFE bronchos-
copy has been evaluated is in the preoperative
assessment of patients who had known lung carci-
noma to detect synchronous primary tumors [36].
Seventy-two patients who had known lung cancer
(69 non–small-cell; three limited-stage small-cell)
were evaluated with LIFE bronchoscopy and WLB.
Three synchronous cancers were detected, one by
WLB and LIFE and two by LIFE bronchoscopy
alone. Two of the three patients had squamous cell

S. Gilbert et al / Thorac Surg Clin 14 (2004) 71–77 75
primary cancer. The third tumor was not subclas-
sified histologically. Two of the three patients had
advanced cancers. One patient died of postobstruc-
tive pneumonia before the initiation of any therapy
and another patient had advanced nodal disease that
precluded resection. A third patient underwent right
pneumonectomy followed by endobronchial therapy
for a small lesion identified with LIFE bronchoscopy.
The authors recommended LIFE bronchoscopy to
evaluate for synchronous occult lung cancers, but
only immediately before surgery after all other stag-
ing procedures had been completed.
Fig. 2. LIFE bronchoscopy image corresponding to image
in Fig. 1.
University of Pittsburgh experience
At the University of Pittsburgh, LIFE bronchos-
copy was used to screen patients for the occurrence
of second primary lung cancer following pulmonary
resection for non–small-cell lung cancer between
1997 and 2002. The initial experience has been
reported [37]. Ninety-five patients participated in
the screening program. Fifty-five had resected adeno-
carcinomas and 40 had resected squamous cell car-
cinomas. The examination frequency was annually
if no abnormalities were identified. Seventy-four per-
cent of patients had stage I cancer, 18% had stage II
cancer, and 8% had stage III cancer as their initial
primary cancer. Seventy-two percent of patients had
undergone previous lobectomy, 6% had undergone
pneumonectomy, and 22% had undergone segmental
resection. Of the 12 abnormal areas identified patho-
Fig. 1. Conventional WLB.
logically (high-grade dysplasia, CIS, or microinva-
sive cancer), six were detected with the fluorescent
examination and four with WLB with sensitivities of
50% and 33%, respectively. Fig. 1 shows an endo-
scopic view of an area of CIS that was occult on
WLB. Fig. 2 shows the identical area on LIFE bron-
choscopy, in which the abnormality was visualized.
The specificity of fluorescent bronchoscopy was 76%
compared with 98% for WLB. Nine of 95 patients
(9%) had lesions for which treatment could be
considered. The poor sensitivity of WLB in this
group of patients might, in part, have been related
to the fact that two or three random biopsies were
taken in every patient, increasing the potential of
identifying bronchoscopically occult lesions.
Future directions
The evolution of LIFE technology toward a more
objective quantification of tissue fluorescence and the
addition of other complementary endoscopic tools
such as endobronchial ultrasound might improve the
specificity of the technique, which would ultimately
benefit patients by decreasing the number of biopsies
performed and the time requirement for the exami-
nation. With an emphasis on screening and early diag-
nosis, clinicians might see more patients who have
radiologically occult lesions who will be potential
candidates for endobronchial therapy for attempted
cure. One of the major challenges in achieving
widespread integration of this modality in clinical

S. Gilbert et al / Thorac Surg Clin 14 (2004) 71–7776
practice is delineation of the subgroups of patients
who are at higher risk of developing lung cancer,
who are appropriate patients for this invasive and
relatively labor-intensive evaluation.
Endobronchial biopsy specimen evaluation with
methods other than histologic evaluation potentially
offers a fruitful opportunity. Molecular abnormalities
have been observed in patients who have histologi-
cally normal epithelium and might represent a more
suitable marker than histologic patterns, which do not
always correlate predictably with outcome [38]. Cel-
lular changes in gene copy number, gene expression,
and protein profiles might represent better predictors
of progression of dysplasia and CIS and act as
surrogate markers for efficacy in chemoprevention
studies [39]. That cytogenetic changes are occurring
with associated molecular alterations is compatible
with the current understanding of the molecular
pathogenesis of cancer [40]. The ability to sample
preneoplastic lesions accurately for molecular and
histologic analysis and to follow their progression
or regression longitudinally should prove to be valu-
able tools in outcomes research. Multiple chromo-
somal abnormalities have been noted and gene
mutations have been detected using sensitive molecu-
lar techniques such as polymerase chain reaction [39].
The results of these molecular studies have so far
failed to identify a single marker that is expressed
consistently in cancers or dysplastic lesions but not
seen in normal endobronchial cells, and no markers
seen in dysplastic cells have been reliably predictive
for progression to cancer. With the development of
comparative genomic hybridization techniques, clini-
cians have the potential to get a much broader picture
of total genomic damage patterns, which might be
more predictive [41]. New techniques of comparative
analysis of gene expression across thousands of genes
[42] and new methods of proteomic analysis might
also be adapted to these samples [43]. With this large
amount of additional information, a predictive mo-
lecular signature of lesions that are likely to progress
to cancer could be identified. The addition of these
newer methods of tissue analysis should stand to
improve the utility of LIFE bronchoscopy in the
future in clinicians’ attempts to decrease the mortality
from lung cancer and facilitate less invasive endo-
bronchial treatments.
Acknowledgment
The authors would like to acknowledge the
assistance of Jill Ireland in the preparation of
this manuscript.
References
[1] American Cancer Society. Cancer Facts and Figures
2003. No 5008.03. Atlanta: American Cancer Society;
2003. p. 1–48.
[2] Burns DM. Primary prevention, smoking, and smoking
cessation: implications for future trends in lung cancer
prevention. Cancer 2000;89:2506–9.
[3] Anderson GH, Boyes DA, Benedet JL, Le Riche JC,
Matisic JP, Suenk C, et al. Organization and results of
the cervical cytology screening program in British Co-
lumbia, 1955–1985. BMJ 1988;296:975–8.
[4] Geddes DM. The natural history of lung cancer:
a review based on rates of tumor growth. Br J Dis
Chest 1979;73:1–17.
[5] Flehinger BJ, Melamed MR, Zaman MB, Heelan RT,
Perchick WB, Martini N. Early lung cancer detection:
results of the initial (prevalence) radiologic and cyto-
logic screening in the Memorial Sloan-Kettering study.
Am Rev Respir Dis 1984;130(4):555–60.
[6] Fontana RS, Sanderson DR, Taylor WF, Woolner LB,
Miller WE, Muhm JR, et al. Early lung cancer detec-
tion: results of the initial (prevalence) radiologic and
cytologic screening in the Mayo Clinic study. Am Rev
Respir Dis 1984;130(4):561–5.
[7] Frost JK, Ball Jr WC, Levin ML, Tockman MS, Baker
RR, Carter D, et al. Early lung cancer detection: results
of the initial (prevalence) radiologic and cytologic
screening in the Johns Hopkins study. Am Rev Respir
Dis 1984;130(4):549–54.
[8] Henschke CI, McCauley DI, Yankelevitz DF, Naidich
DP, McGuinness G, Miettinen OS, et al. Early Lung
Cancer Action Project: overall design and findings
from baseline screening. Lancet 1999;354(9173):
99–105.
[9] Woolner LB, Fontana RS, Cortese DA, Sanderson DR,
Bernatz PE, Payne WS, et al. Roentgenographically
occult lung cancer: pathologic findings and frequency
of multicentricity during a 10-year period. Mayo Clin
Proc 1984;59(7):453–66.
[10] Policard A. Etudes sur les aspects offerts par des
tumeurs experimentales examinees a la lumiere de
Woods. CR Soc Biol 1924;91:1423–5 [in french].
[11] Lam S, MacAulay C, Hung J, LeRiche J, Profio AE,
Palcic B. Detection of dysplasia and carcinoma in situ
with a lung imaging fluorescence endoscope device.
J Thorac Cardiovasc Surg 1993;105(6):1035–40.
[12] Hung J, Lam S, leRiche JC, Palcic B. Autofluores-
cence of normal and malignant bronchial tissue. Lasers
Surg Med 1991;11(2):99–105.
[13] Qu J, MacAulay C, Lam S. Optical properties of nor-
mal and carcinoma bronchial tissue. Appl Opt 1991;
11:99–105.
[14] Lam S, Becker HD. Future diagnostic procedures.
Chest Surg Clin N Am 1996;6(2):363–78.
[15] Lam S, Kennedy T, Unger M, Miller YE, Gelmont D,
Rusch V, et al. Localization of bronchial intraepithelial
neoplastic lesions by fluorescence bronchoscopy.
Chest 1998;113(3):696–702.

S. Gilbert et al / Thorac Surg Clin 14 (2004) 71–77 77
[16] Kerr KM. Pulmonary preinvasive neoplasia. J Clin
Path 2001;54(4):257–71.
[17] Johnson BE. Second lung cancers in patients after
treatment for an initial lung cancer. J Natl Cancr Inst
1998;90(18):1335–45.
[18] Tockman MS, Mulshine JL, Piantadosi S, Erozan YS,
Gupta PK, Ruckdeschel JC, et al. Prospective detection
of preclinical lung cancer: results from two studies of
heterogeneous nuclear ribonucleoprotein A2/B1 over-
expression. Clin Cancer Res 1997;3:2237–46.
[19] Saccomanno G, Saunders RP, Archer VE, et al. Cancer
of the lung: the cytology of sputum prior to the devel-
opment of carcinoma. Acta Cytol 1965;9:413–23.
[20] Saccomanno G, Archer VE, Auerbach O, Saunders RP,
Brennan LM, et al. Development of carcinoma of the
lung as reflected in exfoliated cells. Cancer 1974;33:
256–70.
[21] Frost JK, Ball WC, Levin ML, Jockman MS, Erozan
YS, et al. Sputum cytology: use and potential in mon-
itoring the workplace environment by screening for
biological effects of exposure. J Occup Med 1986;28:
692–703.
[22] Auerbach O, Hammond EC, Garfinkel L. Changes
in bronchial epithelium in relation to cigarette smok-
ing, 1955–1960 vs. 1970–1977. N Engl J Med 1979;
300(8):381–5.
[23] Band P, Feldstein M, Saccomanno G. Reversibility of
bronchial marked atypia: implications for chemopre-
vention. Cancer Detect Prev 1986;9:157–60.
[24] Gilbert S, Reid KR, Lam MY, Petsikas D. Who should
follow up lung cancer patients after operation? Ann
Thorac Surg 2000;69(6):1696–700.
[25] Venmans BJ, van Boxem TJ, Smit EF, Postmus PE,
Sutedja TG. Outcome of bronchial carcinoma in situ.
Chest 2000;117(6):1572–6.
[26] Arnold AM, Browman GP, Levine MN, D’Souza T,
Johnstone B, Skingley P, et al. The effect of the
synthetic retinoid etretinate on sputum cytology: re-
sults from a randomized trial. Br J Cancer 1992;65:
737–43.
[27] Bechtel JJ, Kelley WR, Petty TL, Patz DS, Sacco-
manno G. Outcome of 51 patients with roentgeno-
graphically occult lung cancer detected by sputum
cytologic testing: a community hospital program. Arch
Intern Med 1994;154(9):975–80.
[28] Hirsch FR, Prindiville SA, Miller YE, Franklin WA,
Dempsey EC, Murphy JR, et al. Fluorescence versus
white-light bronchoscopy for detection of preneoplas-
tic lesions: a randomized study. J Natl Cancr Instit
2001;93(18):1385–91.
[29] Hirsch FR, Prindiville SA, Miller YE, Franklin WA,
Dempsey EC, Murphy JR, et al. Fluorescence versus
white-light bronchoscopy for detection of preneoplas-
tic lesions: a randomized study. J Natl Cancr Inst 2001;
93(18):1385–91.
[30] Vermylen P, Pierard P, Roufosse C, Bosschaerts T,
Verhest A, Sculier JP, et al. Detection of bronchial
preneoplastic lesions and early lung cancer with fluo-
rescence bronchoscopy: a study about its ambulatory
feasibility under local anesthesia. Lung Cancer 1999;
25(3):161–8.
[31] Kennedy TC, Lam S, Hirsch FR. Review of recent
advances in fluorescence bronchoscopy in early local-
ization of central airway lung cancer. Oncologist 2001;
6(3):257–62.
[32] Kennedy TC, Hirsch FR, Miller YE, Prindiville S,
Murphy JR, Dempsey E, et al. A randomized study
of fluorescence bronchoscopy versus white-light bron-
choscopy for early detection of lung cancer in high-
risk patients. Lung Cancer 2000;29(1):244–5.
[33] Shibuya K, Fujisawa T, Hoshino H, Baba M, Saitoh Y,
Iizasa T, et al. Fluorescence bronchoscopy in the de-
tection of preinvasive bronchial lesions in patients with
sputum cytology suspicious or positive for malignancy.
Lung Cancer 2001;32(1):19–25.
[34] Kurie JM, Lee JS, Morice RC, Walsh GL, Khuri FR,
Broxson A, et al. Autofluorescence bronchoscopy in
the detection of squamous metaplasia and dysplasia in
current and former smokers. J Natl Cancr Instit 1998;
90(13):991–5.
[35] Sutedja TG, Codrington H, Risse EK, Breuer RH, van
Mourik JC, Golding RP, et al. Autofluorescence bron-
choscopy improves staging of radiographically occult
lung cancer and has an impact on therapeutic strategy.
Chest 2001;120(4):1327–32.
[36] van Rens MT, Schramel FM, Elbers JR, Lammers JW.
The clinical value of lung imaging fluorescence endos-
copy for detecting synchronous lung cancer. Lung
Cancer 2001;32:13–8.
[37] Weigel TL, Kosco PJ, Dacic S, Rusch VW, Ginsberg
RJ, Luketich JD. Postoperative fluorescence broncho-
scopic surveillance in non-small cell lung cancer
patients. Ann Thorac Surg 2001;71:967–70.
[38] Jett JR. Screening for lung cancer in high-risk groups:
current status of low-dose spiral CT scanning and spu-
tum. Sem Resp Crit Care Med 2000;21(5):385–92.
[39] Mitsudomi T, Lam S, Takayuki T, Gazdar AF. Detec-
tion and sequencing of p53 gene mutations in bron-
chial biopsy samples in patients with lung cancer.
Chest 1993;104:362–5.
[40] Vogelstein B, Kinzler KW. The multistep nature of
cancer. Trends Gent 1993;9:138–41.
[41] Forozan F, Mahlamaki EH, Monni O, Chen Y, Veld-
man R, Jiang Y, et al. Comparative genomic hybrid-
ization analysis of 38 breast cancer cell lines: a basis
for interpreting complementary DNA micro array data.
Cancer Res 2000;60:4519–25.
[42] Nacho M, Trachea T, Gao Y, Fujii T, Chen Y, Player A,
et al. Molecular characteristics of non-small cell lung
cancer. Proc Natl Acad Sci USA 2001;98:15203–8.
[43] Gharib TG, Chen G, Wang H, Huang CC, Prescott MS,
Shedden K, et al. Proteomic analysis of cytokeratin
isoforms uncovers association with survival in lung
adenocarcinoma. Neoplasia 2002;4(5):440–8.

Thorac Surg Clin 14 (2004) 79–86
Virtual bronchoscopy for evaluation of airway disease$
Steven E. Finkelstein, MDa, Ronald M. Summers, MD, PhDb,Dao M. Nguyen, MDa, David S. Schrump, MDa,*
aThoracic Oncology Section, Surgery Branch, Center for Cancer Research, National Cancer Institute, Building 10, Room 2B-07,
10 Center Drive, National Institutes of Health, Bethesda, MD 20892-1502, USAbDiagnostic Radiology Department, Warren Grant Magnuson Clinical Center, National Institutes of Health, Building 10,
Room 1c 660, 10 Center Drive, Bethesda, MD 20892, USA
A variety of medial conditions can cause airway tract; however, FB yields little information regard-
stenoses that require intervention by thoracic sur-
geons. For instance, patients who have primary lung
cancers or pulmonary metastases frequently develop
complete bronchial obstructions secondary to endo-
luminal tumors or extrinsic compression [1]. Patients
who have a variety of nonmalignant conditions can
also develop severe pulmonary complications includ-
ing fixed tracheobronchial stenoses, tracheomalacia,
or hemoptysis [2].
Typically, patients who have suspected airway
disease undergo diagnostic evaluation consisting of
chest radiographs and conventional CT scans fol-
lowed by fiberoptic bronchoscopy [3]. Conventional
CT generates two-dimensional (2D) cross-sectional
images of the thorax, which provide information re-
garding peribronchial anatomy. Standard CT scans
have a sensitivity of 63% to 100% and a specificity
of 61% to 99% for detection of major endobronchial
disease [4–6]. Occasionally, suboptimal scanning
techniques, inappropriate slice thickness, and other
artifacts might limit the accuracy of airway anatomy
defined by conventional CT scans [7].
In clinical practice, fiberoptic bronchoscopy (FB)
remains the gold standard for evaluation and surveil-
lance of endoluminal lesions within the respiratory
1547-4127/04/$ – see front matter Published by Elsevier Inc.
doi:10.1016/S1547-4127(04)00037-4
$Supplementary data associated with this article can
be found, in the online version, at doi:10.1016/S1547-4127
(04)00037-4.
* Corresponding author.
E-mail address: [email protected]
(D.S. Schrump).
ing the extent of extraluminal disease or airway pat-
ency beyond a high-grade stenosis [8]. In addition, FB
might pose potential risks to patients who have ad-
vanced pulmonary disease (morbidity 0.8%) because
some degree of sedation might be required [9].
Recently, virtual bronchoscopy (also referred to as
CT bronchoscopy) has become available for noninva-
sive evaluation of the tracheobronchial tree [3]. Vir-
tual bronchoscopy (VB) uses three-dimensional (3D)
reconstruction of super high-resolution helical CT
(SHR-CT) images for delineation of the tracheobron-
chial tree. Perspective surface or volume rendering of
2D CT scan images are used to construct a virtual
airway. The natural contrast between the soft tissue of
the airway wall and air within the tracheobronchial
tree establishes a plane for generating the virtual
airway [6]. The viewer can navigate through the
virtual airway in a 3D manner analogous to standard
FB. VB also enables imaging of endoluminal and
extraluminal anatomy, which is not possible with FB.
The virtual airway can be manipulated in space and
evaluated from multiple angles (Fig. 1; Movie 1 in
online version of this article).
Technique
Two hundred to 300 contiguous images of the
thorax are obtained using a multislice helical CT scan-
ner [10]. The standard technique at the National Insti-
tutes of Health is 1.25 collimation, helical scan (HS)
mode (helical pitch 6; 7.5 mm table motion per

Fig. 1. Virtual bronchoscopy (VB) of normal anatomy. Viewpoint is above carina (A), looking into right mainstem bronchus (B),
a segmental bronchus (C). A three-dimensional movie of VB is available in the online version of this article found at doi:10.1016/
S1052-3359(03).
S.E. Finkelstein et al / Thorac Surg Clin 14 (2004) 79–8680
rotation, 120 kVp, 100 mAs, 0.8 sec tube rotation,
nonoverlapping reconstructions with a section inter-
val of 1.25 mm, and an effective z-axis resolution off1.6 mm). A standard algorithm is used to generate
the CT images [10]. The radiation dose with this
technique is the same or slightly less than that of a
conventional thoracic CT scan.
VB images can be viewed as standard CT scans or
reconstructed to 3D endoscopic views using commer-
cial software (ie, GE Navigator on a GE Advantage
Windows workstation, General Electric, Milwaukee,
Wisconsin). The radiologist or surgeon can review the
VB in a systemic manner. With the viewpoint placed
first in the proximal trachea, retrograde inspection of
the subglottis is done. Next, antegrade inspection of
the trachea is performed, followed by evaluation
of the right mainstem bronchus, right upper lobe
apical (B1), right upper lobe posterior (B2), right
upper lobe anterior (B3), bronchus intermedius, right
middle lobe, right middle lobe lateral (B4), right mid-
dle lobe medial (B5), right lower lobe superior (B6),
right lower lobe medial basal (B7), right lower lobe
anterior basal (B8), right lower lobe lateral basal (B9),
right lower lobe posterior basal (B10), left main stem
bronchus, left upper lobe apical posterior (B1 + 2),
left upper lobe anterior (B3), superior lingular (B4),

S.E. Finkelstein et al / Thorac Surg Clin 14 (2004) 79–86 81
inferior lingular (B5), left lower lobe superior (B6),
left lower lobe anteromedial basal (B7–8), left lower
lobe lateral basal (B9), and left lower lobe posterior
basal (B10) sequential bronchi. Using this technique,
airway abnormalities such as the presence or absence
of obstructive lesions (intrinsic or extrinsic), endo-
luminal masses, or mucosal abnormalities can be de-
fined precisely relative to bronchovascular anatomy.
Virtual bronchoscopy for thoracic malignancies
Accumulating data indicate that VB is extremely
useful for the detection of partial or complete bron-
chial obstructions secondary to endoluminal tumors
or extrinsic compression in cancer patients. In an
early study Fleiter et al [11] compared VB (performed
with a double-detector CT unit) and FB in 20 patients
who had thoracic malignancies. VB images were
created successfully in 19 of these patients; a strong
heart pulsation produced a motion artifact that pre-
vented accurate reconstruction in one individual.
Areas of high-grade stenoses were identified accu-
rately using both techniques; however, VB did not
detect discrete malignant infiltration and extraluminal
compression in five patients.
In a subsequent study Liewald et al [12] evaluated
30 lung cancer patients who had VB and FB. 3D im-
ages were created in all patients, and 13 obstructive
lesions were seen equally well by VB and FB. VB
demonstrated tracheobronchial anatomy beyond high-
grade stenoses in two patients; however, mucosal le-
sions were not visualized by VB. Rapp-Bernhardt
et al [13] observed no significant differences in the
location or extent of airway stenoses detected by VB
compared with FB in 21 patients who had esophageal
cancers infiltrating the respiratory tract. In a subse-
quent study these authors observed that conventional
Fig. 2. Endoluminal lesion in 51-year-old man who had metastatic
(B) FB. The lesion consists of large and small components in the
struction of the right upper lobe bronchus. (Courtesy of US gover
CT scans had a sensitivity of 92.9% and a specificity
of 100%, whereas VB had a sensitivity of 93.8% and
a specificity of 99.7% for detection of airway ste-
noses in lung cancer patients [14].
Hoppe et al [15] compared the efficacy of nonin-
vasive multidetector CT, which included VB images,
axial CT, coronal reformatted images, and sagittal
reformatted images, with that of FB. In their ex-
amination of 200 bronchial sections obtained from
20 lung cancer patients (15 patients had bronchial car-
cinoma and five did not have central airway disease),
these investigators observed that VB was a highly
accurate method for assessing the severity of tracheo-
bronchial stenoses; images from VB correlated ex-
tremely well with those obtained by FB (r = 0.91).
In a recent study the authors prospectively evalu-
ated VB and FB in 32 consecutive patients who had
suspected thoracic malignancies [16]. VB images
were obtained successfully in all patients during one
or two 17-second end-inspiration breath-holds (Fig. 2
shows data from representative patient). FB was
within normal limits in seven of 20 patients (35%),
and VB correlated with FB in these individuals. FB
revealed a total of 22 abnormalities in 13 patients; VB
detected 18 of these abnormalities, including 13 of
13 obstructing lesions (> 50% luminal occlusion) and
five of six endobronchial lesions with less than 50%
luminal obstruction. VB did not detect three mucosal
lesions identified by FB. Overall, the sensitivity of VB
was 82% for detection of any abnormality in the
respiratory tract, 100% for obstructing lesions, 83%
for endoluminal lesions, and 0% for mucosal lesions.
The specificity of VB was 100%.
In a subsequent prospective observer study the
authors evaluated SHR-CT, VB, and conventional CT
scans directly for detection of tracheobronchial ma-
lignancies in 44 patients [17]. Image acquisition and
simulation of tracheobronchial anatomy were suc-
renal cell carcinoma metastatic to the right hilum. (A) VB.
right mainstem bronchus (white arrows) with complete ob-
nment.)

S.E. Finkelstein et al / Thorac Surg Clin 14 (2004) 79–8682
cessful in all individuals. Thirty-two patients had
correlative FB within 1 month (Fig. 3 shows imaging
from representative patient). SHR-CT and VB corre-
lated with FB in nine patients who had normal
anatomy; however, CT demonstrated two false-posi-
tive obstructing lesions in one patient. Twenty-three
patients had a total of 35 abnormal FB findings.
SHR-CT and VB detected 29 (83%) of these abnor-
malities accurately, including 19 of 19 obstructing
lesions, 9 of 10 endoluminal masses, and one of six
mucosal lesions.
SHR-CT and VB failed to detect a small periph-
eral endobronchial mass in one patient, mucosal in-
flammation in two patients, and the presence of blood
without an identifiable source in three patients. It
is possible that endobronchial bleeding was intermit-
tent and not present at the time that SHR-CT and
VB were obtained in these three individuals. In con-
trast, SHR-CT and VB demonstrated 10 and 11 addi-
tional lesions, respectively, that were not identifiable
during FB because the size of the bronchoscope pre-
cluded evaluation of peripheral airways (in nine pa-
tients) or locations distal to high-grade stenoses (in
Fig. 3. Endoluminal lesion obstructing superior segment of left lo
FB (A), VB (B), and SHR-CT axial (D), coronal (E) and sagittal s
this lesion was not appreciated on consecutive conventional CT se
two patients). Because many patients in this study
underwent pulmonary resection, pathologic correla-
tion was possible in nine patients; six obstructive
lesions (67%) not detected by FB but visualized by
SHR-CT and VB were confirmed to be malignant.
Consistent with the authors’ previous report [16], the
sensitivities of SHR-CT and VB were 100% for ob-
structing lesions, 90% for endoluminal masses, and
17% for mucosal lesions. Specificities of SHR-CTand
VB were 100%.
In contrast to the excellent imaging obtained with
SHR-CT or VB, conventional CT scans were subop-
timal for identification of airway pathology. Twenty-
five patients who had bronchoscopic examinations
and SHR-CT and VB also underwent conventional
CT scanning. Seven patients (28%) had normal
examinations by FB; results of conventional CT scans
correlated with FB in six of these individuals (speci-
ficity 85%). Conventional CT scans depicted two
false-positive lesions in one patient. Eighteen patients
(72%) had a total of 29 abnormal FB findings.
Conventional CT detected 17 of these abnormalities
including 13 of 18 obstructive lesions, four of eight
wer lobe in 30-year-old man who had metastatic melanoma
ections (F) all visualized this lesion (white arrow); however,
ctions (C). (Courtesy of US government.)

S.E. Finkelstein et al / Thorac Surg Clin 14 (2004) 79–86 83
endoluminal masses, and zero of three mucosal le-
sions. As with SHR-CT and VB, obstructive lesions
not visualized by FB were detected by conventional
CT because of the size limitation of the bronchoscope.
Three of six (50%) of these lesions were subsequently
confirmed to be positive by histologic evaluation. In
contrast to SHR-CT and VB, the sensitivity of con-
ventional CT was 72% for obstructive lesions, 50%
for endoluminal masses, 0% for mucosal lesions, and
59% overall. In no instance did conventional CT im-
prove upon the findings of SHR-CT or VB.
Virtual bronchoscopy for benign disease
VB has been used to evaluate airway stenoses
secondary to a variety of benign conditions [18–24].
Accumulating data indicate that VB has a sensitivity
of 94% to 100% for detection of benign airway
stenoses, and it is particularly useful for evaluation
of high-grade stenoses and delineation of airway
anatomy distal to these lesions, most of which are
located in the central airways. Ferretti et al [25] dem-
onstrated the utility of VB for evaluation of airway
obstruction in patients who had Mounier-Kuhn dis-
ease, tracheomalacia, post-tracheostomy strictures,
Wegener’s granulomatosis, tracheopathia osteoplas-
tica, and amyloidoses with tracheal wall involvement.
These investigators also demonstrated the use of VB
for the evaluation of airway compression by subster-
nal goiters, aneurysms of the great vessels, and me-
diastinal tumors. Burke et al [23] evaluated VB in
Fig. 4. Subglottic stenosis in patient who had Wegener’s granuloma
ability to reverse the viewing direction with the VB model is helpfu
airway from the posterior aspect (large arrow). The vocal cords (sm
in the subglottic region. (Courtesy of US government.)
21 patients who had primary tracheal strictures, eight
patients who had tracheomalacia, two patients who
had glottic webs, two patients who had tracheal
granulomas, seven patients who had vocal cord im-
mobility, and five patients who had innominate artery
aneurysms. The length and width of fixed airway
stenoses were demonstrated accurately by VB; steno-
sis-to-lumen ratios as determined by VB and FB
varied less than 10%. VB was particularly helpful in
evaluating high-grade airway stenoses that prevented
full bronchoscopic assessment. VB was less useful for
evaluation of dynamic airway obstructions, possibly
because images were obtained during breath-hold at
end-inspiration. Ferretti et al [25] obtained excellent
VB images of dynamic airway compromise second-
ary to tracheomalacia by scanning at end-inspiration
and end-expiration.
The authors’ group conducted a prospective ob-
server study recently comparing CT and VB to FB
for evaluation of airway stenoses in patients who had
Wegener’s granulomatous [26]. Helical CT scans
with 3D VB reconstruction of the trachea and bron-
chi were obtained in 11 patients. CT, VB, and FB
were performed and evaluated in a blinded manner.
Correlative FB was performed, on average, within
2 days of CT scans (Figs. 4, 5 show representative
data from two patients). VB visualized 188 of
198 bronchi (95%). Conventional CT scans detected
22 stenoses, whereas VB revealed 31 of 40 stenoses
identified by FB. Overall, this experience indicates
that VB can demonstrate anatomy down to the seg-
mental bronchi and that VB can detect the majority
tosis detected by way of (A) FB and (B) retrograde VB. The
l in locating the stenosis. The stenosis appears to narrow the
all arrows) are shown to indicate the location of the stenosis
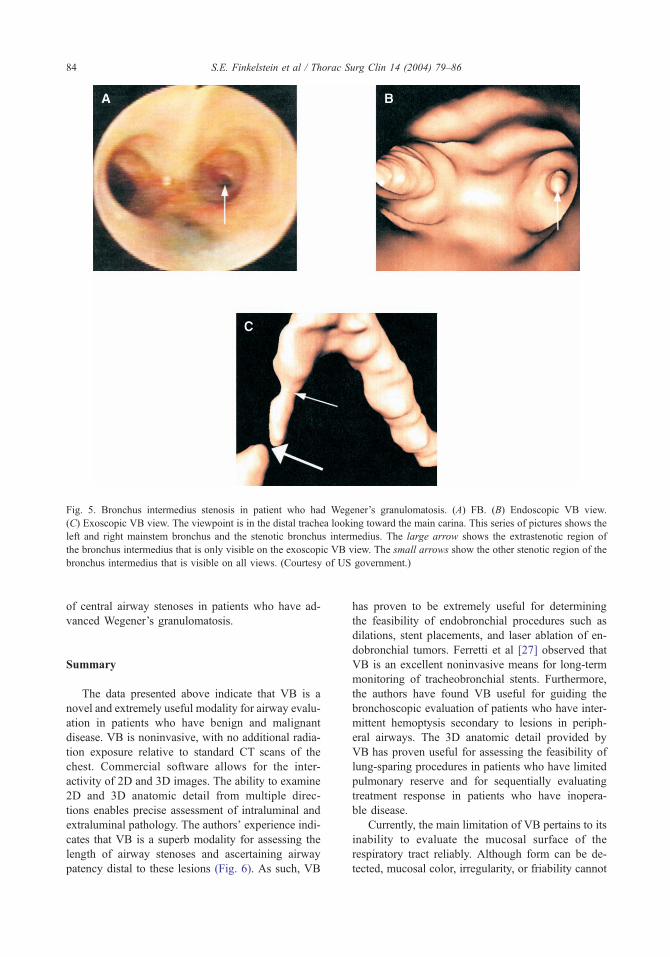
Fig. 5. Bronchus intermedius stenosis in patient who had Wegener’s granulomatosis. (A) FB. (B) Endoscopic VB view.
(C) Exoscopic VB view. The viewpoint is in the distal trachea looking toward the main carina. This series of pictures shows the
left and right mainstem bronchus and the stenotic bronchus intermedius. The large arrow shows the extrastenotic region of
the bronchus intermedius that is only visible on the exoscopic VB view. The small arrows show the other stenotic region of the
bronchus intermedius that is visible on all views. (Courtesy of US government.)
S.E. Finkelstein et al / Thorac Surg Clin 14 (2004) 79–8684
of central airway stenoses in patients who have ad-
vanced Wegener’s granulomatosis.
Summary
The data presented above indicate that VB is a
novel and extremely useful modality for airway evalu-
ation in patients who have benign and malignant
disease. VB is noninvasive, with no additional radia-
tion exposure relative to standard CT scans of the
chest. Commercial software allows for the inter-
activity of 2D and 3D images. The ability to examine
2D and 3D anatomic detail from multiple direc-
tions enables precise assessment of intraluminal and
extraluminal pathology. The authors’ experience indi-
cates that VB is a superb modality for assessing the
length of airway stenoses and ascertaining airway
patency distal to these lesions (Fig. 6). As such, VB
has proven to be extremely useful for determining
the feasibility of endobronchial procedures such as
dilations, stent placements, and laser ablation of en-
dobronchial tumors. Ferretti et al [27] observed that
VB is an excellent noninvasive means for long-term
monitoring of tracheobronchial stents. Furthermore,
the authors have found VB useful for guiding the
bronchoscopic evaluation of patients who have inter-
mittent hemoptysis secondary to lesions in periph-
eral airways. The 3D anatomic detail provided by
VB has proven useful for assessing the feasibility of
lung-sparing procedures in patients who have limited
pulmonary reserve and for sequentially evaluating
treatment response in patients who have inopera-
ble disease.
Currently, the main limitation of VB pertains to its
inability to evaluate the mucosal surface of the
respiratory tract reliably. Although form can be de-
tected, mucosal color, irregularity, or friability cannot

Fig. 6. (A, B) Virtual bronchoscopy revealing high-grade obstruction of the proximal left mainstem bronchus in lung cancer
patient. (C) Fiberoptic bronchoscopy confirmed tumor recurrence.
S.E. Finkelstein et al / Thorac Surg Clin 14 (2004) 79–86 85
be assessed. As such, VB cannot be used for routine
surveillance of patients at high risk of developing
airway malignancies. The development of novel aero-
solized contrast agents or spectroscopic techniques
that can discriminate benign versus malignant muco-
sal tissues might enhance the sensitivity and speci-
ficity of VB for the detection of preinvasive cancers
within the respiratory tract.
References
[1] Putnam Jr JB. New and evolving treatment methods
for pulmonary metastases. Semin Thorac Cardiovasc
Surg 2002;14(1):49–56.
[2] Sneller MC. Wegener’s granulomatous [clinical confer-
ence]. JAMA 1995;273:1288–91.
[3] McWilliams A, MacAulay C, Gazdar AF, et al. In-
novative molecular and imaging approaches for the
detection of lung cancer and its precursor lesions. On-
cogene 2002;21(45):6949–59.
[4] Colice GL, Chappel GJ, Frenchman SM, Solomon DA.
Comparison of computerized tomography with fiber-
optic bronchoscopy in identifying endobronchial ab-
normalities in patients with known or suspected lung
cancer. Am Rev Respir Dis 1985;131:397–400.
[5] Naidich DP, Lee JJ, Garay SM, McCauley DI, Aranda
CP, Boyd AD. Comparison of CT and fiberoptic bron-
choscopy in the evaluation of bronchial disease. AJR
Am J Roetgenol 1987;148:1–7.
[6] Harponik EF, Aquino SL, Vining DJ. Virtual bronchos-
copy. Clin Chest Med 1999;20:201–17.
[7] Dawn SK, Gotway MB, Webb WR. Multidetector-row
spiral computed tomography in the diagnosis of tho-
racic diseases. Respir Care 2001;46(9):912–21.
[8] Aquino SL, Vining DJ. Virtual bronchoscopy. Clin
Chest Med 1999;20:725–30.
[9] Pue CA, Pacht ER. Complications of fiberoptic bron-

S.E. Finkelstein et al / Thorac Surg Clin 14 (2004) 79–8686
choscopy at a university hospital. Chest 1995;107:
430–2.
[10] Summers RM, Sneller MC, Langford CA, Shelhamer
JH, Wood BJ. Improved virtual bronchoscopy using
a multi-slice helical CT scanner. In: Chen C-T,
Clough AV, editors. Medical imaging 2000: physi-
ology and function from multidimensional images.
Proceedings of SPIE, 3978. Bellingham,WA: SPIE;
2000. p. 117–21.
[11] Fleiter T, Merkle EM, Aschoff AJ, Lang G, Stein M,
Gorich J, et al. Comparison of real-time virtual and
fiberoptic bronchoscopy in patients with bronchial car-
cinoma: opportunities and limitations. AJR Am J
Roentgenol 1997;169:1591–5.
[12] Liewald F, Lang G, Fleiter TH, Sokiranski R, Halter G,
Orend KH. Comparison of virtual and fiberoptic bron-
choscopy. Thorac Cardiovasc Surg 1998;46:361–4.
[13] Rapp-Bernhardt U, Welte T, Budinger M, Bernhardt
TM. Comparison of three-dimensional virtual endos-
copy with bronchoscopy in patients with esophageal
carcinoma infiltrating the tracheobronchial tree. Br J
Radiol 1998;71:1271–8.
[14] Rapp-Bernhardt U, Welte T, Doehring W, Kropf S,
Bernhardt TM. Diagnostic potential of virtual bron-
choscopy: advantages in comparison with axial CT
slices, MPR, and MIP? Eur Radiol 2000;10:981–8.
[15] Hoppe H, Walder B, Sonnenschein M, et al. Multi-
detector CT virtual bronchoscopy to grade tracheo-
bronchial stenosis. AJR Am J Roentgenol 2002;178:
1195–200.
[16] Finkelstein SE, Summers RM, Nguyen DM, et al. Vir-
tual bronchoscopy for evaluation of malignant tumors
of the thorax. J Thorac Cardiovasc Surg 2002;123(5):
967–72.
[17] Finkelstein SE, Schrump DS, Nguyen DM, Hewitt
SM, et al. Comparative evaluation of super-high reso-
lution computed tomography and virtual bronchoscopy
for the detection of tracheobronchial malignancies.
Chest 2003(Nov);124(5):1834–40.
[18] LoCicero JR, Costello P, Campos CT, et al. Spiral CT
with multiplanar and three-dimensional reconstructions
accurately predicts tracheobronchial pathology. Ann
Thorac Surg 1996;62:811–7.
[19] Zeiberg AS, Silverman PM, Sessions RB, et al. Helical
(spiral) CT of the upper airway with three-dimensional
imaging: techniques and clinical assessment. AJR Am
J Roentgenol 1996;166:293–9.
[20] Ferretti GR, Vining DJ, Knoplioch J, et al. Tracheo-
bronchial tree: three-dimensional spiral CT with bron-
choscopic perspective. J Comput Assist Tomogr 1996;
20:777–81.
[21] Ferretti GR, Knoplioch J, Bricault I, et al. Central air-
way stenoses: preliminary results of spiral CT gener-
ated virtual bronchoscopy simulations in 29 patients.
Eur J Radiol 1997;7:854–9.
[22] Ferretti GR, Thony F, Bosson JL, et al. Benign abnor-
malities and carcinoid tumors of the central airways:
diagnostic impact of CT bronchography. AJR Am J
Roentgenol 2000;174:1307–13.
[23] Burke AJ, Vining DJ, McGuirt Jr WF, et al. Evaluation
of airway obstruction using virtual endoscopy. Laryn-
goscope 2000;110:23–9.
[24] Remy-Jardin M, Remy J, Artaud D, et al. Volume
rendering of the tracheobronchial tree: clinical evalua-
tion of bronchiographic images. Radiology 1998;208:
761–70.
[25] Ferretti GR, Bricault I, Coulomb M. Helical CT with
multiplanar and three-dimensional reconstruction of
nonneoplastic abnormalities of the trachea. JCAT
2001;25(3):400–6.
[26] Summers RM, Aggarwal NR, Sneller MC, et al. CT
virtual bronchoscopy of the central airways in Wegen-
er’s granulomatous. Chest 2002;121:242–50.
[27] Ferretti GR, Kocier M, Calaque O, Arbib F, Righini C,
Coulomb M, et al. Follow-up after stent insertion in the
tracheobronchial tree: role of helical computed tomog-
raphy in comparison with fiberoptic bronchoscopy. Eur
Radiol 2003;13(5):1172–8.

Thorac Surg Clin 14 (2004) 87–94
Chromoendoscopy and magnification endoscopy for
diagnosing esophageal cancer and dysplasia
Michael J. Connor, MDa, Prateek Sharma, MDa,b,*
aDivision of Gastroenterology and Hepatology, University of Kansas Medical Center, 3901 Rainbow Boulevard,
Kansas City, KS 66160, USAbDivision of Gastroenterology, Veterans Affairs Medical Center, 4801 E. Linwood Boulevard, Kansas City, MO 64128, USA
Early detection and classification of esophageal tries, primarily using exfoliative cytology methods,
cancer is an important task for the gastrointestinal
endoscopist. Two primary subtypes of esophageal car-
cinoma are commonly seen in the esophagus: squa-
mous cell carcinoma and adenocarcinoma. The
majority of esophageal malignancies are detected by
endoscopy at a late stage and are therefore cannot be
resected for cure. No obvious, endoscopically visible
premalignant stage exists for squamous cell carci-
noma of the esophagus; however, Barrett’s esophagus
is now recognized as an important risk factor for the
development of esophageal and esophagogastric junc-
tion adenocarcinoma.
Squamous cell carcinoma is the most common
esophageal malignancy in the world. Multiple envi-
ronmental and other factors have been shown to be
important in the pathogenesis of this carcinoma. In
industrialized countries, smoking, heavy alcohol in-
gestion, and achalasia are established risk factors.
Esophageal squamous cell carcinoma has also been
associated with head and neck cancer. Synchronous
or metachronous esophageal squamous cell carci-
noma has been reported in up to 15% of patients
who have head and neck carcinoma [1]. Widespread
screening for squamous cell carcinoma has been
attempted in Far Eastern and South American coun-
1547-4127/04/$ – see front matter D 2004 Elsevier Inc. All right
doi:10.1016/S1547-4127(04)00042-8
P. Sharma is supported by the Department of Veterans
Affairs Medical Center, Kansas City, Missouri, and the
American Gastroenterological Association (AGA) Castell
Esophageal Award.
* Corresponding author. Division of Gastroenterology,
Veterans Affairs Medical Center, 4801 E. Linwood Boule-
vard, Kansas City, MO 64128.
although the sensitivity and specificity of these tech-
niques are questionable. Identification of a target
population that would benefit from screening in the
United States is an important step in reducing mor-
bidity and mortality caused by this malignancy.
Barrett’s esophagus is defined as columnar-ap-
pearing mucosa of any length within the tubular
esophagus, with the histologic finding of intestinal
metaplasia [2]. The columnar-lined distal esophageal
mucosa can potentially contain three subtypes of
epithelium, including intestinal metaplasia, fundic,
and junctional. It has become clear that intestinal
metaplasia, with the presence of goblet cells by his-
tology, is the predominant premalignant epithelium
associated with dysplasia and adenocarcinoma. Cur-
rently, endoscopy with biopsy remains the gold stan-
dard for diagnosing Barrett’s esophagus. Standard
endoscopic techniques have been shown to be inac-
curate, with biopsies from short segments of colum-
nar-appearing mucosa generally revealing intestinal
metaplasia in only 40% to 60% of patients [3]. When
Barrett’s esophagus has been diagnosed, patients are
advised to enroll in a surveillance program. Current
guidelines suggest obtaining systematic four-quadrant
biopsies at 2 cm intervals from columnar-appearing
mucosa in the distal esophagus for the detection of
dysplasia or cancer [4]. Similar to the distribution of
metaplastic tissue, the presence of dysplasia or early
adenocarcinoma within a segment of Barrett’s esoph-
agus is patchy and focal. Standard endoscopy and
random biopsies might fail to detect these lesions [5].
Foci of unsuspected carcinoma have been found in up
to 73% of resected specimens when esophagectomy
is performed for high-grade dysplasia [6].
s reserved.

M.J. Connor, P. Sharma / Thorac Surg Clin 14 (2004) 87–9488
In squamous cell dysplasia, no visible endoscopic
lesions such as plaques, nodules, or ulcers are seen
regularly. Because of the patchy occurrence of dys-
plastic and cancerous lesions within the esophagus,
the sensitivity of standard biopsy techniques is low.
Because of these limitations, new techniques have
been used in an attempt to maximize the sensitivity
and overall accuracy of endoscopy and biopsy for the
diagnosis of squamous dysplasia, squamous cell
carcinoma, Barrett’s esophagus, and associated dys-
plasia/early cancer. Chromoendoscopy and magnifi-
cation endoscopy stand at the forefront of these
modalities because of their availability, ease of use,
and low cost. This article summarizes the basic chro-
moendoscopic and magnification techniques used for
the detection of metaplastic, dysplastic, and malig-
nant tissue in the esophagus and examines the current
literature regarding this subject.
Chromoendoscopy
Chromoendoscopy employs chemical staining
agents applied to the gastrointestinal mucosa to iden-
tify specific subtypes of epithelia or to highlight
surface characteristics of the epithelium. Chromoen-
doscopy has been used in several regions of the gas-
trointestinal tract including the esophagus, stomach,
duodenum, and colon to aid the characterization of
multiple disease states. Recently, the use of methyl-
ene blue-assisted chromoendoscopy was shown to
increase the yield of detecting dysplasia and cancer
in patients undergoing surveillance colonoscopy for
inflammatory bowel disease [7].
For squamous cell carcinoma, chromoendoscopy
is used to detect metachronous or synchronous le-
sions and to define the extent of dysplasia or cancer.
In the setting of Barrett’s esophagus, chromoendos-
copy is performed to allow targeting of biopsies to
increase the accuracy of detecting intestinal metapla-
sia and dysplasia. Two types of tissue staining are
used in the esophagus. Vital (absorptive) stains such
as Lugol’s solution and methylene blue are taken up
by esophageal mucosa actively. Contrast stains are
not absorbed, but they highlight the surface of the
mucosa, allowing for the identification of minute
lesions and subtle patterns. Contrast stains currently
used in the esophagus include indigo carmine, tolu-
idine blue, and dilute acetic acid solution.
Tissue staining is performed using multiple steps
with the goal of removing surface mucous and other
material before staining, which allows for maximal
contact of the agent with the epithelium. Tissue stains
are typically applied directly onto the mucosal sur-
face during endoscopy using a spray catheter [8].
After the stain is applied, water rinses are performed
to remove excess stain and allow for the most ac-
curate visualization of the mucosa.
Lugol’s solution
Lugol’s solution is an inexpensive, widely avail-
able solution comprising a mixture of iodine and
potassium iodide. This vital stain is absorbed by
glycogen-containing, nonkeratinized squamous epi-
thelium, the normal tissue type in the esophagus.
Lugol’s-stained tissue will characteristically turn
green–brown. The intensity is partly dependent upon
the amount of glycogen present within the epithelium.
This stain is used as a 1% or 2% solution in a volume
of 20 to 50 mL sprayed through endoscopic catheters.
Inflammatory or dysplastic squamous epithelium,
squamous cell carcinoma, and columnar epithelium
will not stain with Lugol’s solution. The most widely
accepted use of Lugol’s solution currently involves
screening for squamous cell carcinoma of the esopha-
gus in high-risk patients and in patients who have
documented squamous cell dysplasia/cancer to rule
out synchronous lesions (Fig. 1A, B).
Many investigators have used Lugol’s solution in
an attempt to identify early, treatable squamous cell
carcinomas of the esophagus. Muto et al used Lugol’s
chromoendoscopy of the esophagus in 389 patients
who had newly diagnosed squamous cell carcinoma
of the head and neck. In this population 54 patients
(14%) had synchronous squamous cell carcinoma of
the esophagus. Fifty-five percent of the patients who
had irregular, multiform regions of Lugol’s-voiding
mucosa had squamous cell carcinoma [1]. Fagunda
et al identified 190 asymptomatic patients who had
multiple risk factors (eg, prior head and neck carci-
noma, alcohol abuse, dietary factors, tobacco use) for
the development of squamous cell carcinoma of the
esophagus, then performed Lugol’s chromoendos-
copy. They found a higher rate of dysplastic mucosa
in biopsies taken from unstained areas than stained
areas, with a sensitivity of 46% and a specificity of
90%; however, the positive predictive value was only
26% [9]. Mori et al applied Lugol’s solution to
24 specimens of resected esophagus and attempted
to grade staining patterns into four types: (1) grade I,
hyperstaining; (2) grade II, normal green–brown
staining; (3) grade III, less intense staining; and (4)
grade IV, unstained. The authors established that
cancers and high-grade dysplasia tended to exhibit
the grade IV pattern, whereas low-grade dysplasia
tended to exhibit the grade III pattern. Margins
between normal squamous mucosa and carcinoma
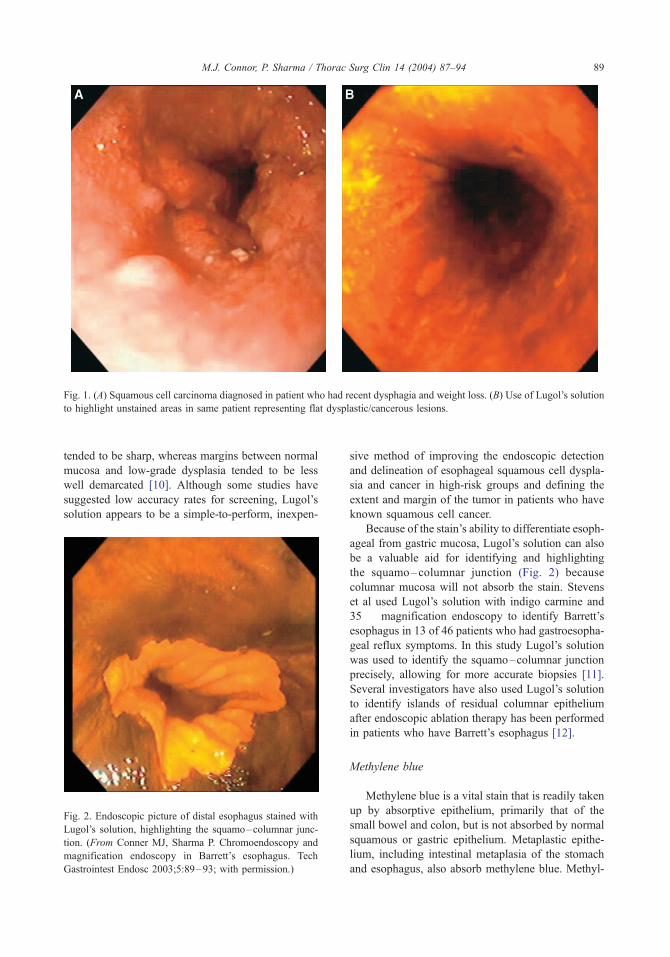
Fig. 1. (A) Squamous cell carcinoma diagnosed in patient who had recent dysphagia and weight loss. (B) Use of Lugol’s solution
to highlight unstained areas in same patient representing flat dysplastic/cancerous lesions.
M.J. Connor, P. Sharma / Thorac Surg Clin 14 (2004) 87–94 89
tended to be sharp, whereas margins between normal
mucosa and low-grade dysplasia tended to be less
well demarcated [10]. Although some studies have
suggested low accuracy rates for screening, Lugol’s
solution appears to be a simple-to-perform, inexpen-
Fig. 2. Endoscopic picture of distal esophagus stained with
Lugol’s solution, highlighting the squamo–columnar junc-
tion. (From Conner MJ, Sharma P. Chromoendoscopy and
magnification endoscopy in Barrett’s esophagus. Tech
Gastrointest Endosc 2003;5:89–93; with permission.)
sive method of improving the endoscopic detection
and delineation of esophageal squamous cell dyspla-
sia and cancer in high-risk groups and defining the
extent and margin of the tumor in patients who have
known squamous cell cancer.
Because of the stain’s ability to differentiate esoph-
ageal from gastric mucosa, Lugol’s solution can also
be a valuable aid for identifying and highlighting
the squamo–columnar junction (Fig. 2) because
columnar mucosa will not absorb the stain. Stevens
et al used Lugol’s solution with indigo carmine and
35 � magnification endoscopy to identify Barrett’s
esophagus in 13 of 46 patients who had gastroesopha-
geal reflux symptoms. In this study Lugol’s solution
was used to identify the squamo–columnar junction
precisely, allowing for more accurate biopsies [11].
Several investigators have also used Lugol’s solution
to identify islands of residual columnar epithelium
after endoscopic ablation therapy has been performed
in patients who have Barrett’s esophagus [12].
Methylene blue
Methylene blue is a vital stain that is readily taken
up by absorptive epithelium, primarily that of the
small bowel and colon, but is not absorbed by normal
squamous or gastric epithelium. Metaplastic epithe-
lium, including intestinal metaplasia of the stomach
and esophagus, also absorb methylene blue. Methyl-

M.J. Connor, P. Sharma / Thorac Surg Clin 14 (2004) 87–9490
ene blue has been used successfully to aid in the
identification of gastric intestinal metaplasia and dys-
plasia [13]. Because of these properties, this stain can
be potentially beneficial in the distal esophagus. Be-
fore applying the stain, surface mucous must be re-
moved to expose as much surface area as possible for
staining. N-acetylcysteine solution is generally used
for this purpose. Next, depending on the length of
Barrett’s esophagus, 10 to 20 mL of 0.5% methylene
blue solution is sprayed onto the mucosa. The stained
area is then irrigated vigorously with water. Staining
becomes apparent within 2 to 3 minutes and generally
fades within 15 to 20 minutes (Fig. 3A, B) [14].
Several studies have evaluated the usefulness of
methylene blue staining for the identification of
intestinal metaplasia in the esophagus. Canto et al
compared methylene blue-directed biopsies with ran-
dom biopsies in 43 patients who had Barrett’s esopha-
gus. Intestinal metaplasia was found in 91% of
methylene blue-targeted biopsies versus 69% of ran-
dom biopsies (P = 0.0001). Using methylene blue-
targeted biopsies also enabled the endoscopist to
identify intestinal metaplasia using fewer overall
biopsies per patient (9.5 versus 14.1; P = 0.0001)
[15]. Sharma et al performed methylene blue-guided
target biopsies in 75 patients who had endoscopically
suspected short-segment Barrett’s esophagus. This
group was compared with a control group of 83 pa-
Fig. 3. (A) Short segment of columnar mucosa in the distal esophagu
methylene blue staining within the columnar mucosa after washing t
stained areas revealed intestinal metaplasia. (From Sharma P
chromoendoscopy for detection of short-segment Barrett’s esophagu
tients who had short-segment Barrett’s esophagus
who had undergone standard endoscopic random
biopsies. Intestinal metaplasia was detected in 61%
of the methylene blue group versus 42% of the con-
trol group (P = 0.016), and fewer biopsy specimens
were required in the methylene blue group [16]. This
study highlighted that methylene blue-targeted bi-
opsies might increase the diagnosis of short segments
of intestinal metaplasia in the distal esophagus.
Other studies have not demonstrated a significant
benefit of methylene blue staining in the identifica-
tion of intestinal metaplasia or dysplasia. In a non-
blinded study Dave et al performed methylene blue
staining with biopsies on nine patients who had Bar-
rett’s esophagus. Methylene blue staining was found
to have only 57% sensitivity and 32% specificity for
the detection of specialized intestinal metaplasia.
Furthermore, procedure times were longer and more
patient discomfort was recorded compared with
standard upper endoscopy [17]. Wo et al studied
47 patients who had columnar-lined esophagus in a
prospective, randomized crossover trial. They found
that the sensitivity and specificity of methylene blue
for the detection of specialized intestinal metaplasia
were 53% and 51%, respectively. No significant dif-
ferences were found in the detection of intestinal
metaplasia and dysplasia between methylene blue-
directed and standard biopsy methods [18]. Thus, use
s in the form of multiple tongue-like projections. (B) Areas of
he distal esophagus with water; target biopsies from the blue-
, Topalovski M, Mayo M, Weston A. Methylene blue
s. Gastrointest Endosc 2001;54(3):289–93; with permission.)

M.J. Connor, P. Sharma / Thorac Surg Clin 14 (2004) 87–94 91
of methylene blue in patients who have Barrett’s
esophagus has yielded conflicting results, and its
general use remains controversial.
The use of methylene blue staining in surveillance
protocols to identify dysplasia also is controversial. In
a single-center study, Canto et al were able to diagnose
dysplasia and adenocarcinoma more accurately with
methylene blue-directed biopsies than with ran-
dom biopsies. The authors classified the degree tissue
staining according to pattern, intensity, and heteroge-
neity. High grades of dysplasia stained less intensely
with methylene blue, presumably because of the de-
creased number of goblet cells and the higher nuclear-
to-cytoplasmic ratio. Dysplastic regions also tended to
display a higher degree of stain heterogeneity than
nondysplastic regions [19]. Use of methylene blue in
this situation (ie, for detection of neoplastic lesions)
needs to be studied further.
High-resolution/high-magnification endoscopy
High-resolution imaging improves the ability of
the endoscopist to discriminate between two closely
approximated points. High-resolution endoscopes
provide magnified views of the gastrointestinal tract
with greater mucosal detail. These instruments are
capable of discriminating lesions 10 to 71 microns
apart, compared with the naked eye, which is only
capable of discriminating lesions 125 to 165 microns
apart. The technique of magnification is relatively
simple. A cap is fitted onto the distal tip of the en-
doscope, allowing the mucosa in contact with the cap
to be magnified without the motility of the esophagus
affecting visualization. Magnification is performed by
using a lever located next to the up/down knob of the
endoscope. When the lever is depressed fully, mag-
nification of up to 115 � can be achieved (Olympus
GIF-Q160Z Olympus, Melville, New York) [20].
Use of magnification endoscopy in Barrett’s
esophagus and dysplasia
The combination of chromoendoscopy with mag-
nification endoscopy has been used for more accurate
identification of Barrett’s esophagus and dysplasia.
Endo et al used 80 � magnification endoscopy with
methylene blue staining in 30 patients who had a
columnar-lined distal esophagus. Five discreet stain-
ing patterns were identified: (1) small/round (21 seg-
ments), (2) straight (8 segments); (3) long oval
(26 segments), (4) tubular (10 segments), and (5) vil-
lous (2 segments). The percentage of biopsy speci-
mens containing specialized columnar epithelium
from the long oval, tubular, and villous types were
40%, 100%, and 100%, respectively. Intestinal meta-
plasia was detected infrequently in specimens taken
from mucosa exhibiting the small/round or straight-
type patterns, but specimens from tubular and villous
patterns contained predominantly intestinal-type epi-
thelium [21]. This study showed that specific patterns
(ie, tubular and villous) observed under magnification
might help in identifying intestinal metaplasia.
Indigo carmine is a contrast stain that has been
shown to be useful in the detection and differentia-
tion of colon polyps. It has also been used in conjunc-
tion with magnification endoscopy to identify areas
of intestinal metaplasia and dysplasia within colum-
nar-lined esophageal mucosa. Sharma et al studied
80 patients who had columnar-lined distal esophagus
using indigo carmine dye and 115 � magnification
endoscopy. Three mucosal patterns were identified:
(1) ridged/villous, (2) circular, and (3) irregular/dis-
torted (Fig. 4A–C). Regions exhibiting the ridged/
villous pattern were found to have the highest yield of
intestinal metaplasia (97%) versus regions exhibiting
the circular pattern (17%). Six patients had the
irregular/distorted pattern, and all of these patients
were found to have histologic findings of high-grade
dysplasia. Low-grade dysplasia was detected in
18 patients, all of whom exhibited the ridged/villous
pattern. This technique proved useful for detecting
intestinal metaplasia and high-grade dysplastic le-
sions; however, it was unable to differentiate between
low-grade dysplastic lesions and nondysplastic epi-
thelium [22]. Stevens et al also used indigo carmine
with 35 � magnification endoscopy to identify short
segments of intestinal metaplasia. Identification of a
raised, villiform surface pattern correlated well with
the histologic finding of intestinal metaplasia in 13 of
46 patients who had gastroesophageal reflux dis-
ease [23].
By using magnification endoscopy with a contrast
stain such as indigo carmine, patterns are detected that
might suggest the presence of intestinal metaplasia
or dysplasia. Based on these studies, enhanced mag-
nification endoscopy appears to be a useful surveil-
lance tool for the detection of unsuspected dysplasia
or cancer and for screening for intestinal metaplasia of
the esophagus.
Acetic acid, another contrast agent, has been
studied extensively as an aid in the detection of small
lesions in the uterine cervical mucosa during colpos-
copy. It has recently been used in conjunction with
magnification endoscopy to improve screening for
Barrett’s esophagus. Five to 10 mL of 1.5% acetic
acid solution is sprayed onto the distal esophagus
using a spray catheter. Following application, the

Fig. 4. Three distinct patterns observed under magnification (115 �) after spraying indigo carmine in patients who had Barrett’s
esophagus. (A) Ridged villous. (B) Irregular/distorted. (C) Circular. (From Sharma P, Weston A, Topalovski M, et al. Mag-
nification chromoendoscopy for the detection of intestinal metaplasia and dysplasia in Barrett’s esophagus. Gut 2003;52:24–7;
with permission.)
M.J. Connor, P. Sharma / Thorac Surg Clin 14 (2004) 87–9492
esophageal and gastric mucosa turn white. Within 2 to
3 minutes the esophagus remains white and the
columnar epithelium turns reddish. Guelrud et al used
acetic acid to improve detection of residual islands
of Barrett’s esophagus after endoscopic ablation ther-
apy in 21 patients. In 11 patients, acetic acid demon-
strated small remnant islands of columnar epithelium
that were not visualized before acetic acid instillation
[24]. The authors later used acetic acid in conjunction
with magnification endoscopy to identify intestinal
metaplasia in 49 patients who had suspected short-
segment Barrett’s esophagus. In this study four mu-
cosal patterns were identified: (1) round, (2) reticular,
(3) villous, and (4) ridged. Mucosa exhibiting the
villous and ridged patterns yielded intestinal meta-
plasia in 87% and 100% of biopsy specimens, re-
spectively [25].
Summary
Based on preliminary reports, the use of chromo-
endoscopy and magnification endoscopy appears to
be a valuable adjunct to standard endoscopy for the
detection and classification of metaplastic and dys-
plastic lesions of the esophagus. Ideally, the use of
this technique would enable the endoscopist to rule in
or out the presence of intestinal metaplasia and

M.J. Connor, P. Sharma / Thorac Surg Clin 14 (2004) 87–94 93
dysplastic/cancerous epithelium by obtaining only a
minimal number of targeted biopsy specimens—or
potentially taking no biopsies at all, which could
transform upper endoscopy into a much more effec-
tive screening and surveillance tool.
There are several problems with the use of chro-
moendoscopy and magnification endoscopy in the
esophagus. This technique is operator-dependent
(ie, dependent on the skill and experience of the en-
doscopist). Studies reporting the accuracy of chromo-
endoscopy remain mixed, especially for Barrett’s
esophagus and dysplasia, which is likely explained
by differences in techniques and materials used in the
investigations. Staining within the esophagus is often
patchy and uneven. Poor spraying technique can
exaggerate irregular uptake by the mucosa. There is
a high false-positive rate when staining gastric-type
epithelium or in the setting of inflammation. Areas of
dysplasia or cancer might take up stain in an irregular
manner or might not stain at all. Magnification only
allows the endoscopist to observe small areas of
mucosa at a time, increasing the overall difficulty of
the procedure and procedure length.
Currently, the greatest body of literature exists
concerning the use of Lugol’s solution for the diag-
nosis of squamous cell dysplasia/carcinoma of the
esophagus and methylene blue for diagnosing Bar-
rett’s esophagus. If used consistently by practicing
physicians, the accuracy of biopsies could be im-
proved. If endoscopic ablative therapy for high-grade
dysplasia and early carcinoma (eg, photodynamic
therapy and endoscopic mucosal resection) becomes
accepted, sensitive methods of detecting residual
metaplastic or dysplastic epithelium after ablation
will be needed to help guide additional endoscopic
therapy. Chromoendoscopy and magnification endos-
copy could prove helpful in this setting.
Further research in this field needs to be per-
formed. As a first step, a uniform classification sys-
tem for staining and magnification patterns should be
devised. Future studies could then be performed
using consistent terminologies. More controlled in-
vestigations with larger numbers of patients must be
performed before tissue staining and magnification
endoscopy become a part of day-to-day endoscopic
practice. Lugol’s chromoendoscopy is a simple tech-
nique for the detection of synchronous squamous
dysplasia and cancer, but a substantial amount of
work remains to be performed for the validation of
chromoendoscopy for the detection of Barrett’s
esophagus and dysplasia. The ultimate aim of chro-
moendoscopy and magnification endoscopy in the
esophagus is to show improved outcomes (ie, early
detection of cancer and improved survival). These
goals have not yet been realized and will require well-
designed studies in the future.
References
[1] Muto M, Hironaka S, Nakane M, Boku N, Ohtsu A,
Yoshida A. Association of multiple Lugol-voiding le-
sions with synchronous and metachronous esophageal
squamous cell carcinoma in patients with head and
neck cancer. Gastrointest Endosc 2002;56(4):517–21.
[2] Sharma P. Barrett’s esophagus: definition and diag-
nosis. In: Sharma P, Sampliner R, editors. Barrett’s
esophagus and esophageal adenocarcinoma. Malden
(MA): Blackwell Science; 2001. p. 1–7.
[3] Eloubeidi M, Homan R, Martz M, Theobald K, Pro-
venzale D. A cost analysis of outpatient care for
patients with Barrett’s esophagus in a managed care
setting. Am J Gastroenterol 1999;94:2033–6.
[4] Sampliner R. Practice guidelines for BE. Am J Gastro-
enterol 1998;93:1028–32.
[5] Cameron A, Carpenter H. Barrett’s esophagus, high-
grade dysplasia, and early adenocarcinoma: a patho-
logical study. Am J Gastroenterol 1997;92:586–91.
[6] Falk G, Rice T, Goldblum J, Richter J. Jumbo biopsy
protocol still misses unsuspected cancer in Barrett’s
esophagus with high-grade dysplasia. Gastrointest
Endosc 1999;49:170–6.
[7] Kiesslich R, Fritsch J, Holtmann M, Koehler H, Stolte
M, Kansler S, et al. Methylene blue-aided chromoen-
doscopy for the detection of intraepithelial neoplasia
and colon cancer in ulcerative colitis. Gastroenterology
2003;124:880–8.
[8] Fennerty MB. Tissue staining (chromoscopy) of the
gastrointestinal tract. Can J Gastroenterol 1999;13(5):
423–9.
[9] Fagunda RB, de Barros SG, Putten AC, Mello ES,
Wagner M, Bassi LA, et al. Occult dysplasia is dis-
closed by Lugol chromoendoscopy in alcoholics at
high risk for squamous cell carcinoma of the esopha-
gus. Endoscopy 1999;31(4):281–5.
[10] Mori M, Adachi Y, Matsushima T, Matsuda H, Sugi-
machi K. Lugol staining pattern and histology of
esophageal lesions. Am J Gastroenterol 1993;88(5):
701–5.
[11] Stevens P, Lightdale C, Green P, Siegel L, Garcia-Car-
rasqullo R, Rotterdam H. Combined magnification en-
doscopy with chromoendoscopy for the evaluation of
Barrett’s esophagus. Gastrointest Endosc 1994;40(6):
747–9.
[12] Overholt BF, Panjehpour M, Haydek JM. Photody-
namic therapy for Barrett’s esophagus: follow-up in
100 patients. Gastrointest Endosc 1999;49:1–7.
[13] Dinis-Ribeiro M, da Costa-Pereira A, Lopes C, Lara-
Santos L, Guilherme M, Moreira-Dias L, et al. Magni-
fication chromoendoscopy for the diagnosis of gastric
intestinal metaplasia and dysplasia. Gastrointest En-
dosc 2003;57(4):498–504.

M.J. Connor, P. Sharma / Thorac Surg Clin 14 (2004) 87–9494
[14] Fennerty MB. Tissue staining. Gastrointest Endosc
Clin N Am 1994;4(2):297–311.
[15] Canto MI, Setrakian S, Willis J, Chak A, Petras R,
Powe N, et al. Methylene blue-directed biopsies im-
prove detection of intestinal metaplasia and dyspla-
sia in Barrett’s esophagus. Gastrointest Endosc 2000;
51(5):560–7.
[16] Sharma P, Topalovski M, Mayo M, Weston A. Methyl-
ene blue chromoendoscopy for detection of short-seg-
ment Barrett’s esophagus. Gastrointest Endosc 2001;
54(3):289–93.
[17] Dave U, Shousha S, Westaby D. Methylene blue stain-
ing: is it really useful in Barrett’s esophagus? Gastro-
intest Endosc 2001;53(3):333–5.
[18] Wo J, Ray M, Mayfield-Stokes S, Al-Sabbagh G, Geb-
rail F, Slone S, et al. Comparison of methylene blue-
directed biopsies and conventional biopsies in the
detection of intestinal metaplasia and dysplasia in
Barrett’s esophagus: a preliminary study. Gastrointest
Endosc 2001;54(3):294–301.
[19] Canto MI, Setrakian S, Willis J, Chak A, Petras R,
Sivak M. Methylene blue staining of dysplastic and
nondysplastic Barrett’s esophagus: an in vivo and ex
vivo study. Endo 2001;33(5):391–400.
[20] ASGE Technology Committee. ASGE technology sta-
tus evaluation report: high-resolution and high-magni-
fication endoscopy. Gastrointest Endosc 2000;52(6):
864–6.
[21] Endo T, Awakawa T, Takahashi H, Arimura Y, Itoh F,
Yamashita K, et al. Classification of Barrett’s epithe-
lium by magnifying endoscopy. Gastrointest Endosc
2002;55(6):641–7.
[22] Sharma P, Weston A, Topalovski M, Cherian R, Bhat-
tacharrya A, Sampliner RE. Magnification chromo-
endoscopy for the detection of intestinal metaplasia
and dysplasia in Barrett’s esophagus. Gut 2003;52:
24–7.
[23] Stevens P, Lightdale C, Green P, Siegel L, Garcia-Car-
rasquillo R, Rotterdam H. Combined magnification
endoscopy with chromoendoscopy for the evaluation
of Barrett’s esophagus. Gastrointest Endosc 1994;
40(6):747–9.
[24] Guelrud M, Herrera I, Essenfeld H, Castro J. Enhanced
magnification endoscopy: a new technique to identify
specialized intestinal metaplasia in Barrett’s esopha-
gus. Gastrointest Endosc 2001;53(6):559–65.
[25] Guelrud M, Herrera I. Acetic acid improves identifica-
tion of remnant islands of Barrett’s epithelium after
endoscopic therapy. Gastrointest Endosc 1998;47(6):
512–5.

Thorac Surg Clin 14 (2004) 95–112
Radionuclide imaging of thoracic malignancies
Stanley J. Goldsmith, MDa,b,*, Lale A. Kostakoglu, MDa,b,Serge Somrov, MDb, Christopher J. Palestro, MDc,d
aWeill Medical College, Cornell University, 1300 York Avenue, New York, NY 10021, USAbDivision of Nuclear Medicine, New York Presbyterian Hospital, Weill Cornell Medical Center, 525 East 68th Street,
New York, NY 10021, USAcAlbert Einstein College of Medicine, Yeshiva University, 1300 Morris Park Avenue, Bronx, NY 10461, USA
dDivision of Nuclear Medicine, Long Island Jewish Medical Center, 270-05 76th Avenue, New Hyde Park, NY 11040, USA
Thoracic masses are usually detected by chest ated over time. Both approaches carry the risk of
radiograph or CT during a screening procedure, as
part of a routine physical examination, or in the
evaluation of some symptom or sign referable to the
thoracic structures such as chest pain, cough, hemop-
tysis, wheezing, or dyspnea. The most common
malignant tumor of the thorax is carcinoma of the
lung, specifically the non–small-cell type, which
includes adenocarcinoma and squamous cell carci-
noma. Other masses requiring different manage-
ment are also encountered, including small-cell lung
carcinoma; bronchial carcinoid (benign and malig-
nant); mediastinal masses, including thymoma, tera-
tomas, lymphomas, and metastases from carcinomas
such as breast, colon, head and neck tumors, thy-
roid carcinoma, and choriocarcinoma. In addition,
carcinoma of the lung might be present as a second
primary in patients known to have one of these
other malignancies.
Traditionally, when a pulmonary mass has been
identified a decision must be made regarding whether
to perform a biopsy or surgical resection to charac-
terize the lesion as a neoplasm versus granuloma or
other inflammatory lesion and to determine a suitable
course of management. In some instances surgical
intervention is deferred and the lesion is reevalu-
1547-4127/04/$ – see front matter D 2004 Elsevier Inc. All right
doi:10.1016/S1547-4127(04)00034-9
* Corresponding author. Division of Nuclear Medicine,
New York Presbyterian Hospital, Weill Cornell Medical
Center, 525 East 68th Street, New York, NY 10021.
E-mail address: [email protected]
(S.J. Goldsmith).
performing unnecessary surgery with the potential
attendant morbidity or delaying evaluation with the
associated risk of disease progression. This approach
to management of the patient who has a thoracic
lesion is rapidly changing with the development of
nuclear medical imaging procedures that are capable
of characterizing lesions according to their molecular
biology. Radionuclide imaging is based on tissue or
tumor function, metabolism, or other biochemical
characteristics that provide information that is com-
plementary to traditional diagnostic imaging tech-
niques in terms of assessing if a lesion is malignant
or not, and if malignant, determining the extent
of disease.
In recent years radionuclide imaging has made
great progress as a consequence of the development
of novel radiolabeled compounds, which identify
specific molecular processes and remarkable ad-
vances in the instrumentation used for acquisition
and display. Nuclear medicine imaging has pro-
gressed to the point where it can provide crucial
information about lesion biology and can thus play
an integral part in the evaluation and management
of the patient who has a suspected or known
pulmonary malignancy, including noninvasive char-
acterization of the solitary pulmonary nodule, as-
sessment of the extent of disease in the patient
who has a known malignancy, planning and optimiz-
ing radiation therapy, monitoring the response to
treatment, and even predicting prognosis. State-of-
the-art nuclear medicine imaging is clinically effica-
cious and cost-effective, leading to more accurate
s reserved.

S.J. Goldsmith et al / Thorac Surg Clin 14 (2004) 95–11296
diagnoses at less risk and lower cost to the patient
and to society.
Technical advances
Nuclear medicine instrumentation
Nuclear medicine images, or scintigraphs, are
generated by the external detection of emissions from
radioactive isotopes that localize in certain tissues,
organs, physiologic or pathophysiologic processes, or
lesions. In the past, conventional nuclear medicine
images were so-called planar images; data were re-
corded in multiple views: anterior, posterior, lateral,
and oblique. Each image compressed the data ob-
tained from the volume image into two dimensions,
resulting in the loss of object contrast caused by the
presence of background radioactivity (ie, radio-
activity surrounding the object of interest). More
recently, nuclear medicine has evolved toward
tomographic imaging. In recent years clinicians and
radiologists have become familiar with tomographic
images as a result of the broad application of CT
and, more recently, MRI (ie, transaxial slice images
derived from reconstructed transmission data). Data
are recorded in 360� geometry around the patient.
Initially, backprojection techniques were used to
create transverse, or transaxial, images (slices) that
revealed the distribution of radioactivity, or, in the
case of CT, absorption coefficient maps. Tomo-
graphic imaging is a more accurate representation of
the actual distribution of radioactivity in a patient
and results in improved image detail. Tomographic
radionuclide imaging can be performed with single-
photon or positron-emitting radionuclides.
Single-photon emission CT (SPECT) is the tomo-
graphic imaging technology employed with tra-
ditional radionuclides such as 99mTechnetium,67Gallium (67Ga), and 201Thallium (201Tl). SPECT
uses traditional collimated gamma camera position-
ing logic. Data are obtained at small angular inter-
vals as the camera revolves around the patient. A
gamma camera with a single detector must acquire
data over 360�, whereas a device with two or three
detector units requires that each head orbit only a
fraction of the full circumference. Multihead sys-
tems permit greater data acquisition over a shorter
period of time with a resultant improvement in image
quality. Data acquired by the gamma camera are
reconstructed into transaxial planes using sophis-
ticated processing algorithms such as filtered back-
projection and iterative reconstruction. In addition to
the transaxial images, images from the coronal and
sagittal planes are reconstructed readily. Modern
computer capacity also makes it feasible to view
three-dimensional, or volume, images.
Positron emission tomography (PET) is based
upon the unique decay characteristics of positrons.
A positron undergoes annihilation by combining
with a negatively charged electron. As a result of
this annihilation, two 511 keV gamma rays are
emitted 180� apart. Special electronics determine if
two recorded events are coincident, thus identifying
the axis along which the two photons were emitted,
which provides a significant advantage in terms of
reconstructing the position of an event and allowing
for the elimination of cumbersome lead collimators.
In contrast to SPECT, in which single events are
detected, PET makes use of two detector elements
on opposite sides of the subject to detect coincident
photons arising from the annihilation of a positron
and electron. Most PET radiopharmaceuticals have
short half-lives; consequently, until just a few years
ago PET imaging was limited to centers that had
cyclotron production facilities. After numerous
investigational studies confirmed the value and
cost-effectiveness of PET imaging with fluorine-
18-fluorodeoxyglucose (18FDG) in the management
of patients who have tumors, third-party insurers and
eventually governmental agencies approved the tech-
nique for reimbursement. Despite its short (2-hour)
half-life, 18FDG is now available from commercial
sources in most of the United States.
Until recently, PET imaging devices cost more
than $1 million and were available only at larger
centers. The contribution of this technology to patient
management, however, has been so significant that
this situation is changing rapidly. The increased clini-
cal demand for these studies has stimulated develop-
ment of less costly instrumentation, and a spectrum
of devices is now available including a $250,000 to
$350,000 upgrade of conventional dual detector
gamma camera systems, a 360� simultaneous acqui-
sition imaging system that uses six large curvi-
linear sodium iodide crystals (costing approximately
$1.3–1.5 million), and bismuth germanate multi-
crystal, multiring systems (costing $1.7–2.3 million).
Using a phantom in an experimental comparison
of a gamma camera-based coincidence imaging sys-
tem with a dedicated ring detector PET system, the
dedicated PET system identified nodules as small as
6 mm in diameter, whereas the camera-based system
resolved 1 cm and larger lesions [1]. There has been
no direct comparison between imaging with the dedi-
cated ring system and the less expensive devices in the
clinical milieu. A meta-analysis published in 2001
found that the performance of the camera-based
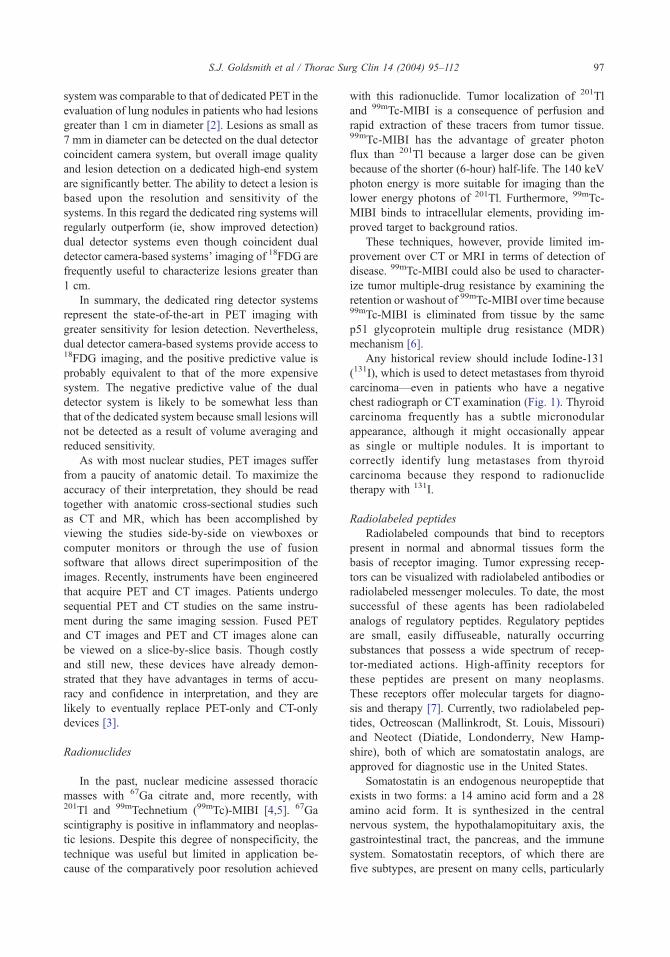
S.J. Goldsmith et al / Thorac Surg Clin 14 (2004) 95–112 97
system was comparable to that of dedicated PET in the
evaluation of lung nodules in patients who had lesions
greater than 1 cm in diameter [2]. Lesions as small as
7 mm in diameter can be detected on the dual detector
coincident camera system, but overall image quality
and lesion detection on a dedicated high-end system
are significantly better. The ability to detect a lesion is
based upon the resolution and sensitivity of the
systems. In this regard the dedicated ring systems will
regularly outperform (ie, show improved detection)
dual detector systems even though coincident dual
detector camera-based systems’ imaging of 18FDG are
frequently useful to characterize lesions greater than
1 cm.
In summary, the dedicated ring detector systems
represent the state-of-the-art in PET imaging with
greater sensitivity for lesion detection. Nevertheless,
dual detector camera-based systems provide access to18FDG imaging, and the positive predictive value is
probably equivalent to that of the more expensive
system. The negative predictive value of the dual
detector system is likely to be somewhat less than
that of the dedicated system because small lesions will
not be detected as a result of volume averaging and
reduced sensitivity.
As with most nuclear studies, PET images suffer
from a paucity of anatomic detail. To maximize the
accuracy of their interpretation, they should be read
together with anatomic cross-sectional studies such
as CT and MR, which has been accomplished by
viewing the studies side-by-side on viewboxes or
computer monitors or through the use of fusion
software that allows direct superimposition of the
images. Recently, instruments have been engineered
that acquire PET and CT images. Patients undergo
sequential PET and CT studies on the same instru-
ment during the same imaging session. Fused PET
and CT images and PET and CT images alone can
be viewed on a slice-by-slice basis. Though costly
and still new, these devices have already demon-
strated that they have advantages in terms of accu-
racy and confidence in interpretation, and they are
likely to eventually replace PET-only and CT-only
devices [3].
Radionuclides
In the past, nuclear medicine assessed thoracic
masses with 67Ga citrate and, more recently, with201Tl and 99mTechnetium (99mTc)-MIBI [4,5]. 67Ga
scintigraphy is positive in inflammatory and neoplas-
tic lesions. Despite this degree of nonspecificity, the
technique was useful but limited in application be-
cause of the comparatively poor resolution achieved
with this radionuclide. Tumor localization of 201Tl
and 99mTc-MIBI is a consequence of perfusion and
rapid extraction of these tracers from tumor tissue.99mTc-MIBI has the advantage of greater photon
flux than 201Tl because a larger dose can be given
because of the shorter (6-hour) half-life. The 140 keV
photon energy is more suitable for imaging than the
lower energy photons of 201Tl. Furthermore, 99mTc-
MIBI binds to intracellular elements, providing im-
proved target to background ratios.
These techniques, however, provide limited im-
provement over CT or MRI in terms of detection of
disease. 99mTc-MIBI could also be used to character-
ize tumor multiple-drug resistance by examining the
retention or washout of 99mTc-MIBI over time because99mTc-MIBI is eliminated from tissue by the same
p51 glycoprotein multiple drug resistance (MDR)
mechanism [6].
Any historical review should include Iodine-131
(131I), which is used to detect metastases from thyroid
carcinoma—even in patients who have a negative
chest radiograph or CT examination (Fig. 1). Thyroid
carcinoma frequently has a subtle micronodular
appearance, although it might occasionally appear
as single or multiple nodules. It is important to
correctly identify lung metastases from thyroid
carcinoma because they respond to radionuclide
therapy with 131I.
Radiolabeled peptides
Radiolabeled compounds that bind to receptors
present in normal and abnormal tissues form the
basis of receptor imaging. Tumor expressing recep-
tors can be visualized with radiolabeled antibodies or
radiolabeled messenger molecules. To date, the most
successful of these agents has been radiolabeled
analogs of regulatory peptides. Regulatory peptides
are small, easily diffuseable, naturally occurring
substances that possess a wide spectrum of recep-
tor-mediated actions. High-affinity receptors for
these peptides are present on many neoplasms.
These receptors offer molecular targets for diagno-
sis and therapy [7]. Currently, two radiolabeled pep-
tides, Octreoscan (Mallinkrodt, St. Louis, Missouri)
and Neotect (Diatide, Londonderry, New Hamp-
shire), both of which are somatostatin analogs, are
approved for diagnostic use in the United States.
Somatostatin is an endogenous neuropeptide that
exists in two forms: a 14 amino acid form and a 28
amino acid form. It is synthesized in the central
nervous system, the hypothalamopituitary axis, the
gastrointestinal tract, the pancreas, and the immune
system. Somatostatin receptors, of which there are
five subtypes, are present on many cells, particularly

S.J. Goldsmith et al / Thorac Surg Clin 14 (2004) 95–11298
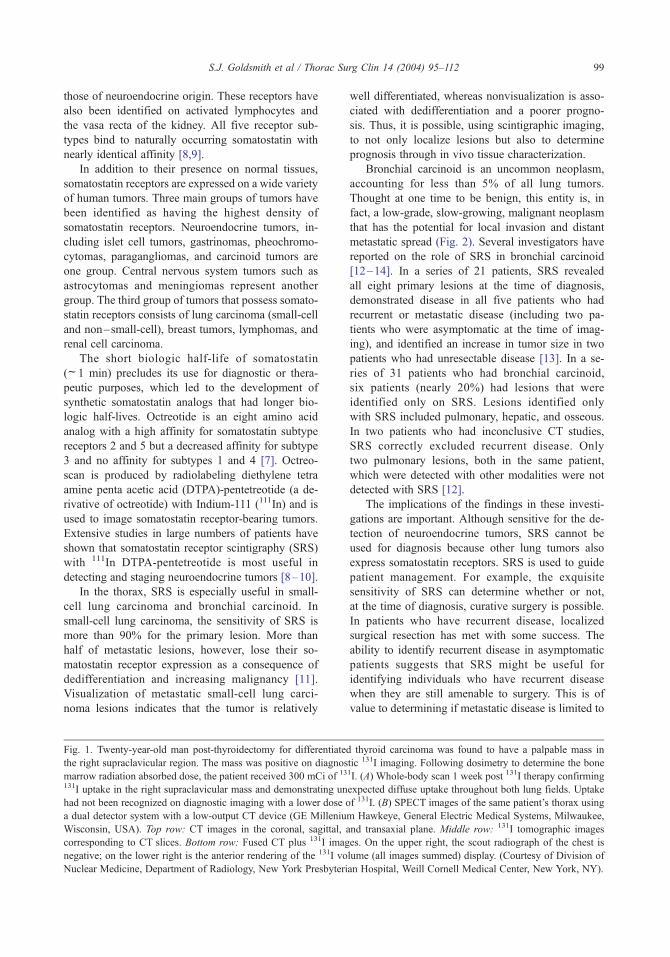
S.J. Goldsmith et al / Thorac Surg Clin 14 (2004) 95–112 99
those of neuroendocrine origin. These receptors have
also been identified on activated lymphocytes and
the vasa recta of the kidney. All five receptor sub-
types bind to naturally occurring somatostatin with
nearly identical affinity [8,9].
In addition to their presence on normal tissues,
somatostatin receptors are expressed on a wide variety
of human tumors. Three main groups of tumors have
been identified as having the highest density of
somatostatin receptors. Neuroendocrine tumors, in-
cluding islet cell tumors, gastrinomas, pheochromo-
cytomas, paragangliomas, and carcinoid tumors are
one group. Central nervous system tumors such as
astrocytomas and meningiomas represent another
group. The third group of tumors that possess somato-
statin receptors consists of lung carcinoma (small-cell
and non–small-cell), breast tumors, lymphomas, and
renal cell carcinoma.
The short biologic half-life of somatostatin
(f1 min) precludes its use for diagnostic or thera-
peutic purposes, which led to the development of
synthetic somatostatin analogs that had longer bio-
logic half-lives. Octreotide is an eight amino acid
analog with a high affinity for somatostatin subtype
receptors 2 and 5 but a decreased affinity for subtype
3 and no affinity for subtypes 1 and 4 [7]. Octreo-
scan is produced by radiolabeling diethylene tetra
amine penta acetic acid (DTPA)-pentetreotide (a de-
rivative of octreotide) with Indium-111 (111In) and is
used to image somatostatin receptor-bearing tumors.
Extensive studies in large numbers of patients have
shown that somatostatin receptor scintigraphy (SRS)
with 111In DTPA-pentetreotide is most useful in
detecting and staging neuroendocrine tumors [8–10].
In the thorax, SRS is especially useful in small-
cell lung carcinoma and bronchial carcinoid. In
small-cell lung carcinoma, the sensitivity of SRS is
more than 90% for the primary lesion. More than
half of metastatic lesions, however, lose their so-
matostatin receptor expression as a consequence of
dedifferentiation and increasing malignancy [11].
Visualization of metastatic small-cell lung carci-
noma lesions indicates that the tumor is relatively
Fig. 1. Twenty-year-old man post-thyroidectomy for differentiate
the right supraclavicular region. The mass was positive on diagnos
marrow radiation absorbed dose, the patient received 300 mCi of 13
131I uptake in the right supraclavicular mass and demonstrating un
had not been recognized on diagnostic imaging with a lower dose o
a dual detector system with a low-output CT device (GE Milleniu
Wisconsin, USA). Top row: CT images in the coronal, sagittal,
corresponding to CT slices. Bottom row: Fused CT plus 131I imag
negative; on the lower right is the anterior rendering of the 131I vo
Nuclear Medicine, Department of Radiology, New York Presbyteri
well differentiated, whereas nonvisualization is asso-
ciated with dedifferentiation and a poorer progno-
sis. Thus, it is possible, using scintigraphic imaging,
to not only localize lesions but also to determine
prognosis through in vivo tissue characterization.
Bronchial carcinoid is an uncommon neoplasm,
accounting for less than 5% of all lung tumors.
Thought at one time to be benign, this entity is, in
fact, a low-grade, slow-growing, malignant neoplasm
that has the potential for local invasion and distant
metastatic spread (Fig. 2). Several investigators have
reported on the role of SRS in bronchial carcinoid
[12–14]. In a series of 21 patients, SRS revealed
all eight primary lesions at the time of diagnosis,
demonstrated disease in all five patients who had
recurrent or metastatic disease (including two pa-
tients who were asymptomatic at the time of imag-
ing), and identified an increase in tumor size in two
patients who had unresectable disease [13]. In a se-
ries of 31 patients who had bronchial carcinoid,
six patients (nearly 20%) had lesions that were
identified only on SRS. Lesions identified only
with SRS included pulmonary, hepatic, and osseous.
In two patients who had inconclusive CT studies,
SRS correctly excluded recurrent disease. Only
two pulmonary lesions, both in the same patient,
which were detected with other modalities were not
detected with SRS [12].
The implications of the findings in these investi-
gations are important. Although sensitive for the de-
tection of neuroendocrine tumors, SRS cannot be
used for diagnosis because other lung tumors also
express somatostatin receptors. SRS is used to guide
patient management. For example, the exquisite
sensitivity of SRS can determine whether or not,
at the time of diagnosis, curative surgery is possible.
In patients who have recurrent disease, localized
surgical resection has met with some success. The
ability to identify recurrent disease in asymptomatic
patients suggests that SRS might be useful for
identifying individuals who have recurrent disease
when they are still amenable to surgery. This is of
value to determining if metastatic disease is limited to
d thyroid carcinoma was found to have a palpable mass in
tic 131I imaging. Following dosimetry to determine the bone1I. (A) Whole-body scan 1 week post 131I therapy confirming
expected diffuse uptake throughout both lung fields. Uptake
f 131I. (B) SPECT images of the same patient’s thorax using
m Hawkeye, General Electric Medical Systems, Milwaukee,
and transaxial plane. Middle row: 131I tomographic images
es. On the upper right, the scout radiograph of the chest is
lume (all images summed) display. (Courtesy of Division of
an Hospital, Weill Cornell Medical Center, New York, NY).

S.J. Goldsmith et al / Thorac Surg Clin 14 (2004) 95–112100
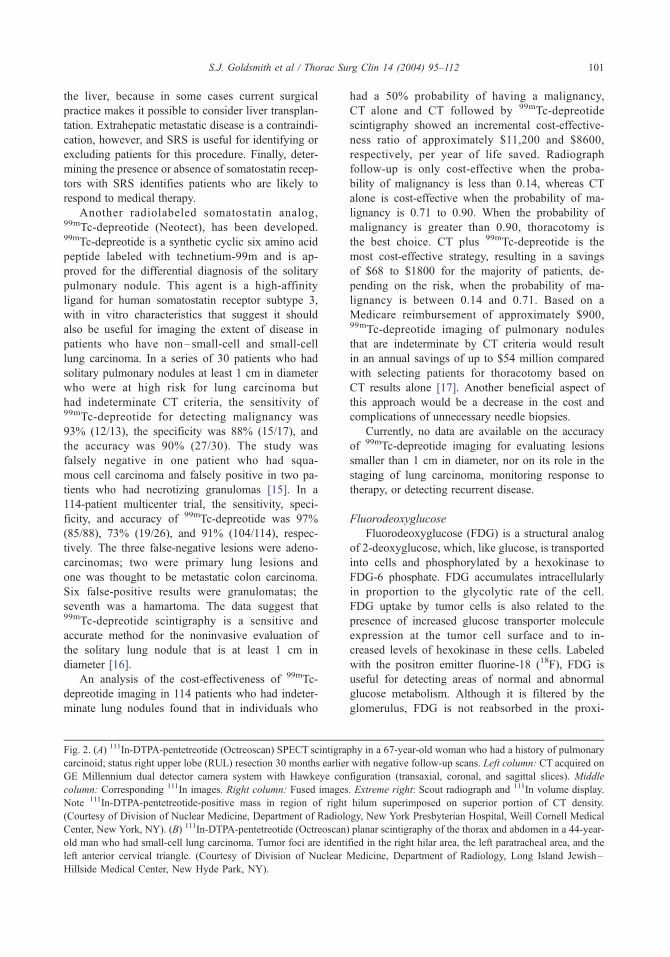
S.J. Goldsmith et al / Thorac Surg Clin 14 (2004) 95–112 101
the liver, because in some cases current surgical
practice makes it possible to consider liver transplan-
tation. Extrahepatic metastatic disease is a contraindi-
cation, however, and SRS is useful for identifying or
excluding patients for this procedure. Finally, deter-
mining the presence or absence of somatostatin recep-
tors with SRS identifies patients who are likely to
respond to medical therapy.
Another radiolabeled somatostatin analog,99mTc-depreotide (Neotect), has been developed.99mTc-depreotide is a synthetic cyclic six amino acid
peptide labeled with technetium-99m and is ap-
proved for the differential diagnosis of the solitary
pulmonary nodule. This agent is a high-affinity
ligand for human somatostatin receptor subtype 3,
with in vitro characteristics that suggest it should
also be useful for imaging the extent of disease in
patients who have non–small-cell and small-cell
lung carcinoma. In a series of 30 patients who had
solitary pulmonary nodules at least 1 cm in diameter
who were at high risk for lung carcinoma but
had indeterminate CT criteria, the sensitivity of99mTc-depreotide for detecting malignancy was
93% (12/13), the specificity was 88% (15/17), and
the accuracy was 90% (27/30). The study was
falsely negative in one patient who had squa-
mous cell carcinoma and falsely positive in two pa-
tients who had necrotizing granulomas [15]. In a
114-patient multicenter trial, the sensitivity, speci-
ficity, and accuracy of 99mTc-depreotide was 97%
(85/88), 73% (19/26), and 91% (104/114), respec-
tively. The three false-negative lesions were adeno-
carcinomas; two were primary lung lesions and
one was thought to be metastatic colon carcinoma.
Six false-positive results were granulomatas; the
seventh was a hamartoma. The data suggest that99mTc-depreotide scintigraphy is a sensitive and
accurate method for the noninvasive evaluation of
the solitary lung nodule that is at least 1 cm in
diameter [16].
An analysis of the cost-effectiveness of 99mTc-
depreotide imaging in 114 patients who had indeter-
minate lung nodules found that in individuals who
Fig. 2. (A) 111In-DTPA-pentetreotide (Octreoscan) SPECT scintigra
carcinoid; status right upper lobe (RUL) resection 30 months earlier
GE Millennium dual detector camera system with Hawkeye con
column: Corresponding 111In images. Right column: Fused images
Note 111In-DTPA-pentetreotide-positive mass in region of right
(Courtesy of Division of Nuclear Medicine, Department of Radiolo
Center, New York, NY). (B) 111In-DTPA-pentetreotide (Octreoscan
old man who had small-cell lung carcinoma. Tumor foci are identi
left anterior cervical triangle. (Courtesy of Division of Nuclear
Hillside Medical Center, New Hyde Park, NY).
had a 50% probability of having a malignancy,
CT alone and CT followed by 99mTc-depreotide
scintigraphy showed an incremental cost-effective-
ness ratio of approximately $11,200 and $8600,
respectively, per year of life saved. Radiograph
follow-up is only cost-effective when the proba-
bility of malignancy is less than 0.14, whereas CT
alone is cost-effective when the probability of ma-
lignancy is 0.71 to 0.90. When the probability of
malignancy is greater than 0.90, thoracotomy is
the best choice. CT plus 99mTc-depreotide is the
most cost-effective strategy, resulting in a savings
of $68 to $1800 for the majority of patients, de-
pending on the risk, when the probability of ma-
lignancy is between 0.14 and 0.71. Based on a
Medicare reimbursement of approximately $900,99mTc-depreotide imaging of pulmonary nodules
that are indeterminate by CT criteria would result
in an annual savings of up to $54 million compared
with selecting patients for thoracotomy based on
CT results alone [17]. Another beneficial aspect of
this approach would be a decrease in the cost and
complications of unnecessary needle biopsies.
Currently, no data are available on the accuracy
of 99mTc-depreotide imaging for evaluating lesions
smaller than 1 cm in diameter, nor on its role in the
staging of lung carcinoma, monitoring response to
therapy, or detecting recurrent disease.
Fluorodeoxyglucose
Fluorodeoxyglucose (FDG) is a structural analog
of 2-deoxyglucose, which, like glucose, is transported
into cells and phosphorylated by a hexokinase to
FDG-6 phosphate. FDG accumulates intracellularly
in proportion to the glycolytic rate of the cell.
FDG uptake by tumor cells is also related to the
presence of increased glucose transporter molecule
expression at the tumor cell surface and to in-
creased levels of hexokinase in these cells. Labeled
with the positron emitter fluorine-18 (18F), FDG is
useful for detecting areas of normal and abnormal
glucose metabolism. Although it is filtered by the
glomerulus, FDG is not reabsorbed in the proxi-
phy in a 67-year-old woman who had a history of pulmonary
with negative follow-up scans. Left column: CT acquired on
figuration (transaxial, coronal, and sagittal slices). Middle
. Extreme right: Scout radiograph and 111In volume display.
hilum superimposed on superior portion of CT density.
gy, New York Presbyterian Hospital, Weill Cornell Medical
) planar scintigraphy of the thorax and abdomen in a 44-year-
fied in the right hilar area, the left paratracheal area, and the
Medicine, Department of Radiology, Long Island Jewish–

S.J. Goldsmith et al / Thorac Surg Clin 14 (2004) 95–112102

S.J. Goldsmith et al / Thorac Surg Clin 14 (2004) 95–112 103
mal renal tubules, and the blood concentration of
this compound falls quickly, providing high contrast
between foci of increased glucose metabolism and
background activity within 1 hour of injection.
Many tumors are characterized by increased anaero-
bic glucose metabolism, and 18FDG provides a sen-
sitive tool for their detection. In lung cancer,18FDG-PET imaging provides important infor-
mation about the diagnosis, pretreatment staging,
and assessment of the effects of treatment in this
entity. Its potential role in predicting prognosis is
currently being assessed.
Fluorine-18-fluorodeoxyglucose–positron
emission tomography and lung carcinoma
Nearly 1 million new cases of lung cancer are
diagnosed annually, principally in developed nations.
At the time of diagnosis, the disease has already
spread to adjacent hilar or mediastinal lymph nodes
in about 25% of patients, and 35% to 45% of patients
have distant metastases [18,19]. A systematic ap-
proach to the diagnosis, staging, and treatment of lung
cancer optimizes therapy for each individual patient.
Diagnosis
The diagnosis of lung carcinoma, as for any other
tumor, is the first challenge with which the clinician
is faced when presented with a patient suspected
of having this entity. While morphologic imaging
studies such as planar radiographs, CT, and MRI
can detect a pulmonary lesion, they often cannot
determine whether it is benign or malignant. Only
about one third of pulmonary nodules can be diag-
nosed as benign or malignant on the basis of CT
criteria alone. In the other two thirds, diagnosis
depends on more invasive procedures such as bron-
choscopy and percutaneous CT-guided transthoracic
needle aspiration [20,21]. The overall sensitivity of
bronchoscopy in detecting malignancy is about
65%. If transbronchial biopsy is performed, the
sensitivity approaches 80% [22,23]. The sensitivity
Fig. 3. (A) Fifty-three-year-old woman who had a recently diagn
history of cigarette smoking. The 18FDG-PET images are entirely
five-year-old man who had a history of an right lower lobe (RLL) s
The nodule had increased in size recently. 18FDG-PET images dem
process. There is no evidence of regional lymph node involvement,
(Courtesy of Division of Nuclear Medicine, Department of Radio
ical Center, New York, NY).
of the CT-guided procedure is greater than 90% if
an adequate sample is obtained. The frequency of
sampling errors depends on the size and location of
the lesion and on operator expertise. The most
common complication of needle biopsy is pneu-
mothorax, which occurs in up to10% of patients [24].
The characterization of a pulmonary nodule as
benign or malignant with 18F-FDG-PET was one of
the earliest oncologic applications investigated, and
its value for this purpose is now well established
(Fig. 3). The sensitivity and specificity of 18FDG-
PET imaging in the evaluation of solitary lung nod-
ules ranges from 82% to 100% and 63% to 90%,
respectively [25–34]. A meta-analysis of 1474
pulmonary lesions found that the mean sensitivity
and specificity of 18FDG-PET was 96% and 74%,
respectively [2].
Several factors affect the sensitivity of 18FDG-PET
imaging for the diagnosis of malignancy. Lesion
visualization depends on the amount of 18FDG in-
corporated into the tumor. Abnormalities typically
present as areas of focally increased activity, collo-
quially referred to as hotspots. Images can be ana-
lyzed visually and semiquantitatively. In the chest,
mediastinal blood pool activity is often used as the
reference point. Uptake in a lesion that is more in-
tense than mediastinal blood pool activity is likely to
be malignant, whereas activity equal to or less than
mediastinal blood activity is likely to be benign. It
is also possible to quantify activity by calculating
the standardized uptake value (SUV), which reflects
the ratio of activity per estimated tumor volume
to the total activity administered to the patient, cor-
rected for the lean body mass. Although not abso-
lutely diagnostic, SUVs greater than 2.5 are often
associated with malignancy, and malignant lesions
generally have SUVs greater than 2.5. Fractional18FDG uptake is affected by specific tumor meta-
bolic activity. Consequently, tumors such as bronchi-
oalveolar cell carcinoma and bronchial carcinoid with
relatively low metabolic activity might not concen-
trate sufficient 18FDG to be identified as malignant.
Nevertheless, subsets of these tumor types (bron-
chioalveolar carcinoma and carcinoid or other neuro-
endocrine tumors) might be metabolically active and
identifiable as malignant on 18FDG imaging. Meta-
osed RUL pulmonary nodule. Patient had a 30 pack-year
normal. The patient will continue to be followed. (B) Sixty-
olitary pulmonary nodule that had been followed since 2000.
onstrate a hypermetabolic focus consistent with a malignant
indicating that the patient is an appropriate surgical candidate.
logy, New York Presbyterian Hospital, Weill Cornell Med-

S.J. Goldsmith et al / Thorac Surg Clin 14 (2004) 95–112104
static differentiated thyroid carcinoma can be posi-
tive or negative on 18FDG imaging depending, appar-
ently, on the degree of biologic aggressiveness at the
time of imaging. The degree of tumor aggressiveness
is reflected in the metabolic rate. Although some well-
differentiated adenocarcinomas might demonstrate
only modest accumulation of 18FDG, their SUVs are
nevertheless typically in the malignant range [35].
Sensitivity is also affected by lesion size. Lesions
below the limits of resolution of PET scanners (cur-
rently about 4–8 mm depending upon the system
hardware configuration) might not be detected
[36,37]. The lesion intensity and the measured SUV
will be blunted by the phenomenon known as volume
averaging, in which the absolute uptake in a lesion
below the spatial resolution of the system is distrib-
uted over the minimal resolution area, resulting in an
apparent lowering of the activity per pixel. Sensitivity
is also adversely affected by hyperglycemia. Presum-
ably, competitive inhibition results from elevated
serum glucose levels, reducing 18FDG uptake. In
addition to this direct competitive effect, the insulin
response to the glucose level is greatest in acute
hyperglycemia. This response promotes muscle and
hepatic uptake of glucose and 18FDG. Chronic hyper-
glycemia has a lesser effect on FDG uptake by tumors
[38]. In patients who are diabetic, control of the
disease should be optimized and serum glucose levels
checked before injecting 18FDG. In general, patients
who have serum glucose levels above 250 mg/dL
should probably not undergo 18FDG imaging until
serum glucose levels have been controlled.
Increased glycolysis is not unique to tumors,
however; it occurs in benign conditions such as
granulomas, histoplasmosis, coccidioidomycosis, and
pneumonia, in which false-positive findings are
observed [39– 42]. Some data suggest that the
specificity of the overall results can be improved
by performing dual time point imaging. 18FDG
uptake in tumor tends to increase over time,
whereas inflammation tends to remain constant or
decrease over time [43]. By acquiring a second set
of images about 1 hour after the first set, it might
be possible to distinguish 18FDG uptake in benign
inflammatory conditions from that in tumors.18FDG-PET obviates the need for invasive biopsy
in many patients who have lung nodules. To be used
for this purpose, the test must have a high negative
predictive value, which depends not only on sen-
sitivity and specificity but also on the pretest like-
lihood of malignancy. Using decision analysis
modeling, it has been shown that only patients who
have a 50% or lower pretest likelihood of cancer
should undergo 18FDG-PET imaging. If the pretest
likelihood of malignancy is more than 50%, the
posttest probability of disease will exceed 10%
even if the 18FDG images are negative for one
reason or another (ie, size, metabolic activity, blood
glucose), and histopathologic evaluation will be
necessary regardless of the 18FDG-PET results [44].
Because there is always the risk of a false-negative
result even when the negative predictive value is
high (eg, a negative 18FDG-PET study in a patient
who has <50% pretest probability), patients who
have lung nodules and negative 18FDG-PET studies
should undergo routine clinical and imaging follow-
up every 6 to 12 months (as with other potentially
malignant lesions) to monitor for any increase in
the lesion size.
Staging
Pretreatment staging of non-small cell lung carci-
noma (NSCLC) is necessary to assess prognosis and
to determine appropriate therapy (Figs. 4–6). For
example, patients who do not have mediastinal lymph
node or distant metastatic disease usually undergo
surgical resection of the tumor, whereas patients who
have mediastinal or distant disease can undergo in-
duction chemotherapy or radiotherapy before surgery.
CT imaging is used to anatomically define the extent
of the primary tumor and pleural or chest wall
involvement and is superior to FDG-PET for these
purposes because of its inherently better spatial reso-
lution and delineation of normal structures and ana-
tomic detail. CT identification of hilar and mediastinal
lymph node involvement is less than optimal, how-
ever, because it depends upon lesion size. Using a size
criterion of 1 cm as the threshold for identification of
malignant disease leads to under- and overstaging.
Normal-sized lymph nodes that are infiltrated by
tumor will not be recognized, whereas lymph nodes
that are enlarged secondary to benign processes will
be incorrectly interpreted as containing tumor. The
sensitivity, specificity, and accuracy of mediastinal
staging by CT, as reported in a meta-analysis, is
approximately 60%, 77%, and 65%, respectively
[45]. In a prospective study, the sensitivity and spec-
ificity of CT was 52% and 69%, respectively [46].
Mediastinoscopy has, consequently, been the refer-
ence technique for mediastinal lymph node staging.
The accuracy of 18FDG-PET for assessment of
mediastinal nodal involvement has been investigated
extensively. The sensitivity and specificity of the
procedure, when reported as positive or negative for
the ipsilateral or contralateral side, have ranged form
67% to 92% and 86% to 97%, respectively [47–52].
When analyzed by nodal stations, the reported results

Fig. 4. Selected transaxial slice demonstrating 18FDG-PET images in a 68-year-old woman who smoked 1 pack of cigarettes
per day for many years. She presented to her primary care physician with complaints of back pain but was otherwise in good
health. A chest radiograph revealed a hilar mass and lung nodules. Transbronchial biopsy was positive for poorly differentiated
non–small-cell lung carcinoma. The patient was referred for evaluation of the extent of disease. The so-called hilar mass was
actually the primary lung tumor adjacent to hilar structures with a nearby second and third focus. A metastatic lesion in the
vertebral body was also demonstrated. The accompanying CT image shows multiple tumor masses and evidence of a sclerotic
lesion in the vertebral body (lung CT window). 18FDG-PET indicates the extent of viable tumor. Recently, radiation treatment
plans using intensity modulated radiation therapy (IMRT) were designed to provide booster radiation doses to the well-
circumscribed viable tumor defined by 18FDG-PET as opposed to simply delivering the prescribed dose to the entire CT defined
tumor volume. (Courtesy of Jacqueline Brunetti, MD, Department of Radiology, Holy Name Hospital, Teaneck, NJ).
S.J. Goldsmith et al / Thorac Surg Clin 14 (2004) 95–112 105
are similar. A study published in 1999 compared18FDG-PET and CT in 75 patients prospectively
[53]. 18FDG-PET imaging and CT were concordant
in 39 patients, correctly in 35 of the 39 patients but
overstaging in two patients and understaging in
two patients. The results of the two studies were
discordant in 36 patients; 18FDG-PET was correct
in 28 of these patients. Hence, 18FDG-PETwas correct
in 63 of 75 patients, whereas CT was correct in only
43 of 75 patients. In a meta-analysis of staging, the
mean sensitivity and specificity of 18FDG-PET was
79% (F3%) and 91% (F2%) respectively, versus 60%
(F2%) and 77% (F2%), respectively, for CT [45].
The anatomic–functional correlation of 18FDG-
PET and CT images using fusion imaging (in which
the two studies are obtained sequentially on the same
instrument) will undoubtedly further refine the clas-
sification of patients who have nodal or mediastinal
disease by separating the primary tumor from adjacent
lymph nodes, differentiating hilar from adjacent me-
diastinal nodes, and precisely identifying the medias-
tinal lymph node groups involved. It is especially
important to differentiate between N1 and N2 disease
because the former is directly operable and the latter
is not. These conclusions are based upon traditional
methods of staging. The identification of N1 disease
by 18FDG-PET at an earlier time than would have
been possible with CT provides a basis for modifying
surgical resection to include these positive nodes
rather than to conclude that there is no nodal involve-
ment based upon CT imaging alone.
Patients who have distant, or systemic, metastases
at the time of diagnosis cannot be cured by surgery
and are not likely to achieve a long-term remission.
Despite the fact that the incidence of distant recur-
rence after complete removal of the primary tumor
is at least 20%, conventional staging procedures
performed at the time of diagnosis are generally
unrewarding [54]. Because the diagnostic yield of
anatomic imaging is low, 18FDG-PET offers a rapid
method for whole-body imaging that identifies sys-
temic metastatic disease effectively. 18FDG-PET
detects distant disease in up to 15% of patients who
have negative conventional staging procedures
[52,55,56]. In addition to improving the detection
of disease, a negative study can also exclude disease
in patients who have false-positive or equivocal con-
ventional imaging results.
Adrenal masses are identified on CT in up to 20%
of patients who have NSCLC, and 18FDG-PET can

S.J. Goldsmith et al / Thorac Surg Clin 14 (2004) 95–112106
accurately characterize the lesion as benign or malig-
nant (Fig. 5). In one series of 27 patients, 18FDG-PET
was 100% sensitive and 80% specific for adrenal
metastases [57]. The high negative predictive value of
this technique can reduce the need for routine biopsy
of adrenal masses.
Lung carcinoma frequently metastasizes to bone
(Fig. 5). Radionuclide bone scintigraphy using 99mTc-
methylene diphosphonate (99mTc-MDP) had been
considered to be the procedure of choice for the
clinical assessment of possible skeletal involvement.
Bone metastases from NSCLC are often osteolytic,

Fig. 6. 18FDG-PET, CT, and fusion transaxial images in a patient presenting with a chest wall mass. No satellite lesions or lymph
node involvement was demonstrated; biopsy demonstrated chondrosarcoma. (Courtesy of Division of Nuclear Medicine,
Department of Radiology, New York Presbyterian Hospital, Weill Cornell Medical Center, New York, NY).
S.J. Goldsmith et al / Thorac Surg Clin 14 (2004) 95–112 107
and 18FDG is reportedly more sensitive than conven-
tional radionuclide bone imaging for this type of
bone lesion. In addition, 18FDG-PET produces fewer
false-positive results in degenerative, inflammatory,
and posttraumatic bone disease [58,59]. False-positive
Fig. 5. (A) 18FDG-PET images from a 62-year-old woman admitted
50 years. A solitary pulmonary nodule on the chest radiograph
Brain metastases were present on MRI. A CT of the chest and ab
the primary pulmonary lesion. Coronal, sagittal, and transaxial 1
mary lesion (arrow 1). A metastatic ipsilateral hilar lymph node i
also seen (arrow 3), although the right hilar node and left adren
fusion images) demonstrating adrenal metastasis in a normal left
Nuclear Medicine, Department of Radiology, New York Presbyteri
18FDG-PET results have been reported with acute
fractures [60].
Liver metastases are readily detected by conven-
tional imaging studies. 18FDG-PET is most useful for
resolving abnormalities that are indeterminate on
with confusion who was a cigarette smoker, 1 pack/day for
was subsequently confirmed as adenocarcinoma on biopsy.
domen to the kidneys was interpreted as normal except for8FDG-PET images are triangulated (crosshairs) on the pri-
s identified (arrow 2), and a metastasis to the left adrenal is
al are normal on CT. (B) Transaxial slices (CT, PET, and
adrenal gland on CT examination. (Courtesy of Division of
an Hospital, Weill Cornell Medical Center, New York, NY).

S.J. Goldsmith et al / Thorac Surg Clin 14 (2004) 95–112108
conventional studies [61]. Although 18FDG-PET can
detect lung metastases, CT has higher resolution and
is less affected by respiratory motion than 18FDG-PET
images. For optimal detection of brain metastases, a
dedicated brain acquisition should be performed. This
additional study is probably not routinely warranted in
light of the low incidence of brain metastases in
asymptomatic patients and because of the excellent
results obtained with contrast-enhanced CT and MRI.
The effectiveness of 18FDG-PET in the staging of
NSCLC is a direct result of its ability to detect me-
tastases that are not apparent on conventional imaging
modalities and to clarify the etiology of indeterminate
lesions found on CT. It has been estimated that18FDG-PET imaging results in changes in patient
Fig. 7. 18FDG-PET, CT, and fusion images from a 73-year-old m
4 years earlier followed by a course of chemotherapy. The patient n
value and suspicion of a mediastinal mass. A hypermetabolic (incr
and a large mass is seen in the liver. These findings are metastatic
second primary neoplasm. (Courtesy of Division of Nuclear Me
Hospital, Weill Cornell Medical Center, New York, NY).
management in 20% to 40% of patients. Perhaps most
important is the exclusion of surgery in up to 15% of
patients as a result of the detection of distant metas-
tases [56,62–64].
Treatment and prognosis
In addition to assisting in the identification of
individuals who are suitable for curative surgery,18FDG-PET is also used for radiotherapy planning
by defining functional tumor volume and providing
an outline of the radiotherapy volume for inclusion of
tumor and sparing of adjacent, uninvolved structures.
In one series, changes in staging were made in 33%
of patients and changes in radiation treatment vol-
an who had a history of colon carcinoma that was resected
ow has an elevated serum carcino embryonic antigen (CEA)
eased 18FDG) mass is seen in the right anterior mediastinum
colon carcinoma. The chest mass is indistinguishable from a
dicine, Department of Radiology, New York Presbyterian

Fig. 8. 18FDG-PET, CT, and fusion images from a 50-year-old HIV+ man demonstrating a hypermetabolic mass in the right
lung and mediastinal lymphadenopathy and infradiaphragmatic disease. Diagnosis: non-Hodgkin’s lymphoma. (Courtesy of
Division of Nuclear Medicine, Department of Radiology, New York Presbyterian Hospital, Weill Cornell Medical Center,
New York, NY).
S.J. Goldsmith et al / Thorac Surg Clin 14 (2004) 95–112 109
umes were made in 25% of patients as a direct result
of 18FDG-PET imaging [65]. In addition, 18FDG-PET
differentiates scarring from residual or recurrent
disease accurately. In one study it was more sensi-
tive than, and as specific as, other modalities em-
ployed for this purpose. In a study of 63 patients
suspected of NSCLC relapse, results of 18FDG-PET
and conventional evaluation methods were discordant
in 43 patients. In 39 patients (91%), 18FDG-PET was
correct, resulting in major changes in the diagnosis
in 25 patients (59%) [66]. To maximize the accuracy
of the study, 18FDG-PET should be performed
2 months after surgery and 4 to 6 months after ra-
diotherapy [67].
Although prognosis in NSCLC is determined pri-
marily by disease stage, tumor aggressiveness and
invasiveness—and even metabolic activity—might
also be important factors. Some data indicate that
patients who have more intense uptake of 18FDG
have a shorter survival time. Other data have shown
that patients who have persistent or recurrent abnor-
malities have shorter survival times than patients who
have negative follow-up studies [66,68].
Fluorodeoxyglucose–positron emission
tomography and other thoracic tumors
Increased anaerobic glucose metabolism, which
is the basis for 18FDG identification of carcinoma
of the lung, is a feature of other malignant tumors of
the thorax (Figs. 6–8). Accordingly, identification
S.J. Goldsmith et al / Thorac Surg Clin 14 (2004) 95–112110
of an 18FDG-avid mass does not exclude metastatic
foci from other adenocarcinomas, lymphoma, thyroid
carcinomas, or even active necrotizing granulomas.
The nuclear medicine physician should be provided
with pertinent patient clinical history to be able to
fully assess the likely etiology of the findings on the
PET images. Likewise, the nuclear medicine physi-
cian should evaluate the 18FDG images from the neck
to the mid-thigh to fully assess the extent of disease
and to identify other clinical conditions that might
be present.
Summary
Over the past decade a variety nuclear medicine
imaging studies have become available that are of
considerable value to patients who have pulmonary
malignancies. By far the greatest impact on the man-
agement of patients who have thoracic malignancy
has been the availability of 18FDG-PET imaging. In
the patient who has newly diagnosed lung carcinoma,18FDG-PET improves the accuracy of staging the
disease by identifying or excluding mediastinal dis-
ease and distant metastatic foci. 18FDG-PET is supe-
rior to anatomic methods for evaluating the response
to therapy and for distinguishing recurrent disease
from posttreatment changes. Studies are in progress
to evaluate the role of 18FDG-PET imaging in assess-
ing prognosis.
In patients who have bronchial carcinoid, somato-
statin receptor imaging with 111In-DTPA-pentetreotide
(Octreoscan) can help identify patients who are
candidates for curative surgery, detect unsuspected
metastatic spread, and identify patients who might
benefit from certain types of medical therapy. Al-
though it was initially speculated that 18FDG-PET
imaging would not be sensitive for tumor detection
in patients who have neuroendocrine tumors be-
cause of the usual slow metabolism and biology of
these tumors, many neuroendocrine tumors are
positive on 18FDG-PET imaging. Nevertheless, there
has been no direct comparison of 18FDG-PET imag-
ing and somatostatin receptor imaging, nor does
a positive or negative 18FDG-PET image exclude
neuroendocrine tumor.18FDG-PET imaging and somatostatin receptor
imaging with 99mTc-depreotide (Neotect) are safe,
cost-effective methods that are valuable in the diag-
nosis and management of patients who have sus-
pected or known lung cancer. 18FDG-PET and99mTc-depreotide imaging have a high degree of
sensitivity, specificity, overall accuracy, and positive
and negative predictive values in the evaluation of
the solitary pulmonary nodule. These agents provide
noninvasive, cost-effective methods for selecting
patients for aggressive intervention without contrib-
uting to increased morbidity. Both methods have
incremental value over CT imaging in selecting
patients who have solitary pulmonary nodules for
invasive biopsy or for thoracotomy.
References
[1] Coleman RE, Laymon CM, Turkington TG. FDG
imaging of lung nodules: a phantom study comparing
SPECT, camera-based PET, and dedicated PET. Radi-
ology 1999;210:823–8.
[2] Gould MK, Maclean CC, Kuschner WG, et al. Accu-
racy of positron emission tomography for diagnosis
of pulmonary nodules and mass lesions: a meta-analy-
sis. JAMA 2001;285:914–24.
[3] Lardinois D, Weder W, Hany TF, et al. Staging of non-
small-cell lung cancer with integrated positron-emis-
sion tomography and computed tomography. NEJM
2003;348:2500–7.
[4] Goldsmith SJ, Bar-Shalom R, Kostakoglu L, Weiner R,
Neumann R. Gallium-67 scintigraphy in tumor detec-
tion. In: Sandler M, Coleman R, et al, editors. Diag-
nostic nuclear medicine. Philadelphia: Lippincott
Williams & Wilkins; 2002. p. 911–9.
[5] Waxman AD. Thallium-201 and technetium-99m me-
thixyisobutyl isonitrile (MIBI) in nuclear oncology.
In: Sandler M, Coleman R, et al, editors. Diagnostic
nuclear medicine. Philadelphia: Lippincott Williams &
Wilkins; 2002. p. 931–47.
[6] Kostakoglu L, Goldsmith SJ. Imaging multidrug resist-
ance in hematological malignancies. Hematology 2001;
6:111–24.
[7] Behr TM, Gotthardt M, Barth A, Behe M. Imaging
tumors with peptide-based radioligands. Q J Nucl
Med 2001;45:189–200.
[8] Reubi JC. Regulatory peptide receptors as molecular
targets for cancer diagnosis and therapy. Q J Nucl Med
1997;41:63–70.
[9] Krenning EP, Kwekkeboom DJ, Pauwels S, Kvols LK,
Reubi JC. Somatostain receptor scintigraphy. In: Free-
man LM, editor. Nuclear medicine annual 1995. New
York: Raven Press; 1995. p. 1–50.
[10] Krenning EP, Kwekkeboom DJ, Bakker WH. Somato-
statin receptor scintigraphy with [111In-DTPA-D-Phe1]-
and [123I-Tyr3]-octreotide: the Rotterdam experience
with more than 1000 patients. Eur J Nucl Med 1993;
20:716–31.
[11] Bohuslavizki KH, Brenner W, Gunther M, et al. So-
matostatin receotor scintigraphy in the staging of
small cell lung cancer. Nucl Med Coomun 1996;17:
191–6.
[12] Fanti S, Farsard M, Battista G, et al. Somatostatin
receptor scintigraphy for bronchial carcinoid follow-
up. Clin Nucl Med 2003;28:548–52.

S.J. Goldsmith et al / Thorac Surg Clin 14 (2004) 95–112 111
[13] O’Byrne KJ, O’Hare NJ, Freyne PJ, et al. Imaging of
bronchial carcinoid tumors with indium-111 pentetreo-
tide. Thorax 1994;49:284–6.
[14] Musi M, Carbone RG, Bertocchi C, et al. Bronchial
carcinoid tumors: astudy on clinicopathological fea-
tures and role of octreotide scintigraphy. Lung Cancer
1998;22:97–102.
[15] Blum JE, Handmaker H, Rinne NA. The utility of a
somatostatin-type receptor binding peptide in the eval-
uation of solitary pulmonary nodules. Chest 1999;115:
224–32.
[16] Blum JE, Handmaker H, Lister-James J, et al. A multi-
center trial with a somatostatin analog 99mTc-depreotide
in the evaluation of solitary pulmonary nodules. Chest
2000;117:1232–8.
[17] Gambhir SS, Shephard JE, Handmaker H, Blum J.
Analysis of the cost effectiveness of a somatostatin ana-
log-Tc99m-Depreotide (Neotect) in the scintigraphic
evaluation of solitary pulmonary nodules (SPN). J Nucl
Med 1999;40(Suppl):57P.
[18] Boring CC, Squires TS, Tong T. Cancer statistics,
1992. CA Cancer J Clin 1992;42:19–38.
[19] Parker SL, Tong T, Bolden S, Wingo PA. Cancer sta-
tistics, 1997. CA Cancer J Clin 1997;47:5–27.
[20] Ost D, Fein A. Evaluation and management of the soli-
tary pulmonary nodule. Am J Respir Crit Care Med
2000;162:782–7.
[21] Ward HB, Pliego M, Diefenthal HC, Humphrey EW.
The impact of phantom CT scanning on surgery for the
solitary pulmonary nodule. Surgery 1989;106:734–8.
[22] Salathe M, Soler M, Bolliger CT, et al. Transbronchial
needle aspiration in routine fiberoptic bronchoscopy.
Respiration (Herrlisheim) 1992;59:5–8.
[23] Schenk DA, Bower JH, Bryan CL, et al. Transbron-
chial needle aspiration staging of bronchogenic carci-
noma. Am Rev Respir Dis 1986;134:146–8.
[24] Santambrogio L, Nosotti M, Bellaviti N, Pavoni G,
Radice F, Caputo V. CT-guided fine- needle aspiration
cytology of solitary pulmonary nodules: a prospective,
randomized study of immediate cytologic evaluation.
Chest 1997;112:423–5.
[25] Patz EJ, Lowe VJ, Hoffman JM, et al. Focal pulmonary
abnormalities: evaluation with F-18 fluorodeoxyglu-
cose PET scanning. Radiology 1993;188:487–90.
[26] Lowe VJ, Fletcher JW, Gobar L, et al. Prospective
Investigation of positron emission tomography in lung
nodules. J Clin Oncol 1998;16:1075–84.
[27] Kubota K, Matsuzawa T, Fijiwara T, et al. Differential
diagnosis of lung tumor with positron emission tomog-
raphy: a prospective study. J Nucl Med 1990;31:
1927–32.
[28] Gupta NC, Maloof J, Gunel E. Probability of malig-
nancy in solitary pulmonary nodules using fluorine-18-
FDG and PET. J Nucl Med 1996;37:943–8.
[29] Patz Jr EF, Lowe VJ, Hoffman JM, et al. Persistent
or recurrent bronchogenic carcinoma: detection with
PET and 2-[F-18]-deoxy-D-glucose. Radiology 1994;
191:379–82.
[30] Duhaylongsod FG, Lowe VJ, Patz Jr EF, et al. Detec-
tion of primary and recurrent lung cancer by means of
F-18 fluorodeoxyglucose positron emission tomogra-
phy (FDG PET). J Thorac Cardiovasc Surg 1995;
110:130–9.
[31] Bury T, Dowlati A, Paulus P, et al. Evaluation of the
solitary pulmonary nodule by positron emission to-
mography imaging. Eur Respir J 1996;9:410–4.
[32] Sazon DA, Santiago SM, Soo Hoo GW, et al. Fluoro-
deoxyglucose-positron emission tomography in the
detection and staging of lung cancer. Am J Respir Crit
Care Med 1996;153:417–21.
[33] Prauer HW, Weber WA, Romer W, et al. Controlled
prospective study of positron emission tomography
using the glucose analogue [18f] fluorodeoxyglucose
in the evaluation of pulmonary nodules. Br J Surg
1998;85:1506–11.
[34] Bury T, Rigo P. Contribution of positron emission
tomography for the management of lung cancer. Rev
Pneumol Clin 2000;56:1506–11.
[35] Higashi K, Ueda Y, Seki H, et al. Fluorine-18-FDG
PET imaging is negative in bronchiolo-alveolar lung
carcinoma. J Nucl Med 1998;39:1016–20.
[36] Farquar TH, Llacer J, Sayre J, et al. ROC and LROC
analyses of the effects of lesion contrast, size, and sig-
nal-to-noise ratio on detectability in PET images. J Nucl
Med 2000;41:745–54.
[37] Hoffman EJ, Huang SC, Phelps ME. Quantitation
in positron emission computed tomography: 1. Ef-
fect of object size. J Comput Assist Tomogr 1979;3:
299–308.
[38] Wahl RL. Targeting glucose transporters for tumor
imaging: ‘‘sweet’’ idea, ‘‘sour’’ result [editorial]. J Nucl
Med 1996;37:1038–41.
[39] Roberts PF, Follette DM, von Haag D, et al. Factors
associated with false positive staging of lung cancer by
positron emission tomography. Ann Thorac Surg 2000;
70:1154–9.
[40] Kapucu LO, Meltzer CC, Townsend DW, et al. Fluo-
rine-18-fluorodeoxyglucose uptake in pneumonia.
J Nucl Med 1998;39:1267–9.
[41] Brudin LH, Valind SO, Rhodes CG, et al. Fluorine-18-
deoxyglucose uptake in sacroidosis measured with
positron emission tomography. Eur J Nucl Med 1994;
21:297–305.
[42] Bakheet SM, Saleem M, Powe J, et al. F-18 fluoro-
deoxyglucose chest uptake in lung inflammation and
infection. Clin Nucl Med 2000;25:273–8.
[43] Matthies A, Hickeson M, Cuchiara A, Alavi A. Dual
time point 18F-FDG PET for the evaluation of pulmo-
nary nodules. J Nucl Med 2002;43:871–5.
[44] Gambhir SS, Sheperd JE, Shah BD, et al. Analytical
decision model for the cost-effective management
of solitary pulmonary nodules. J Clin Oncol 1998;16:
2113–25.
[45] Dwamena BA, Sonnad SS, Angobaldo JO, et al. Metas-
tases from non-small cell lung carcinoma: mediastinal
staging in the 1990s—meta-analytic comparison of
PET and CT. Radiology 1999;213:530–6.
[46] Webb WR, Gatsonis C, Zerhouni EA, et al. CT and

S.J. Goldsmith et al / Thorac Surg Clin 14 (2004) 95–112112
MR imaging in staging non-small cell bronchogenic
carcinoma: report of the Radiologic Diagnostic Oncol-
ogy Group. Radiology 1991;178:705–13.
[47] Steinert HC, Hauser M, Allemann F, et al. Non-small
cell lung cancer: nodal staging with FDG PET versus
CT with correlative lymph node mapping and sam-
pling. Radiology 1997;202:441–6.
[48] Vansteenkiste JF, Stoobants SG, De Leyn PR, et al.
Mediastinal lymph node staging with FDG PET scan
in patients with potentially operable non-small cell
lung cancer: a prospective analysis of 50 cases. Leuven
Lung Cancer Group. Chest 1997;112:1480–6.
[49] Saunders CA, Dussek JE, O’Doherty MJ, et al. Eval-
uation of fluorine-18 fluorodeoxyglucose whole body
positron emission tomography imaging in the staging
of lung cancer. Ann Thorac Surg 1999;67:790–7.
[50] Kerstine KH, Stanford W, Mullan BF, et al. PET, CT,
and MRI with Combidex for mediastinal staging in
non-small cell lung cancinoma. Ann Thorac Surg
1999;68:1022–8.
[51] Weng E, Tran L, Rege S, et al. Accuracy and clinical
impact of mediastinal lymph node staging with FDG
PET imaging in potentially resectable lung cancer. Am
J Clin Oncol 2000;23:47–52.
[52] Pieterman RM, van Putten JW, Meuzelaar JJ, et al.
Preoperative staging of non-small cell lung cancer with
positron-emission tomography. N Engl J Med 2000;
343:254–6.
[53] Bury T, Paulus P, Dowlati A, et al. Staging of the me-
diastinum: value of positron emission tomography
imaging in non-small cell lung cancer. Eur Respir J
1996;9:2560–4.
[54] Martini N, Bains MS, Burt ME, et al. Incidence of local
recurrence and second primary tumors in resected stage
1 lung cancer. J Thorac Cardiovasc Surg 1995;109:
120–9.
[55] Weder W, Schmid RA, Bruchhaus H, et al. detection of
extrathoracic metastases by positron emission tomogra-
phy in lung cancer. Ann Thorac Surg 1998;66:886–92.
[56] Bury T, Dowlati A, Paulus P, et al. Staging of non-
small cell lung cancer by whole- body fluorine-18 de-
oxyglucose positron emission tomography. Eur J Nucl
Med 1996;23:204–6.
[57] Erasmus JJ, Patz Jr EF, McAdams HP, et al. Evaluation
of adrenal masses in patients with bronchogenic carci-
noma using 18F-fluorodeoxyglucose positron emission
tomography. Am J Roentgenol 1997;168:1357–60.
[58] Bury T, Barreto A, Daenen F, et al. Fluorine-18 deox-
yglucose positron emission tomography for the detec-
tion of bone metastases in patients with non-small cell
lung cancer. Eur J Nucl Med 1998;25:1244–7.
[59] Schmirreister H, Guhlmann A, Eisner K, et al. Sensi-
tivity in detecting osseous lesions depends on anatomic
localization: planar bone scintigraphy versus 18F PET.
J Nucl Med 1999;40:1623–9.
[60] Meyer M, Gast T, Raja S, Hubner K. Increased F-18-
FDG accumulation in an acute fracture. Clin Nucl Med
1994;19(1):13–4.
[61] Hustinx R, Paulus P, Jacquet N, et al. Clinical evalua-
tion of whole-body 18F-fluorodeoxyglucose positron
emission tomography in the detection of liver metasta-
ses. Ann Oncol 1998;9:397–401.
[62] Valk PE, Pounds TR, Hopkins DM, et al. Staging non-
small cell lung cancer by whole-body positron tomo-
graphic imaging. Ann Thorac Surg 1995;60:1573–81.
[63] Marom EM, McAdams HP, Erasmus JJ, et al. Staging
non-small cell lung cancer with whole-body PET. Ra-
diology 1999;212:803–9.
[64] Lewis P, Griffin S, Marsden P, et al. Whole-body 18F-
fluorodeoxyglucose positron emission tomo-graphy in
preoperative evaluation of lung cancer. Lancet 1994;
334:1265–6.
[65] Hicks RJ, Kalff V, MacManus MP, et al. 18F-FDG PET
provides high-impact and powerful prognostic stratifi-
cation in staging newly diagnosed non-small cell lung
cancer. J Nucl Med 2001;42:1596–604.
[66] Hicks RJ, Kalff V, MacManus MP, et al. The utility of18F-FDG PET for suspected recurrent non-small cell
lung cancer after potentially curative therapy: impact
on management and prognostic stratification. J Nucl
Med 2001;42:1605–13.
[67] Erasmus JJ, Patz Jr EF. Positron emission tomogra-
phy imaging in the thorax. Clin Chest Med 1999;20:
715–24.
[68] Patz Jr EF, Connolly J, Herndon J. Prognostic value of
thoracic FDG PET imaging after treatment for non-
small cell lung cancer. Am J Roentgenol 2000;174:
769–74.

Thorac Surg Clin 14 (2004) 113–124
Imaging of acute pulmonary emboli
Arfa Khan, MD, FACRa,b,*, Aaron Darius Cann, PhD, MDc,Rakesh D. Shah, MD, FCCPc,d
aAlbert Einstein College of Medicine, 1300 Morris Park Avenue, Bronx, NY 10461-1602, USAbThoracic Radiology, Long Island Jewish Hospital, 270-05 76th Avenue, New Hyde Park, NY 11040, USA
cDepartment of Radiology, North Shore University Hospital, 300 Community Drive, Manhasset, NY 10461-1602, USAdDepartment of Radiology, New York University School of Medicine, 550 First Avenue, New York, NY 10016, USA
Pulmonary embolism (PE) is a significant cause The physiology of PE forms the basis for its de-
of surgical morbidity and mortality after surgical
procedures. Venous stasis caused by immobilization,
endothelial damage, and malignancy is a physiologic
factor that predisposes to thromboembolism [1] and is
common in the surgical patient. Because clinical signs
and symptoms such as chest pain, dyspnea, and
tachycardia are notoriously nonspecific, radiologic
imaging is the mainstay of diagnosis. In this article
the authors discuss the various methods of imaging
PEs in surgical patients.
The incidence of PE in surgical patients is high
and occurs throughout the spectrum of surgical
patients. In one large series of trauma patients, the
development of PE was found to confer an overall
tenfold increase in mortality, to 26% [2]. Perhaps the
best numerical description of the importance of PE to
surgeons is found in the extensive pathology series of
Lindblad, who found that 31.7% of all surgical pa-
tient autopsies from 1981 to 1988 had PE. Twenty-
nine percent of these autopsy-proven emboli were
considered to be fatal [3]. Other studies of surgical
mortality in inpatients show similar results [4]. Mod-
ern laparoscopic procedures also carry a risk of fatal
PE [5]. Pulmonary embolization has even been
reported during such minimally invasive procedures
as percutaneous discoplasty [6–8]. It is therefore
important to maintain a high index of suspicion in
all surgical patients.
1547-4127 /04/$ – see front matter D 2004 Elsevier Inc. All righ
doi:10.1016/S1547-4127(04)00032-5
* Corresponding author. Thoracic Radiology, Long
Island Jewish Hospital, 270-05 76th Avenue, New Hyde
Park, NY 11040.
E-mail address: [email protected] (A. Khan).
tection and has been reviewed extensively [1]. PEs
usually begin as thrombosis of the calf veins. They
typically propagate to the deep venous system of the
leg and thigh (popliteal vein, superficial femoral
veins, or common femoral veins), although in recent
years an increasing number of catheter-related ve-
nous thromboses have been seen that originated at
sites of central venous catheter placements. When in
the deep venous system, thrombi can dislodge or
fragment and travel to the lungs. DVTs are usually
asymptomatic [9] and are therefore usually not sus-
pected before PE [10]. DVT or PE can be imaged at
any of these stages: as DVT in the legs by way of ul-
trasonography or venography, directly in the pulmo-
nary arterial tree by way of conventional angiography
(CA), CT pulmonary angiography (CTPA), or MR
angiography (MRPA), or by way of its end-effects on
pulmonary perfusion and ventilation (V/Q scanning)
or the lung parenchyma by way of chest radiograph
(CXR). Large central emboli can even be identified
by transesophageal echocardiography (TEE). The
availability of so many different tests, each with its
own strengths and weaknesses, can be somewhat
perplexing. In this article the authors attempt to
provide a framework for the diagnosis of PE.
Chest radiograph
A plain CXR is an essential part of early diagnostic
investigation because it has a valuable role in the
exclusion of alternative pathology. By itself it is of
ts reserved.
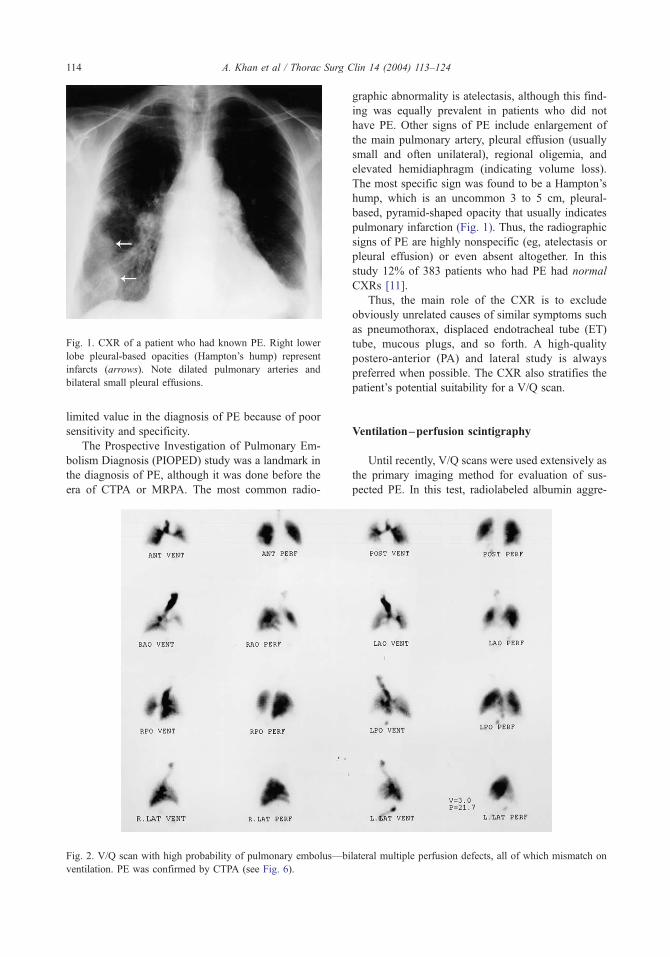
Fig. 1. CXR of a patient who had known PE. Right lower
lobe pleural-based opacities (Hampton’s hump) represent
infarcts (arrows). Note dilated pulmonary arteries and
bilateral small pleural effusions.
A. Khan et al / Thorac Surg Clin 14 (2004) 113–124114
limited value in the diagnosis of PE because of poor
sensitivity and specificity.
The Prospective Investigation of Pulmonary Em-
bolism Diagnosis (PIOPED) study was a landmark in
the diagnosis of PE, although it was done before the
era of CTPA or MRPA. The most common radio-
Fig. 2. V/Q scan with high probability of pulmonary embolus—bi
ventilation. PE was confirmed by CTPA (see Fig. 6).
graphic abnormality is atelectasis, although this find-
ing was equally prevalent in patients who did not
have PE. Other signs of PE include enlargement of
the main pulmonary artery, pleural effusion (usually
small and often unilateral), regional oligemia, and
elevated hemidiaphragm (indicating volume loss).
The most specific sign was found to be a Hampton’s
hump, which is an uncommon 3 to 5 cm, pleural-
based, pyramid-shaped opacity that usually indicates
pulmonary infarction (Fig. 1). Thus, the radiographic
signs of PE are highly nonspecific (eg, atelectasis or
pleural effusion) or even absent altogether. In this
study 12% of 383 patients who had PE had normal
CXRs [11].
Thus, the main role of the CXR is to exclude
obviously unrelated causes of similar symptoms such
as pneumothorax, displaced endotracheal tube (ET)
tube, mucous plugs, and so forth. A high-quality
postero-anterior (PA) and lateral study is always
preferred when possible. The CXR also stratifies the
patient’s potential suitability for a V/Q scan.
Ventilation–perfusion scintigraphy
Until recently, V/Q scans were used extensively as
the primary imaging method for evaluation of sus-
pected PE. In this test, radiolabeled albumin aggre-
lateral multiple perfusion defects, all of which mismatch on

A. Khan et al / Thorac Surg Clin 14 (2004) 113–124 115
gates are injected and carried to capillary beds in the
lung, where they lodge. Their absence from a particu-
lar portion of lung suggests that the pulmonary artery
branch to that region might be occluded. Similarly,
images of an inhaled radioactive gas provide ventila-
tion imaging, giving the interpreting physician a view
of abnormally ventilated lung regions (Fig. 2). Clas-
sically, a PE will manifest as a V/Q mismatch with a
segmental region of low perfusion but normal venti-
lation. A normal or near-normal V/Q scan by itself has
a high negative predictive value (NPV), essentially
excluding PE (<5% probability); a high probability
scan is also widely regarded as diagnostic ( > 90%
positive predictive value). It is also widely available,
and most radiologists have had extensive experience
with it. A current CXR is required for interpretation of
a V/Q scan; however, V/Q scanning is most often
nondiagnostic (in 73% of patients in the PIOPED
study) [11]. As many as 90% of patients who have
underlying lung disease have neither normal nor high
probability studies. An indeterminate V/Q scan is
nondiagnostic (probability 10–90%). A low proba-
bility V/Q scan does not rule out PE. In the PIOPED
study, 14% of patients who had low probability V/Q
scans had angiographic evidence of PE. Moreover, not
every surgical patient can cooperate with the ventila-
tion portion of the study, and critically ill patients
might not be well served by the 1 hour or more of
imaging in the nuclear medicine department that is
needed for the test.
AV/Q scan is an appropriate first test for evaluat-
ing a patient who has suspected PE only when the
baseline CXR is normal and the pretest clinical sus-
picion is low or moderate. In these patients a normal
result will frequently be obtained without the use of
iodinated contrast or the somewhat higher radiation
dose of CTPA; however, in many patients—especially
when the baseline CXR is abnormal or there is history
of significant underlying pulmonary disease—a V/Q
scan might not provide the necessary information to
diagnose or exclude PE.
Fig. 3. Combined CTPA–CT venography at groin level
shows a thrombus in the right femoral vein (arrow).
Conventional angiography
CA gives nondiagnostic results in only 3% of pa-
tients and it has been shown to have a 99.4% NPV by
clinical follow-up; however, it is invasive and carries
a 0.5% mortality rate associated with the study itself,
most commonly in intensive care unit patients [12].
The traditional reliance on CA as the gold standard
has recently been questioned because of its inability
to detect subsegmental emboli consistently. Interob-
server agreement for diagnosing subsegmental em-
boli using the supposed gold standard, pulmonary
angiography, is about 66% [11].
Venous imaging
Deep vein thrombosis (DVT) and PE are separate
manifestations of the same disease process. DVT can
be detected in 50% of patients who have angiographi-
cally proven PE. Because the treatment of these
conditions is similar, the presence of DVT justifies
anticoagulant therapy and therefore obviates a search
for a pulmonary artery clot [13]. This test does not
directly detect PE itself; the source of PE can be
identified pathologically in the lower extremity ve-
nous tree in only 59.4% of patients [14]. In patients
suspected of having PE, only 29% of duplex ultraso-
nography (US) will be abnormal at the time of pre-
sentation [15]. At autopsy, no thromboembolic source
could be detected in 28% of patients who died of PE,
suggesting complete dislodgement of thrombus from
an unknown source [14]. A non-lower extremity or
completely dislodged embolus would lead to a nega-
tive lower extremity venous study despite the pres-
ence of PE of any size.
Duplex US [16] is the imaging method of choice
for evaluating DVT. It has a sensitivity of 91% and
specificity of 99% [17]. The sensitivity for diagnosis
of femoral DVT approaches 100%. Duplex scans are
less sensitive for isolated calf vein thrombosis and will
not detect iliac vein thrombosis. Duplex US should
always be done in both legs in patients who have sus-
pected DVT because of the high incidence of asymp-

Fig. 5. Bilateral central PE. CTPA at the level of right
pulmonary trunk shows filling defects in right main and left
descending arteries (arrows).
A. Khan et al / Thorac Surg Clin 14 (2004) 113–124116
tomatic DVT in the contralateral leg, even when the
ipsilateral leg has no DVT by duplex US [18].
At some institutions, cross-sectional imaging of
the venous system is performed (Fig. 3). More com-
monly, indirect CT venography is performed imme-
diately after CTPA using venous enhancement from
the pulmonary artery contrast bolus itself. Loud and
colleagues [19] demonstrated a sensitivity of 99%
and a specificity of 100% for femoropopliteal DVT
using CT venography. In another study comparing
indirect CT venography to US, all 15 cases of DVT
identified on US were detected on CT, plus four ad-
ditional cases not identified on US [20]. Other studies
have also shown excellent results [21]. Moreover,
these methods can study the iliac system, most of
which is inaccessible to US. Indirect techniques
represent one-step imaging for PE and DVT and
only require a few extra minutes of imaging time [22].
The former gold standard test for lower extremity
DVT, conventional venography, is an invasive proce-
dure and is now rarely used for the primary evaluation
of DVT. The many potential complications of venog-
raphy include development of DVT.
CT pulmonary angiography
With the introduction of spiral CT scans in the
early 1990s, and then with the introduction of multi-
detector scanners in the late 1990s, it has become
possible to image the entire chest in a short time and in
a single breath-hold. CTPA visualizes PE directly as
filling defects within contrast-opacified pulmonary
arteries. Unlike other techniques for visualizing PE,
it also provides an excellent study of the lung paren-
Fig. 4. Massive central PE. CTPA at the level of main
pulmonary artery shows a large filling defect extending to
the left and right pulmonary trunks.
chyma and pleura. Like CA, the test involves the use
of a moderate radiation dose and the exposure to
iodinated contrast media, but it does not require
invasive catheterization; however, the technique can
be quite sensitive to respiratory motion during imag-
ing, often an issue with patients who are dyspneic
or ventilated.
The first major comparison of CTPA to the gold
standard of CA sparked tremendous interest in the
technique [23]. Remy-Jardin and colleagues com-
pared spiral CTPA to CA in 42 patients. In the
Fig. 6. Bilateral lobar and segmental PE. CTPA shows filling
defects in right middle lobe artery and multiple lower lobe
segmental arteries (arrows). For V/Q scan on the same
patient see Fig. 2.

Fig. 7. Segmental PE. CTPA at the level of lower lobes
shows a filling defect in right posterior segmental ar-
tery (arrow).
Fig. 8. Isolated subsegmental PE. CTPA at the level of lung
bases shows a filling defect in a small subsegmental artery
of medial basal segment of right lower lobe (arrow).
A. Khan et al / Thorac Surg Clin 14 (2004) 113–124 117
19 patients who showed central PE, 18 were con-
firmed by pulmonary angiography, with an overall
sensitivity of 100% and specificity of 96%. In 1993
Teigen et al [24] used electron beam CT to evalu-
ate PE. They studied 86 patients and found similar
results, with a sensitivity of 95% and specificity of
80%. These early reports showed the ability of CT to
demonstrate emboli in the main, lobar, and segmental
branches of the pulmonary arteries (Figs. 4–8, re-
spectively); however, the accuracy of detecting sub-
segmental clots was considerably low. In 1995
Goodman et al [25] found that the sensitivity and
specificity for detecting thrombus in the central ves-
sels using helical CT were 86% and 92%, respective-
ly; however, when subsegmental arteries were
included the sensitivity was only 63%. Other studies
have found similar results [26].
Although spiral CT is quite accurate in detecting
more central PEs, it has demonstrated limited value in
the diagnosis of subsegmental emboli. The preva-
lence, detection, and significance of these emboli are
controversial. In a prospective study that included
130 patients who had PE, 22% of patients had no
larger than a subsegmental clot [27]. Other studies
showed a 5.9% [28] or a 30% [29] prevalence of PE
limited to subsegmental vessels. Baile et al found no
difference between spiral CT and pulmonary angiog-
raphy for detection of subsegmental PEs when they
injected methacrylate beads in pigs [30]. Rapid tech-
nical advances in CT techniques and machinery are
increasing the detectability of smaller clots. Using
1.25 mm CT sections, one group found that 94% and
74% of subsegmental fourth order and fifth order
vessels, respectively, could be evaluated adequately
[31]. Other studies have shown benefit from thinner
sections [32] and multidetector machinery [33]. These
techniques and equipment are rapidly propagating
through radiology departments.
Even after diagnosis of isolated subsegmental
emboli is established (Fig. 8), the clinical significance
of the finding is unclear. Patients who have limited
cardiopulmonary reserve might be at increased risk
from even a small PE. Also, a small PE can be
significant when it is a sentinel event preceding a
larger embolus (ie, when there is a large residual
DVT burden at the originating site of the embolus).
In patients who have PE there is a correlation be-
tween patient outcome and residual clot burden at US.
The practical concern is that missed subsegmental
emboli could result in a poor outcome in patients who
have false-negative CTPAwho are not anticoagulated.
This issue has been studied extensively with out-
come-based studies of patients not anticoagulated
after a negative CTPA. These reports, summarized
in Table 1, have consistently found an NPVof greater
than 94% when measured against clinical follow-up in
the absence of anticoagulation. Most of these studies
have concluded that terminating the imaging sequence
after an adequate negative CTPA appears to be safe
[34–39], although some of these patients also had
negative Doppler studies. Only one large study did not
agree with these conclusions, at least for high-risk
patients, although they also had an NPV of at least
94.7% [40]. This same study also found that in a
subset of 12 patients who had negative Dopplers and
isolated subsegmental PE on CTPA, nine patients had
negative V/Q scans or CA and did well clinically
without anticoagulation [40]. Finally, a large prospec-
tive comparison study found that the NPV of a
negative CTPA (99% in that study) was statistically

Table 1
Studies withholding anticoagulation after negative CT pulmonary angiography
No. patients NPV (%) Clinical follow-up (mo) Other patient qualifications Ref.
100 100 6 [34]
71 96 6 Nondiagnostic V/Q scans [35]
215 98.6 3 [36]
993 99.5 3 Patients studied by electron beam CT,
not helical CT; retrospective
[37]
81 95.1–97.5 21 (avg) Negative Dopplers [38]
198 99 3 [39]
507 98.2 3 Negative Dopplers [40]
Low or intermediate clinical suspicion
75 94.7 0a Negative Dopplers [40]
High clinical suspicion [41]
a These patients were studied immediately by V/Q or CA.
A. Khan et al / Thorac Surg Clin 14 (2004) 113–124118
similar to a normal V/Q study (100% NPV) [39]. The
large preponderance of evidence suggests that with-
holding anticoagulant therapy after negative CTPA
appears to be safe. In retrospect this might not be
surprising given the excellent NPV of CA itself
despite its poor interobserver agreement regarding
subsegmental clots. CA should continue to be used
for the approximately 10% of CTPA studies that
are nondiagnostic.
Another advantage of CTPA over other studies is
that it provides excellent evaluation of secondary
Fig. 9. Infarction versus atelectasis. CTPA at the level of
lung bases in a patient who had PE shows a pleural-based,
nonenhancing opacity in right lower lobe (infarct) and an
enhancing opacity in the left lower lobe (atelectasis).
signs of PE such as infarction, pulmonary artery
dilatation, atelectasis, and pleural effusion. Infarction
can be differentiated from atelectasis by its lack of
enhancement (Fig. 9).
In addition to its usefulness for diagnosing or ex-
cluding PE, CT gives unparalleled evaluation of the
lung parenchyma. Studies of CTPA reported alterna-
tive diagnoses by CTPA in 39% to 67% of patients
who did not have PE [41,42]. The alternative diag-
noses found in these studies included pneumonia,
cardiac or pericardiac disease, interstitial lung disease,
Fig. 10. Alternate diagnosis: lung cancer. Sixty-five-year-old
man who had shortness of breath and hemoptysis. V/Q scan
showed high probability for PE. CTPA showed a left hilar
mass and mediastinal adenopathy with no evidence of PE.

Fig. 11. Alternate diagnosis: pulmonary artery angiosar-
coma. Sixty-eight-year-old woman who had shortness of
breath and cold substernal sensation while playing tennis.
V/Q scan showed intermediate probability for PE. CTPA
showed a filling defect in left pulmonary artery with dis-
tension of the lumen. Biopsy of left lower lobe nodule (not
shown) revealed angiosarcoma.
A. Khan et al / Thorac Surg Clin 14 (2004) 113–124 119
malignancy, pleural effusion, and mediastinal mass
(Figs. 10–12).
The ever-increasing speed of multidetector CT
now allows for repeated scanning through the hila
during the course of the contrast bolus. A graph of
enhancement versus time allows for measurement of
functional tissue perfusion is reminiscent of nuclear
perfusion imaging but with specific anatomic detail
[43] that might, in turn, give important information
regarding patient management.
Fig. 12. Alternate diagnosis: pleural and pericardial effusion.
Sixty-year-old woman who had shortness of breath and
chest pain. rule out PE. CTPA showed no evidence of PE.
Magnetic resonance pulmonary angiography
MRPA, the ‘‘other’’ cross-sectional imaging tech-
nique, can be of use as an adjunctive technique in
selected surgical patients. Like CTPA, the test directly
detects the presence of emboli as filling defects in
contrast-labeled pulmonary arteries; however, MRPA
relies on completely different physical principles
(nuclear magnetic resonance rather than x-ray scatter-
ing) for image formation. Advantages of MRPA
include lack of ionizing radiation and the relatively
low incidence of renal and allergic complications
from gadolinium chelates [44], which facilitates im-
aging of particularly radiation-sensitive patients such
as pregnant women and patients who are allergic to
iodinated contrast or who suffer from renal insuffi-
ciency; however, MRPA is a longer, more complex,
and expensive test than CTPA, and its availability and
practicality vary widely.
Efficacy of modern gadolinium-based MRPA is
comparable to CT for segmental and larger emboli. In
a porcine model study involving 42 PEs, MRPA and
CTPA were found to have similar sensitivities (82%
versus 76%, respectively) and positive predictive
values (94% versus 92%) using a pathologic gold
standard [45]. Human studies comparing gadolinium-
based MRPA to a digital subtraction angiography
(DSA) gold standard are summarized in Table 2.
False-positives are uncommon, with specificity
reported as greater than 95% in all studies. Sensitivity
ranged from 68% to 100%; sensitivity for smaller
emboli was lower in all studies in which this discrim-
ination was made. The largest single study [46]
reported a sensitivity of only 40% for isolated sub-
segmental PEs compared with 84% for segmental and
100% for lobar or central PEs. Furthermore, outcome-
based studies following patients who had negative
MRPA (eg, those summarized in Table 1 for CTPA)
have not yet been performed for MRPA. Like CTPA, a
positive MRPA is a solid basis for treatment; however,
a negative MRPA does not exclude the possibility of
small PEs, and no adequate trials have demonstrated
the safety of withholding anticoagulation on the basis
of a negative MRPA.
Other barriers arise frequently when considering
MRPA. Critically ill patients who have many lines and
monitors can be difficult to place and adequately
monitor inside a magnet bore. Patients who have sur-
gical materials such as ferromagnetic aneurysm clips
or pacemakers must not enter an MRI facility. These
and other patients are not candidates for MRPA
[47,48]. Also, unlike CTPA, MRPA provides little
information about the lung parenchyma, so it has a

Table 2
Comparison studies of magnetic resonance angiography and digital subtraction angiography (DSA)
Emboli Sensitivity (%) Specificity (%) Distal evaluation Ref.
22 100 95 No subsegmental emboli reported on DSA [52]
19a 68 99.7 Missed 4/6 subsegmental PEs [53]
61 82 98 Missed 6/16 subsegmental PEs [48]
19 70 100 All 6 distal PEs missed [50]
Range 68–100 95–100
Each study compared gadolinium-enhanced MRA with conventional DSA, using conventional DSA as the gold standard.a All patients in this study had initial nondiagnostic V/Q scans.
A. Khan et al / Thorac Surg Clin 14 (2004) 113–124120
greatly reduced ability to provide alternative diag-
noses. Health system barriers such as availability of
magnet time, state-of-the-art MRI hardware, local
radiologist expertise, and the considerable cost of
the study must be considered in the decision to order
the test.
MRPA, like CTPA, continues to evolve and im-
prove. Early methods used mostly spin-echo or time-
of-flight techniques and were limited by flow artifacts
and long imaging times, precluding breath-hold
images (see [49] for a review). These techniques are
often still used as supplemental imaging sequences,
but MRPA in nonpregnant patients now usually
involves administration of intravenous gadolinium
as a contrast agent. These methods, pioneered in
humans by Loubeyre and colleagues [50], increase
visibility of the distal arterial tree, especially when
done using breath-hold methods. Using state-of-the-
art equipment, some MRPA techniques can now be
accomplished in as little as 4 seconds [51].
In summary, MRPA is a useful method for ruling
in a PE in selected patients who have contraindica-
tions to CTPA. A positive MRPA is specific for PE
and thus appears to be sufficient basis for treatment;
however, a negative MRPA does not fully preclude
PE in the context of high clinical suspicion. The
practicality, cost, and poor visualization of the lung
parenchyma with MRPA must also be factored into
the decision to order the test.
Imaging algorithm
Imaging studies form the mainstay of the diag-
nosis of PE. The official position of the American
Thoracic Society, as adopted in 1999, states the
matter well: ‘‘The history, physical examination,
chest radiograph, electrocardiogram, and arterial
blood gas analysis. . .by itself. . .is inadequate to
confirm or exclude the diagnosis of PE’’ [52].
The natural history of PE combined with knowl-
edge of available modalities’ strengths and weak-
nesses forms the basis for an imaging algorithm that
is appropriate for surgical patients. In all patients,
the initial imaging study should be a high-quality
CXR. A study including PA and lateral views is
preferred, although often only an antero-posterior
(AP) view is possible. The presence of an obviously
unrelated nonthrombotic explanation for the patient’s
symptoms (eg, pneumothorax, mucus plug, dislo-
cated ET tube, and so forth) should lead to appro-
priate treatment. Further imaging directed toward
embolic disease is then only pursued if symptoms
unexpectedly persist.
Most surgical patients should then be considered
for CTPA as shown in the authors’ proposed algo-
rithm (Fig. 13). CTPA has repeatedly been shown to
be an effective first-line test for PE. It can be obtained
rapidly at most centers and it is diagnostic much more
often than V/Q scanning [53,54]. CTPA has been
found to be more sensitive and specific overall in at
least one direct prospective comparison of the two
procedures as the initial test [53]. When CTPA is
nondiagnostic, consideration should be given to con-
ventional pulmonary angiography, keeping in mind
the additional cumulative load of contrast dye.
V/Q scanning is appropriate as the initial test in
low- or intermediate-risk patients who have scrupu-
lously normal PA and lateral CXRs. In these patients
the V/Q scan is often normal, which excludes the
presence of PE without the risk of iodinated contrast
material. If findings are equivocal, the algorithm
should continue with CTPA or MRPA. Patients
who had abnormal CXRs who are not candidates
for CTPA (eg, patients who have renal insufficiency
[typically Cr >1.5 mg/dL] or severe allergy to iodin-
ated contrast media) should be considered for MRPA.
Although this test has limitations and contraindica-
tions as mentioned previously, a positive MRPA is a
solid basis for treatment (Table 2) and allows the
diagnosis of PE to be made without ionizing radia-

Fig. 13. Imaging algorithm.
A. Khan et al / Thorac Surg Clin 14 (2004) 113–124 121
tion or iodinated contrast media. MRPA also often
allows for the establishment of alternative diagnoses
and simultaneous venous study, although it is not as
effective at evaluating lung parenchyma as CT. A
negative MRPA is not an adequate basis for with-
holding treatment.
The role of venous imaging is somewhat com-
plex. Doppler imaging of the legs does not detect PE
directly, and it is neither sensitive nor specific for the
condition; however, the presence of DVT puts the
patient at risk for PE even if one has not yet occurred,
and anticoagulation is indicated for the DVT alone.
Anticoagulation usually obviates further imaging for
detection of PE itself. If the clinical question is ‘‘has
the patient suffered a pulmonary embolus?’’ then
lower extremity imaging is indicated only when direct
tests for PE cannot be done, and this is how the
authors’ algorithm (Fig. 13) was designed. If the
question is ‘‘would the patient benefit from antico-
agulation?’’ then it would be reasonable to perform a
venous imaging study even when a PE has been ruled
out by CTPA, V/Q, or CA because even a DVT that
has not embolized generally deserves anticoagulation.
If desired, CT or MR venography can be performed at
the same time as CTPA (MRPA) without additional
contrast media and with little additional radiation
(in the case of CT).
Caution should be used when relying on venous
imaging to guide treatment. A negative Doppler
alone does not exclude PE. The decision to treat
inpatients who cannot leave the Surgical Intensive
Care Unit (SICU) for V/Q, CTPA, or MRPA but who
have negative Dopplers must be based on d-dimer,
CXR findings, and clinical judgment alone. Patients
treated for PE on the basis of venous imaging alone
should be reevaluated, when possible, to confirm the
diagnosis, thus ensuring that the patient’s symptoms
are not caused by another undetected condition
masquerading as PE. Under these circumstances a
negative confirmatory study for PE would not negate
the need for anticoagulation for the DVT.
The exception to the rule of imaging diagnosis of
PE is the case of massive PE. Eleven percent of pa-
tients who have PE die within 1 hour of presentation
from systemic collapse caused by increased right heart
strain and acute pulmonary hypertension leading to
cardiovascular collapse [55]. Presentation of these
patients is often dramatic, and treatment (thrombolysis
or thrombectomy) is different than for the majority of
patients who have submassive PEs. TEE can be used

A. Khan et al / Thorac Surg Clin 14 (2004) 113–124122
to investigate patients who have sudden acute shock
and appropriate physical signs, followed immediately
by thrombolysis if a central PE is found [56]. TEE can
also be used to assess for indirect signs (see [55] for a
review of these cases and their management).
Thus, each imaging modality has a role in the
diagnosis of PE. Normal V/Q, CA, or CTPA appear to
be adequate for withholding treatment, whereas high-
probability V/Q or positive MRPA, CTPA, or CA
appear to be specific. MRPA can be used when CTPA
is contraindicated, and V/Q scanning is still useful for
low- or intermediate-risk patients or patients who have
contrast allergy and contraindication to MRPA. Lower
extremity venous studies are neither sensitive nor
specific but can be done portably, whereas TEE can
detect some large central emboli quickly. For most
surgical patients, however, CTPA appears to be the
first and only advanced imaging modality needed to
diagnose or exclude PE.
References
[1] Dalen JE. Pulmonary embolism: what have we learned
since Virchow?: treatment and prevention. Chest 2002;
122(5):1801–17.
[2] Tuttle-Newhall JE, Rutledge R, Hultman CS, Fakhry
SM. Statewide, population-based, time-series analy-
sis of the frequency and outcome of pulmonary embo-
lus in 318,554 trauma patients. J Trauma 1997;42(1):
90–9.
[3] Lindblad B, Eriksson A, Bergqvist D. Autopsy-verified
pulmonary embolism in a surgical department: analysis
of the period from 1951 to 1988. Br J Surg 1991;78(7):
849–52.
[4] Gillies TE, Ruckley CV, Nixon SJ. Still missing the
boat with fatal pulmonary embolism. Br J Surg 1996;
83(10):1394–5.
[5] Abad C, Caceres JJ, Alonso A. Fatal pulmonary throm-
boembolism after laparoscopic cholecystectomy. Surg
Endosc 2001;15(11):1360–4.
[6] Jang JS, Lee SH, Jung SK. Pulmonary embolism of
polymethylmethacrylate after percutaneous vertebro-
plasty: a report of three cases. Spine 2002;27(19):
E416–8.
[7] Chen HL, Wong CS, Ho ST, Chang FL, Hsu CH, Wu
CT. A lethal pulmonary embolism during percutaneous
vertebroplasty. Anesth Analg 2002;95(4):1060–2.
[8] Tozzi P, Abdelmoumene Y, Corno AF, Gersbach PA,
Hoogewoud HM, von Segesser LK. Management of
pulmonary embolism during acrylic vertebroplasty.
Ann Thorac Surg 2002;74(5):1706–8.
[9] White RH, Henderson MC. Risk factors for venous
thromboembolism after total hip and knee replacement
surgery. Curr Opin Pulm Med 2002;8(5):365–71.
[10] Hansson PO, Welin L, Tibblin G, Eriksson H. Deep
vein thrombosis and pulmonary embolism in the gen-
eral population. The study of men born in 1913. Arch
Intern Med 1997;157(15):1665–70.
[11] Value of the ventilation/perfusion scan in acute pul-
monary embolism. Results of the prospective investi-
gation of pulmonary embolism diagnosis (PIOPED).
The PIOPED Investigators. JAMA 1990;263(20):
2753–9.
[12] Stein PD, Athanasoulis C, Alavi A, Greenspan RH,
Hales CA, Saltzman HA, et al. Complications and va-
lidity of pulmonary angiography in acute pulmonary
embolism. Circulation 1992;85(2):462–8.
[13] Stein PD, Hull RD, Saltzman HA, Pineo G. Strategy
for diagnosis of patients with suspected acute pulmo-
nary embolism. Chest 1993;103(5):1553–9.
[14] Diebold J, Lohrs U. Venous thrombosis and pulmonary
embolism. A study of 5039 autopsies. Pathol Res Pract
1991;187(2–3):260–6.
[15] Turkstra F, Kuijer PM, van Beek EJ, Brandjes DP, ten
Cate JW, Buller HR. Diagnostic utility of ultrasonog-
raphy of leg veins in patients suspected of having pul-
monary embolism. Ann Intern Med 1997;126(10):
775–81.
[16] Kearon C, Ginsberg JS, Hirsh J. The role of venous
ultrasonography in the diagnosis of suspected deep
venous thrombosis and pulmonary embolism. Ann In-
tern Med 1998;129(12):1044–9.
[17] Lensing AW, Prandoni P, Brandjes D, Huisman PM,
Vigo M, Tomasella G, et al. Detection of deep-vein
thrombosis by real-time B-mode ultrasonography. N
Engl J Med 1989;320(6):342–5.
[18] Naidich JB, Torre JR, Pellerito JS, Smalberg IS, Kase
DJ, Crystal KS. Suspected deep venous thrombosis: is
US of both legs necessary? Radiology 1996;200(2):
429–31.
[19] Loud PA, Katz DS, Klippenstein DL, Shah RD, Gross-
man ZD. Combined CT venography and pulmonary
angiography in suspected thromboembolic disease: di-
agnostic accuracy for deep venous evaluation. AJR
Am J Roentgenol 2000;174(1):61–5.
[20] Cham MD, Yankelevitz DF, Shaham D, Shah AA,
Sherman L, Lewis A, et al. Deep venous thrombosis:
detection by using indirect CT venography. The Pul-
monary Angiography-Indirect CT Venography Coop-
erative Group. Radiology 2000;216(3):744–51.
[21] Garg K, Kemp JL, Wojcik D, Hoehn S, Johnston RJ,
Macey LC, et al. Thromboembolic disease: comparison
of combined CT pulmonary angiography and venogra-
phy with bilateral leg sonography in 70 patients. AJR
Am J Roentgenol 2000;175(4):997–1001.
[22] Goodman LR. 1999 plenary session: Friday imaging
symposium: CT diagnosis of pulmonary embolism and
deep venous thrombosis. Radiographics 2000;20(4):
1201–5.
[23] Remy-Jardin M, Remy J, Wattinne L, Giraud F. Cen-
tral pulmonary thromboembolism: diagnosis with
spiral volumetric CT with the single-breath-hold tech-
nique—comparison with pulmonary angiography. Ra-
diology 1992;185(2):381–7.

A. Khan et al / Thorac Surg Clin 14 (2004) 113–124 123
[24] Teigen CL, Maus TP, Sheedy PF, Johnson CM, Stanson
AW, Welch TJ. Pulmonary embolism: diagnosis with
electron-beam CT. Radiology 1993;188(3):839–45.
[25] Goodman LR, Curtin JJ, Mewissen MW, Foley WD,
Lipchik RJ, Crain MR, et al. Detection of pulmonary
embolism in patients with unresolved clinical and scin-
tigraphic diagnosis: helical CT versus angiography.
AJR Am J Roentgenol 1995;164(6):1369–74.
[26] van Rossum AB, Pattynama PM, Ton ER, Treurniet
FE, Arndt JW, van Eck B, et al. Pulmonary embolism:
validation of spiral CT angiography in 149 patients.
Radiology 1996;201(2):467–70.
[27] de Monye W, van Strijen MJ, Huisman MV, Kieft GJ,
Pattynama PM. Suspected pulmonary embolism: preva-
lence and anatomic distribution in 487 consecutive pa-
tients. Advances in New Technologies Evaluating the
Localisation of Pulmonary Embolism (ANTELOPE)
Group. Radiology 2000;215(1):184–8.
[28] Stein PD,Henry JW. Prevalence of acute pulmonary em-
bolism in central and subsegmental pulmonary arteries
and relation to probability interpretation of ventilation/
perfusion lung scans. Chest 1997;111(5):1246–8.
[29] Oser RF, Zuckerman DA, Gutierrez FR, Brink JA.
Anatomic distribution of pulmonary emboli at pulmo-
nary angiography: implications for cross-sectional
imaging. Radiology 1996;199(1):31–5.
[30] Baile EM, King GG, Muller NL, D’Yachkova Y,
Coche EE, Pare PD, et al. Spiral computed tomogra-
phy is comparable to angiography for the diagnosis
of pulmonary embolism. Am J Respir Crit Care Med
2000;161(3 Pt 1):1010–5.
[31] Ghaye B, Szapiro D, Mastora I, Delannoy V, Duhamel
A, Remy J, et al. Peripheral pulmonary arteries: how
far in the lung does multi-detector row spiral CT allow
analysis? Radiology 2001;219(3):629–36.
[32] Schoepf UJ, Holzknecht N, Helmberger TK, Crispin
A, Hong C, Becker CR, et al. Subsegmental pulmonary
emboli: improved detection with thin-collimation
multi-detector row spiral CT. Radiology 2002;222(2):
483–90.
[33] Raptopoulos V, Boiselle PM. Multi-detector row spi-
ral CT pulmonary angiography: comparison with sin-
gle-detector row spiral CT. Radiology 2001;221(3):
606–13.
[34] Lomis NN, Yoon HC, Moran AG, Miller FJ. Clinical
outcomes of patients after a negative spiral CT pulmo-
nary arteriogram in the evaluation of acute pulmonary
embolism. J Vasc Interv Radiol 1999;10(6):707–12.
[35] Ost D, Rozenshtein A, Saffran L, Snider A. The neg-
ative predictive value of spiral computed tomography
for the diagnosis of pulmonary embolism in patients
with nondiagnostic ventilation–perfusion scans. Am J
Med 2001;110(1):16–21.
[36] Gottsater A, Berg A, Centergard J, Frennby B, Nirhov
N, Nyman U. Clinically suspected pulmonary embo-
lism: is it safe to withhold anticoagulation after a nega-
tive spiral CT? Eur Radiol 2001;11(1):65–72.
[37] Swensen SJ, Sheedy PF, Ryu JH, Pickett DD, Schleck
CD, Ilstrup DM, et al. Outcomes after withholding
anticoagulation from patients with suspected acute pul-
monary embolism and negative computed tomographic
findings: a cohort study. Mayo Clin Proc 2002;77(2):
130–8.
[38] Bourriot K, Couffinhal T, Bernard V, Montaudon M,
Bonnet J, Laurent F. Clinical outcome after a negative
spiral CT pulmonary angiographic finding in an inpa-
tient population from cardiology and pneumology
wards. Chest 2003;123(2):359–65.
[39] Goodman LR, Lipchik RJ, Kuzo RS, Liu Y, McAuliffe
TL, O’Brien DJ. Subsequent pulmonary embolism:
risk after a negative helical CT pulmonary angio-
gram—prospective comparison with scintigraphy. Ra-
diology 2000;215(2):535–42.
[40] Musset D, Parent F, Meyer G, Maitre S, Girard P,
Leroyer C, et al. Diagnostic strategy for patients with
suspected pulmonary embolism: a prospective
multicentre outcome study. Lancet 2002;360(9349):
1914–20.
[41] Tillie-Leblond I, Mastora I, Radenne F, Paillard S,
Tonnel AB, Remy J, et al. Risk of pulmonary embo-
lism after a negative spiral CT angiogram in patients
with pulmonary disease: 1-year clinical follow-up
study. Radiology 2002;223(2):461–7.
[42] Kim KI, Muller NL, Mayo JR. Clinically suspected
pulmonary embolism: utility of spiral CT. Radiology
1999;210(3):693–7.
[43] Schoepf UJ, Bruening R, Konschitzky H, Becker CR,
Knez A, Weber J, et al. Pulmonary embolism: compre-
hensive diagnosis by using electron-beam CT for de-
tection of emboli and assessment of pulmonary blood
flow. Radiology 2000;217(3):693–700.
[44] Runge VM. Safety of approved MR contrast media for
intravenous injection. J Magn Reson Imaging 2000;
12(2):205–13.
[45] Reittner P, Coxson HO, Nakano Y, Heyneman L, Ward
S, King GG, et al. Pulmonary embolism: comparison
of gadolinium-enhanced MR angiography with con-
trast-enhanced spiral CT in a porcine model. Acad Ra-
diol 2001;8(4):343–50.
[46] Oudkerk M, van Beek EJ, Wielopolski P, van Ooijen
PM, Brouwers-Kuyper EM, Bongaerts AH, et al. Com-
parison of contrast-enhanced magnetic resonance an-
giography and conventional pulmonary angiography
for the diagnosis of pulmonary embolism: a prospec-
tive study. Lancet 2002;359(9318):1643–7.
[47] Kanal E, Borgstede JP, Barkovich AJ, Bell C, Bradley
WG, Felmlee JP, et al. American College of Radiology
white paper on MR safety. AJR Am J Roentgenol 2002;
178(6):1335–47.
[48] Shellock FG. Magnetic resonance safety update 2002:
implants and devices. J Magn Reson Imaging 2002;
16(5):485–96.
[49] Erdman WA, Clarke GD. Magnetic resonance imaging
of pulmonary embolism. Semin Ultrasound CT MR
1997;18(5):338–48.
[50] Loubeyre P, Revel D, Douek P, Delignette A, Baldy C,
Genin G, et al. Dynamic contrast-enhancedMR angiog-
raphy of pulmonary embolism: comparison with pul-

A. Khan et al / Thorac Surg Clin 14 (2004) 113–124124
monary angiography. AJR Am J Roentgenol 1994;
162(5):1035–9.
[51] Goyen M, Laub G, Ladd ME, Debatin JF, Barkhausen
J, Truemmler KH, et al. Dynamic 3D MR angiography
of the pulmonary arteries in under four seconds.
J Magn Reson Imaging 2001;13(3):372–7.
[52] Tapson VF, Carroll BA, Davidson BL, Elliott CG, Fe-
dullo PF, Hales CA, et al. The diagnostic approach to
acute venous thromboembolism. Clinical practice
guideline. American Thoracic Society. Am J Respir
Crit Care Med 1999;160(3):1043–66.
[53] Blachere H, Latrabe V, Montaudon M, Valli N, Couf-
finhal T, Raherisson C, et al. Pulmonary embolism re-
vealed on helical CT angiography: comparison with
ventilation – perfusion radionuclide lung scanning.
AJR Am J Roentgenol 2000;174(4): 1041–7.
[54] Crawford T, Yoon C, Wolfson K, Beller M, Emerick A,
Goldin JG, et al. The effect of imaging modality on
patient management in the evaluation of pulmonary
thromboembolism. J Thorac Imaging 2001;16(3):
163–9.
[55] Wood KE. Major pulmonary embolism: review of a
pathophysiologic approach to the golden hour of he-
modynamically significant pulmonary embolism. Chest
2002;121(3):877–905.
[56] Krivec B, Voga G, Zuran I, Skale R, Pareznik R, Pod-
bregar M, et al. Diagnosis and treatment of shock due
to massive pulmonary embolism: approach with trans-
esophageal echocardiography and intrapulmonary
thrombolysis. Chest 1997;112(5):1310–6.

Thorac Surg Clin 14 (2004) 125–133
Computer-aided diagnostics
Anthony P. Reeves, PhDa,*, Bryan M. Kressler, BSb
aSchool of Electrical and Computer Engineering, Cornell University, 331 Rhodes Hall, Ithaca, NY 14853, USAbBiomedical Engineering Program, Cornell University, 357 Rhodes Hall, Ithaca, NY 14853, USA
In this paper the authors provide an overview of Each of these domains is considered in turn. The
recent work in using computer analysis of CT images
of the lungs to aid the physician in diagnosing dis-
eases of the lung and planning treatments, with par-
ticular attention to lung cancer. Computers can provide
such aid in several domains:
1. Image visualization: by providing different
viewing options, the computer can present
image data to the radiologist in a more con-
venient form for diagnosis or to a surgeon in
such a way that anatomic relationships can be
recognized more easily
2. Detection: the computer can be used to detect
lung abnormalities automatically, especially in
typical situations in which whole-lung scans
consist of hundreds of images and the abnor-
mality is small and might only be visible on
one image
3. Characterization: the computer can make mea-
surements on a pulmonary nodule to determine
its malignancy status; currently, the most ac-
curate measurement for predicting malig-
nancy is growth rate, which is determined
from the change in nodule size in two time-
separated scans
4. Abnormality documentation and treatment
evaluation: if many nodules are present, the
computer is ideal for the tedious cataloging and
documenting task. Furthermore, for treatment
evaluation the computer can be used to quan-
titatively measure the difference through the
whole-lung region before and after surgical or
nonsurgical treatments
1547-4127/04/$ – see front matter D 2004 Elsevier Inc. All right
doi:10.1016/S1547-4127(04)00030-1
* Corresponding author.
E-mail address: [email protected] (A.P. Reeves).
lung is a particularly convenient organ for CT image
analysis because many abnormalities show up as
brighter image regions on the dark lung parenchyma
background, which is in contrast to other organs, in
which the contrast is much less and the delineation
of abnormal tissue is typically more difficult. The
lung also presents a unique challenge to accurate mea-
surement because of its compressible nature. Image
analysis is complicated, for example, by change in
patient position, degree of inspiration, heart motion
image artifacts, and body movement image artifacts.
CT technology has made considerable advances
over the past decade, providing better information
and greater challenges for the radiologist. Newer
multislice scanners can capture many more images
in a single breath-hold. Consequently, the radiologist
is confronted with the task of examining several
hundred images for a single whole-lung scan rather
than the tens of images characteristic of older scan-
ners. Furthermore, these images are now often re-
corded using a low-dose protocol, which means that
there is much more image noise, making the reading
more difficult. However, for computer analysis the
thinner slices provide a tremendous opportunity for
considering the CT scan as single three-dimensional
(3D) image rather than the traditional viewpoint of a
set of individual two-dimensional images. Computer
methods can use true 3D geometric analysis, which
is much simpler and more direct than the two-
dimensional counterpart.
For 3D geometric techniques to be used, the 3D
image must have a close to isotropic voxel size. The
resolution in the axial direction (slice thickness) must
be similar to the in-plane resolution (pixel size). For
example, a typical whole-lung image has a pixel size
of about 0.6 � 0.6 mm. If the slice thickness is
s reserved.

A.P. Reeves, B.M. Kressler / Thorac Surg Clin 14 (2004) 125–133126
10 mm, there is an anisotropic mismatch of 10 to 0.6
or about 18 to 1. For a 1 mm slice thickness the ratio
is 1:0.6 or about 1.8:1. The most recent multislice
scanners offer 0.5 mm slice thickness, in which the
ideal 1:1 ratio is achievable.
The main benefits of computer-aided image analy-
sis are realized when quantitative methods are used
for measuring and classifying image characteristics.
Image visualization, in which the computer provides
a more human-convenient presentation of image
data, has been the more traditional use of computer
assistance; however, such a qualitative approach
leaves the image analysis and decision making en-
tirely up to the radiologist. In contrast, quantitative
data analysis can provide three major benefits to
the radiologist:
1. More accurate and repeatable measurements.
The computer does not suffer from fatigue and
will consistently use the same measurement
algorithm with the same parameters every time
it is applied. In contrast, humans use a num-
ber of subjective judgments in making mea-
surements and there are many sources of
measurement variation. However, the computer
sometimes makes mistakes in locating the cor-
rect boundary for a region of interest. Therefore,
a good strategy is to have the human observe the
decisions made by computer and to manually
override the measurement process when any
incorrect computer decisions are observed.
2. Large database for diagnosis. Diagnosis by
computer involves comparing the quantitative
information from an image with knowledge of
all previous examples that the computer has in
its database. This knowledge can be recorded
in the computer in many ways, from a set of
actual images to a set of derived measurement
parameters. However the data are organized,
the general result is that the larger the knowl-
edge database (number of cases), the better the
quality of the computer diagnosis. Given that
memory to store the cases is no longer a major
consideration for modern computer technology,
clinicians can anticipate that performance of
computer diagnosis methods will continue
to improve with time. Compare this scenario
to the physician, who must typically make a
judgment based on a lifetime personal experi-
ence of only a few hundred cases.
3. Management of large data sets. The computer
is an excellent data manager ideally suited to
the tedious task of documenting all abnormali-
ties that might be present in a single whole-
lung scan. Furthermore, it is equally well suited
to matching two time-separated whole-lung
scans and documenting the changes that have
occurred in the period between them. For
radiologists this is an arduous, time-consuming
task that is difficult to perform consistently for
long periods of time.
Recent advances in qualitative image visualization
are considered in the next section, followed by the
advantages of using quantitative methods for de-
tection, characterization, and general documentation.
Visualization
Unlike chest radiographs (the original standard for
chest radiography), the visualization of CT images
has always required computer assistance in the form
of digital reconstruction algorithms, even when the
images are presented to the radiologist on a film
base. To acquire CT image data, several parameters,
including the dose and slice thickness, need to be pre-
established; however, to view a CT image a radi-
ologist must specify a number of post hoc parameters
when the raw CT image data has been acquired.
These parameters include brightness and contrast
(level and widow), spatial enhancement, and the field
of view (magnification). The use of film fixes these
parameters while the use of a soft-copy computer dis-
play device permits the radiologist to modify these
parameters in real time while viewing the image data.
The standard radiology soft-copy viewing station
is designed to accommodate a range of imaging
modalities. Constraints on projective images such as
chest radiographs and mammograms require high
resolution and a well-controlled viewing environment;
hence, most such soft-copy systems are costly and
involve a special high-resolution grayscale monitor.
The viewing requirements for high-contrast lung
CT scans are, in general, less stringent than for pro-
jective images. Many standard PCs offer adequate
quality viewing characteristics for viewing CT image
data, especially for the characterization of previously
identified nodules. Furthermore, they offer color as
one means of drawing attention to regions of interest
such as lung abnormalities. Standard computer
graphics methods coupled with simple computer
analysis offer alternative modes for viewing CT image
data, and vendors are introducing such methods.
Acceptance of these methods by radiologists has been
rather slow; possibly one factor is the difficulty in
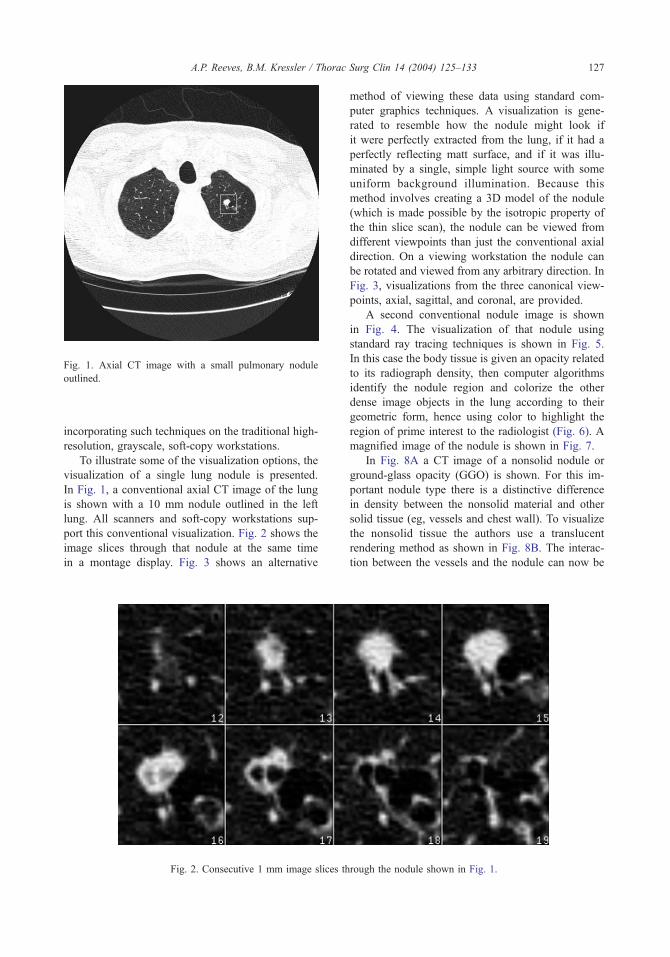
Fig. 1. Axial CT image with a small pulmonary nodule
outlined.
A.P. Reeves, B.M. Kressler / Thorac Surg Clin 14 (2004) 125–133 127
incorporating such techniques on the traditional high-
resolution, grayscale, soft-copy workstations.
To illustrate some of the visualization options, the
visualization of a single lung nodule is presented.
In Fig. 1, a conventional axial CT image of the lung
is shown with a 10 mm nodule outlined in the left
lung. All scanners and soft-copy workstations sup-
port this conventional visualization. Fig. 2 shows the
image slices through that nodule at the same time
in a montage display. Fig. 3 shows an alternative
Fig. 2. Consecutive 1 mm image slices th
method of viewing these data using standard com-
puter graphics techniques. A visualization is gene-
rated to resemble how the nodule might look if
it were perfectly extracted from the lung, if it had a
perfectly reflecting matt surface, and if it was illu-
minated by a single, simple light source with some
uniform background illumination. Because this
method involves creating a 3D model of the nodule
(which is made possible by the isotropic property of
the thin slice scan), the nodule can be viewed from
different viewpoints than just the conventional axial
direction. On a viewing workstation the nodule can
be rotated and viewed from any arbitrary direction. In
Fig. 3, visualizations from the three canonical view-
points, axial, sagittal, and coronal, are provided.
A second conventional nodule image is shown
in Fig. 4. The visualization of that nodule using
standard ray tracing techniques is shown in Fig. 5.
In this case the body tissue is given an opacity related
to its radiograph density, then computer algorithms
identify the nodule region and colorize the other
dense image objects in the lung according to their
geometric form, hence using color to highlight the
region of prime interest to the radiologist (Fig. 6). A
magnified image of the nodule is shown in Fig. 7.
In Fig. 8A a CT image of a nonsolid nodule or
ground-glass opacity (GGO) is shown. For this im-
portant nodule type there is a distinctive difference
in density between the nonsolid material and other
solid tissue (eg, vessels and chest wall). To visualize
the nonsolid tissue the authors use a translucent
rendering method as shown in Fig. 8B. The interac-
tion between the vessels and the nodule can now be
rough the nodule shown in Fig. 1.

Fig. 3. 3D reconstructions of the nodule shown in Fig. 2 rendered from three orthogonal viewing directions: axial, sagittal,
and coronal.
A.P. Reeves, B.M. Kressler / Thorac Surg Clin 14 (2004) 125–133128
seen. Further, the authors can remove the vessels
from consideration as shown in Fig. 8C to have an
unobstructed view of the whole nodule’s shape.
While visualization is important, especially for the
correct interpretation of image data by radiologists,
the real power of the computer is in the quantitative
analysis of the data to directly determine clinically
relevant information. The visualizations shown in
Fig. 9 show a rendering of a geometrical model of
a nodule derived from the nodule size measurements
extracted from the computer segmentation process.
This reference (see Fig. 3) is derived from the
quantitative analysis, whereas other renderings are
Fig. 4. Conventional focused study image of a small, solid
pulmonary nodule.
computed without explicit segmentation, and mea-
surements cannot be made from them.
Detection
A computer assistant for detection examines a
whole-lung CT scan for any evidence of pulmonary
nodules and reports the locations of suspected nodule
to the radiologist. The most common scenario (one
that is currently the most likely to be approved by the
U.S. Food and Drug Administration) is to use com-
puter-detected results as a second read. When the
Fig. 5. Ray-traced rendering of the nodule shown in Fig. 4.

Fig. 6. Color-coded rendering of the nodule shown in Fig. 4.
Fig. 7. Magnified view of the nodule shown in Fig. 6.
A.P. Reeves, B.M. Kressler / Thorac Surg Clin 14 (2004) 125–133 129
radiologist has performed a conventional reading of
the scan, the computer highlights possible nodule
locations that have not been documented by the
radiologist. The radiologist then examines these loca-
tions with a view to modifying the report.
The critical issue is that the detection system
must be sensitive enough to detect essentially all
nodules without indicating too many false alarms
(false-positives). To achieve this performance, the
detection algorithm must have a high sensitivity and
specificity. Furthermore, a sensitivity parameter needs
to be set to fix the sensitivity/specificity tradeoff to
the optimal value for a given clinical reading task.
Of importance to a detection system is the defini-
tion of a nodule or a reportable event. In general,
large nodules are easier to identify for the radiologist
and the machine. The task of nodule identification
becomes increasingly more difficult as the nodule
size approaches the voxel size of the scanner. Fur-
thermore, as nodules of a smaller size are detected
and characterized, there is a higher probability that
smaller, benign nodules will be detected. Clinically
relevant nodules are currently considered to be in the
3 mm to 3 cm size range. In addition, other lung
abnormalities might be of interest to the radiologist,
and the issue of reporting these abnormalities should
be addressed.
Experimental computer-aided systems for lung
nodule detection are currently being developed and
evaluated. Basic algorithms now exist for nodule
detection [1–3]; however, more work is needed to
optimize these methods and to establish appropriate
parameters for general clinical use. For example, the
specification of exactly what abnormalities are to
be reported and the appropriate size and sensitivity
settings commiserate with an acceptable rate of false-
positives for clinical use must be determined. Further-
more, as technology improves and more experience
is gained, it is anticipated that future methods will
achieve a significant improvement with respect to
sensitivity and specificity.
Characterization
The computer can aid the physician in a number
of ways by characterizing the detected nodule. Be-
yond a variety of special visualizations, the computer
can provide quantitative measurements on that nodule
for the physician to interpret or it can perform a
classification on these measurements (based on a
large number of previously diagnosed nodules) to
directly determine the probability of malignancy.
The basic procedure for nodule characterization is
1. Segmentation, determining which voxels be-
long to the nodule and which do not
2. Feature extraction, making quantitative mea-
surements on the nodule voxels
3. Diagnosis/classification, determining the prob-
ability of malignancy from a statistical analysis
of the extracted features
Two basic methods have been explored to deter-
mine the malignancy status of a nodule by computer
evaluation: shape features and size change. In the

Fig. 8. Visualization of a nonsolid nodule. (A) CT image. (B) Rendered as a translucent blue region with vessels marked in red.
(C) With vessels removed.
Fig. 9. Light-shaded views of the segmented nodule in Fig. 4.
A.P. Reeves, B.M. Kressler / Thorac Surg Clin 14 (2004) 125–133130

A.P. Reeves, B.M. Kressler / Thorac Surg Clin 14 (2004) 125–133 131
shape feature method a number of measurements are
made on the nodule voxels from a CT scan and these
features are used to predict malignancy by way of a
classifier that has been trained on a database consist-
ing of documented malignant and benign nodules.
This method has been explored in research settings,
and while the initial results are quite promising [4],
more research is needed. The second method is to
measure growth rate from the nodule size change in
two time-separated CT scans. In preliminary studies
[5] a high growth rate has been found to be an ex-
cellent predictor of malignancy; however, this ap-
proach has the drawbacks of requiring a second CT
scan and the delay in diagnosis caused by the re-
quired time period between scans
CT manufacturers and other vendors are now pro-
viding 3D nodule growth estimation tools. Issues
with this approach are that the two scans must be
of a high quality and recorded with the same CT scan
parameters, and the time delay between scans must
be long enough to obtain a sufficiently accurate mea-
surement to predict malignancy, but this delay needs
to be minimized to reduce patient anxiety. For cur-
rent CT scanner technology, this optimal time period
Fig. 10. Nodule candidate locations displayed o
might be several months for small nodules, reducing
to perhaps less than 1 month for larger (1 cm) nodules.
Documentation and health evaluation
Beyond detecting andmeasuring nodules, the com-
puter system should also be capable of facilitating
other operations such as whole-lung health monitor-
ing and automated nodule cataloging. This is espe-
cially important for repeat scans in a screening or
treatment scenario. This operation in itself does not
require any new technological developments; rather, it
requires the development of a patient management
system that goes beyond conventional Radiological
Information Systems (RIS). For example, the authors
have built into their data management system a whole-
lung volume and emphysema analysis capability. The
computer automatically delineates the whole lung
parenchyma region from the CT images and computes
the lung volume. An analysis of the density distribu-
tion of the lung parenchyma is also computed to
produce a visualization of the spatial distribution of
emphysema. The outcome of this analysis presented
n a coronal projection image of the lungs.

Fig. 11. Emphysema visualization on a coronal projection of the lungs.
A.P. Reeves, B.M. Kressler / Thorac Surg Clin 14 (2004) 125–133132
from a coronal viewpoint is shown in Figs. 10,11.
Whole-lung analysis of this type can be applied au-
tomatically to all CT scans before physician evalua-
tion on a routine basis.
Discussion
Recent computer methods have been used to
enhance the visualization of CT images for diagnostic
purposes and to provide quantitative measurements
on these images. It is in the latter respect that
computer methods are most powerful as a diagnostic
tool. The advantages to diagnostic radiology are self-
evident; however, these methods can also be applied
to aid treatment and intervention.
Many quantitative and qualitative improvements
can be anticipated in the anatomic analysis of the
chest CT. Algorithms have been developed for the
automatic segmentation of major anatomical regions
from chest CT scans; however, the authors anticipate
that future algorithm development will result in the
automatic segmentation of all major bone and tissue
regions in the thorax. The lung regions themselves
are extracted easily, as are the trachea and major
bronchi. Current efforts include the bone structures.
For the surgeon, these methods can be used for
surgical planning in the preoperative phase. The
boundaries of the lobes can be visualized and the
abnormality can be viewed from different directions
to present its spatial relationship to other structures
within the lung. The health of other structures can be
evaluated; the diameters of vessels, for example, can
be measured. The amount of healthy lung that is being
resected can be measured in emphysema patients so
that the amount of tissue removed can be modified.
Another area of development includes methods to
model how the lobes and the remaining lung will
remodel after surgery to anticipate any complications.
In addition, better scanner sensitivity coupled with
new algorithmic developments can achieve a more
precise evaluation of invasion, especially in critical
areas of the major vessels and the mediastinum.
This 3D visualization can be made available at
the operating table on a flat-panel screen, where it can
be referred to and manipulated in real time. Such
facilities can also be integrated with video-assisted
thoracic surgery (VATS) camera images. Additional
integrated visualizations can be provided based on
camera viewpoint, previous camera images, and avail-
able CT images.
In the postoperative domain, image analysis can
also provide a number of benefits. The effects of
medication can be measured accurately, and the
volume capacity of the lungs can be compared before
and after surgery and as healing progresses. Further,
the healing process itself can be monitored carefully;
the development of scar tissue and its growth pattern
can be ascertained. The effects of medication can be
evaluated and the optimal strategies for recovery can
be determined for an individual patient and for
refining the methods of standard practice.

A.P. Reeves, B.M. Kressler / Thorac Surg Clin 14 (2004) 125–133 133
Summary
The computer can be used in a number of ways
to aid the physician to interpret CT lung images.
Commercial tools are becoming available to assist
the radiologist in growth rate determination, hence
cancer diagnosis. Computer algorithms are in devel-
opment that will permit lung health evaluation, in-
cluding nodule detection. Finally, the results of such
efforts will probably produce more detailed visual-
izations of the lung region, including depictions of the
location and state of lung abnormalities. While com-
puter methods have found a first application with the
radiologist, these methods should also provide a
valuable aid to surgery and pathology.
References
[1] Lee Y, Hara T, Fujita H, Itoh S, Ishigaki T. Automated
detection of pulmonary nodules in helical CT images
based on an improved template-matching technique.
IEEE Trans Med Imaging 2001;20(7):595–604.
[2] Fan L, Qian J, Ordy B, Shen H, Naidich D, Kohl G,
et al. Automatic segmentation of pulmonary nodules by
using dynamic 3D cross-correlation for interactive CAD
systems. In: Sonka M, Fitzpatrick JM, editors. Proceed-
ings of the SPIE 2002;4648:1362–9.
[3] Taguchi H, Kawata Y, Niki N, Satoh H, Ohmatsu H,
Kakinuma R, et al. Lung cancer detection based on
helical CT images using curved surface morphology
analysis. SPIE Conference on Image Processing 1999;
3661:1307–14.
[4] Reeves AP, Kostis WJ, Yankelevitz DF, Henschke CI.
Three-dimensional shape characterization of solitary
pulmonary nodules from helical CT scans. In: Lemke
HU, Vannier MW, Inamura K, Farman AG, editors.
Proceedings of Computer Assisted Radiology and Sur-
gery (CARS ’99). New York: Elsevier Science; 1999.
p. 83–7.
[5] Yankelevitz DF, Reeves AP, Kostis WJ, Zhao B, Hens-
chke CI. CT evaluation of small pulmonary nodules
based on volumetrically determined growth rates. Radi-
ology 2000;217:251–6.

Thorac Surg Clin 14 (2004) 135–149
Future generation CT imaging
Deborah Walter, PhD*, Bruno De Man, PhD, Maria Iatrou, PhD,Peter M. Edic, PhD
Computed Tomography Systems and Applications Laboratory, GE Global Research Center, One Research Circle,
Niskayuna, NY 12309, USA
Since the 1970s CT has been used to generate porating multiple detector rows with improved reso-
cross-sectional images of human anatomy from x-ray
projection data acquired at many angular positions
around the body. The development of the first CT
scanner is credited to Hounsfield [1], using recon-
struction methods developed by Cormack [2]. Since
then several key technological advancements have
increased the usefulness of CT to the point where it
has become an essential tool in the clinical evaluation
of patients, with most hospitals having CT scanners
available 24 hours a day, 7 days a week. First-
generation CT systems, which used a single, thin
x-ray beam and a single detector element to acquire
the x-ray projection data necessary for image recon-
struction, quickly evolved into third-generation sys-
tems, which use a fan-shaped x-ray beam combined
with a rotating x-ray tube and detector to acquire the
x-ray projection data needed for image reconstruc-
tion. With the development of helical CT systems in
the late 1980s [3–6], large sections of anatomy could
be scanned quickly using linear, continuous table mo-
tion, enabling faster throughput and better registration
between adjacent slices of the body. Electron beam
CT (EBCT) technology, incorporating a stationary
detector and using an x-ray tube comprised of a
stationary target ring and a swept electron beam,
was developed in 1983 to scan the heart and coronary
arteries at subsecond scan times, thereby reducing
motion artifacts resulting from the beating of the heart
during data acquisition [7]. Recently, CT has further
evolved from single-slice scanners to systems incor-
1547-4127/04/$ – see front matter D 2004 Elsevier Inc. All right
doi:10.1016/S1547-4127(04)00040-4
* Corresponding author.
E-mail address: [email protected] (D. Walter).
lution, with the introduction of multislice CT (MSCT)
in 1998, enabling high-resolution, thin-slice scanning
of large sections of human anatomy.
Over the years CT scanning has found widespread
use in imaging applications for trauma assessment,
thoracic and vascular studies, and stroke assessment, as
well as emerging applications in cardiac imaging, lung
cancer detection, colonoscopy, and brain and myo-
cardial perfusion. The goal of this article is to outline
some of the recent technological advances that will
drive future CT evolution and to describe the recently
enabled applications and trends in chest imaging.
Image acquisition aspects
Image acquisition with today’s multislice scanner
is more flexible when compared with a single-slice
scanner because many scanning modes are made
available to the clinician. For example, several com-
binations of slice thickness and helical pitch can now
be used to scan the full thorax within a single breath-
hold, giving clinicians many options to maximize the
clinical value of the acquired images. Because more
protocol options are available to the clinician, it is im-
portant to understand the relationship between scanner
parameters and resulting image quality so that the
acquisition can be tailored to meet the particular
imaging need. Some of the key geometric parameters
are identified in Fig. 1, a third-generation CT system.
Two important characteristics to consider when
thinking about CT image quality are spatial resolu-
tion and image noise. The key imaging parameters
s reserved.

Fig. 1. Third-generation multislice CT scanner. Front view (left) shows the x-ray tube and the x-ray detector. The patient lies
along the axis of rotation. The scan field of view is the circular region inscribed in the rotating fan beam. The side view (right)
shows the relationship between the cone angle, the longitudinal size of the detector, and the z-coverage, which is measured at the
isocenter. The z-dimensions are strongly exaggerated for clarity.
D. Walter et al / Thorac Surg Clin 14 (2004) 135–149136
that affect spatial resolution in reconstructed images
are the
� Size of the focal spot in the x-ray tube� Length, width, and configuration of the detector
cells� Location and number of angular positions at
which x-ray projection data are acquired as
the x-ray source and detector rotate around
the patient� Filter used to preprocess the x-ray projection
data before image reconstruction� Helical pitch ratio prescribing the table speed
The key imaging parameters that affect image
noise are the size and anatomy of the patient being
scanned, the operating voltage and current of the
x-ray tube, the rotational speed of the gantry com-
prising the x-ray tube and detector, in addition to all
of the parameters that affect spatial resolution.
The main source of image noise in reconstructed
CT images is the statistical nature of x-ray photons.
For each detector channel the deviation of the mea-
sured attenuation of x-rays along a particular direc-
tion from the true attenuation value decreases as the
number of detected photons increases. Consequently,
image noise decreases with increased x-ray tube
current (at the expense of increased patient dose),
increased detector size (at the expense of decreased
spatial resolution), and reduced attenuation (in a
small patient or low-density objects such as lungs).
Given the complex relationships between the imaging
parameters and their impact on image quality, future
imaging protocols will likely migrate from specifying
individual acquisition parameters to specifying image
quality and dose requirements, enabling the opti-
mal acquisition protocol to be implemented on the
scanner [8,9].
Technological advances and trends
Since its conception in the early 1970s CT has
undergone an enormous metamorphosis. The first CT
scanners [1] produced a 1 cm thick slice in about
4 minutes. Current scanners can produce 16 slices
at submillimeter resolution in less than 1 second
[10–13]. The following sections describe what the
authors believe are currently the major trends in
CT scanner technology development.
Spatial resolution
Today, modern medical CT scanners can resolve
objects that are less than 1 mm in size. Nevertheless,
many applications would benefit from the ability to
visualize even smaller structures. In particular, clini-
cians are interested in isotropic spatial resolution (ie,
the longitudinal resolution is equally good as the in-
plane resolution). Isotropic resolution allows the
clinician to visualize reconstructed data along various
planar reformats without loss of detail in the images.
The spatial resolution of a CT scanner is limited
by several factors: the effective size of the x-ray tube
focal spot, the size of the individual detector cells, the
data sampling pattern implemented by the imaging
geometry, and the stages in the reconstruction algo-
rithm. It is important to realize that spatial resolution

D. Walter et al / Thorac Surg Clin 14 (2004) 135–149 137
is not equal to the image pixel/voxel size but is an
intrinsic property of the scanner. Therefore, the op-
erator must adjust the pixel size by appropriately
selecting the field of view of the reconstruction so
that it is not a limiting factor of spatial resolution. To
develop CT scanners that have increased spatial
resolution, one has to reduce the focal spot size,
reduce the detector cell size, and increase the number
of angular positions at which x-ray projection data are
acquired. The increased number of detector channels,
the increased number of views, and the increased
number of reconstructed image voxels result in much
larger datasets, meaning larger computation times and
larger storage requirements. To maintain an accept-
able noise level at higher spatial resolution, one has to
increase the x-ray flux, resulting in an increased
patient dose (see section on dose reduction in this
article). Using a smaller focal spot size limits the
maximum output flux from the x-ray tube for thermal
reasons, resulting in higher image noise.
Researchers at the GE Global Research Center
developed a number of research CT scanners recently
based on a flat panel detector consisting of a grid of
1024 � 1024 detector cells, each 200 mm � 200 mmin size, to explore the clinical impact of higher spatial
resolution in combination with large volume cover-
age [14]. Fig. 2A shows the image of a plastinated
dog lung phantom scanned on a Lightspeed clinical
scanner (GE Medical Systems, Milwaukee, Wiscon-
sin). Fig. 2B shows GE’s volumetric CT research
system. The improvement in the image sharpness
Fig. 2. High-resolution axial image of plastinated dog lung phantom
1.8 cm2. (a) This image was obtained with a GE Lightspeed system
helical pitch of 1.5:1, and reconstructed with the bone kernel. (b) Th
volumetric CT prototype system capable of 250 mm isotropic re
comparing features of similar size, the high-resolution volumetric
achieved in future commercial CT scanners. Because the lung tissu
with air. (CT image courtesy of Rebecca Fahrig, PhD Stanford U
courtesy of GE Global Research Center, Niskayuna, NY; phantom
demonstrates the resolution improvement that is pos-
sible in future CT scanners.
Volume coverage
From CT’s conception until the late 1990s, CT
data have always been acquired one slice at a time.
One exception was CT Twin (Elscint, Haifa, Israel), a
dual-slice CT scanner made in 1992. It was not until
1998 that four manufacturers (GE, Siemens, Toshiba,
and Marconi) manufactured a four-slice CT scanner
simultaneously. The most recent commercial scanners
allow the acquisition of 16 slices simultaneously
[10–13]. The basic principle behind multislice CT in-
volves stacking a number of detector rows longitu-
dinally (Fig. 3) [15,16], which explains why some
people use the term multidetector instead of multi-
slice, although strictly speaking it is still one detector
consisting of a two-dimensional array of detector
cells. Typically, the detector consists of a larger num-
ber of detector rows that are binned together longi-
tudinally depending on the desired slice thickness.
Some manufacturers prefer to use thinner detector
rows in the center and thicker detector rows at the
ends; other manufacturers prefer to use detector rows
of equal size.
The main advantage of multislice scanners is the
ability to scan a given volume in a shorter time, or
vice versa, scan a larger volume within a given time.
This ability has an enormous impact on clinical
applications, as discussed in more detail in the
. Both images represent a region of interest of approximately
at 120 kVp, 100 mA, 4 � 1.25 mm detector collimation, a
e image is the same phantom imaged on a GE high-resolution
solution. The two images are not registered; however, by
CT image demonstrates the resolving power that could be
e was dried before plastination, all vessels appear to be filled
niversity, Stanford, CA; high-resolution volumetric image
developed by Dr. Robert Henry, University of Tennessee.)

Fig. 3. Comparison of single-slice and multislice CT scan-
ner. A single-slice CT scanner has only one detector row. In
multislice CT, the detector consists of multiple rows that are
stacked longitudinally and can be configured in one of sev-
eral topologies for various choices of slice thickness. The
x-ray source illuminates multiple rows simultaneously. A
16-slice scanner can read out 16 slices simultaneously.
D. Walter et al / Thorac Surg Clin 14 (2004) 135–149138
clinical imaging applications section of this article.
Detectors that have wider coverage could eventually
allow organ imaging in a fraction of the time required
today. This advantage could remove the demand for
faster gantry rotational speeds, and it would enable
the imaging of a whole organ for perfusion studies in
a single rotation.
One issue that needs to be taken into account when
using larger scan coverage per rotation is the in-
creased cone angle (see Fig. 1), the longitudinal angle
at which the source covers the detector. The cone
angle has two implications. First, the relative amount
of scattered radiation increases almost linearly with
the size of the cone angle. Second, and perhaps more
important, as the cone angle increases, it becomes
more difficult to reconstruct high-quality images
based on the measured data. For smaller cone angles
such as those of 16-slice scanners, the algorithms for
single-slice CT are still sufficiently accurate, at least
with some minor modifications. The most famous
adaptation is the so-called Feldkamp reconstruction
approach [17], in which the classic fan beam algo-
rithm is adapted to take into account the true geome-
try of the cone beam acquisition; however, these
adaptations are still approximations, and for larger
cone angles they become too inaccurate, resulting in
cone beam image artifacts. For larger cone angles
with axial (nonhelical) CT scans it becomes mathe-
matically impossible to perform an exact reconstruc-
tion because of incomplete data.
Two solutions have been proposed to handle this
problem. The first solution is to acquire complete data
using circle-plus-line or circle-plus-arc trajectories, in
which a small linear scan accompanies each rotation,
similar to a scout scan in conventional CT [18]. The
second solution is to take large cone angle helical CT
acquisitions, in which exact reconstruction remains
theoretically possible. Tuy [19] and Grangeat [20]
showed how cone beam measurements could be used
for mathematically exact image reconstruction. Based
on this work several exact, wide cone beam algo-
rithms have been published recently [21–23]. For
ease of implementation, a number of approximate
algorithms have been proposed [24,25]. With the
prospect of CT geometries with larger and larger
cone angles, research in cone beam reconstruction
has become an active field in the past few years.
Temporal resolution
Another trend in CT is the ever-increasing acqui-
sition speed, which is important for two reasons: (1)
to avoid motion artifacts caused by, for instance,
cardiac motion, breathing, or patient movement, and
(2) to reduce the total scan time for one examination.
Reducing the scan time prevents slice misregistration,
facilitates studies with contrast agents, and decreases
patient examination time.
The straightforward way to improve temporal
resolution is to increase the gantry rotation speed;
however, rotating a 1 ton gantry at two rotations per
second or more results in extremely challenging me-
chanical constraints. Another problem is that large
amounts of data have to be transmitted in a shorter
time. Finally, and most important to the clinician,
faster scanning limits the total number of x-ray
photons that the x-ray tube can deliver per scanned
slice, resulting in images that have increased noise.
One way to overcome the speed limitation is to use a
large, stationary circular detector, replace the x-ray
tube with an electron gun, producing a beam of elec-
trons directed on a large stationary circular target, and
sweep this electron beam around the target to scan the
patient. This technique is the basis of the EBCT
scanner [7,26]. The absence of moving parts allows
scan speeds equivalent to a ‘‘rotation’’ time of about
50 ms, or 10 � faster than conventional CT scanners.
The most challenging application for CT and other
noninvasive imaging modalities is cardiac imaging
because of the dynamic nature of the heart. For car-
diac imaging, particularly CT angiography, there is a
demand for improved image quality (ie, better spatial
and temporal resolution, whole-heart scanning in one
breath-hold, improved signal-to-noise ratio, and low-
contrast detectability for determining functional in-
formation). These characteristics drive the technology

D. Walter et al / Thorac Surg
toward faster rotational speeds for the gantry, wider
coverage, more efficient detectors, and advanced
reconstruction techniques. The volume of the heart
changes drastically during the cardiac cycle. There-
fore, if the imaging system could acquire the neces-
sary projection data for reconstruction of the heart
during a phase of minimum motion, the resulting im-
age quality would contain reduced motion artifacts.
High temporal resolution is required to freeze the
heart motion, and high spatial resolution is needed to
allow clinicians to identify and characterize coronary
arteries, enabling visualization and quantification of
stenotic segments and discernment of constituent
components of atherosclerotic plaque that might be
present [27–30]. Fig. 4 shows an image of resteno-
sis in a stent of the proximal left anterior descend-
ing coronary artery from data acquired with a
multislice CT system at 0.625 mm slice thickness
(Lightspeed 16, GE Medical Systems, Milwaukee,
Wisconsin) and reconstructed with a multisector
approach. Sectors of x-ray projection from multiple
rotations of the gantry are combined to provide the
data necessary for image reconstruction at 0.3 mm
intervals with overlapping slices [28,29,31].
Fig. 4. Cardiac imaging using a multisector reconstruction
approach. The image shows restenosis in a stent placed in
the proximal left anterior descending coronary artery. Data
were acquired with a clinical CT scanner configured with
0.625 mm slice thickness (GE Lightspeed 16) and recon-
structed with a multisector approach at 0.3 mm intervals with
overlapping slices. Using state-of-the-art CT imaging
technology and multisector reconstruction algorithms,
today’s scanners have capabilities that approach the spatial
resolution and the temporal resolution needed to evaluate the
coronary arteries of the heart. The heart rate of this patient
during this examination ranged between 71 beats per minute
and 82 beats per minute. (Courtesy of J.L. Sablarolles, MD,
Centre Cardiologique Du Nord, Saint Denis, France.)
Dose reduction
No aspect of medical CT imaging has received
more attention in recent years than patient radiation
dose [32–34]. For diagnostic imaging in general, the
radiation dose should be kept to as low as reasonably
achievable while maintaining suitable diagnostic ca-
pability for features of interest. Radiation dose mea-
surements are reported in the CT–dose index (CTDI,
in Gy), dose– length–product (in mGy-cm), and
effective dose (in mSv). CTDI standards are useful
to objectively rate different scan protocols available
in a scanner and among different types of scanners,
but the dose index is not useful in predicting the
image quality (ie, noise level) produced in anatomical
imaging or the risk to the patient. The computation
of effective dose is used to rate the relative risk to
patients from radiologic procedures [35,36]. For the
calculation of this quantity, the absorbed dose is cal-
culated in specific organs or tissues and is weighted
by the relative sensitivity of these tissues to x-ray
radiation to predict risk to the patient (ie, tissue
weighting factors).
The noise and the quality of the diagnostic infor-
mation available in an image depend on the interplay
between the data acquisition parameters (eg, helical
pitch, detector collimation, tube current, tube voltage,
x-ray beam filtering), the reconstruction approach
(eg, helical weighting, reconstruction kernel, longitu-
dinal smoothing), and the postprocessing techniques
(eg, thresholding, segmentation, volumetric measure-
ments). Image noise also depends on the patient’s
anatomy. In modern CT scanners, the detector’s
efficiency (its ability to absorb an x-ray of a certain
energy) is near its theoretical limit; therefore, other
options must be explored to reduce patient doses.
Several techniques have been suggested to opti-
mize the information available in CT imaging or to
reduce the dose delivered to the patient. Two general
approaches are to: (1) reduce the dose by modulating
the intensity of the x-rays, and (2) use the measure-
ments in an optimal scheme to improve the diagnostic
information for a given dose.
One of the latest features on some multislice
scanners is the ability to modulate the tube current
for different sections of the body. The x-ray tube cur-
rent is increased along lateral directions in the patient,
where there is significant attenuation (eg, along the
shoulders), and reduced along anterior–posterior
directions, where less attenuation is encountered as
the x-ray tube and detector rotate around the body.
The x-ray tube current is also varied in a global
sense as the patient is translated horizontally with
the patient table in the helical scanning mode as the
Clin 14 (2004) 135–149 139

D. Walter et al / Thorac Surg Clin 14 (2004) 135–149140
natural contour of the human body increases or de-
creases. In both cases the x-ray tube current is ad-
justed appropriately to meet a noise requirement that
is set by the radiologist (see [37] and references
therein). These techniques have been shown to reduce
the dose delivered to the patient significantly, but it
is critical to set an appropriate noise factor that does
not inhibit diagnostic information. In the future all
CT scanners will use such techniques.
One way to optimize dose usage is to make the
measured intensities more uniform within each x-ray
projection (denoted as a view), which is accomplished
by using specially shaped filters (eg, bowtie filters).
Central rays usually traverse larger sections of the
patient and are therefore filtered minimally by the
bowtie filter. Peripheral rays in the x-ray beam usually
traverse smaller sections of the patient and are there-
fore filtered more. The net result is that all rays
undergo roughly the same amount of attenuation. This
technique reduces the harmful absorbed dose at the
peripheral of the body [38]. As the radiological com-
munity continues to advocate lower doses, one can
conceive of special x-ray beam filtering techniques
that could be optimized for a specific organ of interest.
Current multislice helical reconstruction algo-
rithms based on the filtered backprojection method
use a variety of weighting and filtering schemes to
Fig. 5. Adaptive filtering to reduce noise artifacts for low-dose i
nonsolid pulmonary nodule (arrow). (a) Image reconstructed from x
120 kVp, 200 mAs, 0.5 s gantry speed (100 mAs), 4 � 2.5 mm de
GE Lightspeed Plus (GE Medical Systems, Milwaukee, Wisconsin)
image was reconstructed from x-ray projection data acquired usin
speed (5 mAs), 4 � 1.5 mm detector collimation, and a helical pit
generate the image shown in (b) was reconstructed using a reconstr
In all three images the nodule is visible; however, the image sho
techniques, contains less noise artifact when compared with the im
compared with the image in (a). (Courtesy of Akifumi Fujita, MD
trade off noise and artifacts in the reconstructed
image with the achievable spatial resolution. A par-
ticularly difficult area in the body for low-dose
imaging is the region near the shoulders. These slices
usually suffer from structured noise, which appears as
horizontal streaks across the image, because of the
significant attenuation of the x-ray signal through the
shoulders. Various schemes have been proposed to
improve the signal-to-noise ratio of measurements
acquired along projection lines with significant at-
tenuation by using information from neighboring
detector cells or views. In some cases special filtering
schemes also incorporate signals measured in the
longitudinal direction from data measured with the
multislice detector [24,39,40]. To demonstrate one
such scheme, Fig. 5 displays a scan of the right lung
of a human patient. On the left (Fig. 5a) the chest was
scanned using an x-ray beam current of 200 mA. In
the middle (Fig. 5b) the same anatomy is scanned with
much lower dose, using an x-ray current of 10 mA. On
the right (Fig. 5c) the data used to generate the image
shown in Fig. 5b are reconstructed using an adaptive
filtering scheme incorporated as part of the recon-
struction algorithm [39]. Although the adaptive filter-
ing algorithm reduces spatial resolution slightly, as
demonstrated in Fig. 5c, the benefits of reduced image
noise are shown clearly.
maging. The scan of the right lung of this patient shows a
-ray projection data acquired using a system configuration of
tector collimation, and a helical pitch ratio of 0.75:1 using a
. (b) The same anatomy was scanned at much lower dose; the
g a system configuration of 120 kVp, 10 mA, 0.5 s gantry
ch ratio of 1.5:1. (c) The same x-ray projection data used to
uction algorithm incorporating adaptive filtering techniques.
wn in (c), which was reconstructed using adaptive filtering
age in (b), at a slight reduction in the spatial resolution when
, Showa University, Fujigaoka Hospital.)

D. Walter et al / Thorac Surg Clin 14 (2004) 135–149 141
Another strategy to reduce noise in CT images or
to achieve the same noise level at reduced dose is the
use of statistical reconstruction algorithms, which
weigh x-ray projection data in an optimal sense for
CT image reconstruction. Although statistical re-
construction algorithms have been investigated in
nuclear medicine for many years, they have not yet
been commonly used for CT image reconstruction
mainly because of the computational complexity of
such approaches and the fact that the signal-to-noise
ratio in x-ray projection measurements is higher in
CT compared with nuclear imaging. Unlike filtered
backprojection reconstruction approaches, statistical
reconstruction has a framework that includes a statis-
tical model for the measurements. More recently, sev-
eral researchers have applied statistical reconstruction
to CT successfully [41–44]. Statistical reconstruction
also allows incorporation of prior information regard-
ing the scanned region of interest (ROI) to improve
image quality in reconstructed images in an efficient
manner. Apart from minimizing image noise, statisti-
cal reconstruction has also been shown to have
potential for artifact reduction [42,43] and for appli-
cations with missing x-ray projection data needed for
image reconstruction [45–47].
Clinical imaging applications
New scanners that have improved algorithms and
technology offer superior image resolution, greater
coverage, and shorter acquisition times. As a result of
advancing CT imaging technology, the amount of
information required for physicians to review has also
increased. To improve clinicians’ workflow and pro-
ductivity, three-dimensional image processing algo-
rithms, advanced workstations, and computer-assisted
tools have been developed. Advanced postprocessing
tools have many applications and have been shown to
improve accuracy and productivity [48,49]. Some
specific examples of advanced CT technology com-
bined with computer-assisted tools are discussed in
this section.
Lung cancer
The American Cancer Society has estimated that
171,900 new lung cancer cases would be diagnosed
and 157,200 lung cancer deaths would occur in the
United States in 2003 [50]. CT imaging currently
plays an important role in all aspects of lung can-
cer management including detection, diagnosis, stag-
ing, treatment planning, and patient follow-up care
[51–61]. In the past decade, spatial resolution achie-
vable with state-of-the-art CT scanners has increased
more than tenfold. CT now routinely provides detailed
images of early-stage lung cancer by imaging with a
spatial resolution of less than 1 mm. High-resolution
imaging has led to significant advances in clinical
understanding of early disease progression and has
redefined lung cancer management practices. This
section focuses on state-of-the-art and emerging CT
applications in the area of lung cancer and describes
the impact of future technological improvements.
Solitary pulmonary nodule detection and sizing
The superiority of CT over other radiologic
imaging techniques (eg, chest radiograph, MRI) for
the detection of solitary pulmonary nodules (SPNs)
is well documented [62–64]. Recent technological
advancements in multislice CT, namely the ability
to scan the entire human thorax at submillimeter
resolution within a breath-hold, enable the detection
of much smaller lesions [63,65]. This realization has
spurred several studies to reinvestigate the hypothesis
that the early detection of lung cancer could justify
screening for lung cancer in asymptomatic patients
(see [51] for a review of current lung cancer screen-
ing literature).
In addition to enabling the detection of small
SPNs, high-resolution CT imaging has also been
shown to be a highly sensitive for the measurement
of small changes in volume [61,66,67]. Radiologic
phantom studies, used to characterize the sensitivity of
high-resolution CT imaging for growth estimation,
indicate that volume accuracy using CT is within 3%
of the true volume in nodules between 3 and 6 mm in
diameter and within 1% in nodules greater than 6 mm
in diameter [61]. These results were obtained under
ideal imaging conditions: small field-of-view imag-
ing, application of resolution-enhancing reconstruc-
tion kernels, thin-slice imaging mode, low helical
pitch, and the absence of confounding anatomical
structure. These results should therefore be considered
an upper limit of current CT capability. The clinical
evidence for in situ volumetric accuracy of nodule
sizing is not conclusive for several reasons: (1) nodule
sizing methods have not been standardized, (2) the
highest available resolution capabilities of the scanner
are not routinely used for examinations, and (3) ad-
vanced segmentation and computation tools have only
become recently available.
In general, three-dimensional computer-assisted
segmentation tools generate the most accurate and
repeatable nodule size measurements [53]. An exam-
ple case showing results from the use of advanced
analysis tools is presented in Figs. 6 and 7. Fig. 6a
shows a CT image of an SPN attached to a vascu-

Fig. 6. Segmentation of pulmonary nodules with minimal user interaction. An SPN is detected by the radiologist, and using
advanced analysis tools (Advanced Lung Analysis, GE Medical Systems, Milwaukee, Wisconsin) the nodule is segmented
automatically and the volume is determined. (a) Solid pulmonary nodule detected by the radiologist in an axial CT scan.
(b) The Nodule and vessel structure are segmented from the parenchyma and displayed as a three-dimensional surface.
(c) Nodule is separated automatically from the vascular structures and its volume is computed. (Courtesy of Lawrence Good-
man, MD, Froedtert Hospital, Milwaukee, WI.)
D. Walter et al / Thorac Surg Clin 14 (2004) 135–149142
lar structure. Fig. 6b shows the nodule and vessel
structure, which have been segmented from the lung
parenchyma and displayed as a three-dimensional
surface. The nodule was separated automatically
from the vascular structure and the volume was com-
puted. The three-dimensional surface model of the
Fig. 7. Determining nodule growth rate with volumetric measurem
shown. The volume at each time instance was measured using
(a) Using the CT image of the nodule measured at time one, the di
nodule measured one month later is 12.8 mm in diameter. (c) Thre
one. (d) Three-dimensional surface model of the same nodule mea
volume, corresponding to a 103-day doubling time assuming expo
Program, New York Presbyterian Hospital, Weill Cornell Medical
nodule separated from the vascular structure is shown
in Fig. 6c.
The images in Fig. 7 show a nodule that was mea-
sured in two CTscans one month apart; the nodule size
exhibits a 24% volume increase, corresponding to a
103-day doubling time, assuming exponential growth.
ents. Multiple images of a nodule, measured 1 mo apart, are
GE Medical System’s Advanced Lung Analysis program.
ameter of the nodule is shown to be 11.7 mm. (b) The same
e-dimensional surface model of the nodule measured at time
sured at time two. This nodule exhibited a 24% increase in
nential growth. (Courtesy of The Early Lung Cancer Action
Center, New York, NY.)

Fig. 8. CAD used to detect lung nodules automatically. In
this image a radiologist detected two potential lung cancers
in the right lung (arrows). One lung nodule is a solid type
(left arrow); another nodule is a nonsolid type (right arrow).
Both of these nodules were also detected using a CAD
algorithm developed at the GE Global Research Center.
The nodule on the left is difficult for most CAD algorithms
to detect because it has structures attached to the chest
wall. The nodule on the right is challenging because the
reconstructed intensity is lower than most solid lung
nodules. The patient was scanned using a GE Lightspeed
system at 120 kVp, 60 mA, and 2.5 mm slice thickness.
(Courtesy of The Early Lung Cancer Action Program, New
York Presbyterian Hospital, Weill Cornell Medical Center,
D. Walter et al / Thorac Surg Clin 14 (2004) 135–149 143
Another revelation in the understanding of
the characteristics of SPNs relates to the increased
frequency of detection of subsolid lesions (or ground-
glass opacities) [55,68,69]. The importance of sub-
solid lesions has recently become apparent because
nonsolid and part-solid lesions appear to be highly
correlated to malignancy. In one study, nonsolid
nodules comprised 52% of all confirmed lung can-
cers, and their probability of malignancy was between
18% (for nonsolid nodules) and 63% (for part-solid
nodules), compared with a 7% malignancy rate
among strictly solid SPNs [69]; however, it should
be noted that the prevalence of nonsolid and part-
solid lesions is much lower than the prevalence of
solid lesion types. High-resolution CT imaging will
play an important role in the further investigation of
these lesion types because many of the most subtle
occurrences of these lesion types are not detectable
when thick-slice CT scanning is used because of
partial volume effects.
Computer-automated detection of pulmonary nodules
The evaluation of today’s high-resolution MSCT
data presents a significant challenge to radiologists
because they must review up to 500 CT images for a
single examination and discriminate normal lung
anatomy from small lesions that potentially represent
the early onset of lung cancer. The promise of CT for
high-resolution imaging of early lung cancer coupled
with the challenges in reviewing these large data sets
has led to an increased focus on computer-aided de-
tection (CAD) of lung lesions [70–74]. In Fig. 8,
two nodules identified using an automated detection
algorithm are shown. The nodule identified by the left
arrow is a solid type; the nodule identified by the right
arrow is a nonsolid type. Both nodules present a
challenge for automated detection algorithms—the
solid nodule because it has structures connecting it
to the chest wall; the nonsolid nodule because it has a
lower reconstructed attenuation value when compared
with solid nodules. It is initially expected that lung
cancer CAD techniques will improve radiologic diag-
nosis by highlighting suspicious regions that the
radiologist might otherwise have overlooked. A recent
multireader, multi-institution study for lung cancer
detection demonstrated an average reduction in the
false-negative rate from 10% to 3% when comparing
the performance of a radiologist alone to that of a
radiologist using a prototype CAD algorithm [75].
As the spatial resolution and amount of data per
patient examination continues to increase, CAD tech-
nology will become a necessary tool in the radiolo-
gist’s evaluation of chest CT examinations.
CT for noninvasive diagnosis, staging, and treatment
planning
Because of the reduced scanning time for a CT
examination using advanced MSCT, there has been a
renewed interest in the use of contrast-enhanced CT
imaging for the diagnosis and staging of lung nodules
[76–78]. The use of iodine contrast agent uptake as a
measure of malignancy is predicated on the fact that
there are distinct differences in the vascular charac-
teristics of benign and malignant nodules. Although
positron emission tomography (PET) is more accurate
than CT imaging for the detection of mediastinal
metastases [79], the role of CT imaging is still recom-
mended as a diagnostic tool because it is valuable for
further workup, including biopsy or surgery planning
[80]. Furthermore, the role of CT and PET image
fusion has shown considerable promise as an optimal
method for noninvasive diagnosis and staging of lung
cancer [81,82]. CT imaging also plays a primary role
in radiation treatment planning [53].
New York, NY.)

Fig. 9. High-resolution volumetric CT for improved air-
way wall measurements. A high-resolution volumetric CT
research scanner (GE Global Research Center, Niskayuna,
NY) capable of 250 mm isotropic resolution was used to
image an excised pig lung. The airway lumen (insert) was
measured with minimal user interaction using prototype
software (GE Global Research Center, Niskayuna, NY) and
was measured to be about 0.5 mm in diameter.
Surg Clin 14 (2004) 135–149
Chronic obstructive pulmonary disease
Chronic obstructive pulmonary disease (COPD)
affects roughly 16 million adults in the United States
and is the fourth leading cause of chronic morbidity
and mortality in the United States [83]. High-resolu-
tion CT imaging has been useful in the evaluation of
the presence and extent of emphysema and as a tool
to quantify morphologic changes caused by chronic
bronchitis [84]. Many of these recent advances have
been spurred by the technological improvements in
MSCT, namely the ability to acquire a large volume
of contiguous high-resolution, thin-slice data in less
than 10 seconds.
The superiority of CT imaging over chest radiog-
raphy in the detection and evaluation of the preva-
lence of bullae in the lung and the diagnosis of
emphysema has been well documented [84,85].
Researchers have commented on qualitative methods
of assessing the severity of emphysema with CT
imaging, correlating radiologic indications with lung
function [86–88]. Recent research in the radiologic
assessment of emphysema has focused on the devel-
opment of computational tools that can objectively
evaluate the extent of emphysema through the mea-
surement of lung density [89,90]. Because lung
density measurements can be affected by scanner
calibration, reconstruction parameters [91,92], patient
size, and depth of inspiration, the key to reducing
inter- and intravariability of these examinations is to
model and correct for these effects.
The ability to use CT imaging to detect bronchial
wall thickening caused by chronic bronchitis (which
is associated with reduced lung function in the case
of COPD and asthma) has been well documented in
the recent literature [84,93]. The ability to measure
small changes in the airway lumen area and in the air-
way wall area is at the limit of the resolving power of
state-of-the-art CT scanners. Because of the scanner’s
inherent resolution capabilities, quantitative measure-
ment accuracy is limited by the partial volume effect
[94]. Several reports have shown that computational
methods are more accurate than manual methods
[93,95,96], and methods that correct for the scanner
point spread function, or resolving power of the CT
system, have a higher rate of repeatability [97].
The availability of thinner slices on state-of-
the-art scanners (eg, 0.625 mm) and high-resolution
scanning protocols could further improve the accu-
racy of airway measurements. As resolution in CT
scanners continues to improve, the ability to measure
airways less than 1 mm accurately will become
possible, and the sensitivity of the detection of mor-
phologic changes will increase. For example, a high-
D. Walter et al / Thorac144
resolution CT image of an excised pig lung recon-
structed from data acquired with a prototype high-
resolution volumetric CT research system is shown in
Fig. 9. The lumen of an airway that is approximately
0.5 mm in diameter is clearly visible.
Pulmonary embolism
It is estimated that the incidence of pulmo-
nary embolism (PE) in the United States is roughly
630,000 cases per year [98]. Since its introduction,
[99] CT imaging has been shown to be highly sen-
sitive and specific in the diagnosis of PE when com-
pared with angiography, which is the current standard
[100,101]. Recent technological advances in reso-
lution (thinner slices) and speed (faster scans) of
multislice CT scanners have improved the detection
of PE [102].
CT offers several advantages over other imaging
techniques for PE detection. The primary advantage
of CT imaging is that scanning can be performed
quickly in critically ill patients. Clinicians also have
the ability to evaluate patients using CT for other
lung-related conditions that could indicate an in-
creased risk of PE such as cardiac disease, chest
trauma, pneumonia, and lung cancer.
One impediment to detecting PE in CT images is
that the current resolution capability limits the detec-
tion of subsegmental PEs [103], although the clinical
importance of such cases is a subject of debate. As

Fig. 10. Multislice CT for the detection of PE. (a) On the left, an axial CT image shows an occurrence of PE (arrow).
(b) Maximum-intensity projection image of the volume is shown on the right in sagittal reformat. The PE (arrow) is readily
detectable. The patient was imaged using a GE Lightspeed 16. (Courtesy of Lawrence Goodman, MD, Froedtert Hospital,
Milwaukee, WI.)
D. Walter et al / Thorac Surg Clin 14 (2004) 135–149 145
resolution continues to improve and advanced MSCT
technology becomes more available, these limitations
could possibly be surmounted, as suggested by some
researchers [102,104]. Some misdiagnoses are caused
by the difficulty in quickly finding an abnormality in
a complicated vessel structure [105]. To review the
entire chest in high resolution, the radiologist must
review between 100 and 300 axial images. This task
might be facilitated with advanced segmentation
techniques. For example, an occurrence of a PE is
shown in an axial image (Fig. 10a), but in a maxi-
mum-intensity projection image of a sagittal cross-
section (Fig. 10b), the PE is readily detectable and
there are considerably less images to review. Some
researchers have suggested using CAD methods to
detect PE in CT images rapidly [106,107].
Interventional procedures
CT imaging has been a standard in surgery plan-
ning, radiation therapy planning, virtual endoscopy,
and guidance for percutaneous needle biopsy. Image-
guided surgery, a procedure in which the physician
uses a two- or three-dimensional image along with
the registration of the surgical instruments in the re-
constructed volume to guide the procedure, is at the
forefront of medical technology. Two-dimensional
imaging techniques are limited because the surgeon
must virtually conceptualize the three-dimensional
and correlate the image with the anatomy. The use
of preoperative CT images and three-dimensional
visualization offers a more natural view of the anat-
omy, creating new possibilities for more minimally
invasive techniques. Procedures for use in the sinus,
spine, and head are becoming more widespread
[108–110].
Of particular interest in surgical treatment for
oncology is the use of percutaneous, image-guided,
in situ tumor ablation techniques [111]. The most
advanced of these techniques uses a radiofrequency
(RF) thermal source positioned by way of an elec-
trode placed with image guidance into the tumor to be
ablated. Although the standard of care for a detected
lung cancer is resection, some researchers have pro-
posed RF ablation for pulmonary nodules in patients
who are not candidates for surgery [112–114].
One barrier to extending these techniques to other
areas in the thorax is the fact that the chest undergoes
significant movement during the breathing cycle,
which makes it difficult to register the current location
of the electrode with a preoperative scan or requires
surgical procedures to be performed in the vicinity of
the CT scanner. The development of deformable
models [115,116], which can predict the organ move-
ment, advanced visualization techniques [117], and
multimodality data integration, will extend these
techniques in the future.
Summary
X-ray CT technology has been available for more
than 30 years, yet continued technological advances
have kept CT imaging at the forefront of medical

D. Walter et al / Thorac Surg Clin 14 (2004) 135–149146
imaging innovation. Consequently, the number of
clinical CT applications has increased steadily. Other
imaging modalities might be superior to CT imaging
for some specific applications, but no other single
modality is more often used in chest imaging today.
Future technological developments in the area of
high-resolution detectors, high-capacity x-ray tubes,
advanced reconstruction algorithms, and improved vi-
sualization techniques will continue to expand the im-
aging capability. Future CT imaging technology will
combine improved imaging capability with advanced
and specific computer-assisted tools, which will ex-
pand the usefulness of CT imaging in many areas.
Acknowledgments
The authors thank Rick Avila, Bob Senzig, Samit
Basu, and Rajiv Gupta for their useful comments
and insights.
References
[1] Hounsfield G. Computerized transverse axial scan-
ning (tomography): part 1. Description of system.
Br J Radiol 1973;46:1016–22.
[2] Cormack A. Representation of a function by its line
integrals, with some radiological applications. J Appl
Phys 1963;34(9):2722–7.
[3] Mori I. 1986. US Patent No. 4630202.
[4] Nishimura H. 1988. US Patent No. 4789929.
[5] Kalender WA, Seissler W, Klotz E, Vock P. Spiral
volumetric CT with single-breath-hold technique,
continuous transport, and continuous scanner rota-
tion. Radiology 1990;176(1):181–3.
[6] Crawford CR, King KF. Computed tomography scan-
ning with simultaneous patient translation. Med Phys
1990;17(6):967–82.
[7] Boyd D, Lipton M. Cardiac computed tomography.
Proc IEEE 1983;71:298–307.
[8] McCollough CH. Optimization of multi-detector ar-
ray CT acquisition parameters for CT colonography.
Abdom Imaging 2002;27(3):253–9.
[9] Honda JT, Yamamoto S, Tomiyama N, Koyama M,
Kozuka T, Mihara N, et al. Evaluation of image qual-
ity and spatial resolution of low-dose high-pitch multi-
detector-row helical high-resolution CT in 11 autopsy
lungs and a wire phantom. Radiat Med 2001;19(6):
279–84.
[10] Medical Systems GE. Available at: http://www.
gemedicalsystems.com/rad/ct/products/light_series/
ls16. Accessed January 6, 2004.
[11] Siemens. Available at: http://www.siemens.com.
Accessed January 6, 2004.
[12] ToshibaMedical Systems. Available at: http://medical.
toshiba.com/clinical/cardiology/aquilionmulti16.htm.
Accessed January 6, 2004.
[13] Philips Medical Systems. Available at: http://www.
medical.philips.com. Accessed January 6, 2004.
[14] Ross WR, Basu S, Edic PM, Johnson M, Pfoh A, Rao
R, et al. Design and image quality results from volu-
metric CT with a flat-panel imager. In: Antonuk LE,
Yaffe MJ, editors. Proceedings of SPIE Medical Im-
aging. San Diego: SPIE International Society for Op-
tical Engineering; 2001. p. 783–91.
[15] Hu H. Multi-slice helical scan and reconstruction.
Med Phys 1999;26(1):5–18.
[16] Kalender WA, Fuchs T. Principles and performance
of single- and multislice spiral CT. In: RSNA cate-
gorical course in diagnostic radiology physics: CT
and US cross-sectional imaging. 2000. p. 127–42.
[17] Feldkamp LA, Davis LC, Kress JW. Practical cone
beam algorithm. J Opt Soc Am 1984;A(1):612–9.
[18] Hu H. A new cone beam reconstruction algorithm for
the circle-and-line orbit. In: Nuclear Science Sympo-
sium and Medical Imaging Conference, Volume 3.
IEEE; 1994. p. 1261–5.
[19] Tuy HK. An inversion formula for cone-beam recon-
struction. SIAM J Appl Math 1983;43:546–52.
[20] Grangeat P. Analyse d’un systeme d’imagerie 3D par
reconstruction a partir de radiographies X en geome-
trie conique. PhD thesis, Ecole Nationale Superieure
des Telecommunications, France, 1987. [in French].
[21] Schaller S, Noo F, Sauer F, Tam K, Lauritsch G, Flohr
T. Exact radon rebinning algorithm for the long object
problem in helical cone-beam CT. IEEE Trans Med
Imaging 2000;19(5):361–75.
[22] Defrise MC. A cone-beam reconstruction algorithm
using shift-variant filtering and cone-beam back-
projection. IEEE Trans Med Imaging 1994;13(1):
186–95.
[23] Katsevitch A. Analysis of an exact inversion algorithm
for spiral cone-beam CT. Phys Med Biol 2002;47:
2583–97.
[24] Kachelriess M, Schaller S, Kalender WA. Advanced
single-slice rebinning in cone-beam spiral CT. Med
Phys 2000;27(4):754–72.
[25] Turbell H, Danielsson P. Helical cone-beam tomogra-
phy. Int J Img Sys Tech 2000;11:91–100.
[26] Medical Systems GE. GE Medical Systems Car-
diology EBT series. Available at: http://www.
gemedicalsystems.com/cardiology/ebt/index.html.
Accessed January 6, 2004.
[27] Sablayrolles JL, Besse F, Giat P. Technical develop-
ments in cardiac CT: 2000 update. Rays 2001;26(1):
3–13.
[28] Kachelriess M, Ulzheimer S, Kalender WA. ECG-cor-
related image reconstruction from subsecond multi-
slice spiral CT scans of the heart. Med Phys 2000;27:
1881–902.
[29] Pan T, Shen Y. Multi-sector reconstruction for multi-
slice cardiac (CT). Radiology 2000;217:161.
[30] Achenbach S, Giesler T, Ropers D. Detection of
coronary artery stenoses by contrast-enhanced, retro-

D. Walter et al / Thorac Surg Clin 14 (2004) 135–149 147
spectively electrocardiographically gated, multislice
spiral computed tomography. Circulation 2001;103:
2535–8.
[31] Cesmeli E, Edic PM, Iatrou M, Pfoh A. A novel
reconstruction algorithm for multiphasic cardiac im-
aging using multislice CT. In: Antonuk LE, Yaffe
MJ, editors. Proceedings of the SPIE International
Symposium on Medical Imaging. San Diego: SPIE,
International Society for Optical Engineering; 2001.
p. 645–54.
[32] Huda W, Chamberlain C, Rosenbaum A, Garrisi W.
Radiation doses to infants and adults undergoing head
CT examinations. Med Phys 2001;28(3):393–9.
[33] Morin R, Gerber T, McCollough C. Radiation dose
in computed tomography of the heart. Circulation
2003;107:917–22.
[34] McCollough C, Zink F. Performance evaluation of
a multi-slice CT system. Med Phys 1999;26(11):
2223–30.
[35] (ICRP) ICoRP. 1990 Recommendations of the In-
ternational Commission on Radiological Protec-
tion. ICRP Publication 60. Oxford (UK): Pergmon
Press; 1991.
[36] McCollough CH, Schueler BA. Calculation of effec-
tive dose. Med Phys 2000;27(5):828–37.
[37] Toth T, Limkeman MK. 1997. US Patent No.
5625662.
[38] Harpen M. A simple theorem relating noise and pa-
tient dose in computed tomography. Med Phys 1999;
26(11):2231–4.
[39] Hu H, Shen Y. Helical CT reconstruction with longi-
tudinal filtration. Med Phys 1998;25(11):2130–8.
[40] Kachelriess M, Watzke O, Kalender W. Generalized
multi-dimensional adaptive filtering for conventional
and spiral single-slice, multi-slice, and cone-beam
CT. Med Phys 2001;28(4):475–89.
[41] Nuyts J, Dupont P, Stroobants S, Maes A, Mortel-
mans L, Suetens P. Evaluation of maximum-like-
lihood based attenuation correction in positron
emission tomography. In: Nuclear Science Sympo-
sium. Toronto: IEEE; 1998. p. 1836–41.
[42] De Man B, Nuyts J, Dupont P, Marchal G, Suetens P.
An iterative maximum-likelihood polychromatic al-
gorithm for CT. IEEE Trans Med Imaging 2001;
20(10):999–1008.
[43] Elbakri IA, Fessler JA. Statistical image reconstruc-
tion for polyenergetic x-ray computed tomography.
IEEE Trans Med Imaging 2002;21(2):89–99.
[44] Sukovic P, Clinthorne NH. Data weighted vs. non-
data weighted dual energy reconstructions for x-ray
tomography. In: Nuclear Science Symposium. To-
ronto: IEEE; 1998. p. 1581–3.
[45] De Man B. 2001. Iterative reconstruction for reduc-
tion of metal artifacts in computed tomography. PhD
thesis, University of Leuven.
[46] Wang G, Frei T, Vannier MW. A fast iterative algo-
rithm for metal artifact reduction in x-ray CT. Acad
Radiol 2000;7(8):607–14.
[47] De Man B. Reduction of metal streak artifacts in
x-ray computed tomography using a transmission
maximum a posteriori algorithm. IEEE Trans Nuc
Sci 2000;47(3):977–81.
[48] Lawler LP, Fishman EK. Multi-detector row CT of
thoracic disease with emphasis on 3D volume render-
ing and CT angiography. Radiographics 2001;21(5):
1257–73.
[49] Salvolini L, Bichi Secchi E, Costarelli L, De Nicola
M. Clinical applications of 2D and 3D CT imaging
of the airways—a review. Eur J Radiol 2000;34(1):
9–25.
[50] American Cancer Society. Cancer facts and figures
2002. Available at: http://www.cancer.org.docroot/
STT/stt_0.asp. Accessed January 6, 2004.
[51] Bach PB, Kelley MJ, Tate RC, McCrory DC. Screen-
ing for lung cancer: a review of the current literature.
Chest 2003;123(90010):72S–82S.
[52] Beckles MA, Spiro SG, Colice GL, Rudd RM. Initial
evaluation of the patient with lung cancer: symptoms,
signs, laboratory tests, and paraneoplastic syndromes.
Chest 2003;123(90010):97S–104S.
[53] Hopper KD, Singapuri K, Finkel A. Body CT and
oncologic imaging. Radiology 2000;215:27–40.
[54] Mathur PN, Edell E, Sutedja T, Vergnon J-M. Treat-
ment of early stage non-small cell lung cancer. Chest
2003;123(90010):176S–80S.
[55] Nakata M, Saeki H, Takata I, Segawa Y, Mogami H,
Mandai K, et al. Focal ground-glass opacity detected
by low-dose helical CT. Chest 2002;121(5):1464–7.
[56] Patz EF. Imaging bronchogenic carcinoma. Chest
2000;117:90S–5S.
[57] Porter JC, Spiro SG. Detection of early lung cancer.
Thorax 2000;55(Suppl 1):556–62.
[58] Swensen SJ. Functional CT: lung nodule evaluation.
Radiographics 2000;20(4):1178–81.
[59] Tan BB, Flaherty KR, Kazerooni EA, Iannettoni
MD. The solitary pulmonary nodule. Chest 2003;
123(90010):89S–96S.
[60] Toloza EM, Harpole L, Detterbeck F, McCrory DC.
Invasive staging of non-small cell lung cancer: a re-
view of the current evidence. Chest 2003;123(90010):
157S–66S.
[61] Yankelevitz DF, Reeves AP, Kotis WJ, Zhao B,
Henschke CI. Small pulmonary nodules: volumetri-
cally determined growth rates based on CT evalua-
tion. Radiology 2000;217:251–6.
[62] Henschke CI, McCauley DI, Yankelevitz DF, Naidich
DP, McGuinness G, Miettinen OS, et al. Early Lung
Cancer Action Project: overall design and findings
from baseline screening. Lancet 1999;354(9173):
99–105.
[63] Henschke CI, Naidich DP, Yankelevitz DF. Early
Lung Cancer Action Project: initial findings on repeat
screenings. Cancer 2001;92(1):153–9.
[64] Sone S, Takashima S, Li F, Yang Z, Honda T, Maru-
yama Y, et al. Mass screening for lung cancer with
mobile spiral computed tomography scanner. Lancet
1998;351(9111):1242–5.
[65] Mulshine JL, Smith RA. Lung cancer 2: screening and
D. Walter et al / Thorac Surg Clin 14 (2004) 135–149148
early diagnosis of lung cancer. Thorax 2002;57(12):
1071–8.
[66] Yankelevitz DF, Gupta R, Zhao B, Henschke CI. Small
pulmonary nodules: evaluation with repeat CT—
preliminary experience. Radiology 1999;212(2):
561–6.
[67] Winer-Muram H, Jennings S, Tarver R, Aisen A,
Tann M, Conces D, et al. Volumetric growth rate of
stage I lung cancer prior to treatment: serial CT scan-
ning. Radiology 2002;223:789–805.
[68] Kin E, Johkoh T, Lee K, Han J, Fujimoto K, Adohara
J, et al. Quantification of ground-glass opacity on
high-resolution CT of small peripheral adenocarci-
noma of the lung: pathologic and prognostic implica-
tions. AJR Am J Roentgenol 2001;177(6):1417–22.
[69] Henschke C, Yankelevitz DF, Mirtcheva R, McGuin-
ness G, McCauley DI, Miettinen OS. CT screening
for lung cancer: frequency and significance of part-
solid and nonsolid nodules. AJR Am J Roentgenol
2002;178(5):1053–7.
[70] Armato III S, Giger M, MacMahon H. Automated
detection of lung nodules in CT scans: preliminary
results. Med Phys 2001;28(8):1552–61.
[71] Niki N, Kawata Y, Kubo H, Ohmatsu M, Kakinuma
R, Kaneko M, et al. A CAD system for lung cancer
based on 3D CT images. In: Lemke HU, Vannier
MW, Inamura K, Farman AG, Doi K, Reiber JHC,
editors. Proceeding of International Congress of
Computer Assisted Radiology and Surgery. Paris:
Springer; 2002. p. 701–5.
[72] McNitt-Gray M, Hart E, Wyckoff N, Sayre J, Goldin
J, Aberle D. A pattern classification approach to char-
acterizing solitary pulmonary nodules imaged on high
resolution CT: preliminary results. Med Phys 1999;
26(6):880–8.
[73] Takizawa H, Yamamoto S, Matsumoto T, Tateno Y,
Linuma T, Matsumoto M. Recognition of lung nod-
ules from x-ray CT images using 3D MRF models.
In: Tezak EJ, Inamura K, Lemke HU, et al, editors.
Proceeding of International Congress of Computer
Assisted Radiology and Surgery. Berlin: Elsevier Sci-
ence; 2001. p. 605–14.
[74] Armato III SG, Li F, Giger ML, MacMahon H, Sone
S, Doi K. Lung cancer: performance of automated
lung nodule detection applied to cancers missed in
a CT screening program. Radiology 2002;225(3):
685–92.
[75] McCulloch C, Yankelevitz D, Henschke C, Patel S,
Kazerooni E, Sirohey S. Reader variability and com-
puter aided detection of suspicious lesions in low-
dose CT lung screening exams. Radiology 2003;
226(2):37A.
[76] Zhang M, Kono M. Solitary pulmonary nodules:
evaluation of blood flow patterns with dynamic CT.
Radiology 1997;205(2):471–8.
[77] Miles KA, Griffiths MR, Fuentes MA. Standardized
perfusion value: universal CT contrast enhancement
scale that correlates with FDG PET in lung nodules.
Radiology 2001;220(2):548–53.
[78] Swensen SJ, Viggiano RW, Midthun DE, Muller
NL, Sherrick A, Yamashita K, et al. Lung nodule en-
hancement at CT. Multicenter study. Radiology 2000;
214(1):73–80.
[79] Toloza EM, Harpole L, McCrory DC. Noninva-
sive staging of non-small cell lung cancer: a review
of the current evidence. Chest 2003;123(90010):
137S–46S.
[80] Silvestri GA, Tanoue LT, Margolis ML, Barker J, Det-
terbeck F. The noninvasive staging of non-small cell
lung cancer: the guidelines. Chest 2003;123(90010):
147S–56S.
[81] Vansteenkiste JF, Stroobants SG, Dupont P, De Leyn
PR, DeWeverWF, Verbeken EK, et al. FDG-PETscan
in potentially operable non-small cell lung cancer: do
anatometabolic PET-CT fusion images improve the
localisation of regional lymph node metastases? Eur
J Nucl Med 1998;25(11):1495–501.
[82] Magnani P, Carretta A, Rizzo G, Fazio F, Vanzulli A,
Lucignani G, et al. FDG/PET and spiral CT image
fusion for mediastinal lymph node assessment of
non-small cell lung cancer patients. J Cardiovasc Surg
[Torino] 1999;40(5):741–8.
[83] National Heart, Lung, and Blood Institute, National
Institutes of Health. Data fact sheet: chronic ob-
structive pulmonary disease (COPD). Available at:
http://www.nhlbi.nih.gov/health/public/lung/other/
copd_fact.htm. Accessed January 6, 2004.
[84] Muller NL, Coxson H. Chronic obstructive pulmonary
disease 4: imaging the lungs in patients with chronic
obstructive pulmonary disease. Thorax 2002;57(11):
982–5.
[85] Thurlbeck WM, Muller NL. Emphysema: definition,
imaging, and quantification. AJR Am J Roentgenol
1994;163:1017–25.
[86] Nakano Y, Muro S, Sakai H, Hirai T, Chin K, Tsukino
M, et al. Computed tomographic measurements of
airway dimensions and emphysema in smokers. Cor-
relation with lung function. Am J Respir Crit Care
Med 2000;162(3):1102–8.
[87] Miller RR, Muller NI, Vedal S, Morrison NJ, Staples
CA. Limitations of computed tomography in the as-
sessment of emphysema. Am Rev Respir Dis 1989;
139:980–3.
[88] Kuwano K, Matsuba K, Ikeda T, Murakami J, Araki
A, Nishitani H, et al. The diagnosis of mild em-
physema: correlation of computed tomography and
pathology scores. Am Rev Respir Dis 1990;141:
169–78.
[89] Muller N, Staples C, Miller R, Abboud R. Density
mask. An objective method to quantitate emphysema
using computed tomography. Chest 1988;94(4):
782–7.
[90] Brown MS, McNitt-Gray MF, Goldin JG, Greaser
LE, Hayward UM, Sayre JW, et al. Automated mea-
surement of single and total lung volume from CT.
J Comp Ass Tomo 1999;23:632–40.
[91] Gierada DS, Yusen RD, Pilgram TK, Crouch L, Slone
RM, Bae KT, et al. Repeatability of quantitative CT

D. Walter et al / Thorac Surg Clin 14 (2004) 135–149 149
indexes of emphysema in patients evaluated for lung
volume reduction surgery. Radiology 2001;220(2):
448–54.
[92] Bankier AA, De Maertelaer V, Keyzer C, Gevenois
PA. Pulmonary emphysema: subjective visual grading
versus objective quantification with macroscopic
morphometry and thin-section CT densitometry.
Radiology 1999;211(3):851–8.
[93] Nakano Y, Muller NL, King GG, Niimi A, Kalloger
SE, Mishima M, et al. Quantitative assessment of
airway remodeling using high-resolution CT. Chest
2002;122(90060):271S–5S.
[94] King GG, Muller NL, Pare PD. Evaluation of airways
in obstructive pulmonary disease using high-resolu-
tion computed tomography. Am J Respir Crit Care
Med 1999;159(3):992–1004.
[95] Wood SA, Zerhouni EA, Hoford JD, Hoffman EA,
Mitzner W. Measurement of three-dimensional lung
tree structures by using computed tomography. J Appl
Physiol 1995;79(5):1687–97.
[96] McNamara AE, Muller NL, Okazawa M, Arntorp J,
Wiggs BR, Pare PD. Airway narrowing in excised
canine lungs measured by high-resolution computed
tomography. J Appl Physiol 1992;73(1):307–16.
[97] Reinhardt JM, D’Souza ND, Hoffman D. Accurate
measurement of intrathoracic airways. IEEE Trans
Med Imaging 1997;16(6):820–7.
[98] Dalen J. Pulmonary embolism: what have we learned
since Virchow?: natural history, pathophysiology, and
diagnosis. Chest 2002;122:1440–56.
[99] Sinner WN. Computed tomographic patterns of pul-
monary thromboembolism and infraction. J Comp
Ass Tomo 1978;2:395–9.
[100] Rathbun SW, Raskob GE, Whitsett TL. Sensitivity
and specificity of helical computed tomography in
the diagnosis of pulmonary embolism: a systematic
review. Ann Intern Med 2000;132:227–32.
[101] Mullins MD, Becker DM, Hagspiel KD, Philbrick JT.
The role of spiral volumetric computed tomography
in the diagnosis of pulmonary emboli. Arch Intern
Med 2000;160(3):293–8.
[102] Ghaye B, Szapiro D, Mastora I, Delannoy V, Duha-
mel A, Remy J, et al. Peripheral pulmonary arteries:
how far in the lung does multi-detector row spiral CT
allow analysis? Radiology 2001;219(3):629–36.
[103] Goodman LR, Curtin JJ, Mewissen MW, Foley WD,
Lipchik RJ, Crain MR, et al. Detection of pulmonary
embolism in patients with unresolved clinical and
scintigraphic diagnosis: helical CT vs. angiography.
AJR Am J Roentgenol 1995;164:1369–74.
[104] Schoepf UJ, Holzknecht N, Helmberger TK, Crispin
A, Hong C, Becker CR, et al. Subsegmental pulmo-
nary emboli: Improved detection with thin-collima-
tion multi-detector row spiral CT. Radiology 2002;
222(2):483–90.
[105] Bates SM, Ginsberg JS. Helical computed tomogra-
phy and the diagnosis of pulmonary embolism. Ann
Intern Med 2000;132:240–1.
[106] Remy-Jardin M, Remy J, Cauvain O, Petyt L, Wan-
nebroucq J, Beregi JP. Diagnosis of central pulmonary
embolism with helical CT: role of two-dimensional
multiplanar reformations. AJR Am J Roentgenol
1995;165(5):1131–8.
[107] Schoepf UJ, Das M, Schneider A, Anderson M,
Wood S, Costello P. Computer aided detection
(CAD) of segmental and subsegmental pulmonary
emboli on 1-mm multidetector-row CT (MDCT)
studies. Paper 579 in Session G02. Chicago: Radio-
logical Society of North America; 2002.
[108] Peters TM. Image-guided surgery: from x-rays to vir-
tual reality. Comput Methods Biomech Biomed Engin
2000;4(1):27–57.
[109] Hassfeld S, Muhling J. Computer assisted oral and
maxillofacial surgery—a review and an assessment
of technology. Int J Oral Maxillofac Surg 2001;1:
2–13.
[110] Sama AA, Khan SN, Girardi FP, Cammisa Jr CF.
Computerized frameless stereotactic image guidance
in spinal surgery. Orthop Clin N Am 2002;2:375–80.
[111] Gazelle GS, Goldberg SN, Solbiati L, Livraghi T.
Tumor ablation with radio-frequency energy. Radiol-
ogy 2000;217(3):633–46.
[112] Dupuy DE, Mayo-Smith WW, Abbott GF, DiPetrillo
T. Clinical applications of radio-frequency tumor ab-
lation in the thorax. Radiographics 2002;22(90001):
259S–69S.
[113] Zagoria RJ, Chen MY, Kavanagh PV, Torti FM. Ra-
dio frequency ablation of lung metastases from renal
cell carcinoma. J Urol 2001;166(5):1827–8.
[114] Goldberg SN, Gazell GS. Radio-frequency in the rab-
bit lung: efficacy and complications: in vivo study in
rabbit lung. Acad Radiol 1995;2:776–84.
[115] Suzuki S, Suzuki N, Hattori A, Takatsu A, Uchiyama
A. Deformable organ model using the sphere-filled
method for virtual surgery. In: Enderle JD, editor.
Proceedings of the 22nd Annual International Confer-
ence of the IEEE. Toronto: IEEE; 2000. p. 2416–8.
[116] Tseng D-C, Lin J-U. A hybrid physical deformation
modeling for laparoscopic surgery simulation. In:
Enderle JD, editor. Engineering in Medicine and Bi-
ology Society. Proceedings of the 22nd Annual Inter-
national Conference of the IEEE. Toronto: IEEE;
2000. p. 3032–4.
[117] Satava RM, Jones SB. Current and future applications
of virtual reality for medicine. Proc IEEE 1998;86(3):
484–9.

Index
Note: Page numbers of article titles are in boldface type.
A
Adenomas, lung cancer and, 9
Adrenal glands, metastasis to, from lung cancer, 9,
103–104
Airway disease, virtual bronchoscopy of, 79–86
benign disease, 81–82
technique for, 77–79
thoracic malignancies, 79–81
Angiography, computed tomography, of pulmonary
embolism, 114–117, 119
magnetic resonance, of pulmonary embolism,
117–118, 119
of pulmonary embolism, 113
B
Barrett’s esophagus, chromoendoscopy of, 88
diagnosis of, 85
high-resolution/high-magnification endoscopy of,
89–90
Bones, metastasis to, from lung cancer, 9–10,
104–105
Brain, metastasis to, from lung cancer, 9
Bronchial carcinoid, imaging of, 97
Bronchogenic carcinoma, imaging of, 18–19
Bronchogenic cysts, imaging of, 29, 31
Bronchoscopy, fluorescent. See Fluorescent
bronchoscopy.
virtual, of airway disease. See Airway disease.
C
Cartilaginous lesions, of chest wall, imaging of, 19
Central nervous system, metastasis to, from lung
cancer, 9
Chemoprevention, in fluorescent bronchoscopy, of
lung cancer, 71
Chest wall tumors, imaging of, 17–20
lung cancer with chest wall invasion, 17–18
metastatic lesions, 17
Pancoast tumors, 18–19
primary osseous and cartilaginous lesions, 19
soft tissue tumors, 19–20
Chondrosarcoma, imaging of, 19
Chromoendoscopy, of Barrett’s esophagus, 88
of esophageal cancer. See Esophageal cancer.
of intestinal metaplasia, 88–89
Chronic obstructive pulmonary disease, computed
tomography of, future directions in, 142
Chylothorax, mediastinal surgery and, 36
Computed tomography, future directions in, 135–149
dose reduction, 137–139
for chronic pulmonary obstructive disease, 142
for interventional procedures, 143
for lung cancer, 139–141
for pulmonary embolism, 142–143
image acquisition, 133–134
spatial resolution, 134–135
temporal resolution, 136–137
volume coverage, 135–136
in screening, for lung cancer. See Lung cancer.
in staging, of lung cancer, 1–2, 5–6, 9
with positron emission tomography, 7–8
of esophageal cancer, 60–64
of hemorrhage, after mediastinal surgery, 35
of lung cancer, with chest wall invasion, 17–18
of malignant mesothelioma, 13–16
of mediastinal lymph nodes, 35
of mediastinal masses, 24–25
of mediastinitis, 36
of Pancoast tumors, 18–19
of thymomas, 26–27
Computed tomography angiography, of pulmonary
embolism, 14–117, 119
Computed tomography bronchoscopy, of airway
disease. See Airway disease.
1547-4127/04/$ – see front matter D 2004 Elsevier Inc. All rights reserved.
doi:10.1016/S1547-4127(04)00066-0
Thorac Surg Clin 14 (2004) 151–155

Computed tomography venography, of pulmonary
embolism, 113–114
Computer-aided diagnosis, of pulmonary system,
125–133
benefits of, 124
characterization in, 127, 129
detection in, 126–127
documentation and health evaluation in,
129–130
for lung cancer, 41, 46–48, 141
visualization in, 124–126
Cysts, mediastinal, imaging of, 29, 31–32
D
Digital radiography, in screening, for lung cancer,
42–45
Dual energy radiography, in screening, for lung
cancer, 45–46
Duplex ultrasonography, of pulmonary
embolism, 113
E
Embolism, pulmonary. See Pulmonary embolism.
Endoscopic ultrasonography, in staging, of lung
cancer, 8
of esophageal cancer, 62–65
Endoscopy, high-resolution/high-magnification, of
Barrett’s esophagus, 89
of intestinal metaplasia and dysplasia, 89–90
Energy subtraction radiography, in screening, for
lung cancer, 45–48
Esophageal cancer, imaging of, 61–69
chromoendoscopy in, 86–89
Lugol’s solution in, 86–87
methylene blue in, 87–89
squamous cell carcinoma, 86–87
computed tomography in, 60–64
distant metastases, 59–61
for response to therapy, 65
high-resolution/high-magnification endoscopy
in, 89–90
lymphatic metastases, 63–65
magnetic resonance imaging in, 60–61
nuclear medicine studies in, 61
positron emission tomography in, 61, 64
primary tumors, 61–63
ultrasonography in, 60, 62–65
F
Fibrous tumors, pleural, imaging of, 16–17
Fluorescent bronchoscopy, of lung cancer, 71–77
chemoprevention for, 71
clinical experience with, 73
clinical trials of, 71–72
for staging, 72–73
future directions in, 73–74
instrumentation for, 70
risk stratification for, 70–71
technique for, 70
Fluorodeoxyglucose, in positron emission
tomography, 94, 95, 99, 101–108
G
Ganglioneuroblastomas, mediastinal, imaging of, 29
Ganglioneuromas, mediastinal, imaging of, 29
Gastroenteric cysts, imaging of, 31
Germ cell tumors, mediastinal, imaging of,
28–29, 33
Goiter, imaging of, 27–28
H
Hematomas, retrosternal, mediastinal surgery and, 36
Hemorrhage, mediastinal surgery and, 35
Hodgkin’s disease, imaging of, 27
I
Infections, mediastinal surgery and, 35–36
Intestinal dysplasia, high-resolution/high-magnifica-
tion endoscopy of, 89–90
Intestinal metaplasia, chromoendoscopy of, 88–89
high-resolution/high-magnification endoscopy of,
89–90
Iodine, in nuclear medicine studies, 95
L
Lipomas, of chest wall, imaging of, 19
Liposarcoma, pleural, imaging of, 17
Liver, metastasis to, from lung cancer, 105–106
Lugol’s solution, in chromoendoscopy, of esophageal
cancer, 86–87
Index / Thorac Surg Clin 14 (2004) 151–155152

Lung cancer, fluorescent bronchoscopy of. See
Fluorescent bronchoscopy.
missed, causes of, 41–42
positron emission tomography of, 101–107
and management, 106–107
and prognosis, 107for adrenal masses, 103–104
for diagnosis, 101–102for mediastinal lymph node involvement,
102–103for metastasis to bone, 104–105
for metastasis to liver, 105–106for staging, 7, 10, 102–106
screening for, computed tomography in, 53–59
and curability, 55–56computer-aided diagnosis in, 41,
46–48, 141diagnostic distribution in, 54
false-positive diagnoses in, 54–55future directions in, 139–141
regimen for, 52–53plain films in, 43–52, 55
computer-aided diagnosis in, 46–48digital radiography in, 42–45
energy subtraction radiography in, 45–48missed cancers in, 41–42
temporal subtraction in, 48staging of, 1–13, 102–106
extrathoracic disease in, 8–10computed tomography in, 9
in adrenal glands, 9, 103–104in bones, 9–10, 104–105
in brain, 9in liver, 105–106
magnetic resonance imaging in, 9positron emission tomography in, 9, 10
fluorescent bronchoscopy in, 72–73for primary tumor, 1–4
computed tomography in, 1–2magnetic resonance imaging in, 2–3
thoracoscopy in, 3–4mediastinal lymph nodes in, 4–8, 102–103
computed tomography in, 5–6computed tomography/positron emission
tomography fusion in, 7–8
endoscopic ultrasonography in, 8magnetic resonance imaging in, 6–7
positron emission tomography in, 7
with chest wall invasion, imaging of, 17–18
Lung imaging fluorescence endoscope. See
Fluorescent bronchoscopy.
Lymph nodes, in staging, of lung cancer. See Lung
cancer, staging of.
mediastinal, sampling of, 33–35
metastasis to, from esophageal cancer, 63–65
Lymphography, magnetic resonance, in staging, of
lung cancer, 6–7
Lymphomas, imaging of, 27
M
Magnetic resonance angiography, of pulmonary
embolism, 117–118, 119
Magnetic resonance imaging, in staging, of lung
cancer, 2–3, 6–7, 9
of esophageal cancer, 60–61
of lipomas, of chest wall, 19–20
of lung cancer, with chest wall invasion, 18
of malignant mesothelioma, 13–14
of mediastinal masses, 25
of Pancoast tumors, 18–19
Magnetic resonance lymphography, in staging, of
lung cancer, 6–7
Malignant mesothelioma. See Pleural tumors.
Mediastinal lymph nodes, in staging, of lung cancer.
See Lung cancer, staging of.
sampling of, 33–35
Mediastinitis, imaging of, 35–36
Mediastinum, imaging of, 25–42
computed tomography in, 24–25
for cysts, 29, 31–32
for germ cell tumors, 28–29, 33
for invasive tumors, 32–33
for lymphomas, 27
for mediastinal lymph nodes, 33–35
for meningoceles, 32
for neurogenic tumors, 29
for peripheral nerve tumors, 29
for postoperative complications, 35–36
for sympathetic ganglia tumors, 29
for thymic masses, 26–27, 33
for thyroid masses, 27–28
magnetic resonance imaging in, 25
nuclear medicine studies in, 25–26
plain films in, 23–24
ultrasonography in, 25
Meningoceles, imaging of, 32
Mesothelioma. See Pleural tumors.
Methylene blue, in chromoendoscopy, of esophageal
cancer, 87–89
N
Nerve sheath tumors, invasive, imaging of, 33
Neural tumors, invasive, imaging of, 33
Index / Thorac Surg Clin 14 (2004) 151–155 153

Neuroblastomas, mediastinal, imaging of, 29
Neuroenteric cysts, imaging of, 31
Neurogenic tumors, mediastinal, imaging of, 29
Non-Hodgkin’s lymphoma, imaging of, 27
Nuclear medicine studies, of esophageal cancer, 61
of mediastinal masses, 25–26
of pulmonary embolism, 112–113, 119
of thoracic malignancies. See
Thoracic malignancies.
O
Osseous lesions, of chest wall, imaging of, 19
P
Pancoast tumors, imaging of, 18–19
Peptides, radiolabeled, in nuclear medicine studies,
95, 97, 99
Pericardial cysts, imaging of, 31–32
Peripheral nerve tumors, mediastinal, imaging of, 29
Plain films, in screening, for lung cancer. See
Lung cancer.
of hemorrhage, after mediastinal surgery, 35
of mediastinal masses, 23–24
of mediastinitis, 35–36
of pulmonary embolism, 111–112, 119
of solitary fibrous pleural tumors, 16–17
Plaques, pleural, imaging of, 16
Pleural tumors, imaging of, 13–17
liposarcoma, 17
malignant mesothelioma, 13–16
computed tomography in, 13–16
magnetic resonance imaging in, 13–14
positron emission tomography in, 15–16
pleural metastasis, 17
pleural plaques, 16
solitary fibrous tumor, 16–17
Positron emission tomography, instrumentation for,
94–95
of esophageal cancer, 61, 64
of lung cancer. See Lung cancer.
of malignant mesothelioma, 15–16
Pulmonary embolism, imaging of, 113–124
algorithm for, 118–120
angiography in, 113
computed tomography angiography in,
114–117, 119
computed tomography in, future directions in,
142–143
magnetic resonance angiography in,
117–118, 119
plain films in, 111–112, 119
venous imaging in, 113–114, 119
ventilation-perfusion scintigraphy in,
112–113, 119
R
Radiolabeled peptides, in nuclear medicine studies,
95, 97, 99
Receiver operating characteristic, in statistical
analysis, of lung cancer, 41–42
Retrosternal hematomas, mediastinal surgery
and, 36
S
Single-photon emission computed tomography,
instrumentation for, 94
Soft tissue tumors, of chest wall, imaging of, 19–20
Somatostatin, in nuclear medicine studies, 95, 97, 99
Squamous cell carcinoma, esophageal, 85
chromoendoscopy of, 86–87
Squamous cell dysplasia, esophageal, 86
Stenoses, airway, virtual bronchoscopy of, 81–82
Sympathetic ganglia tumors, mediastinal, imaging
of, 29
T
Technetium, in nuclear medicine studies, 95, 99
Temporal subtraction, in screening, for lung
cancer, 48
Thallium, in nuclear medicine studies, 95
Thoracic duct injury, mediastinal surgery and, 36
Thoracic malignancies, lung cancer. See Lung cancer.
nuclear medicine studies of, 95–112
fluorodeoxyglucose in, 99, 101, 107–108
instrumentation for, 94–95
radiolabeled peptides in, 95, 97, 99
radionuclides in, 95
virtual bronchoscopy of, 79–81
Thoracoscopy, in staging, of lung cancer, 3–4
Index / Thorac Surg Clin 14 (2004) 151–155154

Thymic masses, imaging of, 26–27
Thymomas, imaging of, 26–27, 33
Thyroid masses, imaging of, 27–28
U
Ultrasonography, duplex, of pulmonary
embolism, 113
endoscopic, in staging, of lung cancer, 8
of esophageal cancer, 62–65
of esophageal cancer, 60
of mediastinal masses, 25
V
V/Q scans, of pulmonary embolism, 112–113, 119
Venography, computed tomography, of pulmonary
embolism, 113–114
Venous imaging, of pulmonary embolism,
113–114, 119
Ventilation-perfusion scintigraphy, of pulmonary
embolism, 112–113, 119
Video-assisted thoracoscopic surgery, for mediastinal
lymph nodes, 34–35
Virtual bronchoscopy, of airway disease. See
Airway disease.
Index / Thorac Surg Clin 14 (2004) 151–155 155