Embed Size (px)
Citation preview
IMAGING IN MEDIAL TEMPORAL EPILEPSYDR.SARATH MENON.R,MD(Med.),DNB(Med.),MNAMS
DM RESIDENTDEPT.OF NEUROSCIENCES
AIMS,KOCHI
WHY WE NEED TO KNOW IMAGING IN MTE?
In medically refractory epilepsies
A Dedicated MRI protocol helps us to detect an epileptogenic lesion in 80% cases.
Resection of the lesion can lead to seizure freedom in many such cases.
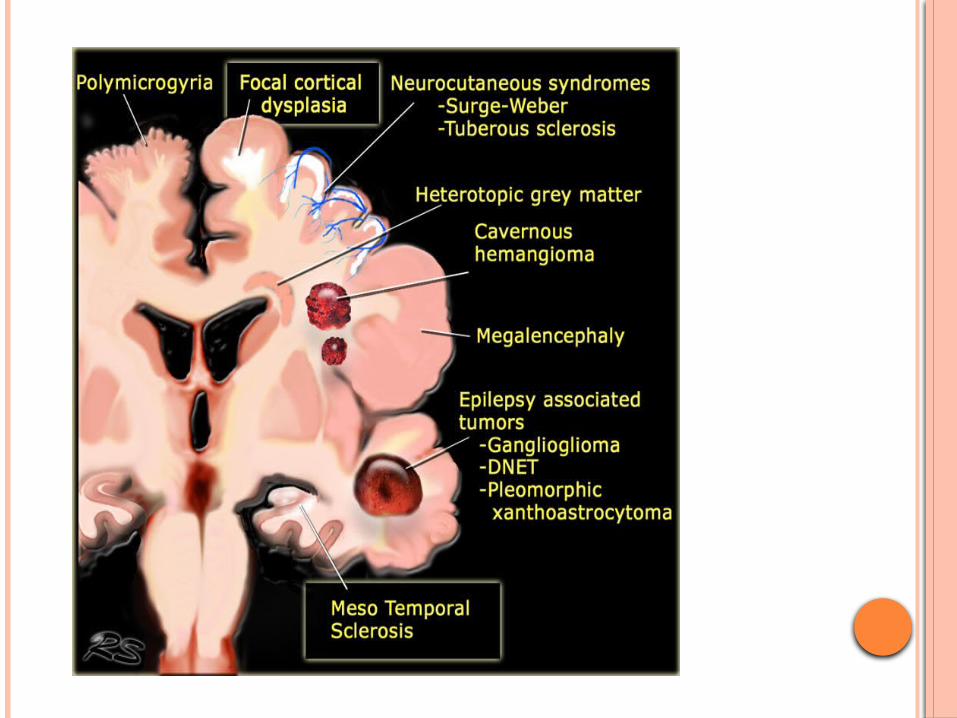

In medication refractory epilepsy the most common location of the epilectogenic lesion is
temporal lobe (60%) frontal lobe (20%) and parietal lobe (10%), periventricular (5%) and occipital (5%).
RADIOLOGICAL ANATOMY OF MEDIAL TEMPORAL LOBE STRUCTURES
Medial temporal lobe structures –
amygdala
hippocampus
Surrounding hippocampal region ( perirhinal, parahippocampal and entorhinal)
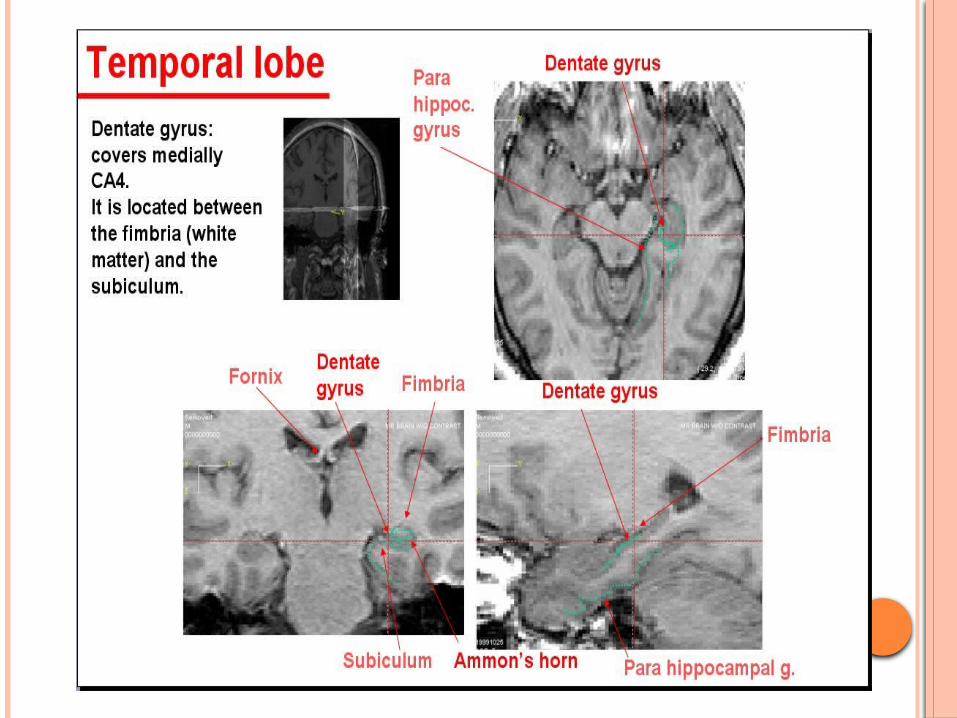
HIPPOCAMPUS
Club-shaped structure divided into three parts: head, body, and tail.
In coronal plane form an S-shaped configuration.
Consists of two interlocking C-shaped structures: the cornu ammonis and the dentate gyrus.
Gray matter of the hippocampus is an extension of the subiculum of the parahippocampal gyrus.
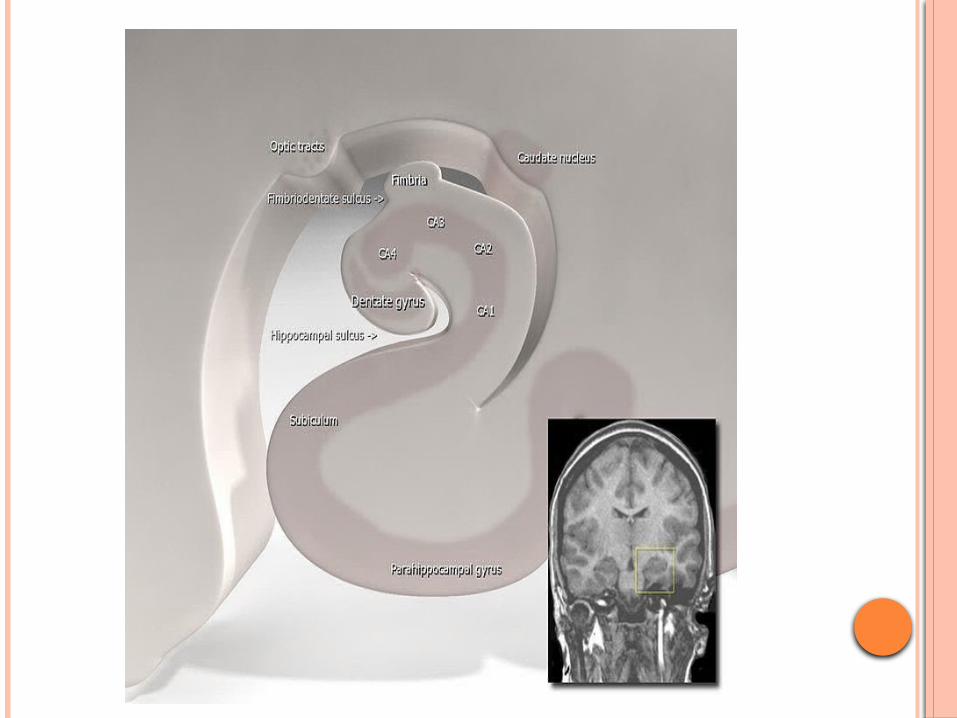
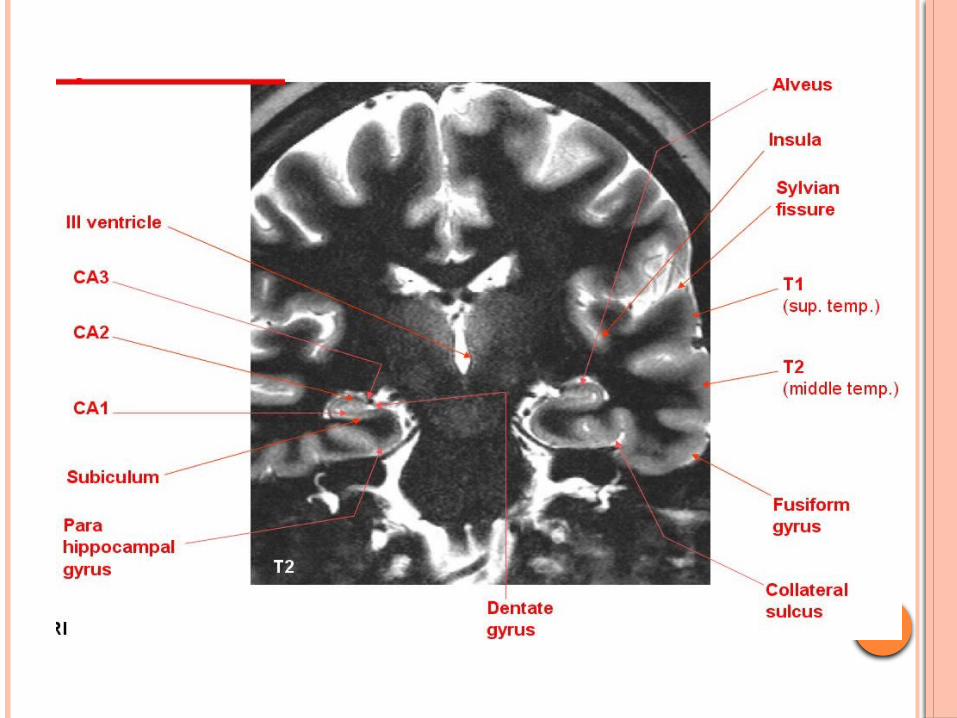
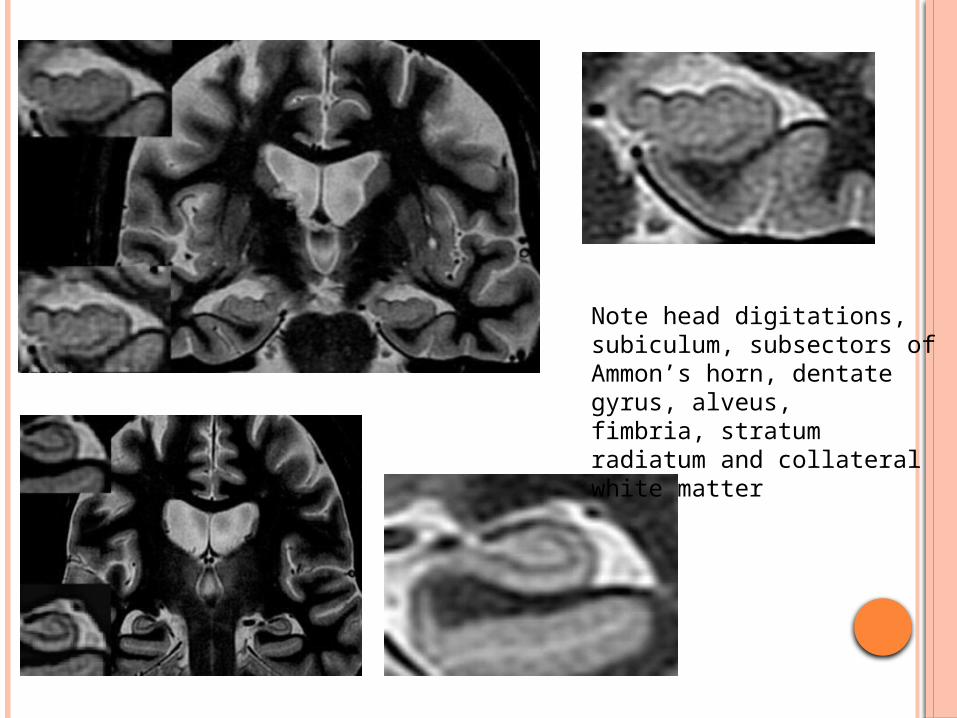
Note head digitations, subiculum, subsectors of Ammon’s horn, dentate gyrus, alveus,fimbria, stratum radiatum and collateral white matter
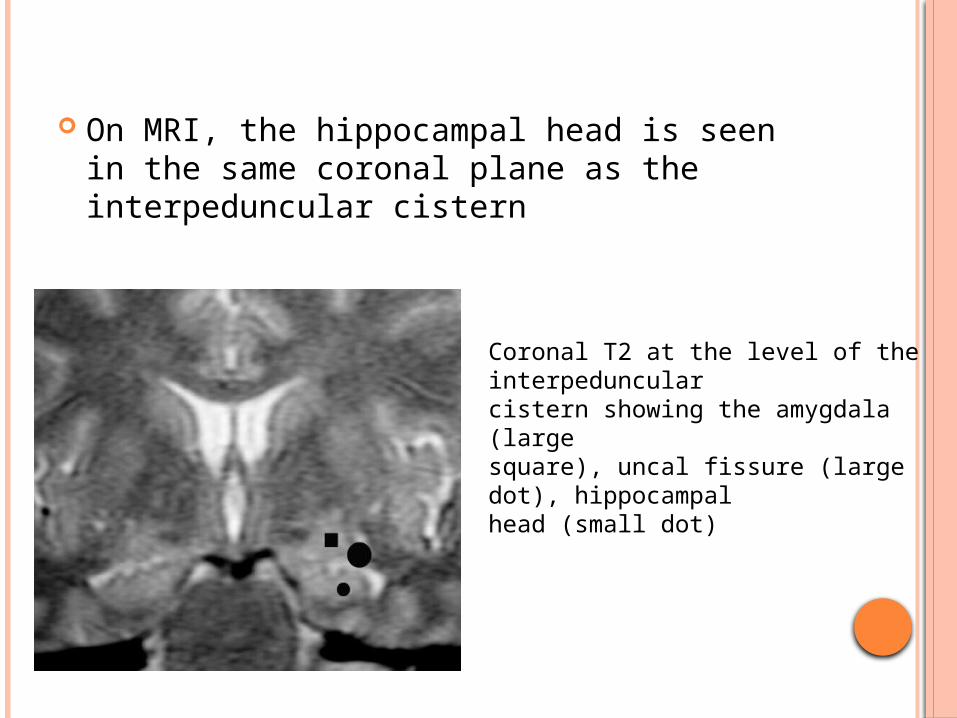
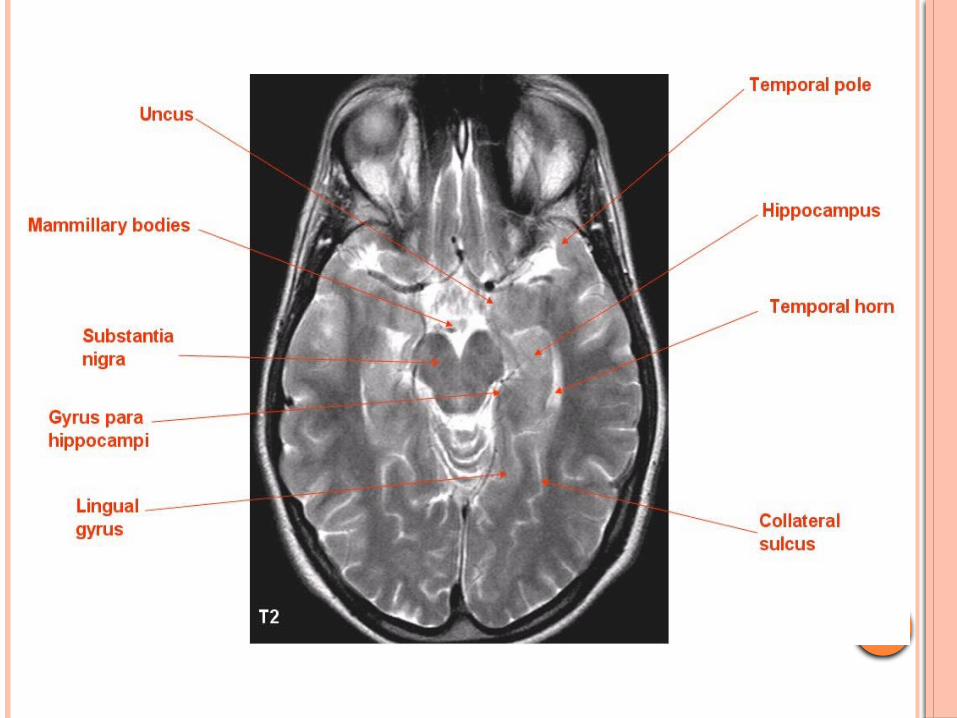
On MRI, the hippocampal head is seen in the same coronal plane as the interpeduncular cistern
Coronal T2 at the level of the interpeduncularcistern showing the amygdala (largesquare), uncal fissure (large dot), hippocampalhead (small dot)
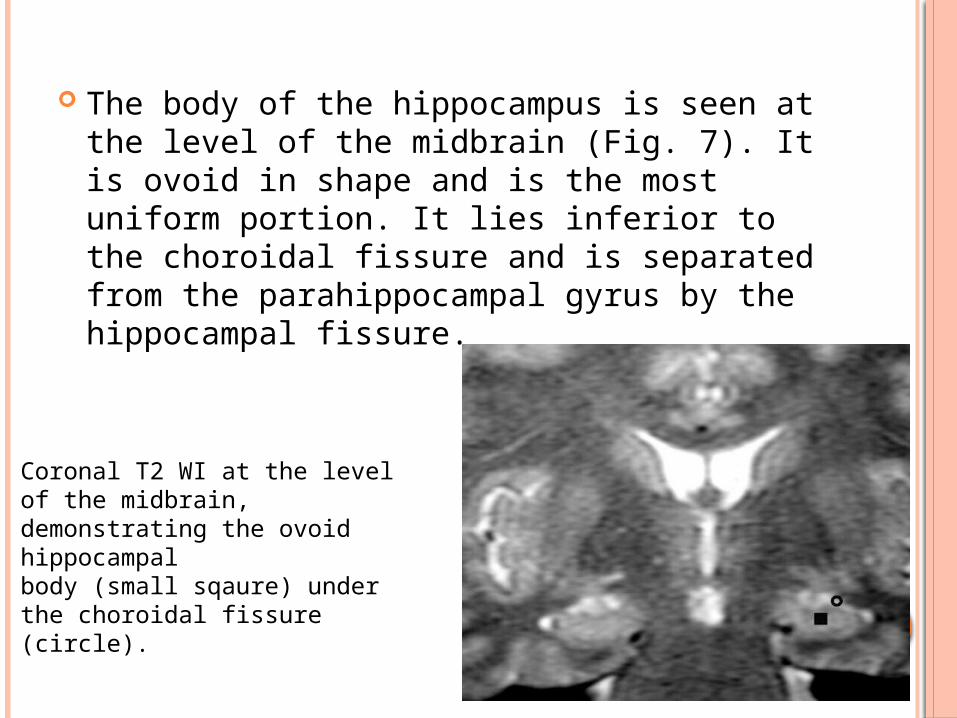
The body of the hippocampus is seen at the level of the midbrain (Fig. 7). It is ovoid in shape and is the most uniform portion. It lies inferior to the choroidal fissure and is separated from the parahippocampal gyrus by the hippocampal fissure.
Coronal T2 WI at the level of the midbrain,demonstrating the ovoid hippocampalbody (small sqaure) under the choroidal fissure(circle).
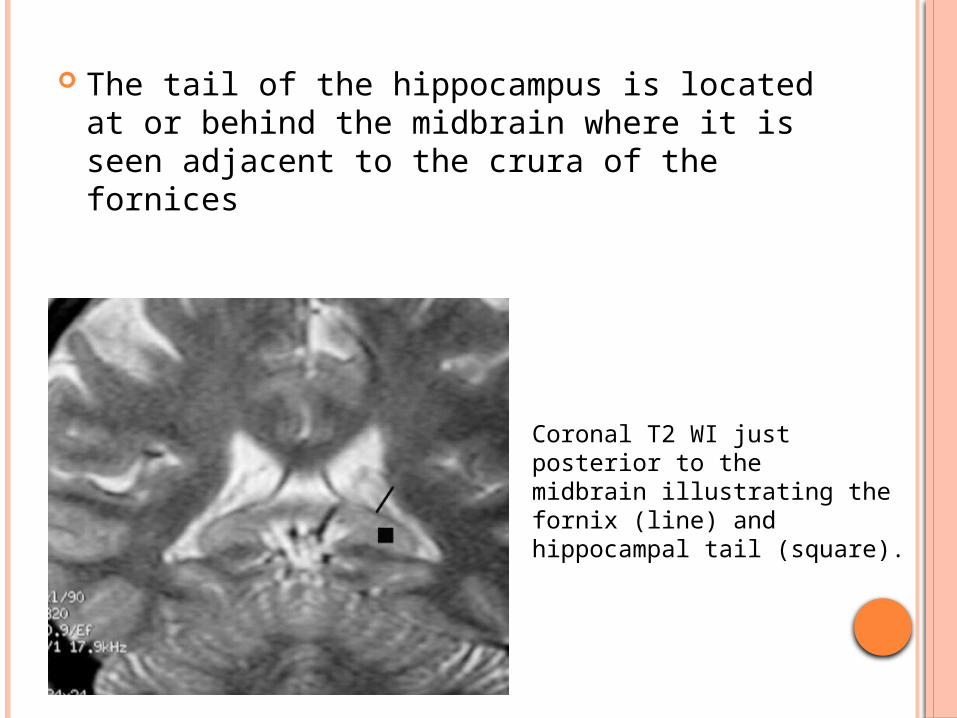
The tail of the hippocampus is located at or behind the midbrain where it is seen adjacent to the crura of the fornices
Coronal T2 WI just posterior to themidbrain illustrating the fornix (line) and hippocampal tail (square).
DEFINITION OF MTS
Mesial temporal sclerosis -coined by Falconer & colleagues – by neuronal loss and gliosis involving principally the hippocampus and amygdala, or both, but occasionally extending to other mesial temporal structures or even throughout the temporal lobe, and leading to generalized atrophy and gliosis.
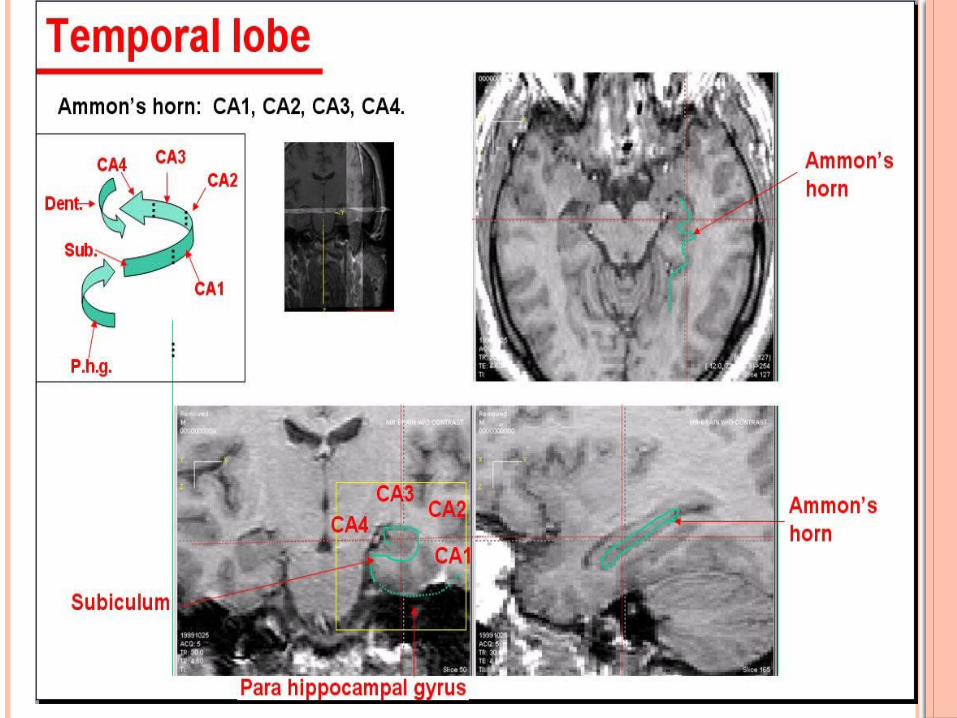
Hippocampal sclerosis : Gliosis and neuronal loss that particularly
affects the CA1, and CA4 or Sommer’s sectors, the dentate gyrus, and the subiculum.
Ammon’s horn sclerosis abnormalities restricted to the areas CA1 and
CA4.
Amygdalar sclerosis
HS is unilateral in about 80% of cases
Most frequent lesional pattern :
Ammon’s horn sclerosis in the CA1 and CA4 sections
Less frequent patterns include widespread cell loss in the hippocampus
Severity of cell loss may vary but it is usually >50% in association with gliosis
IMAGING IN MTE
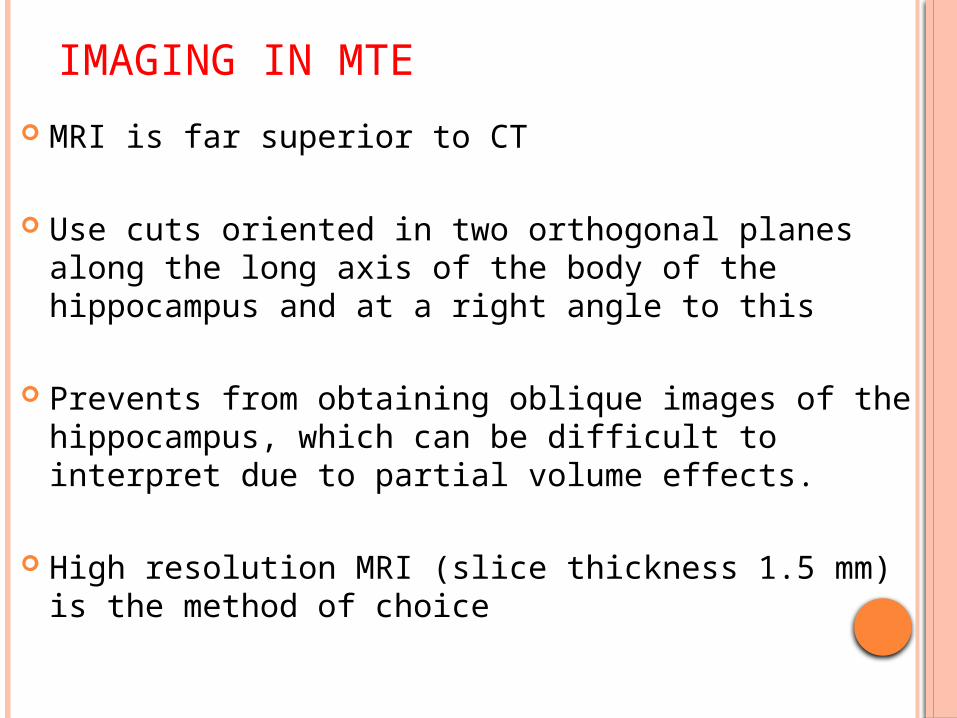
MRI is far superior to CT
Use cuts oriented in two orthogonal planes along the long axis of the body of the hippocampus and at a right angle to this
Prevents from obtaining oblique images of the hippocampus, which can be difficult to interpret due to partial volume effects.
High resolution MRI (slice thickness 1.5 mm) is the method of choice
MRI EPILEPSY PROTOCOL
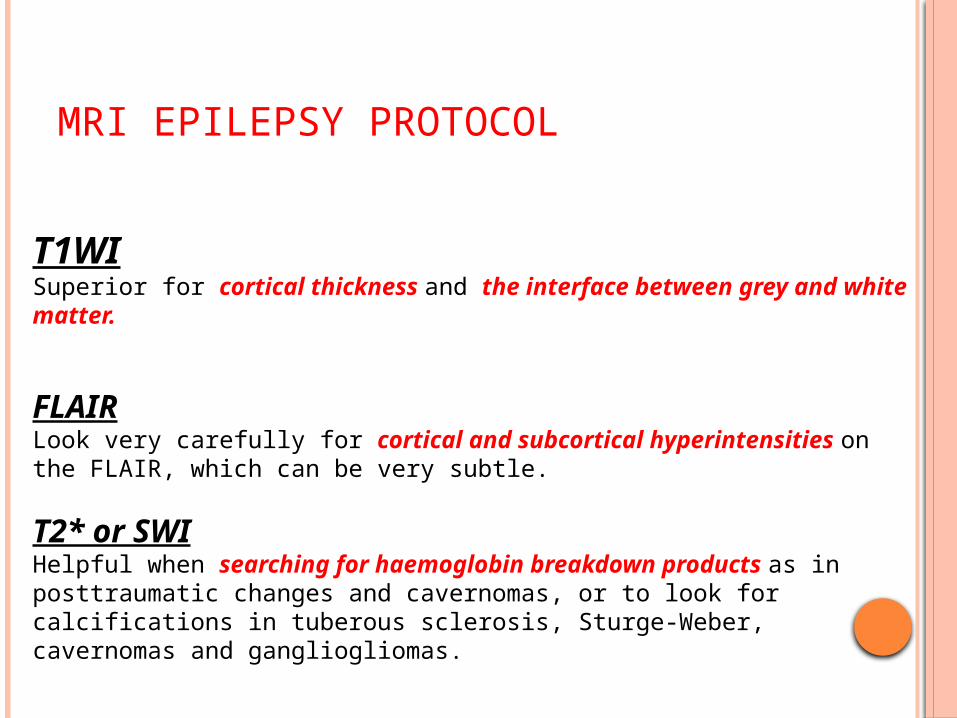
T1WISuperior for cortical thickness and the interface between grey and white matter.
FLAIRLook very carefully for cortical and subcortical hyperintensities on the FLAIR, which can be very subtle.
T2* or SWIHelpful when searching for haemoglobin breakdown products as in posttraumatic changes and cavernomas, or to look for calcifications in tuberous sclerosis, Sturge-Weber, cavernomas and gangliogliomas.
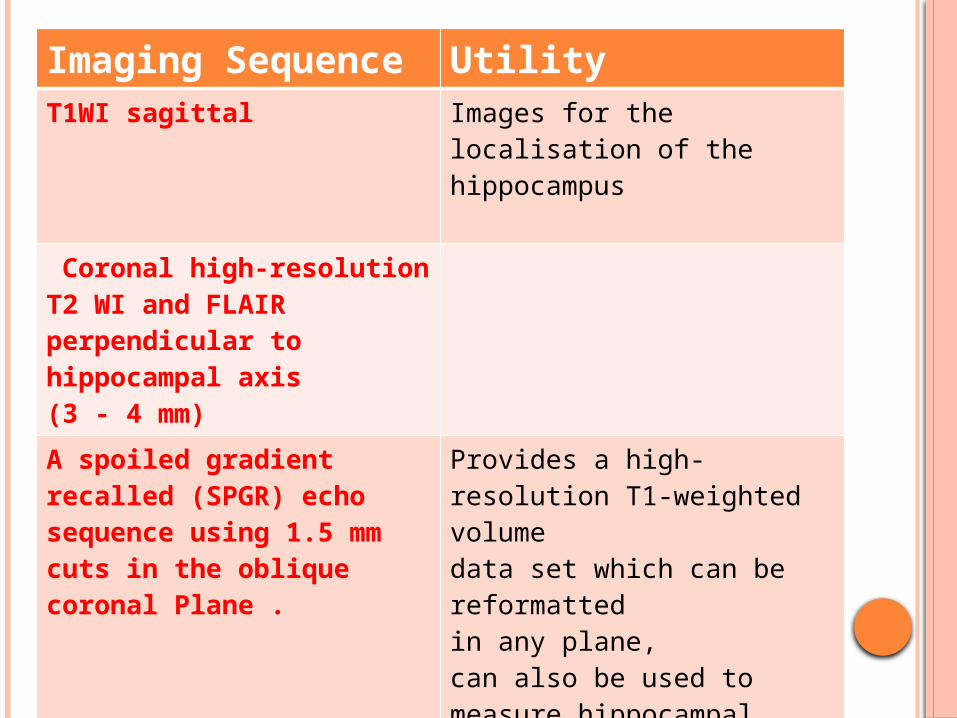
Imaging Sequence
Utility
T1WI sagittal Images for the localisation of the hippocampus
Coronal high-resolution T2 WI and FLAIR perpendicular to hippocampal axis(3 - 4 mm)
A spoiled gradientrecalled (SPGR) echo sequence using 1.5 mm cuts in the oblique coronal Plane .
Provides a high-resolution T1-weighted volumedata set which can be reformattedin any plane, can also be used to measure hippocampal volumes co-register functional data.
Volumetric pulse sequences with reformatting of thin sections
Parallel and perpendicular to the long axis of the hippocampi represent a valid tool.
FIRMS:fast inversion recovery pulse sequence with white matter signal suppression
Since CSF artifacts are incompletely suppressed on FLAIR

OTHER MODALITIES
MR Hippocampal Volumetry
MR Hippocampal T2 Relaxometry
MRS
SPECT
PET
MRI IN MTE
MRI has the ability to detect subtle alterations in cortical architecture & changes in signal intensity
most sensitive and specific imaging technique for non-invasive identification of these epileptogenic foci
MRI FINDINGS
Primary signs-
Reduced hippocampal volume : hippocampal atrophy
Increased T2 signal
Abnormal morphology : loss of internal architecture (interdigitations of hippocampus)
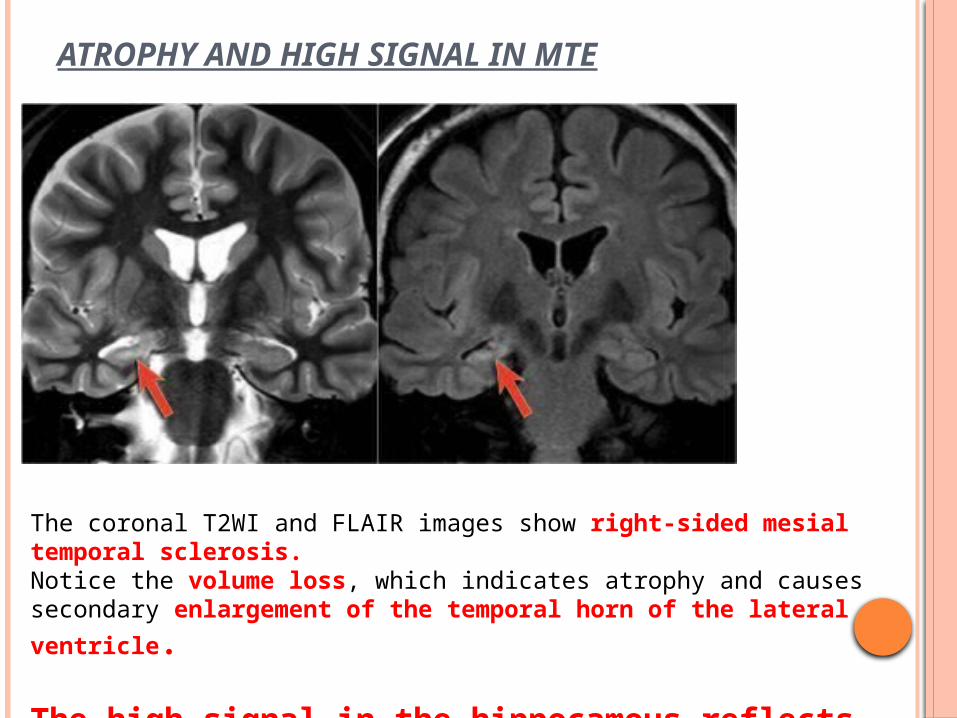
ATROPHY AND HIGH SIGNAL IN MTE
The coronal T2WI and FLAIR images show right-sided mesial temporal sclerosis. Notice the volume loss, which indicates atrophy and causes secondary
enlargement of the temporal horn of the lateral ventricle.
The high signal in the hippocamous reflects gliosis.
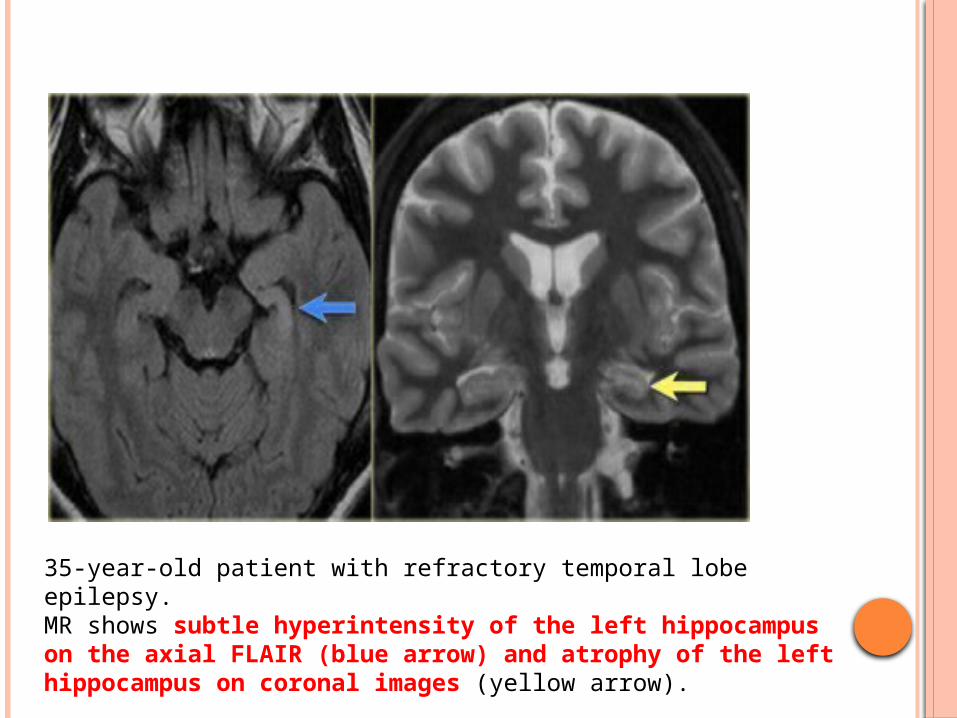
35-year-old patient with refractory temporal lobe epilepsy. MR shows subtle hyperintensity of the left hippocampus on the axial FLAIR (blue arrow) and atrophy of the left hippocampus on coronal images (yellow arrow).
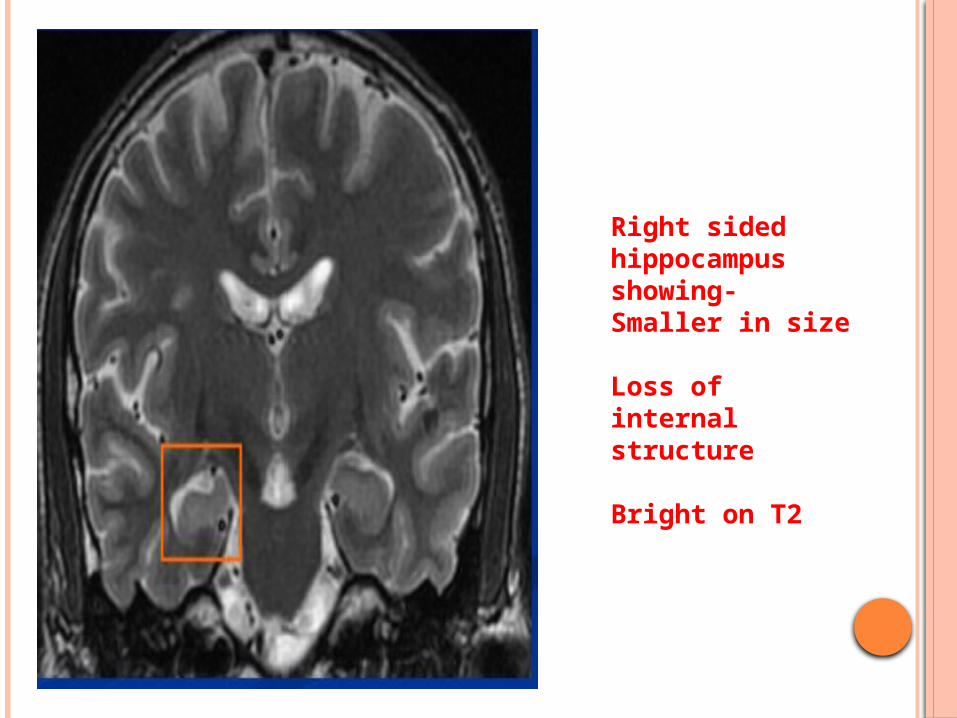
Right sided hippocampus showing- Smaller in size
Loss of internal structure
Bright on T2
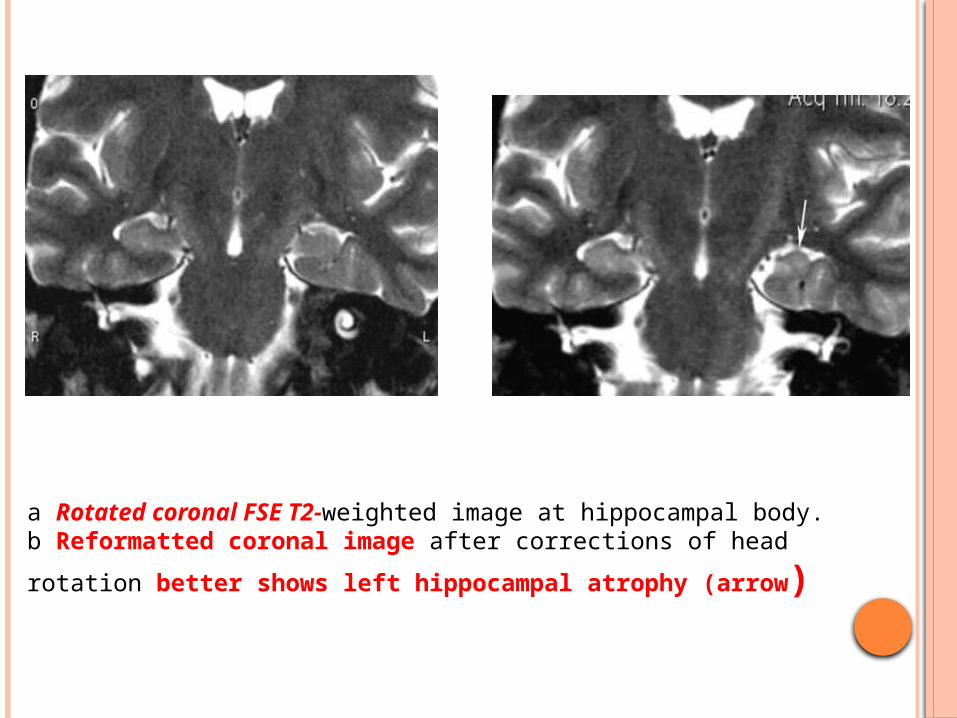
a Rotated coronal FSE T2-weighted image at hippocampal body. b Reformatted coronal image after corrections of head rotation
better shows left hippocampal atrophy (arrow)
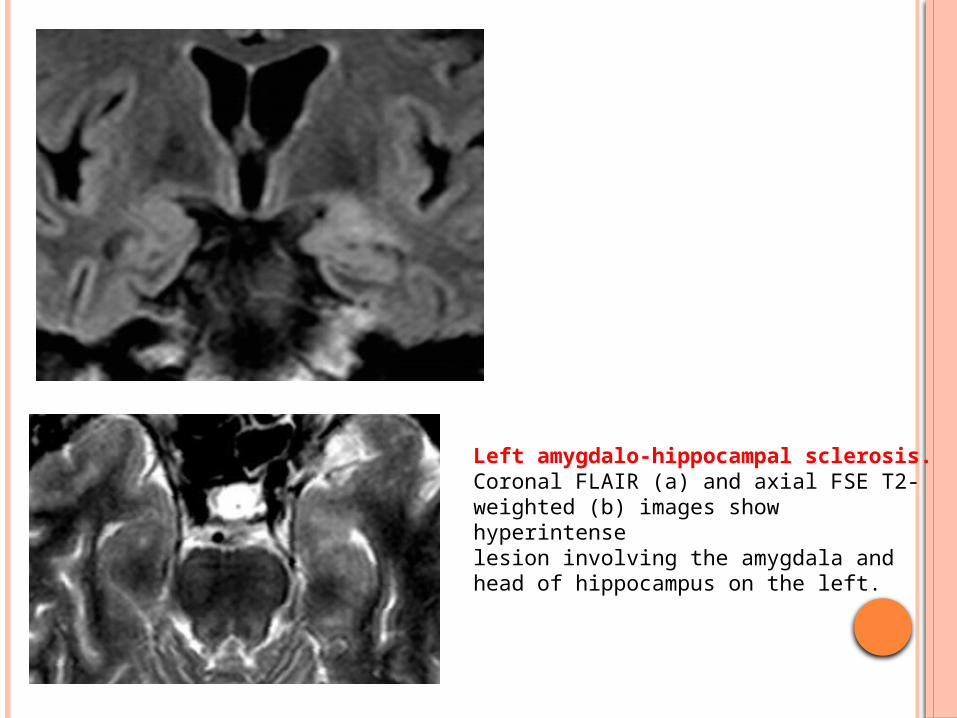
Left amygdalo-hippocampal sclerosis. Coronal FLAIR (a) and axial FSE T2-weighted (b) images show hyperintenselesion involving the amygdala and head of hippocampus on the left.

Bilateral hippocampal sclerosis. Axial FLAIR (c) and oblique coronal FSE T2-weighted (d) images show hyperintense signal involving the head and body of both hippocampi, moreevident on the right
SECONDARY SIGNS
Atrophy of the ipsilateral fornix and mamillary body
Increased signal and or atrophy of the anterior thalamic
nucleus
Atrophy of the cingulate gyrus
Increased signal and / or reduction in volume of the
amygdala
Reduction in volume of the subiculum
Dilatation of temporal horn and temporal lobe atrophy
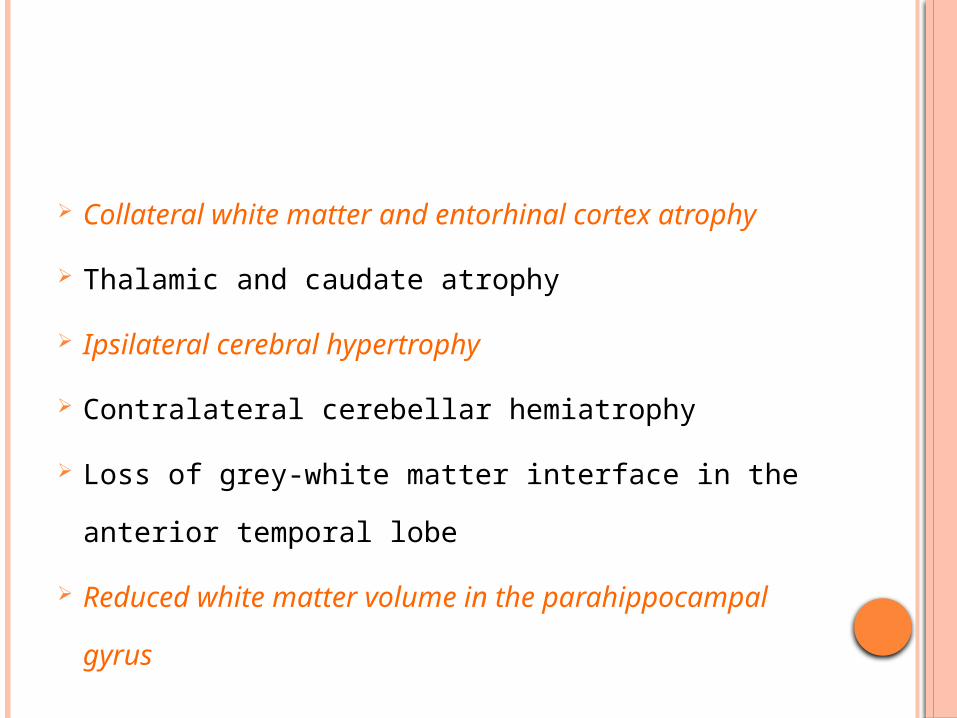
Collateral white matter and entorhinal cortex atrophy
Thalamic and caudate atrophy
Ipsilateral cerebral hypertrophy
Contralateral cerebellar hemiatrophy
Loss of grey-white matter interface in the anterior
temporal lobe
Reduced white matter volume in the
parahippocampal gyrus
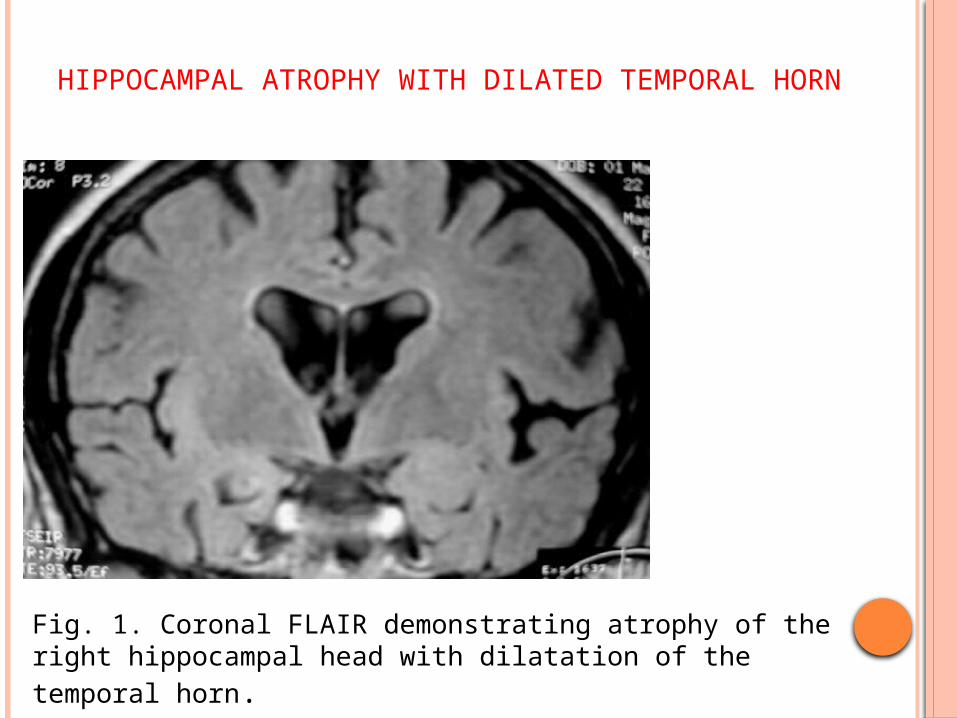
HIPPOCAMPAL ATROPHY WITH DILATED TEMPORAL HORN
Fig. 1. Coronal FLAIR demonstrating atrophy of the right hippocampal head with dilatation of the temporal horn.

LOSS OF GREY WHITE DIFFERENTIATION
Coronal T1WI displaying loss of grey white matter differentiation in the region of the right hippocampal head.

HIPPOCAMPAL AND FORNIX ATROPHY
Coronal FLAIR sequences exhibiting atrophy of the right hippocampal body and tail as well as the right fornix.
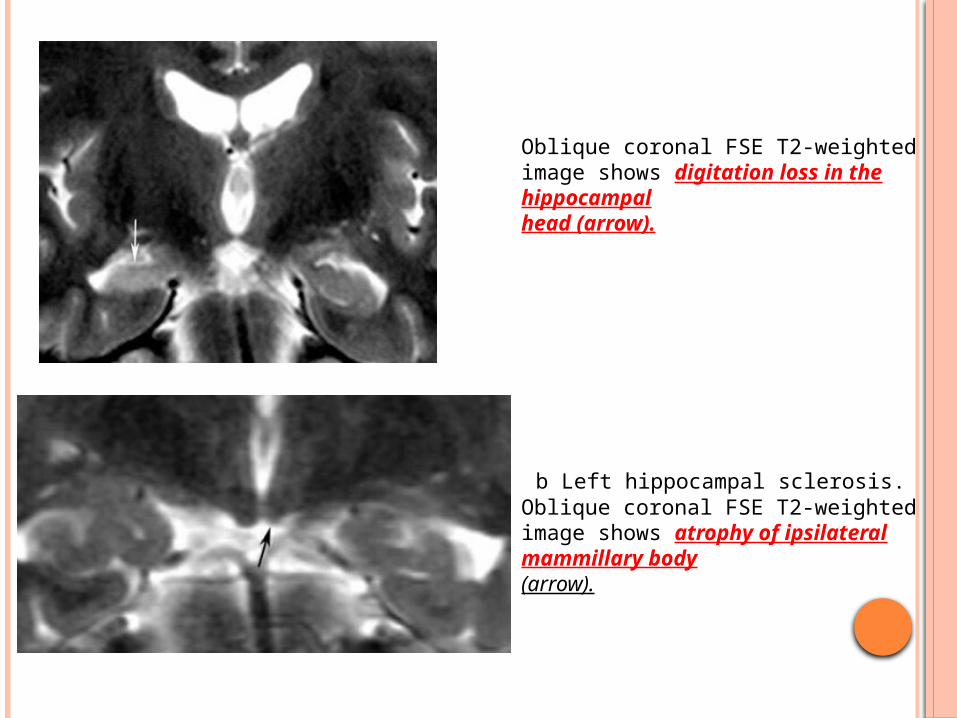
Oblique coronal FSE T2-weighted image shows digitation loss in the hippocampalhead (arrow).
b Left hippocampal sclerosis. Oblique coronal FSE T2-weighted image shows atrophy of ipsilateral mammillary body(arrow).
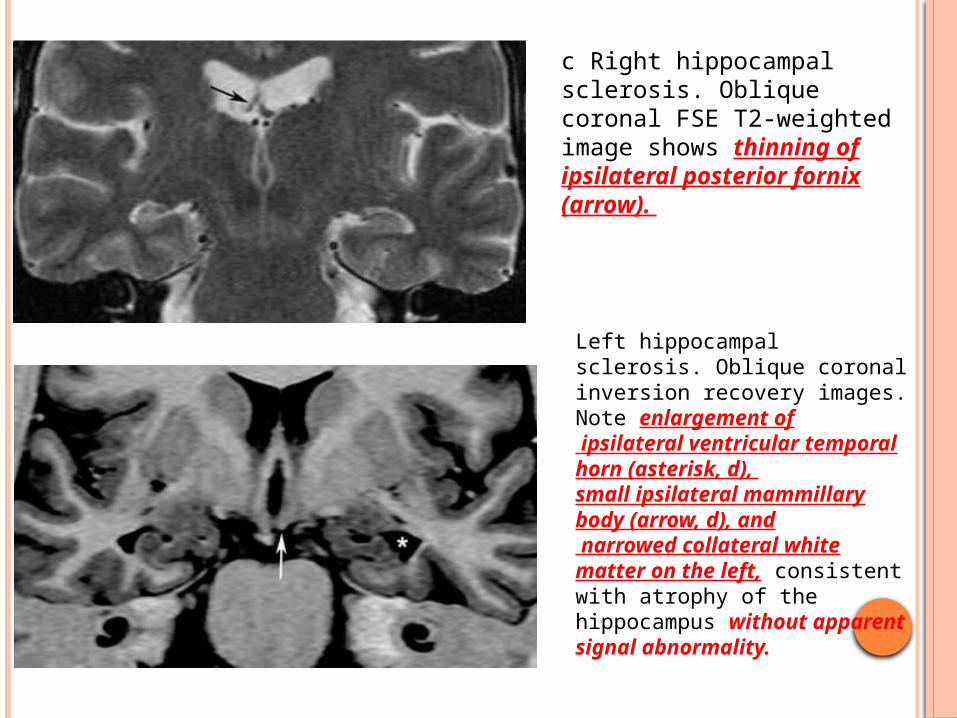
c Right hippocampal sclerosis. Oblique coronal FSE T2-weighted image shows thinning of ipsilateral posterior fornix(arrow).
Left hippocampal sclerosis. Oblique coronal inversion recovery images. Note enlargement of ipsilateral ventricular temporal horn (asterisk, d), small ipsilateral mammillary body (arrow, d), and narrowed collateral white matter on the left, consistentwith atrophy of the hippocampus without apparent signal abnormality.
SIGNIFICANCE OF SECONDARY FEATURES
Important findings related to pathophysiology,diagnosis and prognosis
One should think about mesial temporal sclerosis as a process involving diffuse regions of the brain rather than as one limited to the hippocampus.
Lateralization of mesial temporal sclerosis.
Inpatients with subtle primary findings of unilateral mesial temporal sclerosis, these secondary imaging features help improve diagnostic confidence
In bilateral hippocampal abnormalities, secondary findings can determine the more important side to resect.

THE ATROPHIC-GLIOTIC CHANGES CAN INVOLVE
part of the hippocampal formation
patchy areas, and
extend to the temporal neocortex
Structures outside the temporal lobe
insula; frontobasal and opercular cortex, a lesion termed pararhinal sclerosis
Atrophy of the whole ipsilateral temporal lobe
Hippocampal sclerosis can be bilateral
D/D OF HIPPOCAMPAL HYPERINTENSITY
Hippocampal hyperintensity on T2WI or FLAIR images with volume loss is diagnostic for mesial temporal sclerosis in the appropriate clinical setting.
Hippocampal hyperintensity without volume loss is seen in:
Status epilepticusLow grade tumors (astrocytoma, DNET)Encephalitis
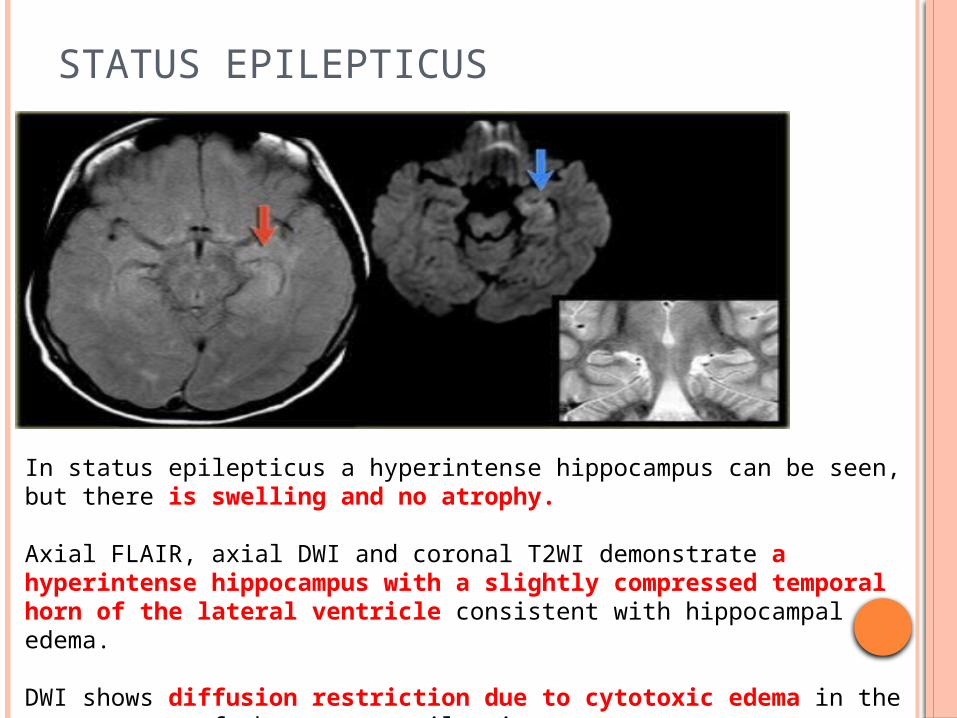
STATUS EPILEPTICUS
In status epilepticus a hyperintense hippocampus can be seen, but there is swelling and no atrophy.
Axial FLAIR, axial DWI and coronal T2WI demonstrate a hyperintense hippocampus with a slightly compressed temporal horn of the lateral ventricle consistent with hippocampal edema.
DWI shows diffusion restriction due to cytotoxic edema in the acute stage of the status epilepticus.
DNET
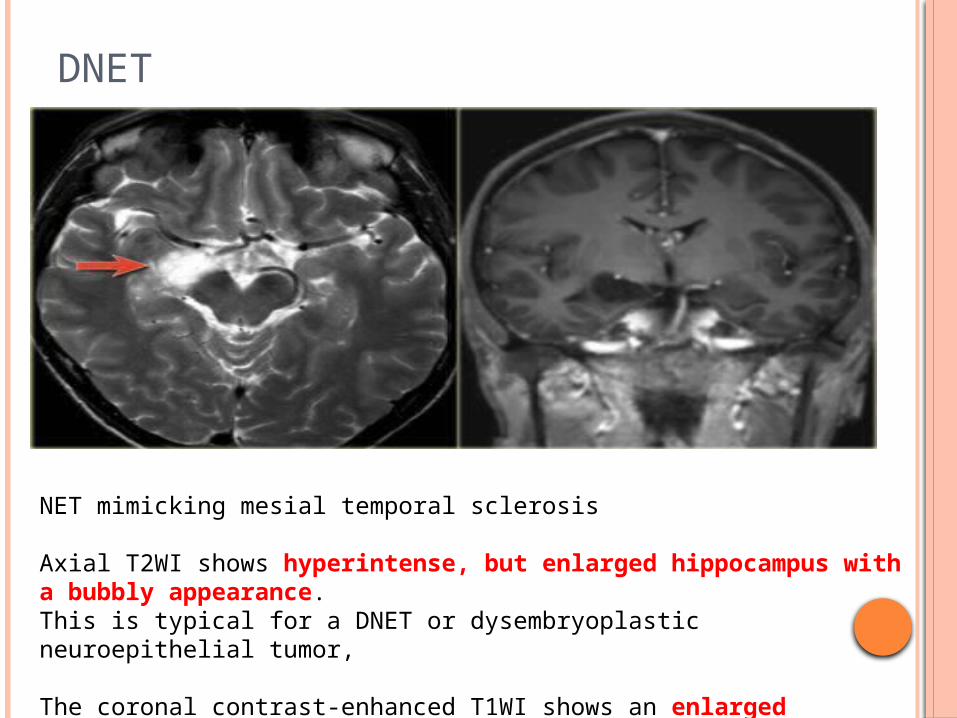
NET mimicking mesial temporal sclerosis
Axial T2WI shows hyperintense, but enlarged hippocampus with a bubbly appearance. This is typical for a DNET or dysembryoplastic neuroepithelial tumor,
The coronal contrast-enhanced T1WI shows an enlarged hippocampus without uptake of contrast medium.
HIPPOCAMPAL VOLUMETRY
Requires side-to-side ratios & absolute volumes corrected for intracranial volume, which must be compared with appropriated age-matched controls from the same laboratory
Limitations Time-consuming.
Relies on subjective definition of the hippocampal boundaries
May fail to detect bilateral changes [201].
May be normal in a small subgroup of patients with abnormal signal in one hippocampus as determined by preoperative MRI and pathologically proven HS
Normally, both hippocampi are of equal volume
with a slight prevalence of the right side
Any asymmetry greater than 0.3 cm is abnormal
Volumetry can detect up to 90% of cases of HS compared to about 80% by visual assessment
T2 RELAXOMETRY
Quantitative MRI may be also used to detect hippocampal Gliosis
Actual quantitative measurements of T2 relaxation time through the hippocampal body may permit the recognition of unilateral or bilateral involvement in patients with apparently normal MRI scans obtained by classical techniques
DIFFUSION MRI
As a result of neuronal loss, the extra cellular space is enlarged and thus diffusion of water molecules is greater on the affected side, resulting in increased values on the affected side (higher signal on ADC).
Conversely, due to neuronal dysfunction and swelling, diffusion is restricted following a seizure, and thus values are lower.
DTI
Diffusion tensor imaging may reveal focal temporal anisotropy in patients with temporal lobe epilepsy
MR SPECTROSCOPY
The NAA decline has been considered to reflect neuronal loss
Patients with TLE have reduced NAA in the ipsilateral hippocampus compared with NAA in the contralateral side lateralizing the seizure focus in TLE.
Myo-Inositol is found primarily in astrocytes. Elevation of myoinositol would be expected in areas of
astroglial cell proliferation
Decreased NAA / Cho and NAA / Cr ratios Increased lipid and lactate soon after the seizure
PET SCAN IN MTE
Inter ictal period metabolism in the region of seizure focus decreases compared to normal brain regions.
Intra ictal period the seizure focus usually shows abnormally increased metabolism, which can also help identify the location of seizure activity.
PET imaging for epilepsy is usually used as a tool for possible surgical candidates.
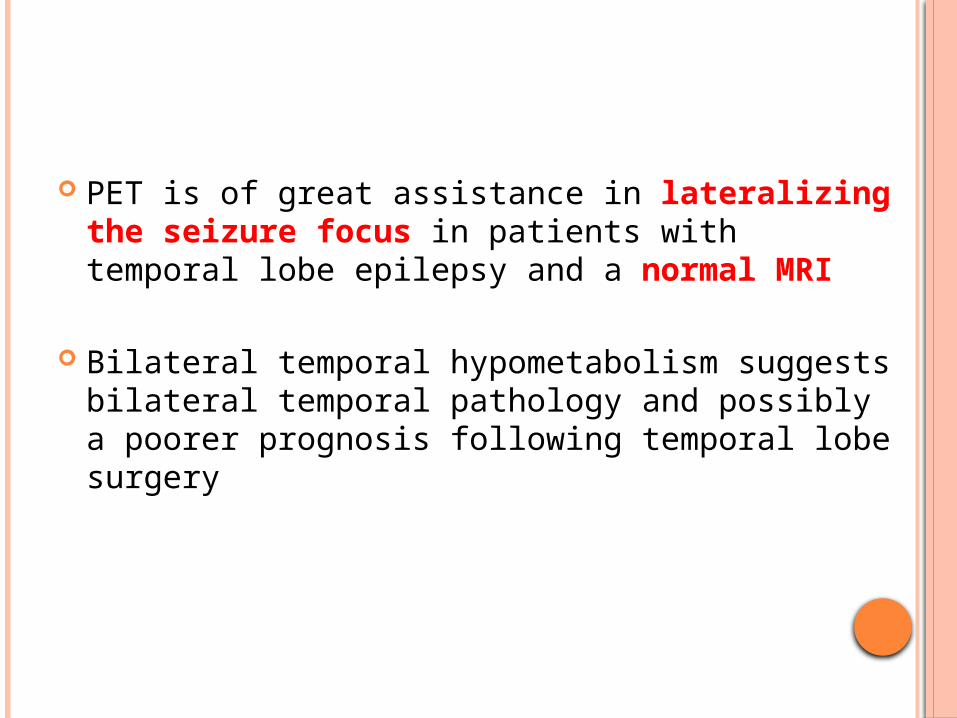
PET is of great assistance in lateralizing the seizure focus in patients with temporal lobe epilepsy and a normal MRI
Bilateral temporal hypometabolism suggests bilateral temporal pathology and possibly a poorer prognosis following temporal lobe surgery

Coronal interictal MR/FDG-PET fusion image shows hypometabolic activity in the right temporal pole (arrow).

SPECT
If the radiotracer is injected ictally, focally increased uptake is identified in the affected temporal lobe (hot focus).
Interictally, the affected temporal lobe demonstrates decreased uptake compared with that of the rest of the brain (cold focus).
Interictal SPECT studies may include a number of false positive and negative results, because the precise time course of the perfusion abnormalities is unknown.
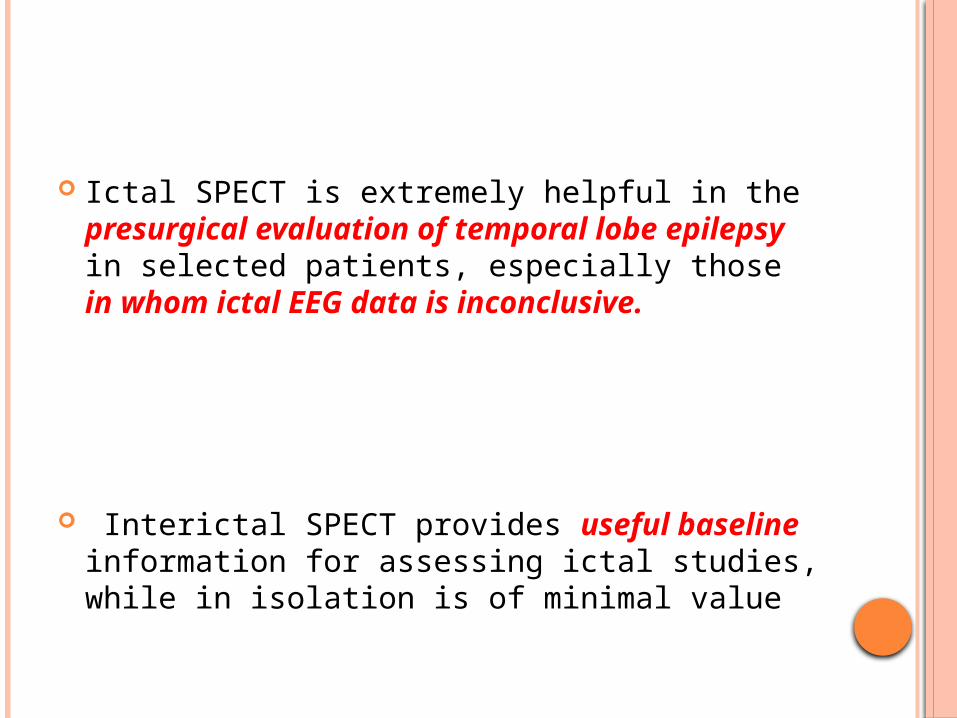
Ictal SPECT is extremely helpful in the presurgical evaluation of temporal lobe epilepsy in selected patients, especially those in whom ictal EEG data is inconclusive.
Interictal SPECT provides useful baseline information for assessing ictal studies, while in isolation is of minimal value
CONCLUSIONS
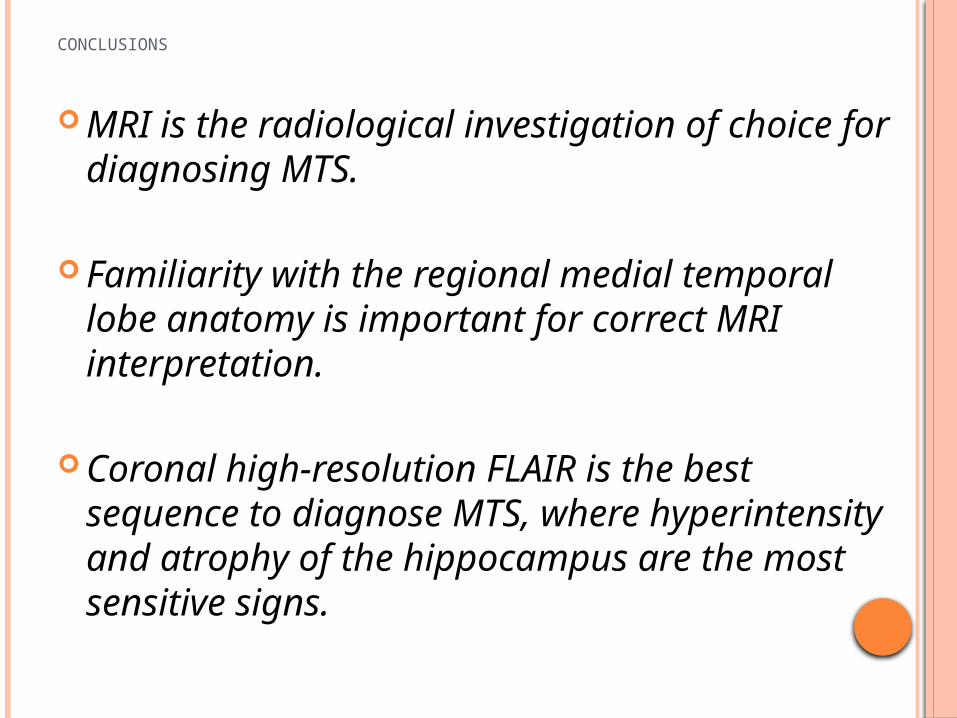
MRI is the radiological investigation of choice for diagnosing MTS.
Familiarity with the regional medial temporal lobe anatomy is important for correct MRI interpretation.
Coronal high-resolution FLAIR is the best sequence to diagnose MTS, where hyperintensity and atrophy of the hippocampus are the most sensitive signs.

THANK YOU

![Mapping pathological changes in brain structure by ... · Mapping pathological changes in brain structure by combining ... [6]or mesial temporal lobe epilepsy [7]. The parallel analysis](https://img.pdfslide.us/doc/110x75/5f0d5dfe7e708231d43a004d/mapping-pathological-changes-in-brain-structure-by-mapping-pathological-changes.jpg)


![Classification and morphology of middle mesial canals of ......root canal was also called the “middle mesial canal” [] 9 and “accessory mesial canal” [10]. Scholars at home](https://img.pdfslide.us/doc/110x75/60c03eb87be5ae7102731e98/classification-and-morphology-of-middle-mesial-canals-of-root-canal-was.jpg)