Embed Size (px)
Citation preview

STATISTICAL METHODS
HOW TO WRITE A SCIENTIFIC PAPER
Medical StatisticsProf.Dr.Amany Rashad Aboel-Seoud Community Medicine Department
Zagazig university

Definition of statistics
• It is the science and art of dealing with numbers.
• Used for collection, summarization, presentation and analysis of data to get information based on objective basis (un-biased).

Uses of statistics
• Descriptive information for any population
• Prove association between variables• Prove relation between risk and disease• Compare two studied groups (or more)• Evaluate health programs & services

Medical Statistics


population


Inferential Statistics
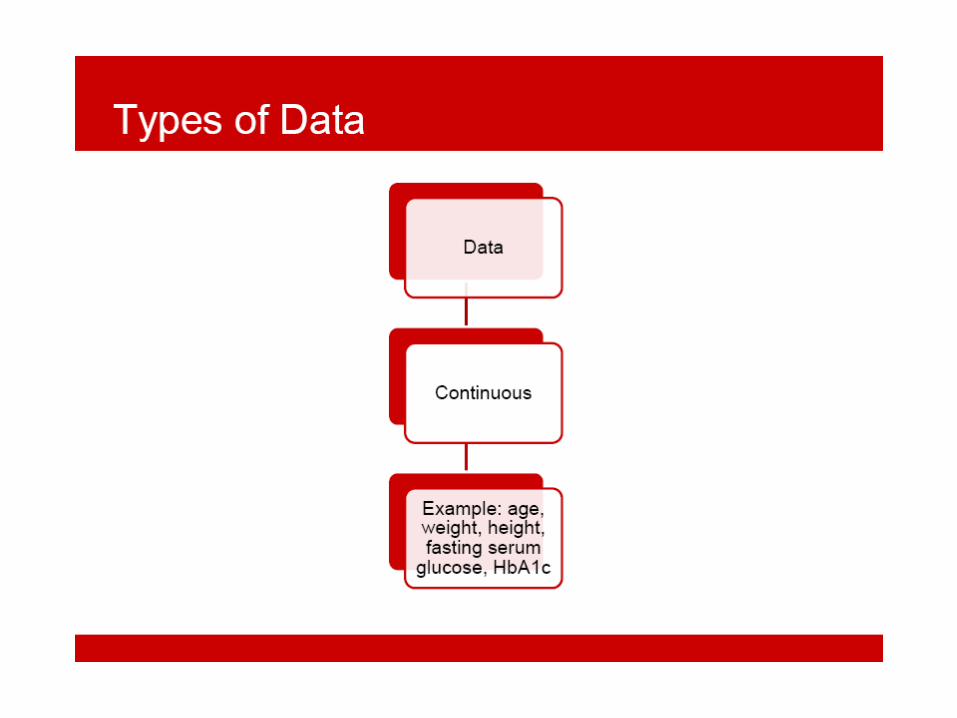
• Put a hypothesis X = Y H0 or X >Y H1 or Y>X H2• Collect, summarize data• Test your hypothesis using tests of significance: Comparison of mean values : t , paired t test & ANOVA (used for numeric continuous data) Finding relations between different variables using
Correlation & regression tests


Correlation test
To find a relation between 2/more variables in direction & strength (one is dependent = response. It is plotted on the y axis) &(the other/s is independent = explanatory or risk. It is plotted on the x axis)
• Correlation does not mean causation.• Spurious correlation: significant statistically but
insignificant clinically

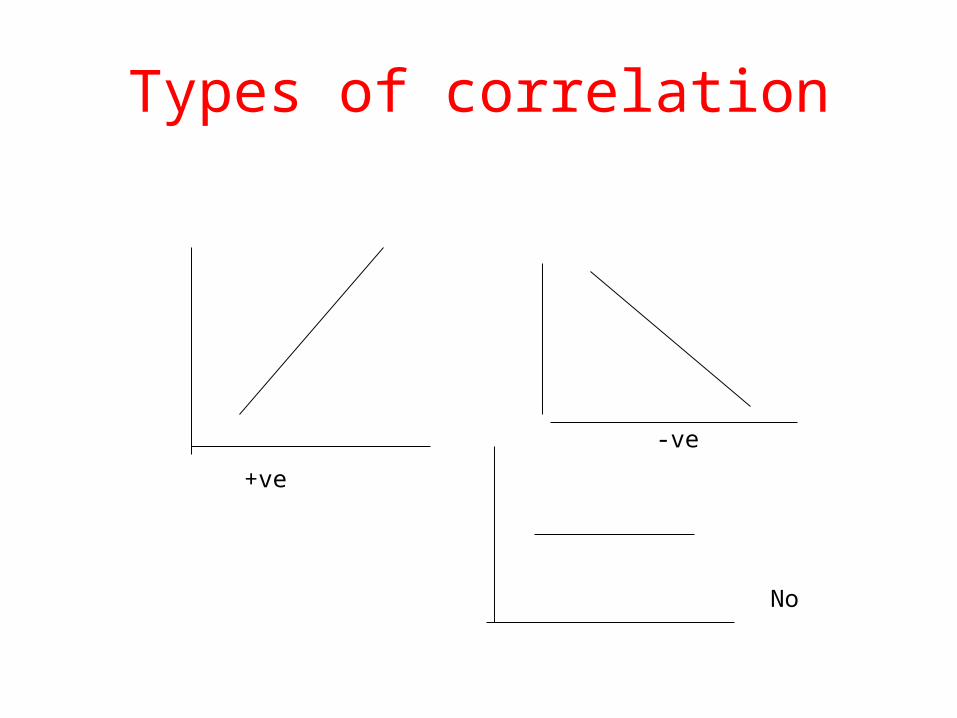
Types of correlation
+ve
-ve
No
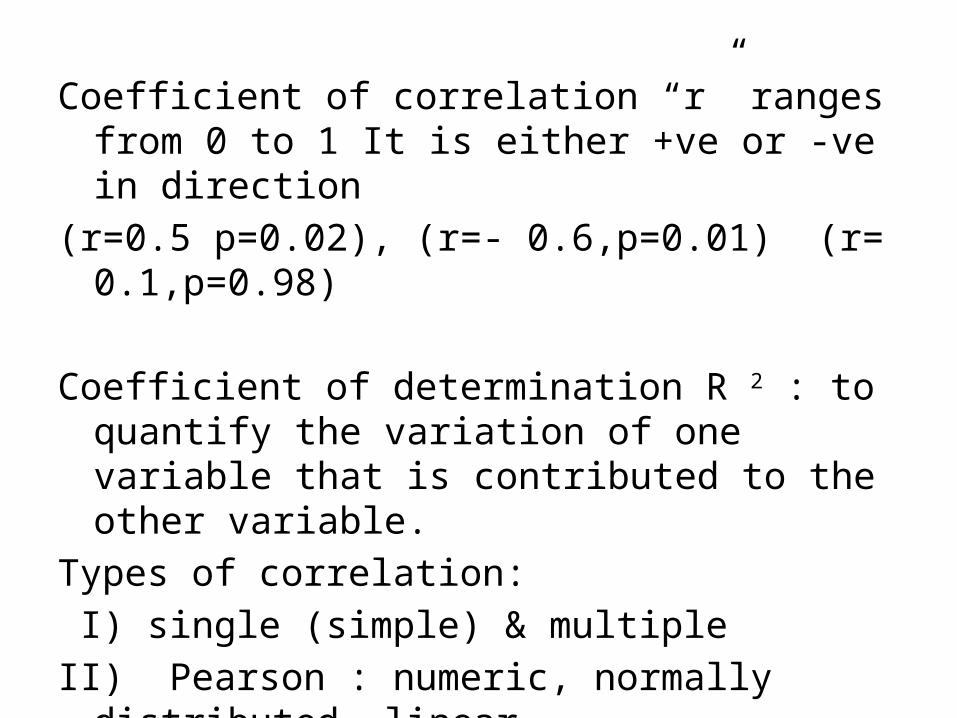
Coefficient of correlation “r” ranges from 0 to 1 It is either +ve or -ve in direction
(r=0.5 p=0.02), (r=- 0.6,p=0.01) (r= 0.1,p=0.98)
Coefficient of determination R 2 : to quantify the variation of one variable that is contributed to the other variable.
Types of correlation: I) single (simple) & multipleII) Pearson : numeric, normally distributed, linear Spearman : ordinal, non linear, not normally distributed
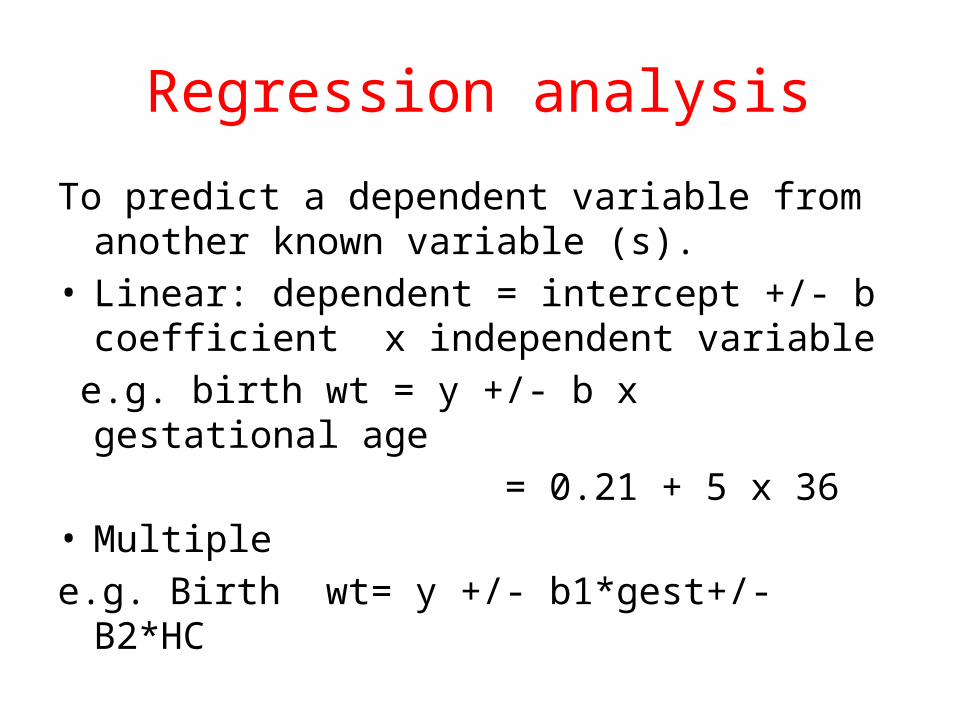
Regression analysis
To predict a dependent variable from another known variable (s).
• Linear: dependent = intercept +/- b coefficient x independent variable
e.g. birth wt = y +/- b x gestational age = 0.21 + 5 x 36• Multiple e.g. Birth wt= y +/- b1*gest+/- B2*HC


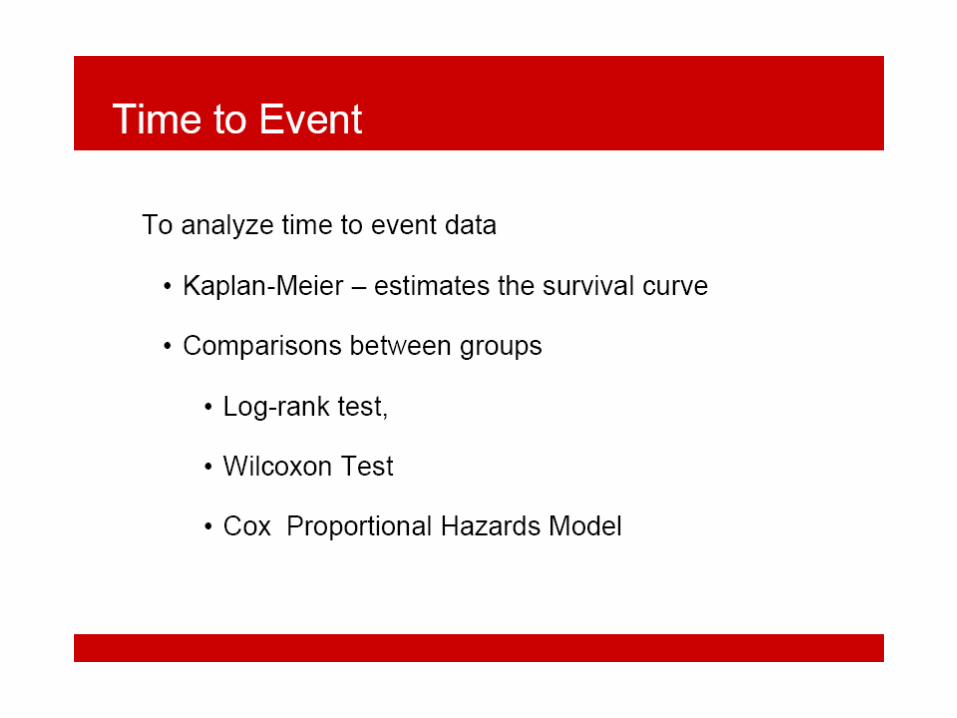
Wilcoxon test, Mann Whitney test


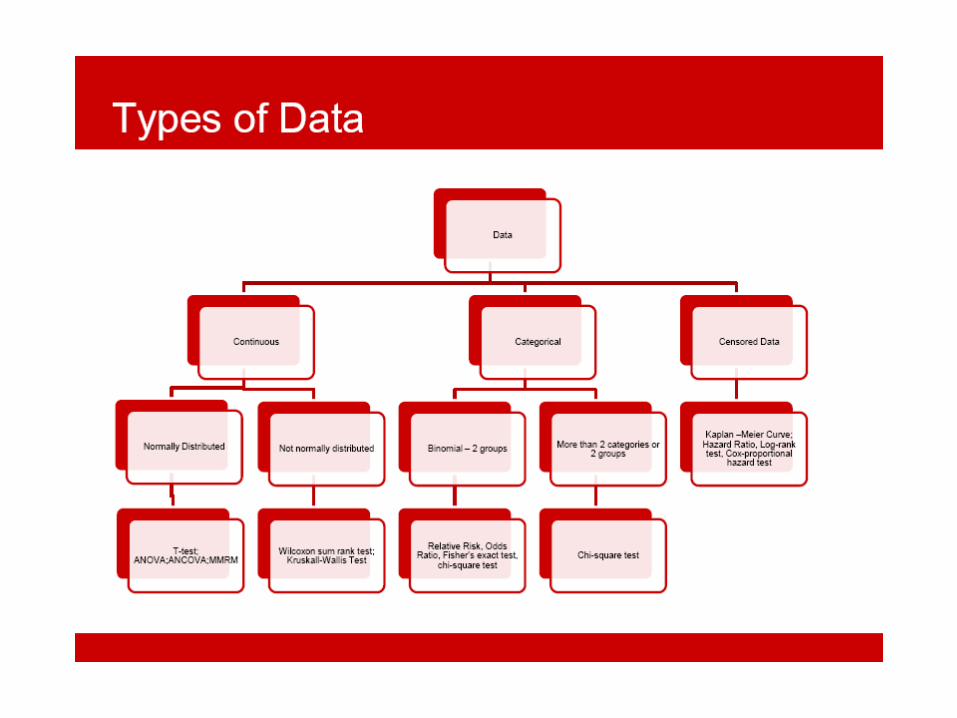
Analysis of qualitative data
(1) Chi squared test : to find significant relation between 2 variables or order distributions or categorical data.
(2) Difference between proportions (z test) as t test but use percentage instead of mean
values


Thank you