Embed Size (px)
Citation preview
HEALTHY AGEING & PREVENTION SUMMIT
Action to sustain wellbeing in later life
25th November 2015

Welcome
Dr Liz Robin
Summit Chair
Director of Public Health
Cambridgeshire & Peterborough
Housekeeping
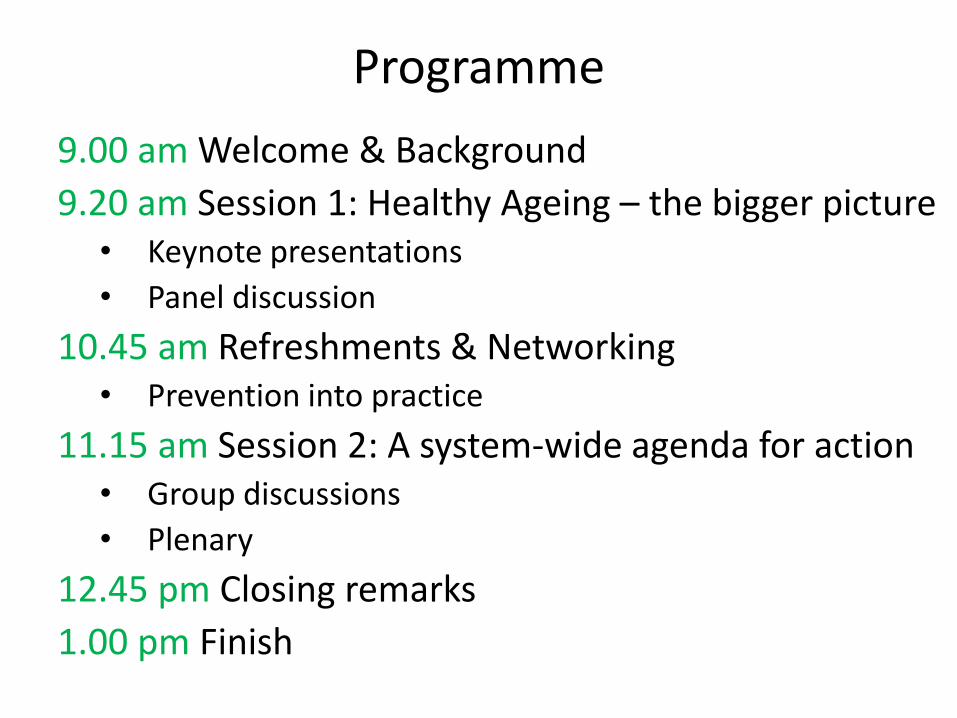
Programme
9.00 am Welcome & Background
9.20 am Session 1: Healthy Ageing – the bigger picture • Keynote presentations
• Panel discussion
10.45 am Refreshments & Networking • Prevention into practice
11.15 am Session 2: A system-wide agenda for action • Group discussions
• Plenary
12.45 pm Closing remarks
1.00 pm Finish
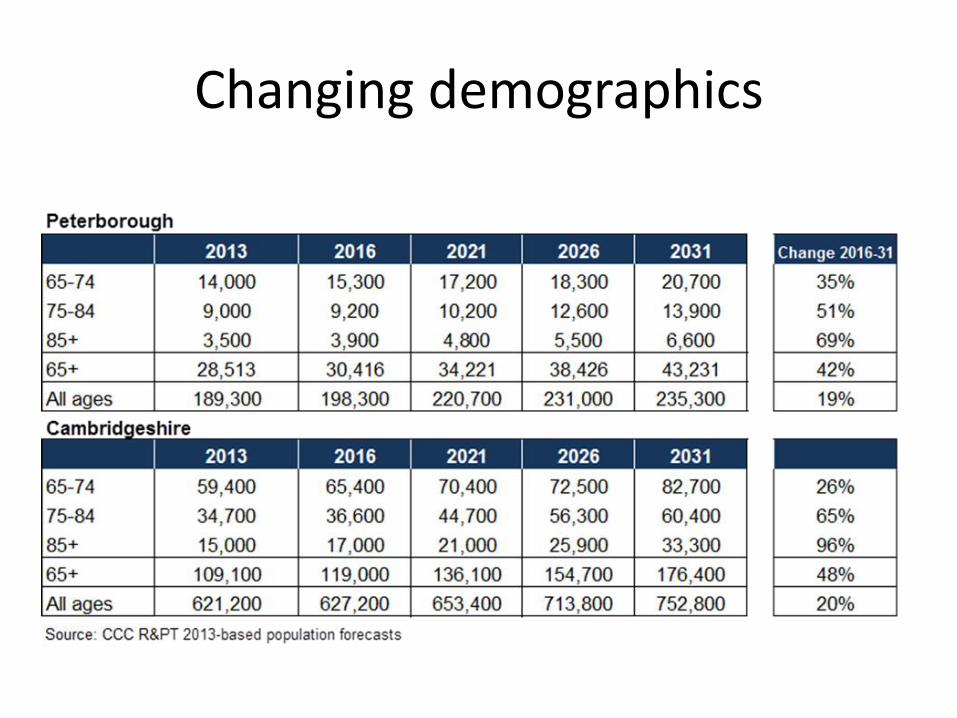
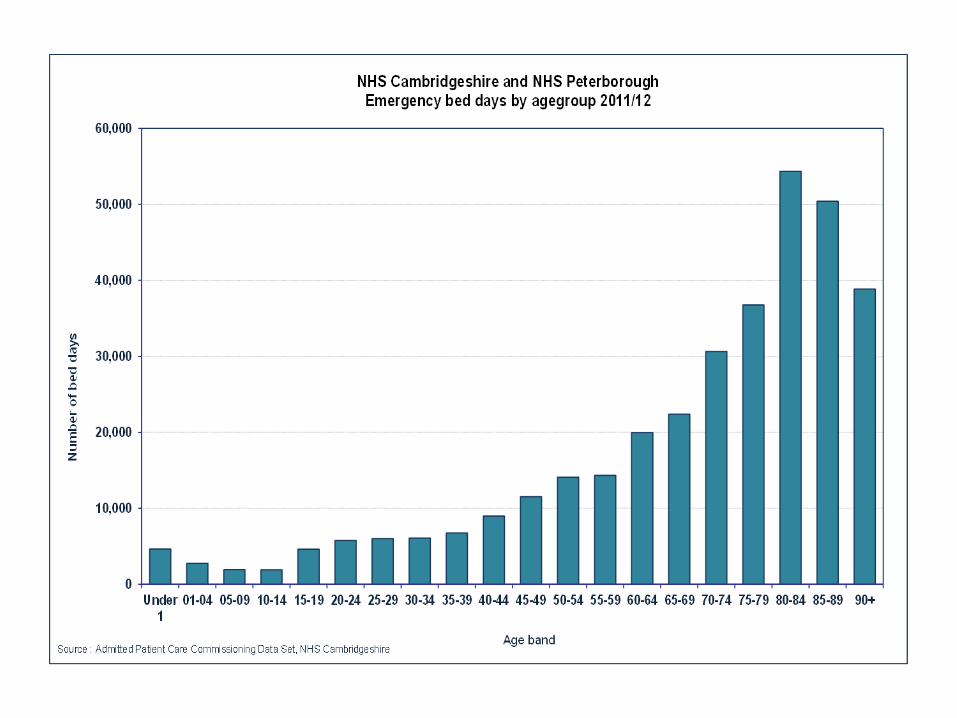
Changing demographics
0
5,000
10,000
15,000
20,000
25,000
30,000
35,000
40,000
45,000
50,000
18-24 25-34 35-44 45-54 55-64 65-74 75+
Nu
mb
er
of
pe
op
le
1 longstanding illness 2 3 4 or more
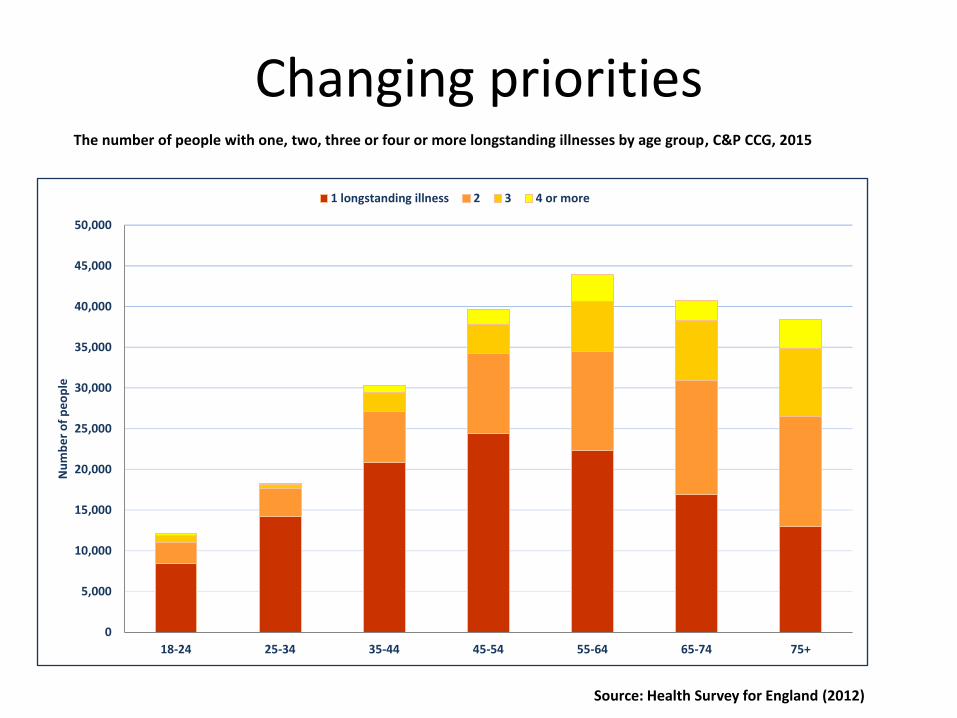
Source: Health Survey for England (2012)
The number of people with one, two, three or four or more longstanding illnesses by age group, C&P CCG, 2015
Changing priorities
Changing systems
• New solutions to meet changing needs
• Opportunities
• System redesign - new structures
• Focus on healthy ageing and prevention
Aims of the day
• Develop a system-wide Agenda for Healthy Ageing and Prevention across Cambridgeshire and Peterborough
• Commitment to embed preventative principles and healthy ageing vision across our organisations
Current position
Dr Angelique Mavrodaris
Consultant in Public Health Medicine
Cambridgeshire & Peterborough
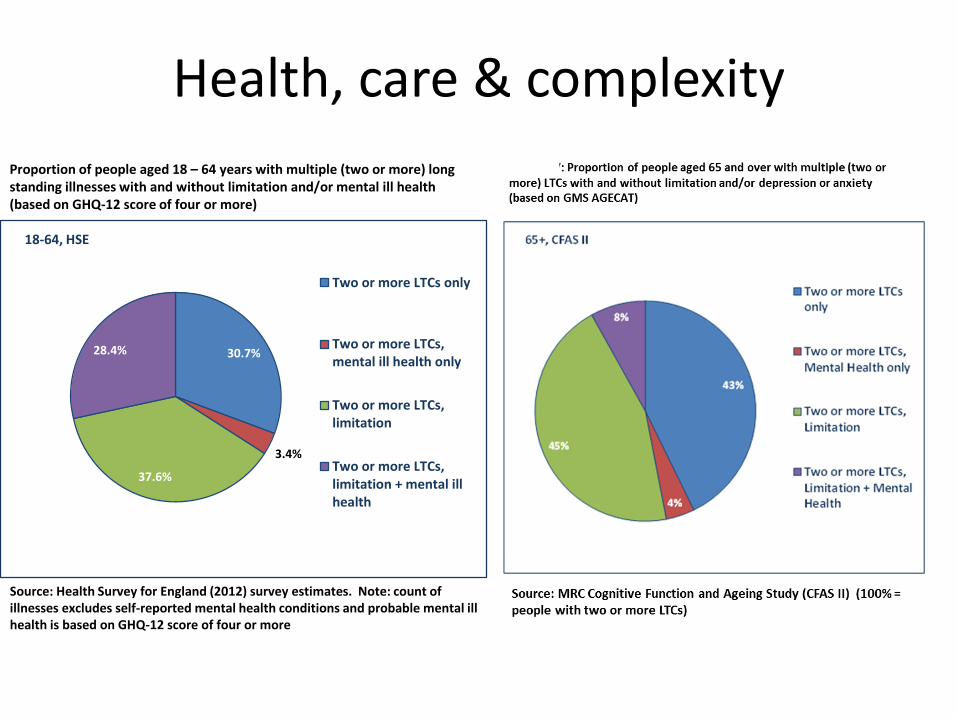
30.7%
3.4%
37.6%
28.4%
18-64, HSE
Two or more LTCs only
Two or more LTCs,mental ill health only
Two or more LTCs,limitation
Two or more LTCs,limitation + mental illhealth
Source: Health Survey for England (2012) survey estimates. Note: count of illnesses excludes self-reported mental health conditions and probable mental ill health is based on GHQ-12 score of four or more
Proportion of people aged 18 – 64 years with multiple (two or more) long standing illnesses with and without limitation and/or mental ill health (based on GHQ-12 score of four or more)
Health, care & complexity
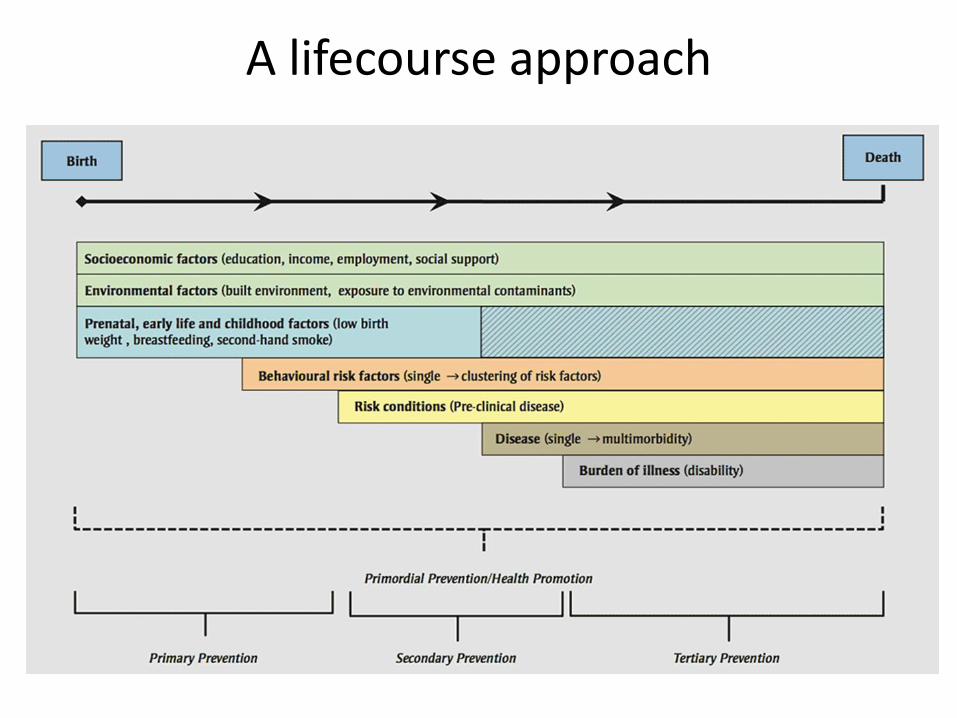
A lifecourse approach
CC
G O
utco
me
s Frame
wo
rk Do
main
1
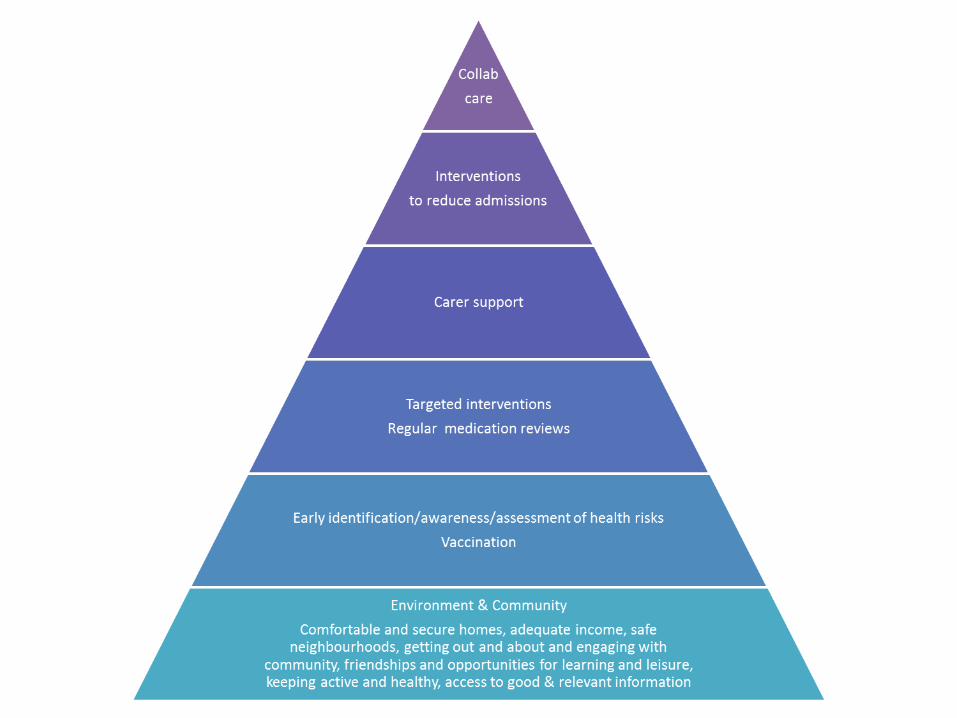
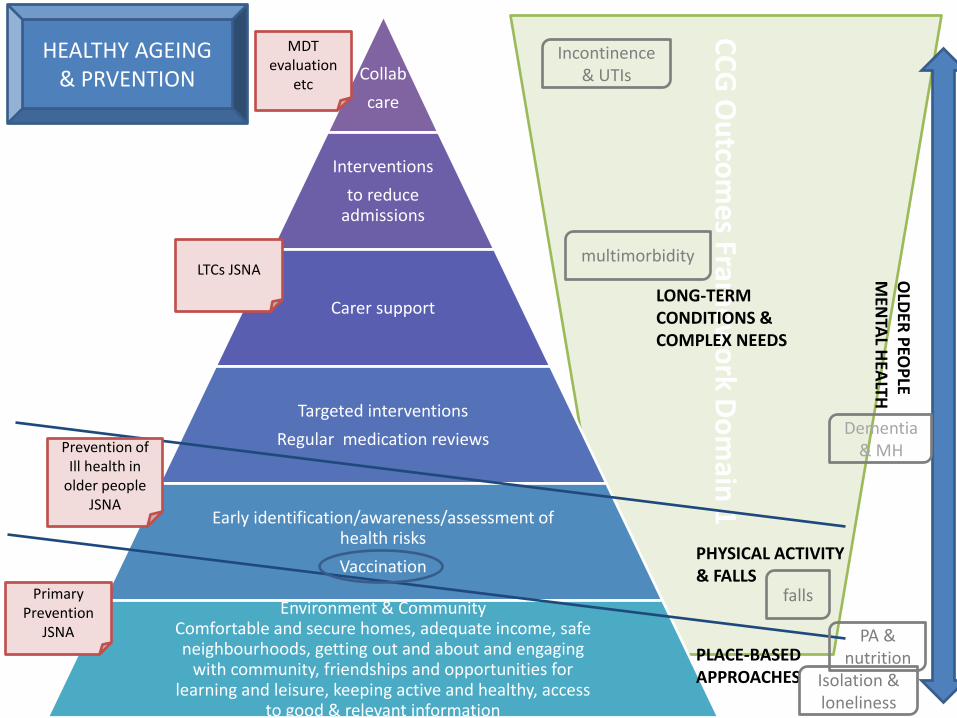
Collab
care
Interventions
to reduce admissions
Carer support
Targeted interventions
Regular medication reviews
Early identification/awareness/assessment of health risks
Vaccination
Environment & Community Comfortable and secure homes, adequate income, safe neighbourhoods, getting out and about and engaging
with community, friendships and opportunities for learning and leisure, keeping active and healthy, access
to good & relevant information
PLACE-BASED APPROACHES
LTCs JSNA
Prevention of Ill health in
older people JSNA
Primary Prevention
JSNA
PHYSICAL ACTIVITY & FALLS
LONG-TERM CONDITIONS & COMPLEX NEEDS
OLD
ER P
EOP
LE M
ENTA
L HEA
LTH
MDT evaluation
etc
HEALTHY AGEING & PRVENTION
Incontinence & UTIs
Dementia & MH
falls
Isolation & loneliness
PA & nutrition
multimorbidity
SESSION 1: HEALTHY AGEING – Are we seeing the Bigger Picture?
30 Wasted Years
Professor Ian Philp CBE
Cambridgeshire Summit on Preventive Care for Older People
25th November 2015
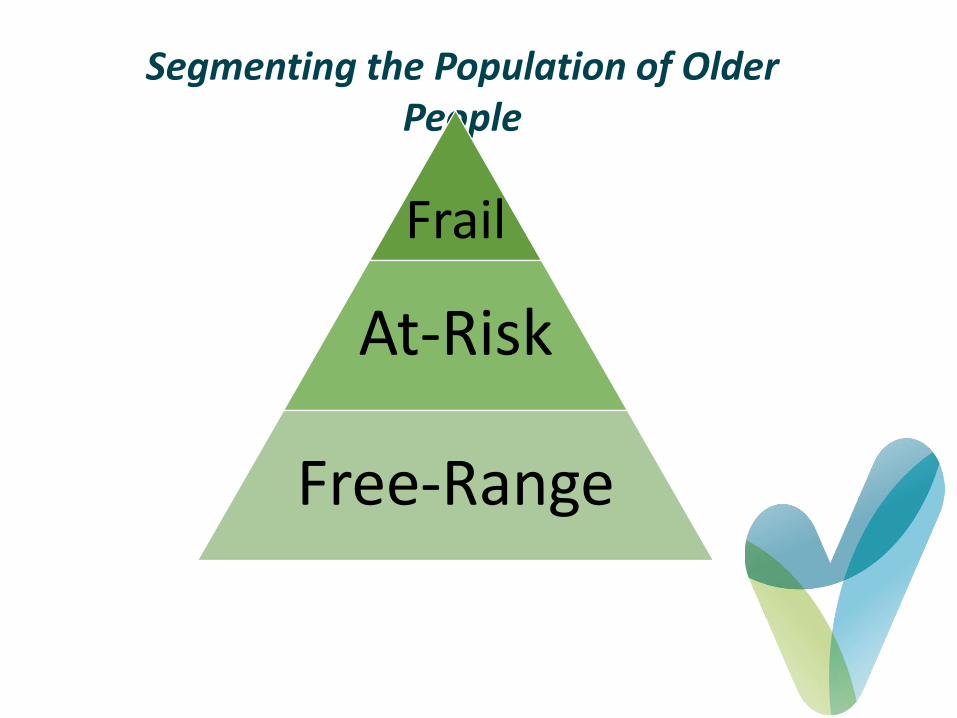
Segmenting the Population of Older People
Frail
At-Risk
Free-Range
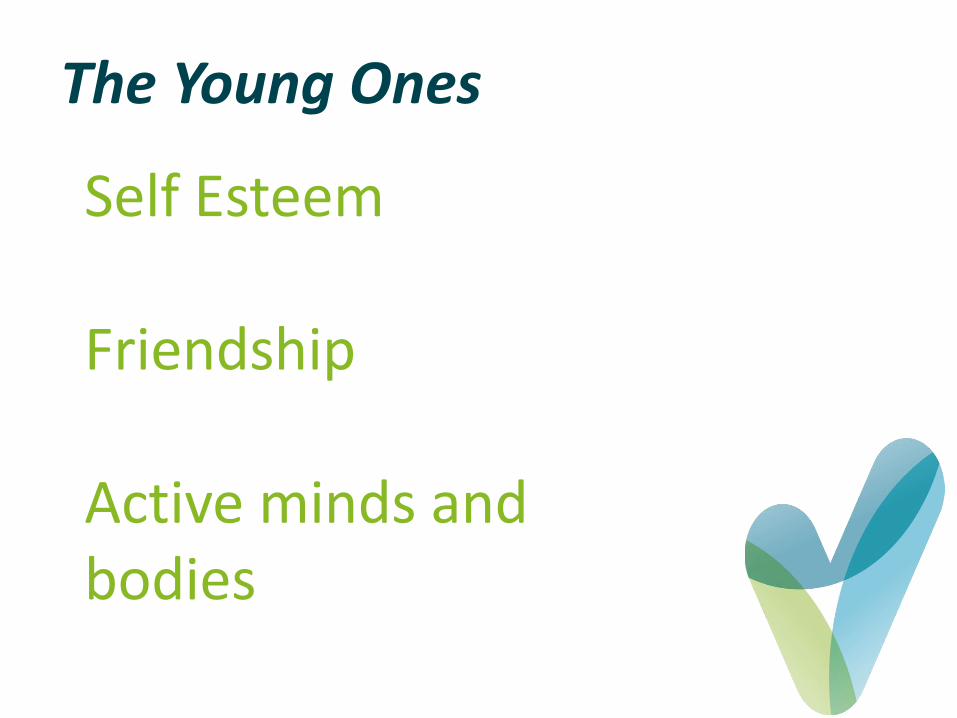
The Young Ones
Self Esteem Friendship Active minds and bodies
Preventive care
EASYCareHealth:
25 Years,
44 Countries,
80 Publications
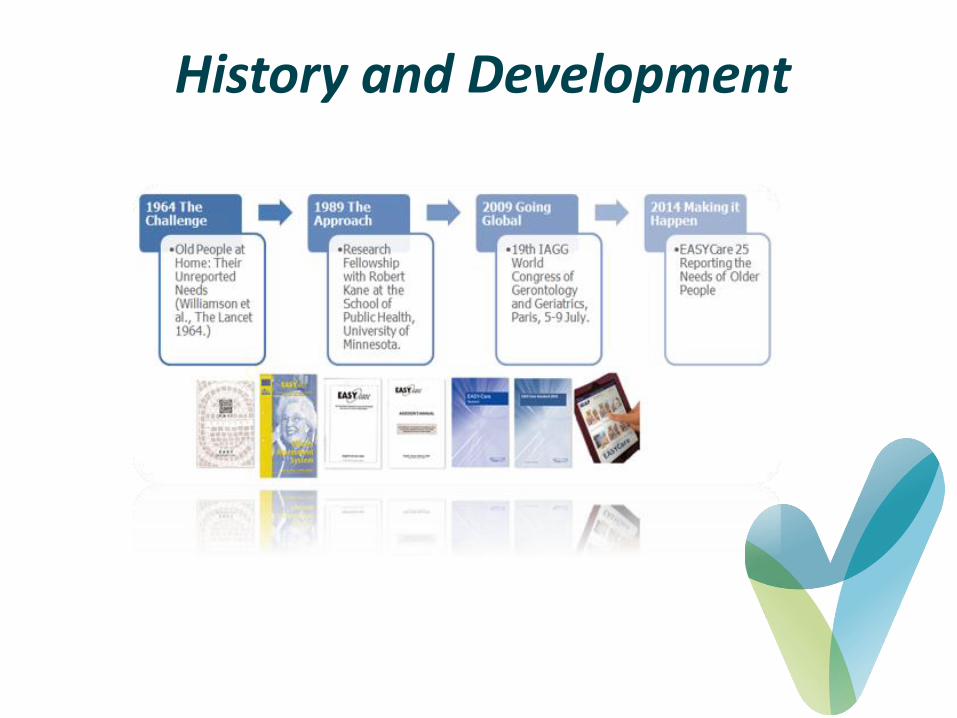
History and Development
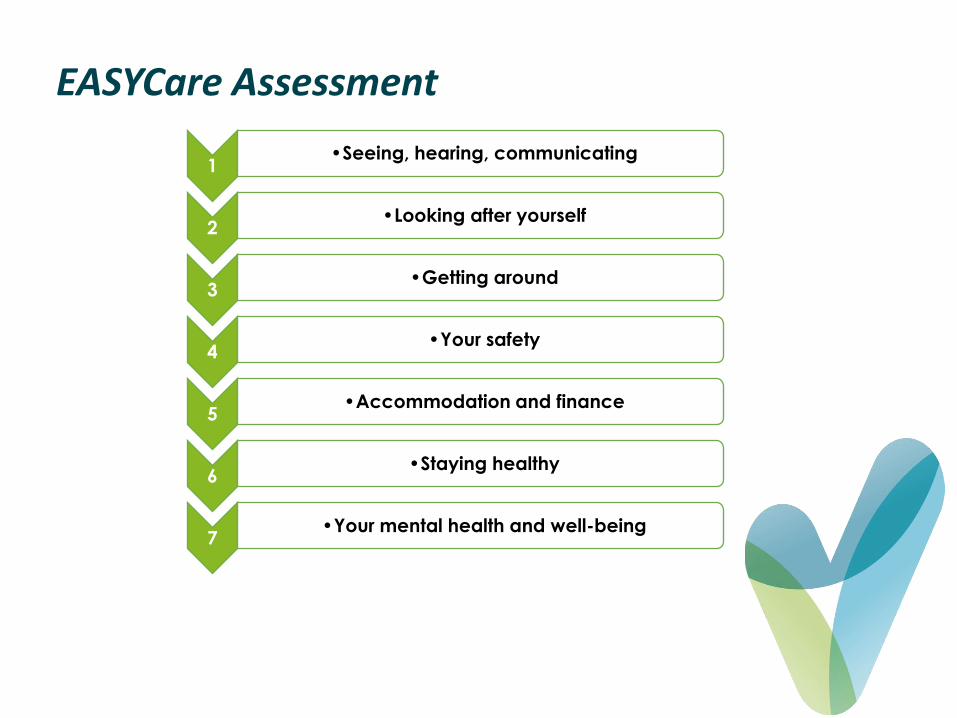
EASYCare Assessment
1 •Seeing, hearing, communicating
2 •Looking after yourself
3 •Getting around
4 •Your safety
5 •Accommodation and finance
6 •Staying healthy
7 •Your mental health and well-being
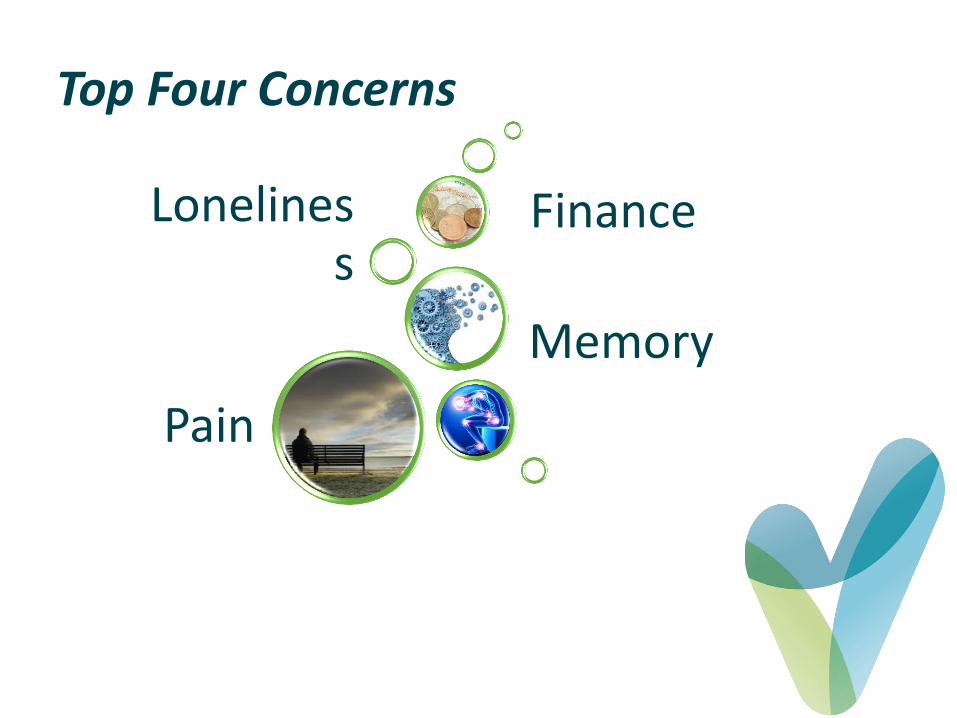
Top Four Concerns
Loneliness
Finance
Memory
Pain
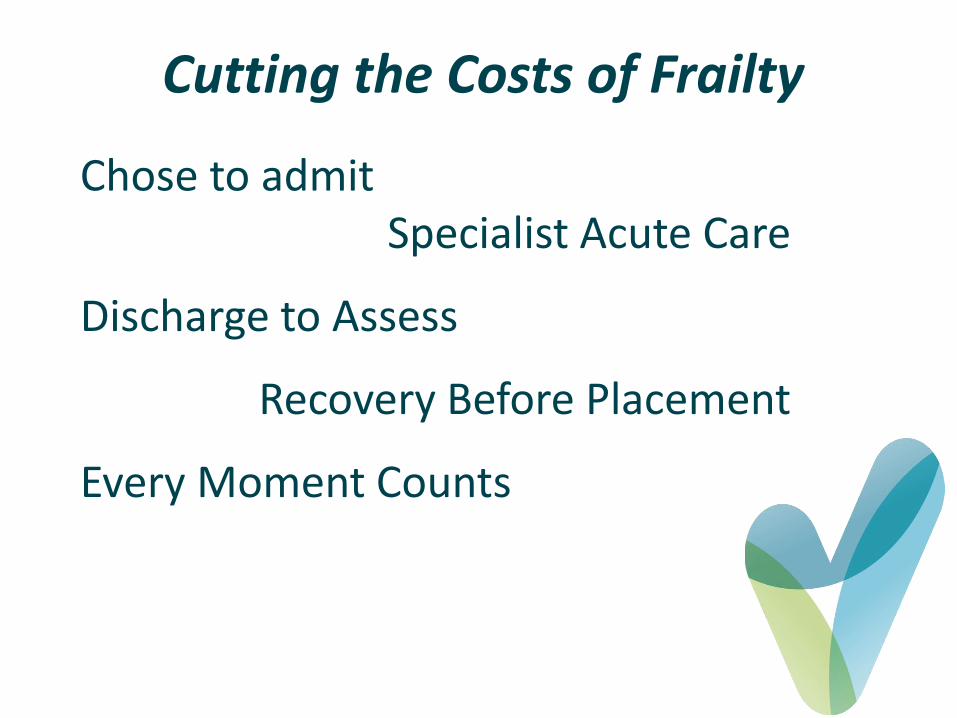
Cutting the Costs of Frailty
Chose to admit Specialist Acute Care
Discharge to Assess
Recovery Before Placement
Every Moment Counts

www.easycarehealth.org.uk
Healthy Ageing – are we seeing the bigger picture?
Carol Brayne
Cambridge Institute of Public Health
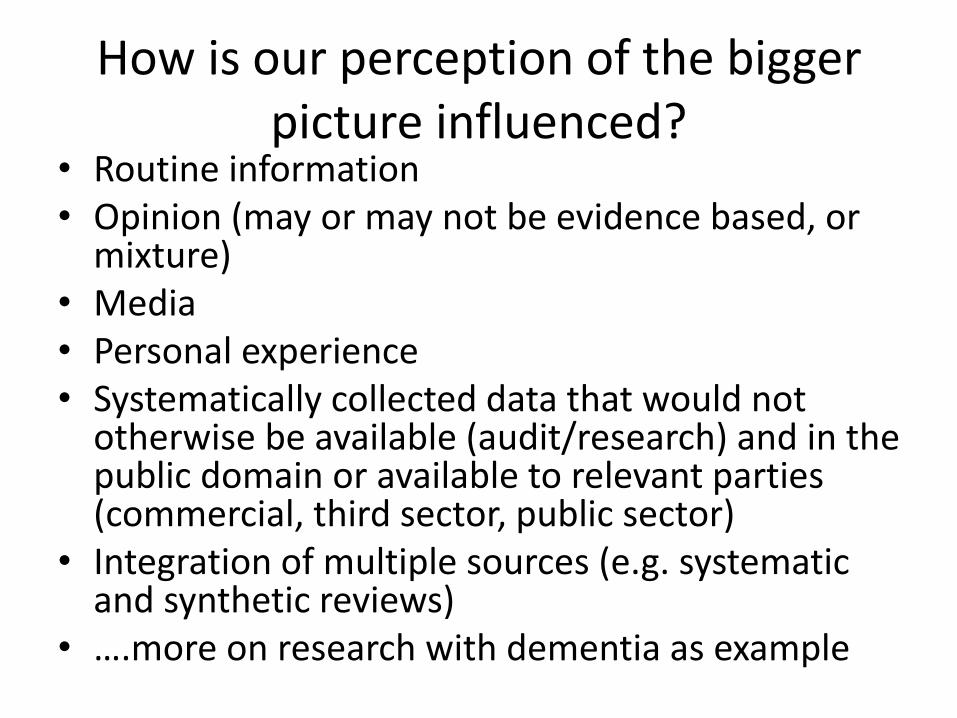
How is our perception of the bigger picture influenced?
• Routine information • Opinion (may or may not be evidence based, or
mixture) • Media • Personal experience • Systematically collected data that would not
otherwise be available (audit/research) and in the public domain or available to relevant parties (commercial, third sector, public sector)
• Integration of multiple sources (e.g. systematic and synthetic reviews)
• ….more on research with dementia as example
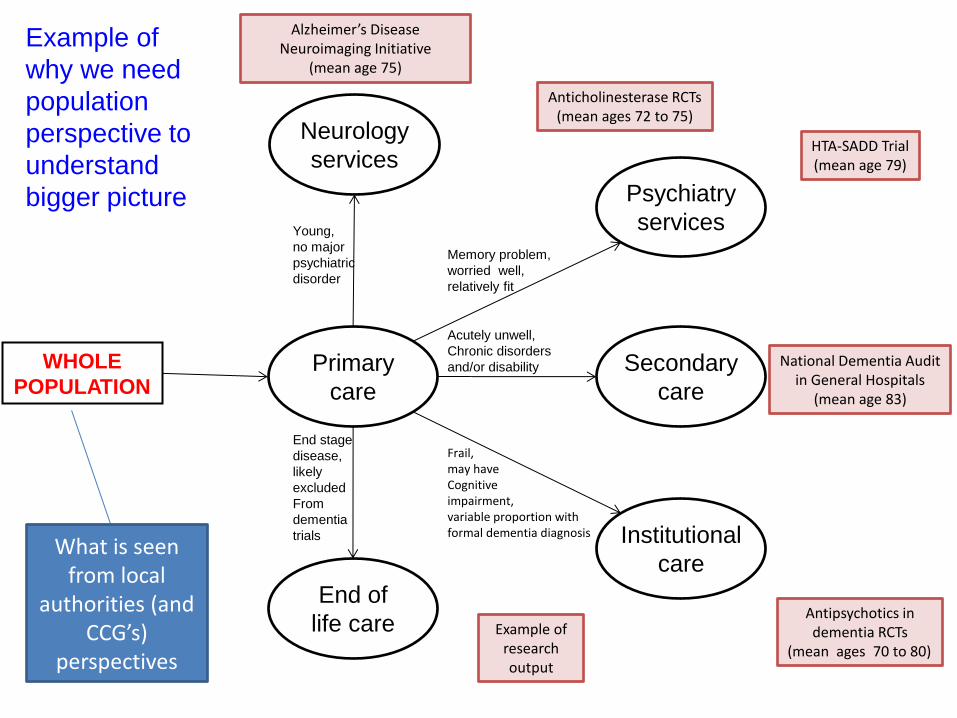
WHOLE
POPULATION Primary
care
Psychiatry
services
Institutional
care
Neurology
services
End of
life care
Secondary
care
Young,
no major
psychiatric
disorder
Memory problem,
worried well,
relatively fit
Acutely unwell,
Chronic disorders
and/or disability
Frail, may have Cognitive impairment, variable proportion with formal dementia diagnosis
End stage
disease,
likely
excluded
From
dementia
trials
Anticholinesterase RCTs (mean ages 72 to 75)
Antipsychotics in dementia RCTs
(mean ages 70 to 80)
National Dementia Audit in General Hospitals
(mean age 83)
Alzheimer’s Disease Neuroimaging Initiative
(mean age 75)
HTA-SADD Trial (mean age 79)
Example of research output
Example of
why we need
population
perspective to
understand
bigger picture
What is seen from local
authorities (and CCG’s)
perspectives
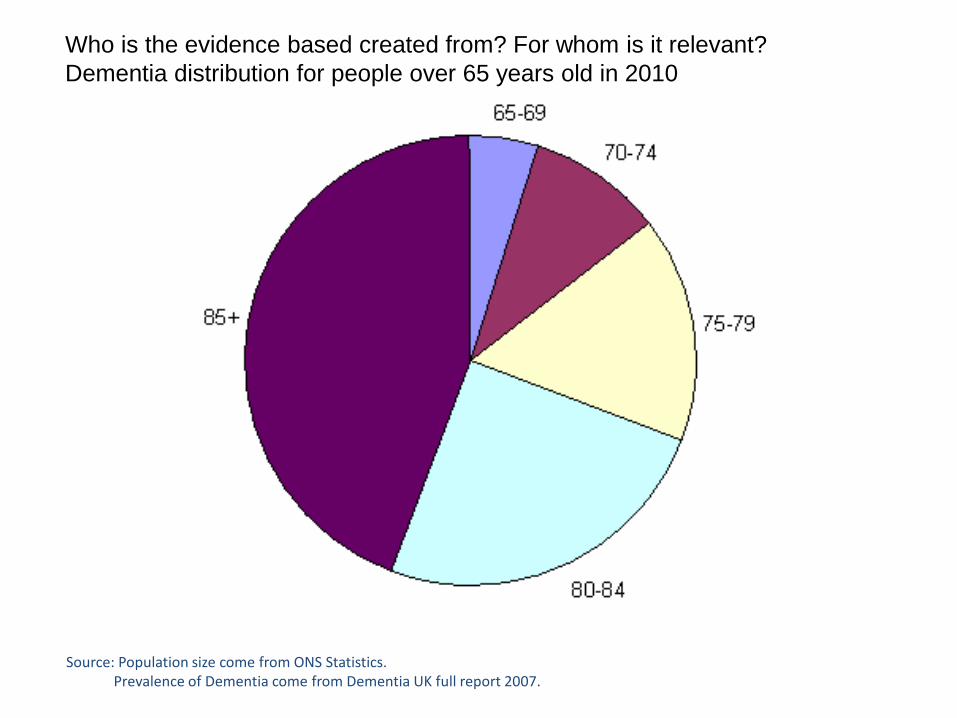
Who is the evidence based created from? For whom is it relevant?
Dementia distribution for people over 65 years old in 2010
Source: Population size come from ONS Statistics. Prevalence of Dementia come from Dementia UK full report 2007.
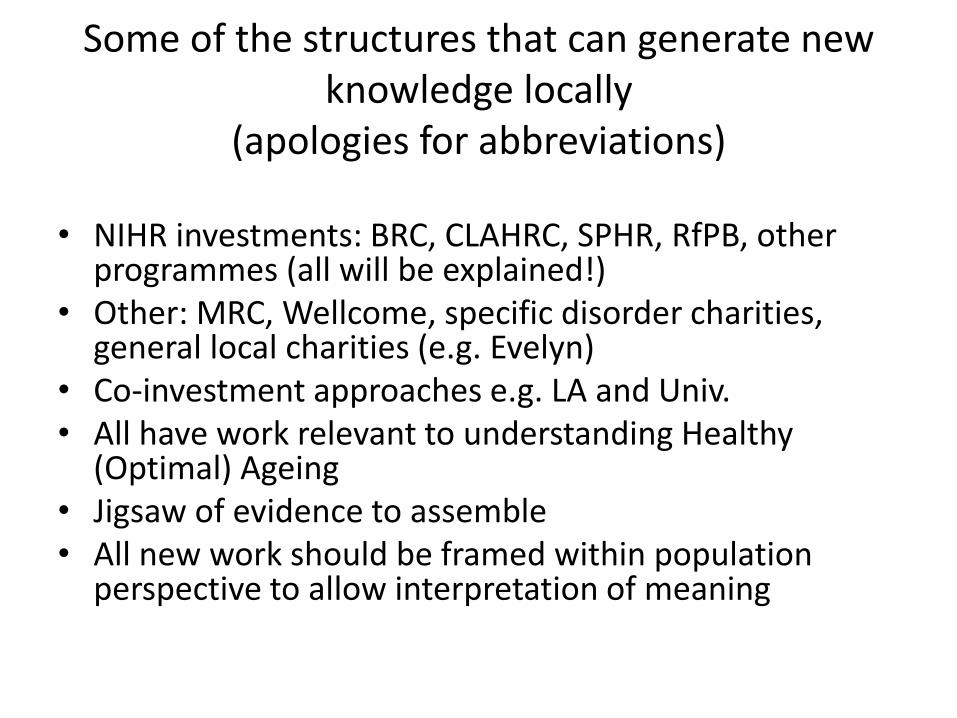
Some of the structures that can generate new knowledge locally
(apologies for abbreviations)
• NIHR investments: BRC, CLAHRC, SPHR, RfPB, other programmes (all will be explained!)
• Other: MRC, Wellcome, specific disorder charities, general local charities (e.g. Evelyn)
• Co-investment approaches e.g. LA and Univ. • All have work relevant to understanding Healthy
(Optimal) Ageing • Jigsaw of evidence to assemble • All new work should be framed within population
perspective to allow interpretation of meaning
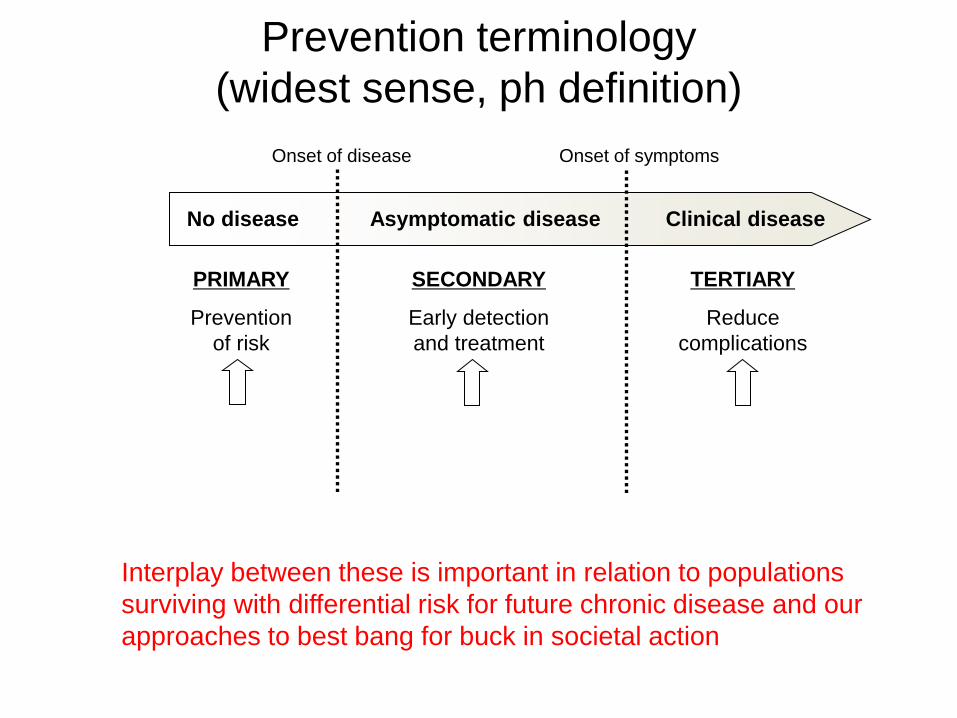
No disease Asymptomatic disease Clinical disease
PRIMARY
Prevention
of risk
SECONDARY
Early detection
and treatment
TERTIARY
Reduce
complications
Onset of disease Onset of symptoms
Prevention terminology
(widest sense, ph definition)
Interplay between these is important in relation to populations
surviving with differential risk for future chronic disease and our
approaches to best bang for buck in societal action
What do we know from locally led work on Health Ageing?
• Population based work: general mid life to older populations
• EPIC Norfolk and the Cognitive Function and Ageing Studies
• Evidence reviews
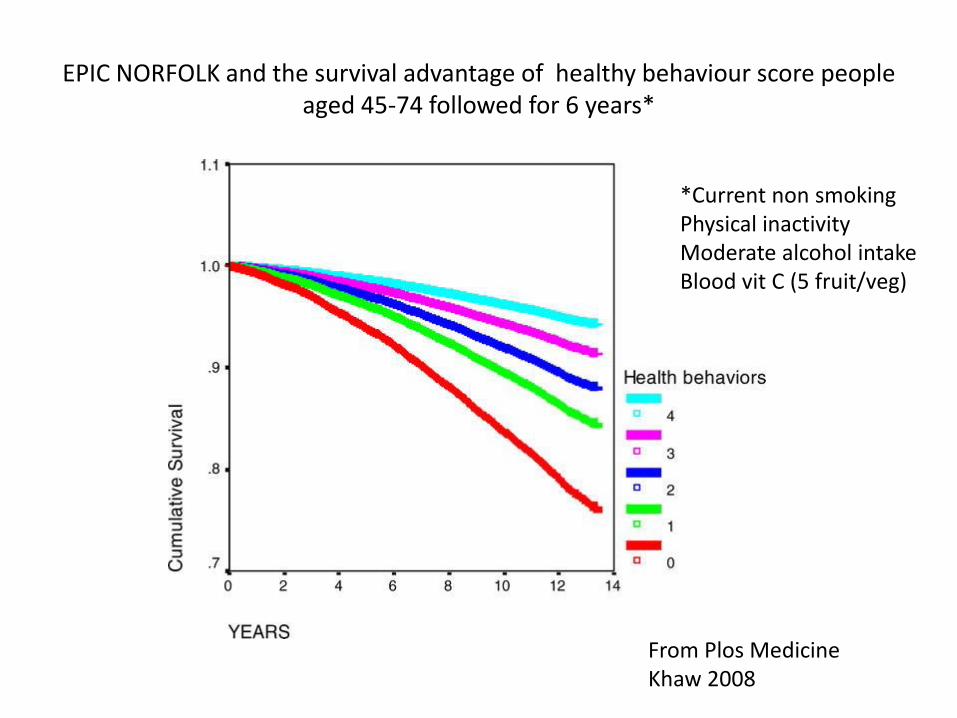
EPIC NORFOLK and the survival advantage of healthy behaviour score people aged 45-74 followed for 6 years*
From Plos Medicine Khaw 2008
*Current non smoking Physical inactivity Moderate alcohol intake Blood vit C (5 fruit/veg)
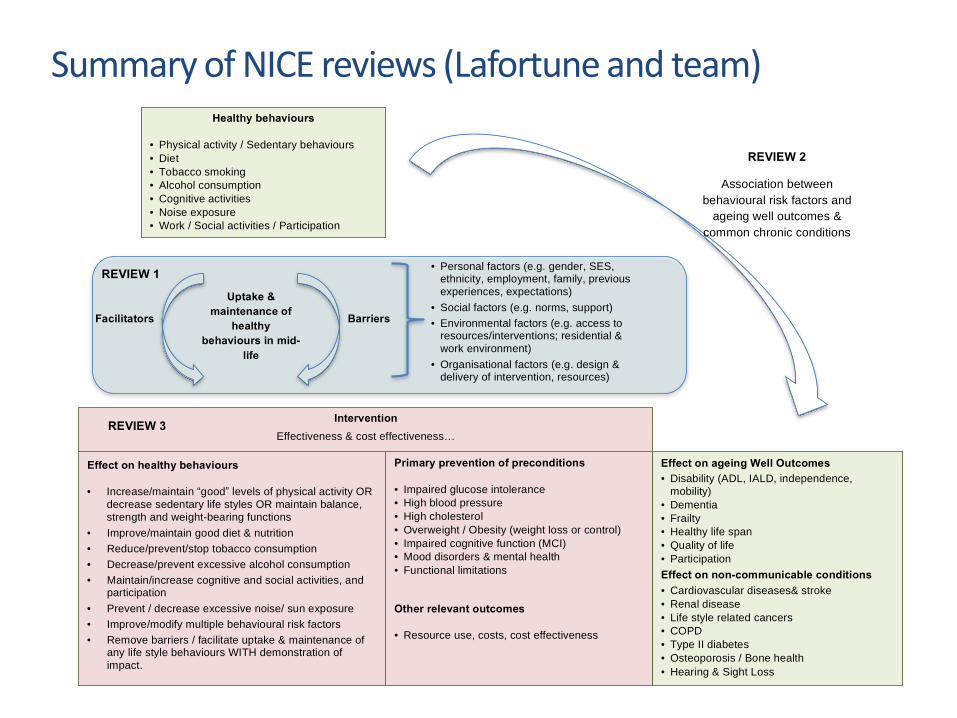
Healthy behaviours
· Physical activity / Sedentary behaviours
· Diet
· Tobacco smoking
· Alcohol consumption
· Cognitive activities
· Noise exposure
· Work / Social activities / Participation
REVIEW 1
Uptake &
maintenance of
healthy
behaviours in mid-
life
Barriers Facilitators
· Personal factors (e.g. gender, SES, ethnicity, employment, family, previous
experiences, expectations)
· Social factors (e.g. norms, support)
· Environmental factors (e.g. access to resources/interventions; residential &
work environment)
· Organisational factors (e.g. design & delivery of intervention, resources)
REVIEW 2
Association between
behavioural risk factors and
ageing well outcomes &
common chronic conditions
Effect on ageing Well Outcomes
· Disability (ADL, IALD, independence,
mobility)
· Dementia
· Frailty
· Healthy life span
· Quality of life
· Participation
Effect on non-communicable conditions
· Cardiovascular diseases& stroke
· Renal disease
· Life style related cancers
· COPD
· Type II diabetes
· Osteoporosis / Bone health
· Hearing & Sight Loss
Primary prevention of preconditions
· Impaired glucose intolerance
· High blood pressure
· High cholesterol
· Overweight / Obesity (weight loss or control)
· Impaired cognitive function (MCI)
· Mood disorders & mental health
· Functional limitations
Other relevant outcomes
· Resource use, costs, cost effectiveness
Effect on healthy behaviours
· Increase/maintain “good” levels of physical activity OR
decrease sedentary life styles OR maintain balance, strength and weight-bearing functions
· Improve/maintain good diet & nutrition
· Reduce/prevent/stop tobacco consumption
· Decrease/prevent excessive alcohol consumption
· Maintain/increase cognitive and social activities, and participation
· Prevent / decrease excessive noise/ sun exposure
· Improve/modify multiple behavioural risk factors
· Remove barriers / facilitate uptake & maintenance of any life style behaviours WITH demonstration of
impact.
Intervention
Effectiveness & cost effectiveness…
REVIEW 3
Summary of NICE reviews (Lafortune and team)
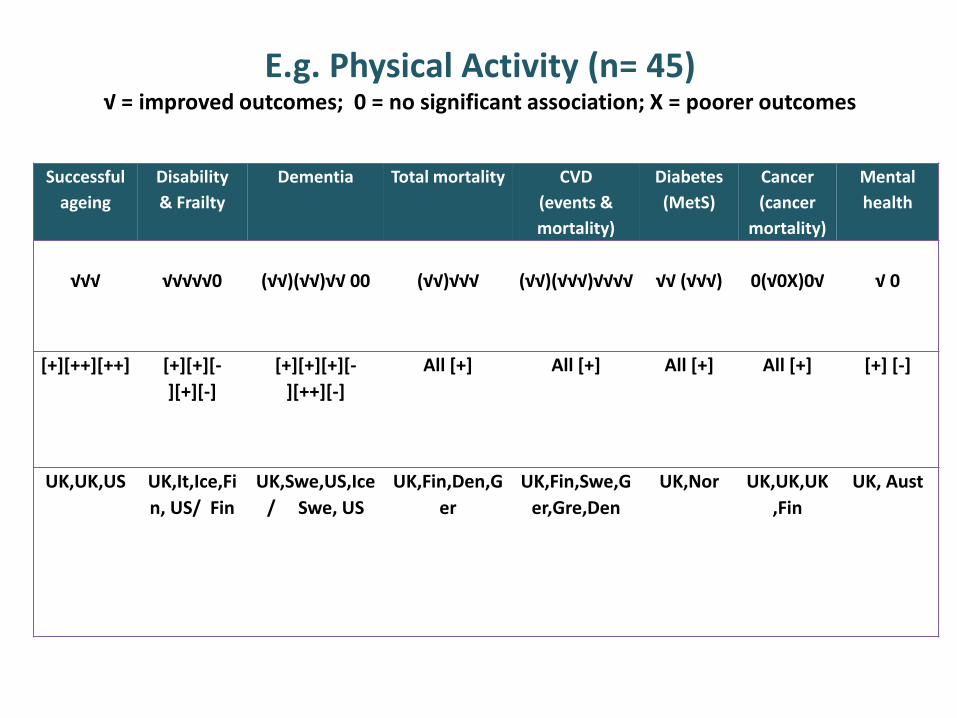
E.g. Physical Activity (n= 45) √ = improved outcomes; 0 = no significant association; X = poorer outcomes
Successful
ageing
Disability
& Frailty
Dementia Total mortality CVD
(events &
mortality)
Diabetes
(MetS)
Cancer
(cancer
mortality)
Mental
health
√√√
√√√√√0
(√√)(√√)√√ 00
(√√)√√√
(√√)(√√√)√√√√
√√ (√√√)
0(√0X)0√
√ 0
[+][++][++]
[+][+][-
][+][-]
[+][+][+][-
][++][-]
All [+]
All [+]
All [+]
All [+]
[+] [-]
UK,UK,US
UK,It,Ice,Fi
n, US/ Fin
UK,Swe,US,Ice
/ Swe, US
UK,Fin,Den,G
er
UK,Fin,Swe,G
er,Gre,Den
UK,Nor
UK,UK,UK
,Fin
UK, Aust
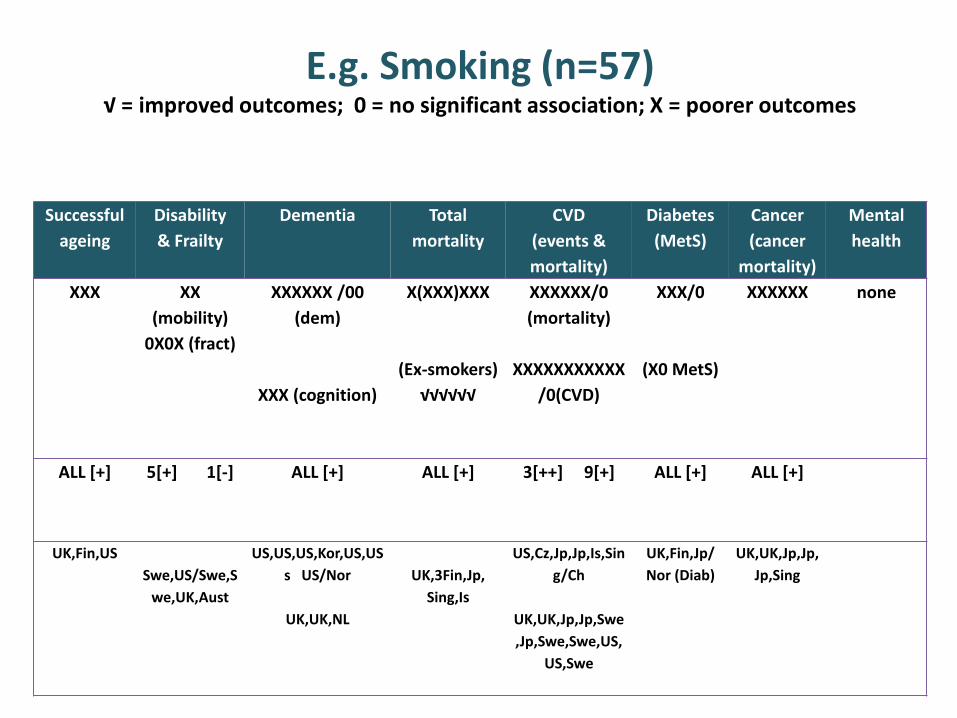
E.g. Smoking (n=57) √ = improved outcomes; 0 = no significant association; X = poorer outcomes
Successful
ageing
Disability
& Frailty
Dementia Total
mortality
CVD
(events &
mortality)
Diabetes
(MetS)
Cancer
(cancer
mortality)
Mental
health
XXX
XX
(mobility)
0X0X (fract)
XXXXXX /00
(dem)
XXX (cognition)
X(XXX)XXX
(Ex-smokers)
√√√√√√
XXXXXX/0
(mortality)
XXXXXXXXXXX
/0(CVD)
XXX/0
(X0 MetS)
XXXXXX
none
ALL [+]
5[+] 1[-]
ALL [+]
ALL [+]
3[++] 9[+]
ALL [+]
ALL [+]
UK,Fin,US
Swe,US/Swe,S
we,UK,Aust
US,US,US,Kor,US,US
s US/Nor
UK,UK,NL
UK,3Fin,Jp,
Sing,Is
US,Cz,Jp,Jp,Is,Sin
g/Ch
UK,UK,Jp,Jp,Swe
,Jp,Swe,Swe,US,
US,Swe
UK,Fin,Jp/
Nor (Diab)
UK,UK,Jp,Jp,
Jp,Sing
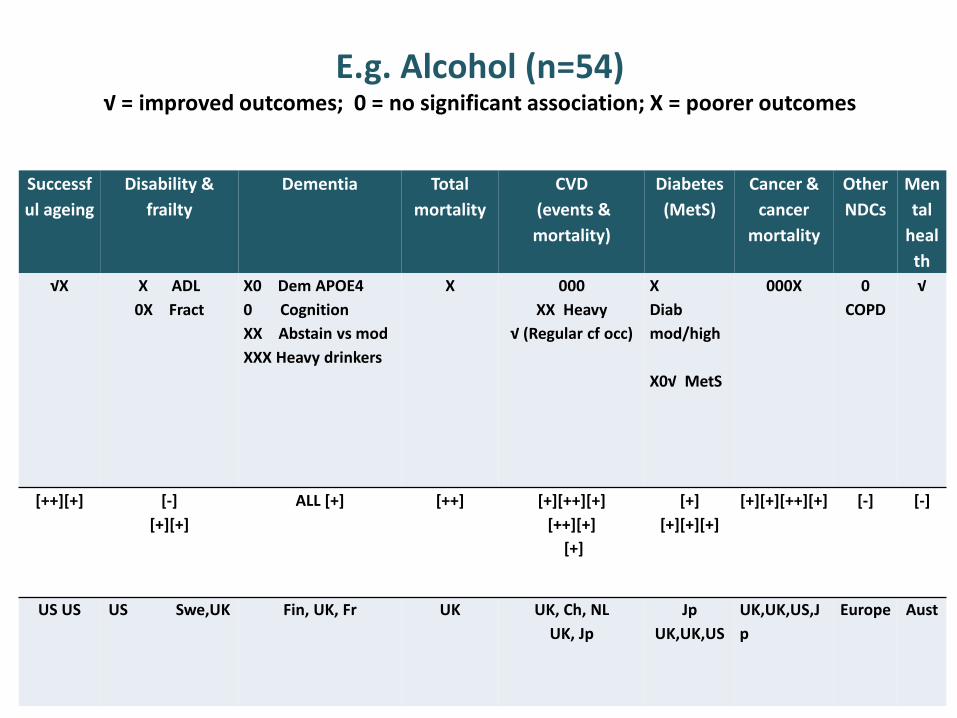
E.g. Alcohol (n=54) √ = improved outcomes; 0 = no significant association; X = poorer outcomes
Successf
ul ageing
Disability &
frailty
Dementia Total
mortality
CVD
(events &
mortality)
Diabetes
(MetS)
Cancer &
cancer
mortality
Other
NDCs
Men
tal
heal
th
√X
X ADL
0X Fract
X0 Dem APOE4
0 Cognition
XX Abstain vs mod
XXX Heavy drinkers
X
000
XX Heavy
√ (Regular cf occ)
X
Diab
mod/high
X0√ MetS
000X
0
COPD
√
[++][+]
[-]
[+][+]
ALL [+] [++]
[+][++][+]
[++][+]
[+]
[+]
[+][+][+]
[+][+][++][+]
[-]
[-]
US US
US Swe,UK
Fin, UK, Fr
UK UK, Ch, NL
UK, Jp
Jp
UK,UK,US
UK,UK,US,J
p
Europe
Aust
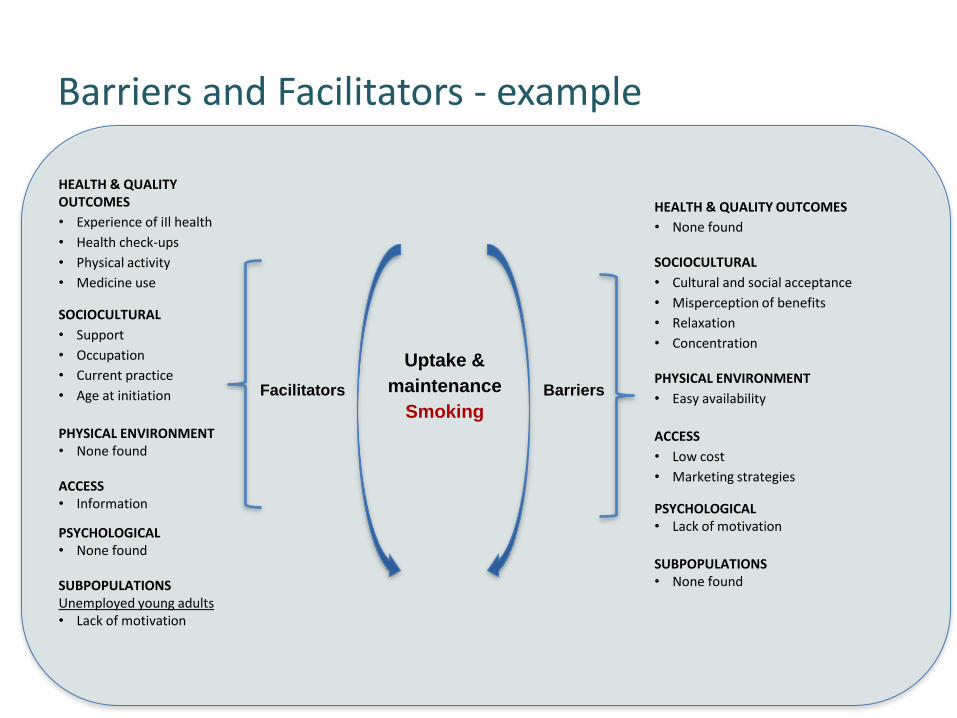
Barriers and Facilitators - example
Uptake &
maintenance
Smoking
Barriers Facilitators
HEALTH & QUALITY OUTCOMES
• Experience of iIl health
• Health check-ups
• Physical activity
• Medicine use
SOCIOCULTURAL
• Support
• Occupation
• Current practice
• Age at initiation
PHYSICAL ENVIRONMENT • None found ACCESS • Information
PSYCHOLOGICAL • None found SUBPOPULATIONS Unemployed young adults • Lack of motivation
HEALTH & QUALITY OUTCOMES
• None found SOCIOCULTURAL
• Cultural and social acceptance
• Misperception of benefits
• Relaxation
• Concentration
PHYSICAL ENVIRONMENT
• Easy availability
ACCESS
• Low cost
• Marketing strategies
PSYCHOLOGICAL • Lack of motivation
SUBPOPULATIONS • None found
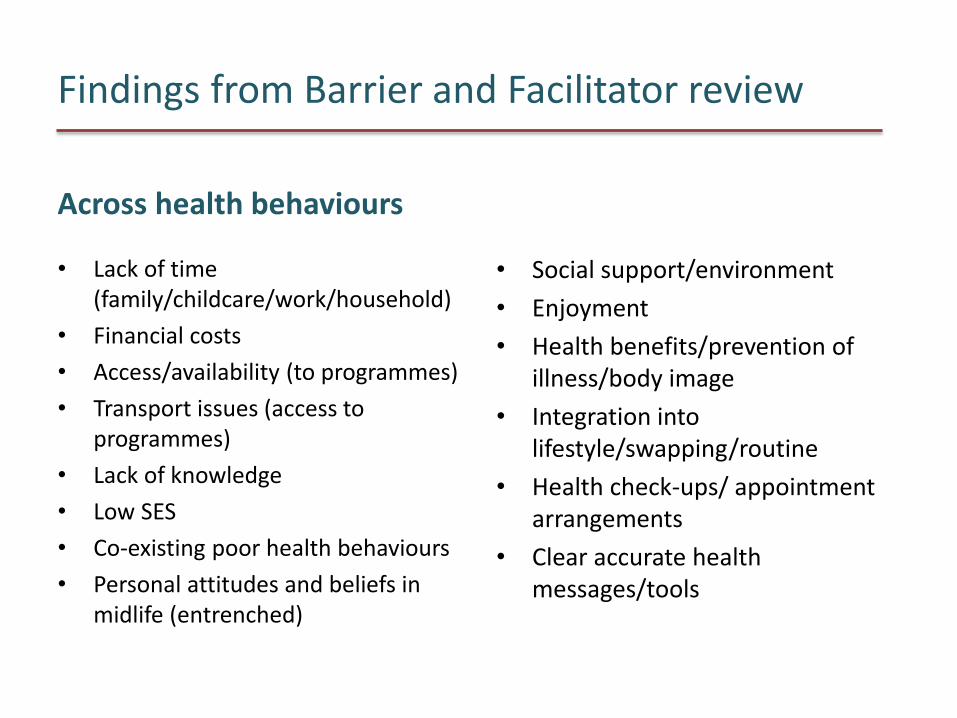
Findings from Barrier and Facilitator review
Across health behaviours
• Lack of time (family/childcare/work/household)
• Financial costs
• Access/availability (to programmes)
• Transport issues (access to programmes)
• Lack of knowledge
• Low SES
• Co-existing poor health behaviours
• Personal attitudes and beliefs in midlife (entrenched)
• Social support/environment
• Enjoyment
• Health benefits/prevention of illness/body image
• Integration into lifestyle/swapping/routine
• Health check-ups/ appointment arrangements
• Clear accurate health messages/tools
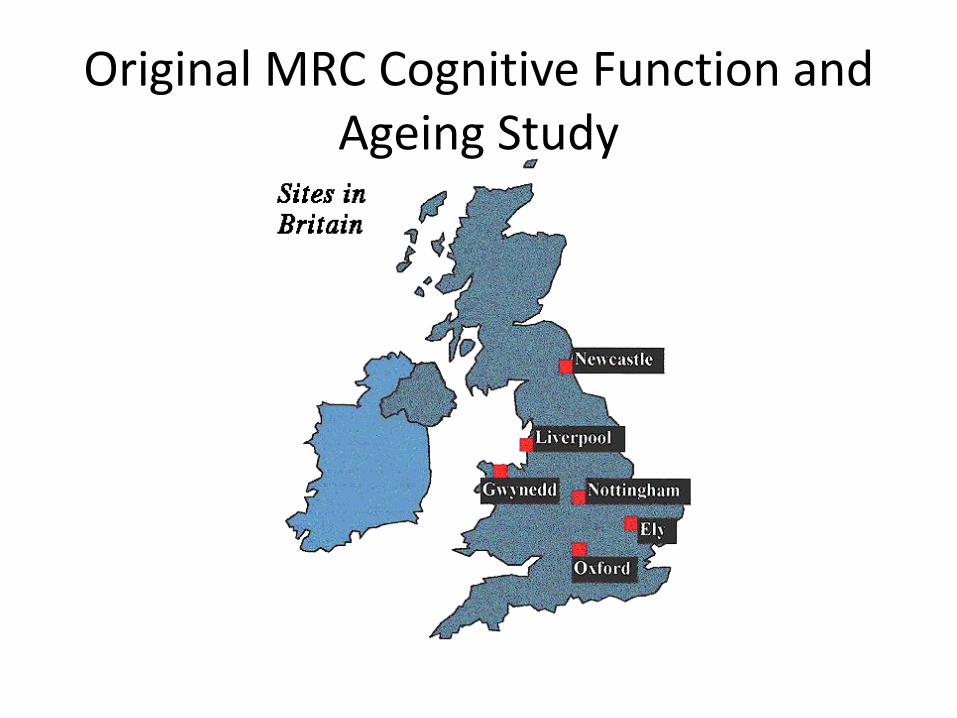
Original MRC Cognitive Function and Ageing Study
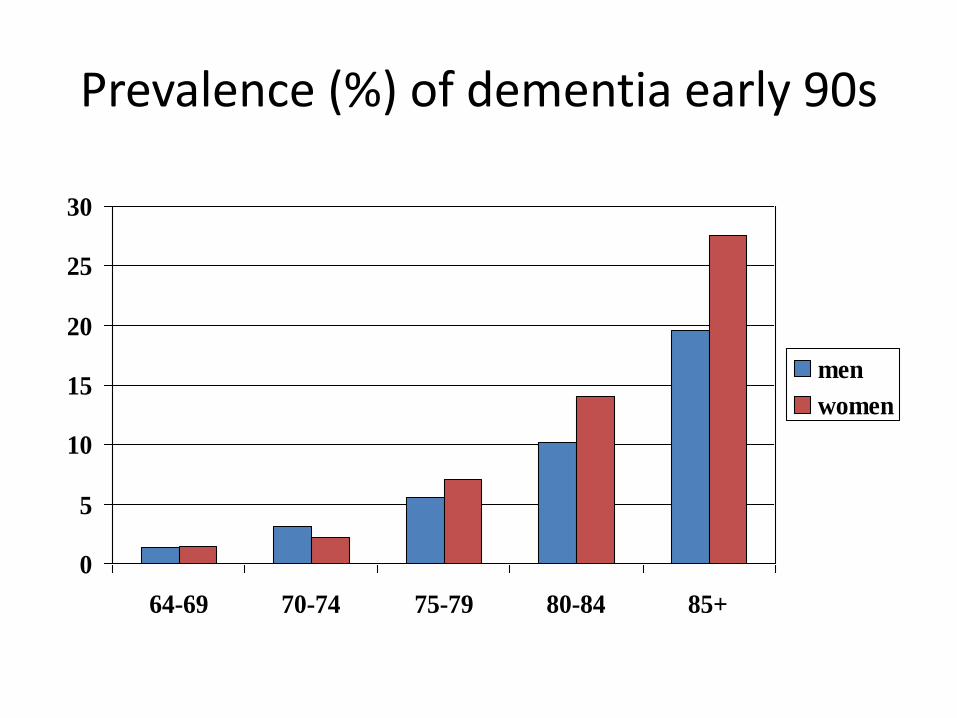
Prevalence (%) of dementia early 90s
0
5
10
15
20
25
30
64-69 70-74 75-79 80-84 85+
men
women
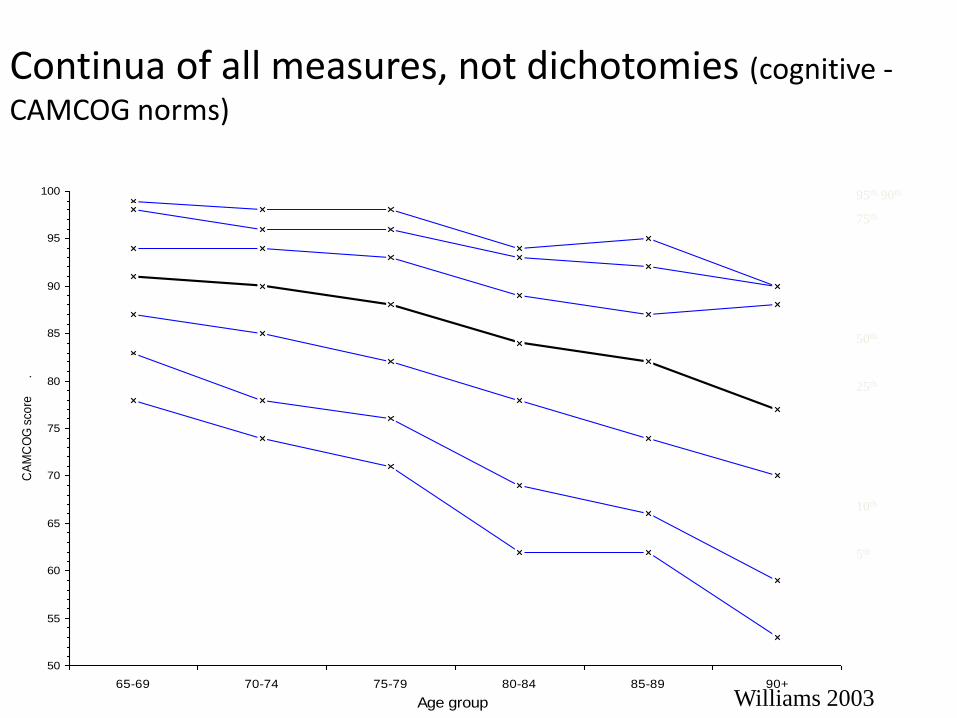
Continua of all measures, not dichotomies (cognitive -
CAMCOG norms)
50
55
60
65
70
75
80
85
90
95
100
65-69 70-74 75-79 80-84 85-89 90+
Age group
CA
MC
OG
sco
re
.
95th, 90th
75th
50th
25th
10th
5th
Williams 2003
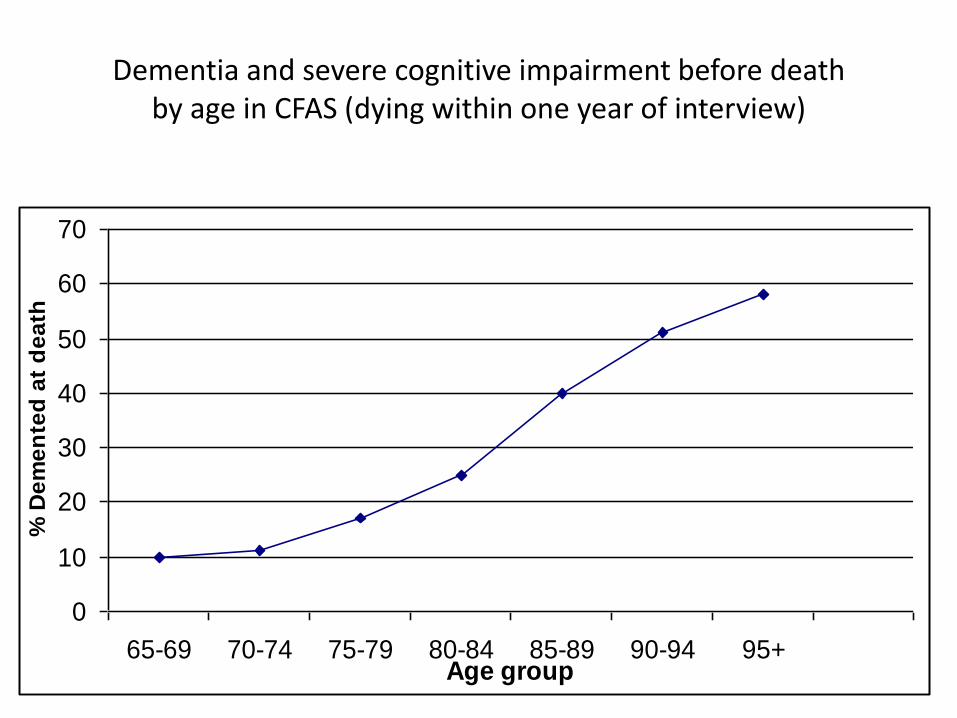
Dementia and severe cognitive impairment before death by age in CFAS (dying within one year of interview)
0
10
20
30
40
50
60
70
65-69 70-74 75-79 80-84 85-89 90-94 95+Age group
% D
em
en
ted
at
de
ath
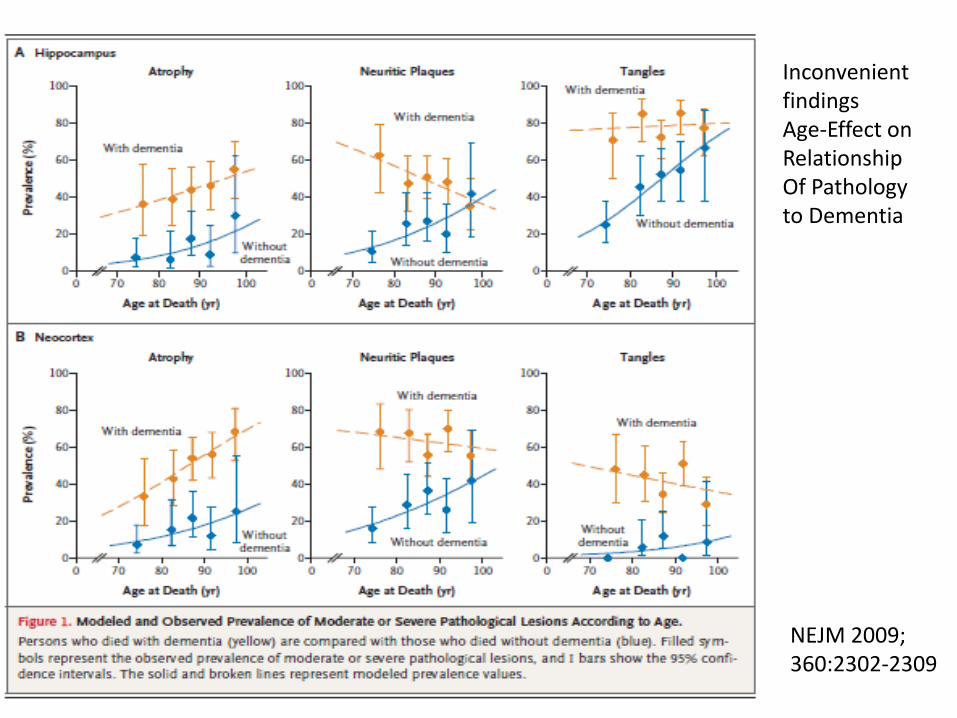
NEJM 2009; 360:2302-2309
Inconvenient findings Age-Effect on Relationship Of Pathology to Dementia
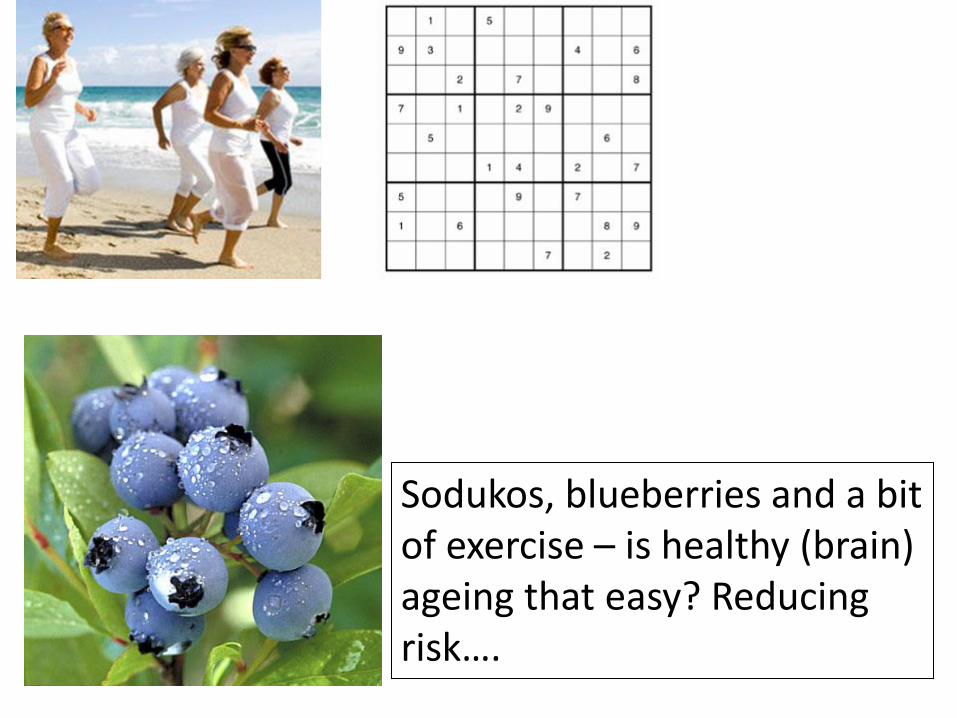
Sodukos, blueberries and a bit of exercise – is healthy (brain) ageing that easy? Reducing risk….
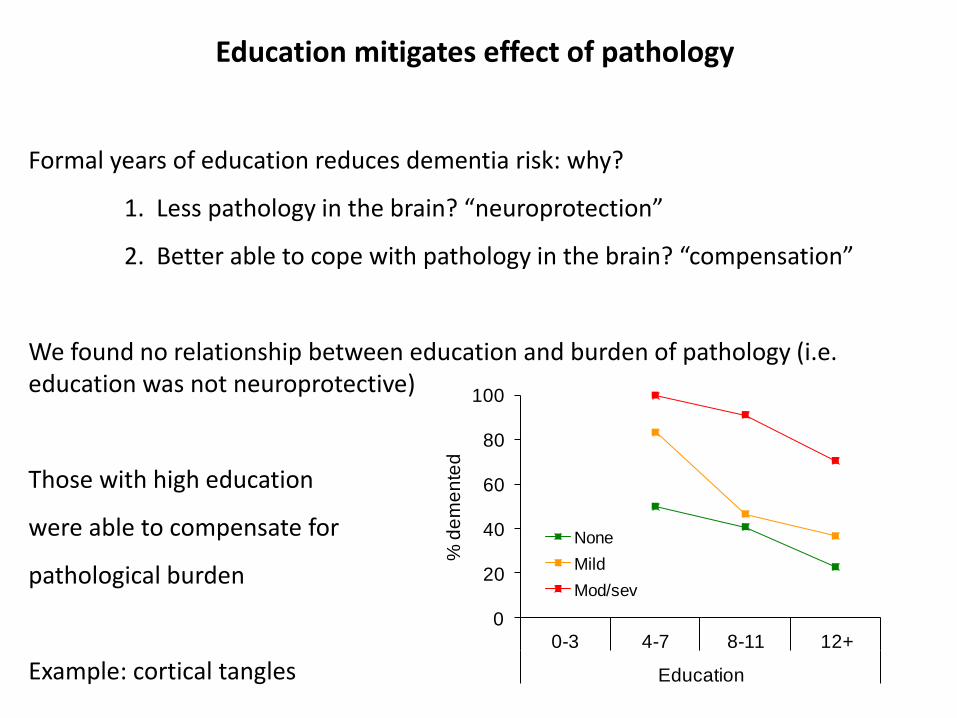
Education mitigates effect of pathology
Formal years of education reduces dementia risk: why?
1. Less pathology in the brain? “neuroprotection”
2. Better able to cope with pathology in the brain? “compensation”
We found no relationship between education and burden of pathology (i.e. education was not neuroprotective)
Those with high education
were able to compensate for
pathological burden
Example: cortical tangles
0
20
40
60
80
100
0-3 4-7 8-11 12+
Education
% d
em
en
ted
None
Mild
Mod/sev
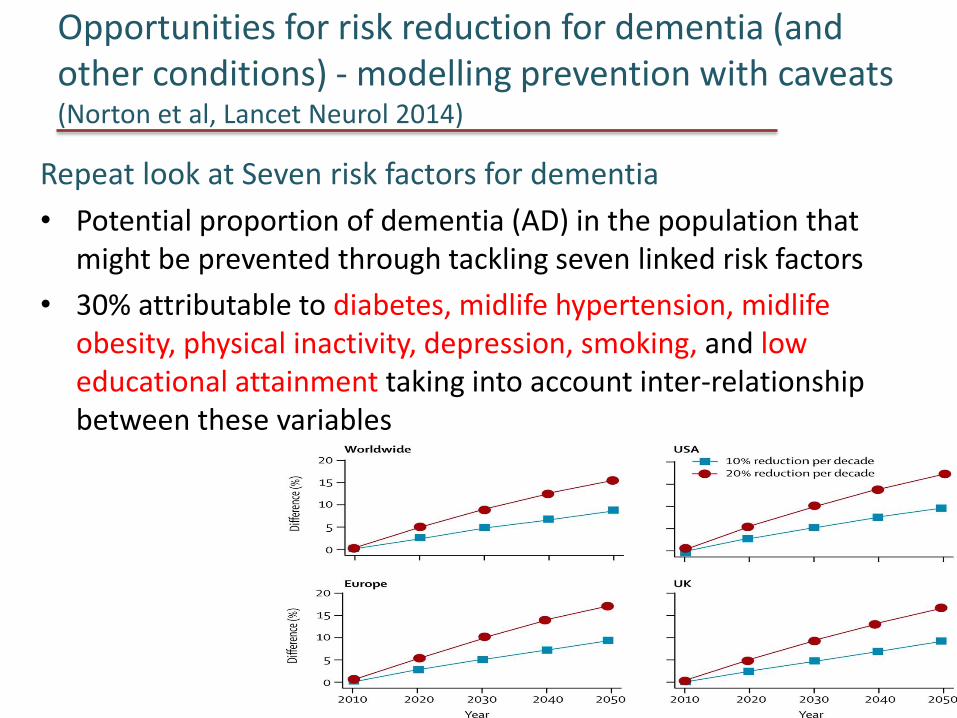
Opportunities for risk reduction for dementia (and other conditions) - modelling prevention with caveats (Norton et al, Lancet Neurol 2014)
Repeat look at Seven risk factors for dementia
• Potential proportion of dementia (AD) in the population that might be prevented through tackling seven linked risk factors
• 30% attributable to diabetes, midlife hypertension, midlife obesity, physical inactivity, depression, smoking, and low educational attainment taking into account inter-relationship between these variables
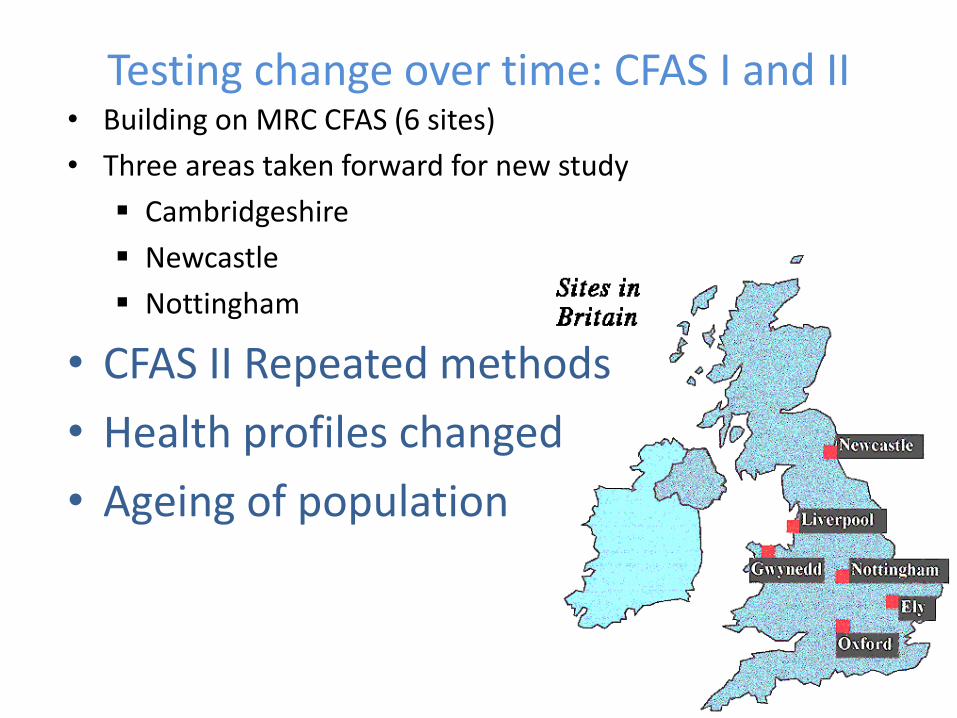
Testing change over time: CFAS I and II • Building on MRC CFAS (6 sites)
• Three areas taken forward for new study
Cambridgeshire
Newcastle
Nottingham
• CFAS II Repeated methods
• Health profiles changed
• Ageing of population
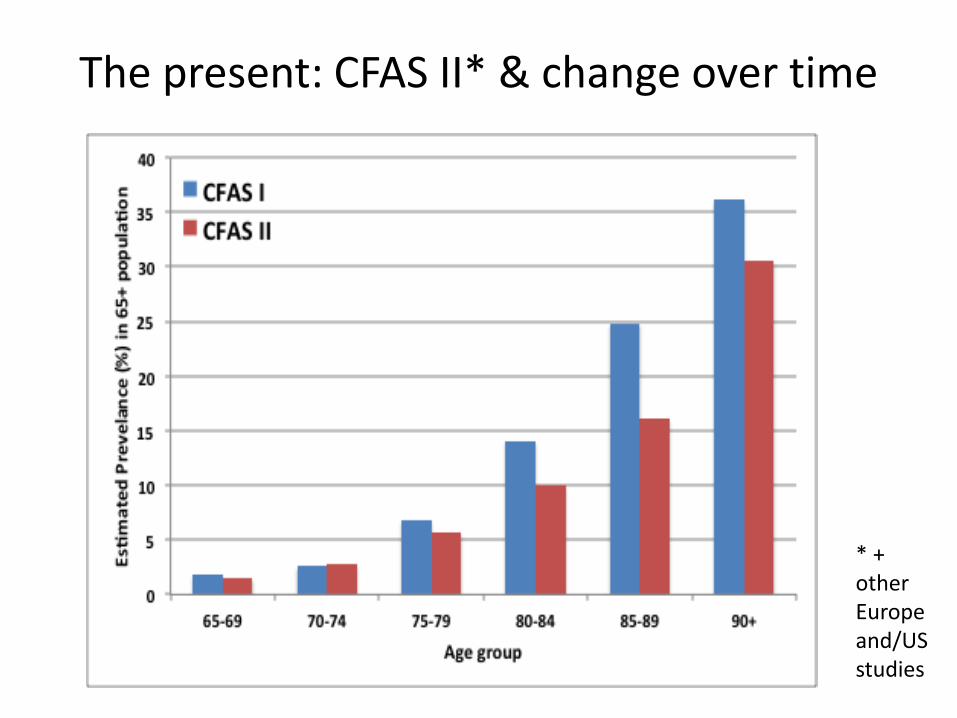
The present: CFAS II* & change over time
* + other Europeand/US studies
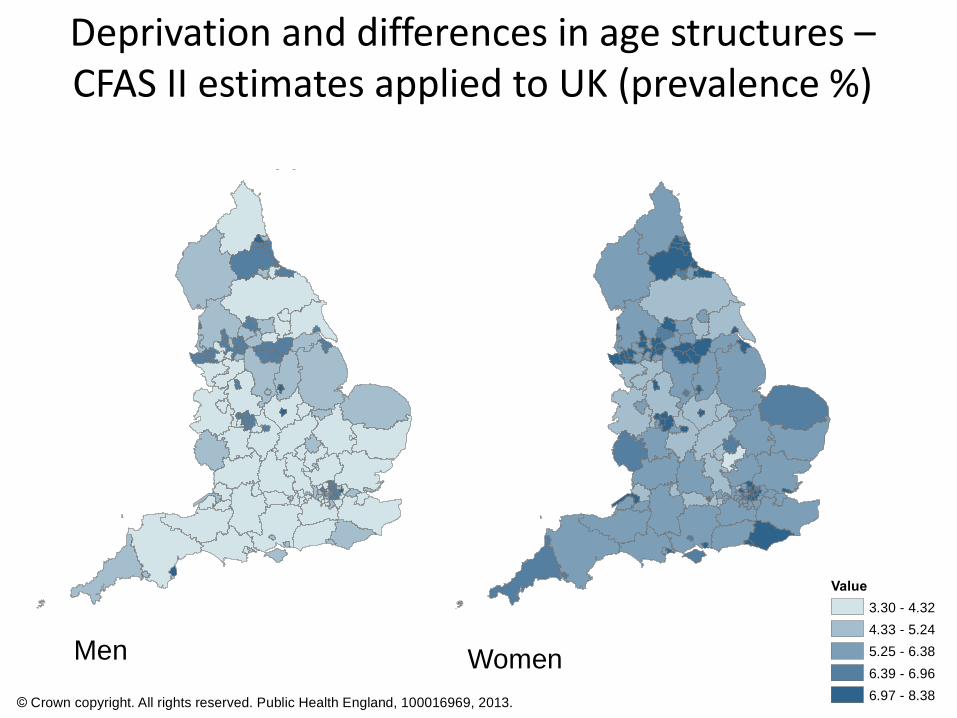
Deprivation and differences in age structures – CFAS II estimates applied to UK (prevalence %)
Men Women
Value
3.30 - 4.32
4.33 - 5.24
5.25 - 6.38
6.39 - 6.96
6.97 - 8.38
Prevalence of Dementia (%)Upper Tier Local Authorities
© Crown copyright. All rights reserved. Public Health England, 100016969, 2013.

Lifecourse approach
Kindersley, 7 Ages
Henry Moore, sketches on 7 ages, Tate archive
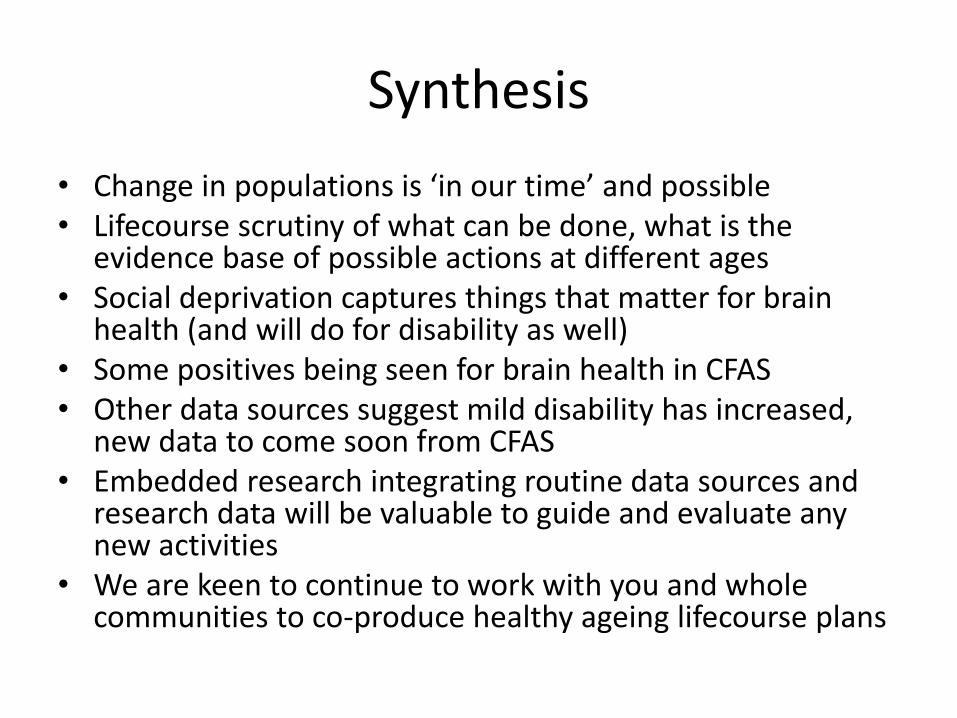
Synthesis
• Change in populations is ‘in our time’ and possible • Lifecourse scrutiny of what can be done, what is the
evidence base of possible actions at different ages • Social deprivation captures things that matter for brain
health (and will do for disability as well) • Some positives being seen for brain health in CFAS • Other data sources suggest mild disability has increased,
new data to come soon from CFAS • Embedded research integrating routine data sources and
research data will be valuable to guide and evaluate any new activities
• We are keen to continue to work with you and whole communities to co-produce healthy ageing lifecourse plans

Thank you!
PANEL DISCUSSION
Ian Philp, Carol Brayne, Liz Robin and Adrian Loades
Break
9.00 am Welcome & Background
9.20 am Session 1: Healthy Ageing – the bigger picture • Keynote presentations
• Panel discussion
10.45 am Refreshments & Networking • Prevention into practice
11.15 am Session 2: A system-wide agenda for action • Group discussions
• Plenary
12.45 pm Closing remarks
1.00 pm Finish
SESSION 2: A SYSTEM-WIDE AGENDA FOR HEALTHY AGEING - How can Healthy Ageing be actioned locally?
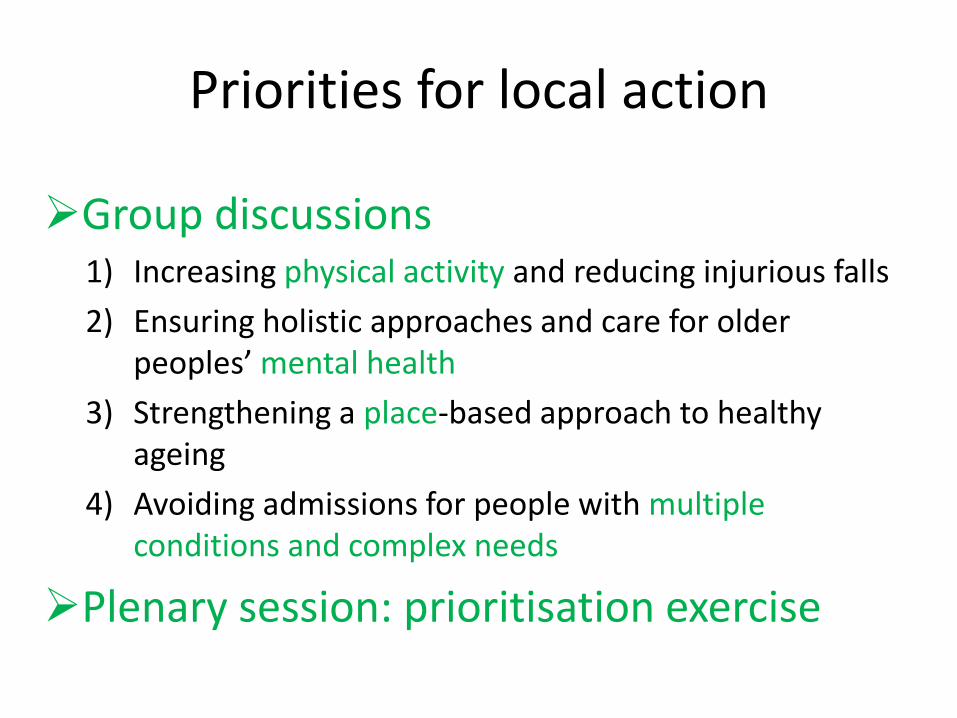
Priorities for local action
Group discussions 1) Increasing physical activity and reducing injurious falls
2) Ensuring holistic approaches and care for older peoples’ mental health
3) Strengthening a place-based approach to healthy ageing
4) Avoiding admissions for people with multiple conditions and complex needs
Plenary session: prioritisation exercise
Closing remarks
• A way forward – next steps
• Action and deliverables
• Continuity and collaboration
• Sustainability and integration
• What we hope to achieve

Keeping in touch
• Contact:
Thank you very much for your attendance & participation today