Embed Size (px)
Citation preview

“Warming” to the use of the Global Trigger Tool
Session G5
March 9, 2012
Objectives
• Gain basic understanding of Trigger Tool methodology
• Learn how Trigger Tool data is used to support Patient Safety
• Gain knowledge of the capability of the VCH/PHC electronic database

Trigger Tool Methodology
Global Trigger Tool
• Developed by the IHI
• Reliable and valid tool that measures harm related to or from the delivery of care
• Takes focus off of what is considered to be preventable
“Triggers are defined as occurrences, prompts, signals, or flags found on review of the medical record that “trigger” further investigation to determine the presence or absence of a adverse drug event.”
Rozich JD, Haraden CR, Resar RK. Adverse drug event trigger tool: a practical methodology for measuring medication related harm. Qual Saf Health Care. 2003;12 (3):194 –200
Harm Defined
IHI Global Trigger Tool:unintended physical injury resulting from or
contributed to by medical care that requires additional monitoring, treatment or hospitalization, or that results in death.
Griffin FA, Resar RK. IHI Global Trigger Tool for Measuring Adverse Events, 2nd edition, IHI Innovation Series white paper.
Cambridge, Massachusetts: Institute for Healthcare Improvement; 2009. (Available on www.IHI.org)
Why Use Trigger Tools?
• Traditional reporting of errors, incidents, or events does not reliably occur in the best of cultures in healthcare
• Voluntary methods underestimate events and frequently concentrate on what is interpreted as being preventable
• Easily identifies events without requiring complex technology
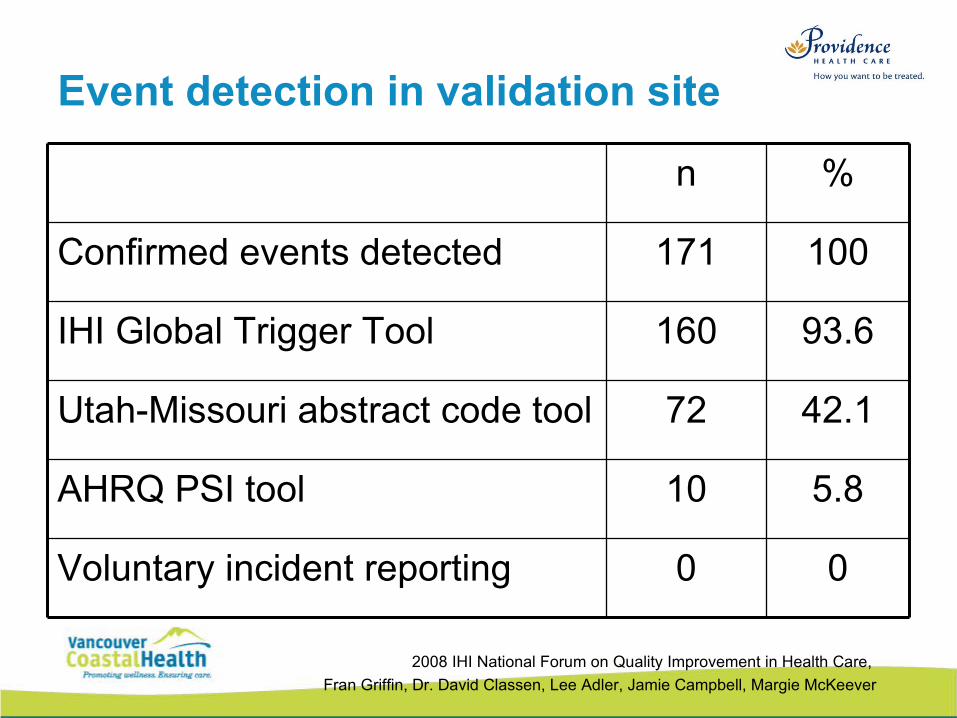
Event detection in validation site
n %
Confirmed events detected 171 100
IHI Global Trigger Tool 160 93.6
Utah-Missouri abstract code tool 72 42.1
AHRQ PSI tool 10 5.8
Voluntary incident reporting 0 0
2008 IHI National Forum on Quality Improvement in Health Care,
Fran Griffin, Dr. David Classen, Lee Adler, Jamie Campbell, Margie McKeever

How do you decide who to marry?
No person really decides before they grow up who they're going to marry. God decides it all way before, and you get to find out later who you're stuck with. - Kristen, age 10
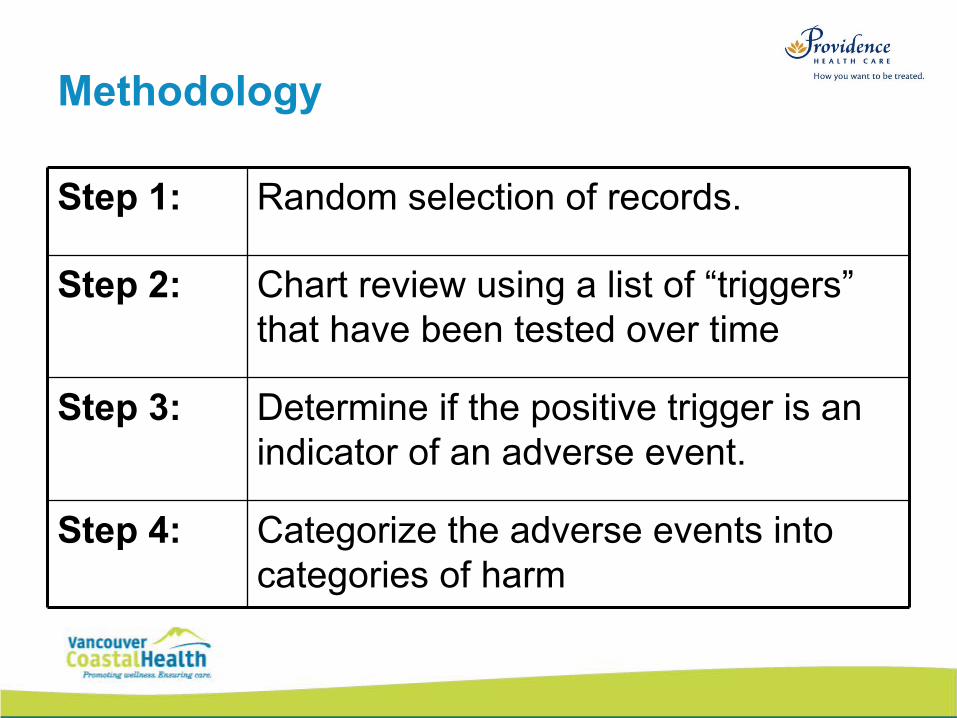
Methodology
Step 1: Random selection of records.
Step 2: Chart review using a list of “triggers” that have been tested over time
Step 3: Determine if the positive trigger is an indicator of an adverse event.
Step 4: Categorize the adverse events into categories of harm
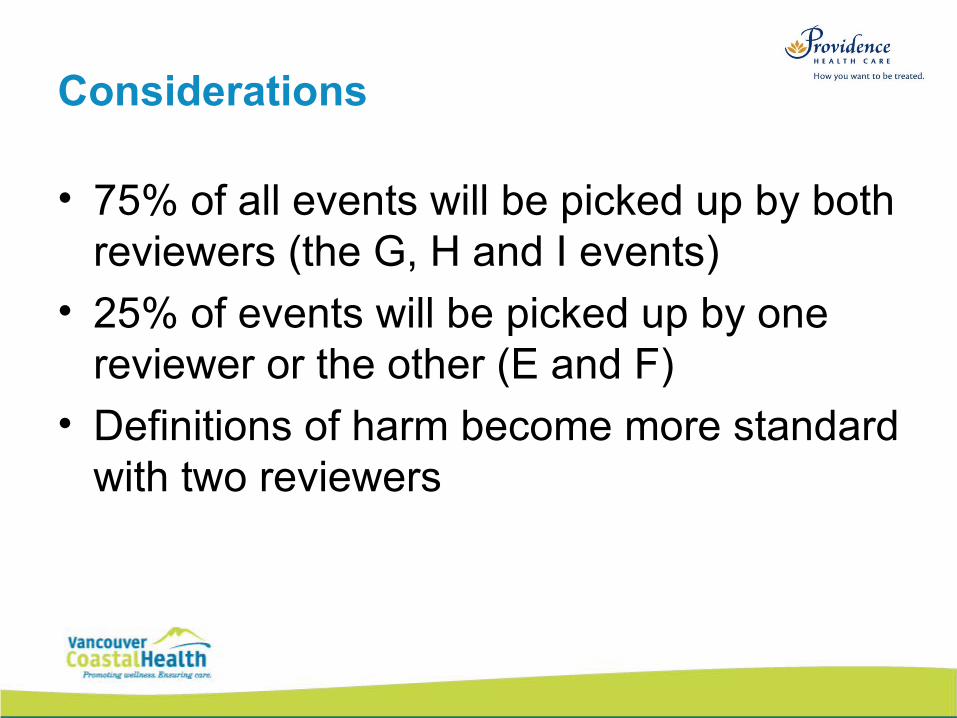
Considerations
• 75% of all events will be picked up by both reviewers (the G, H and I events)
• 25% of events will be picked up by one reviewer or the other (E and F)
• Definitions of harm become more standard with two reviewers
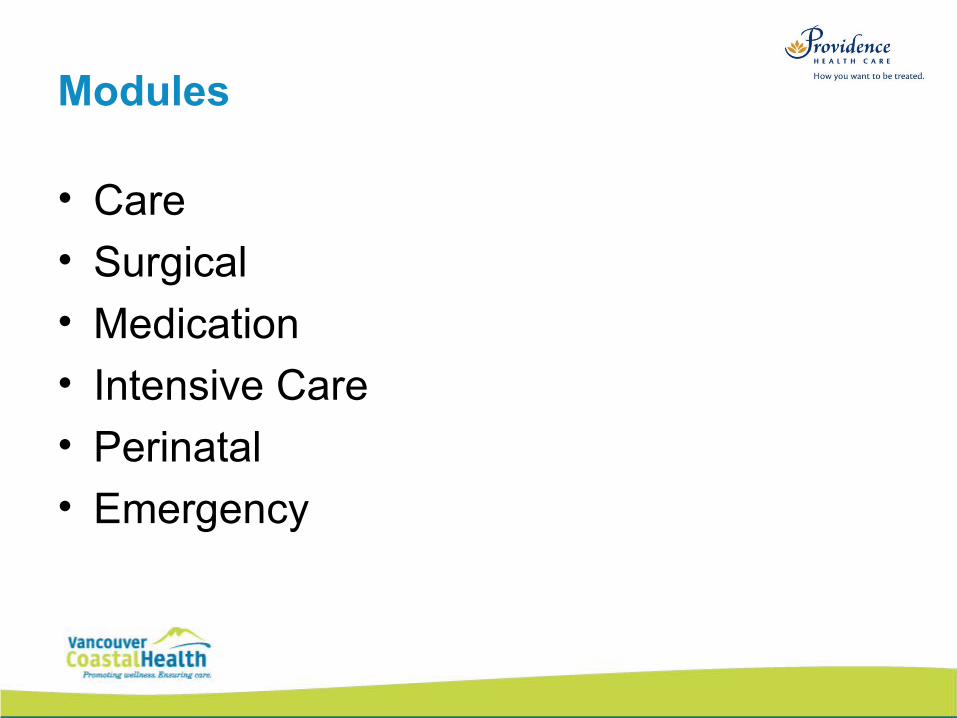
Modules
• Care
• Surgical
• Medication• Intensive Care
• Perinatal
• Emergency
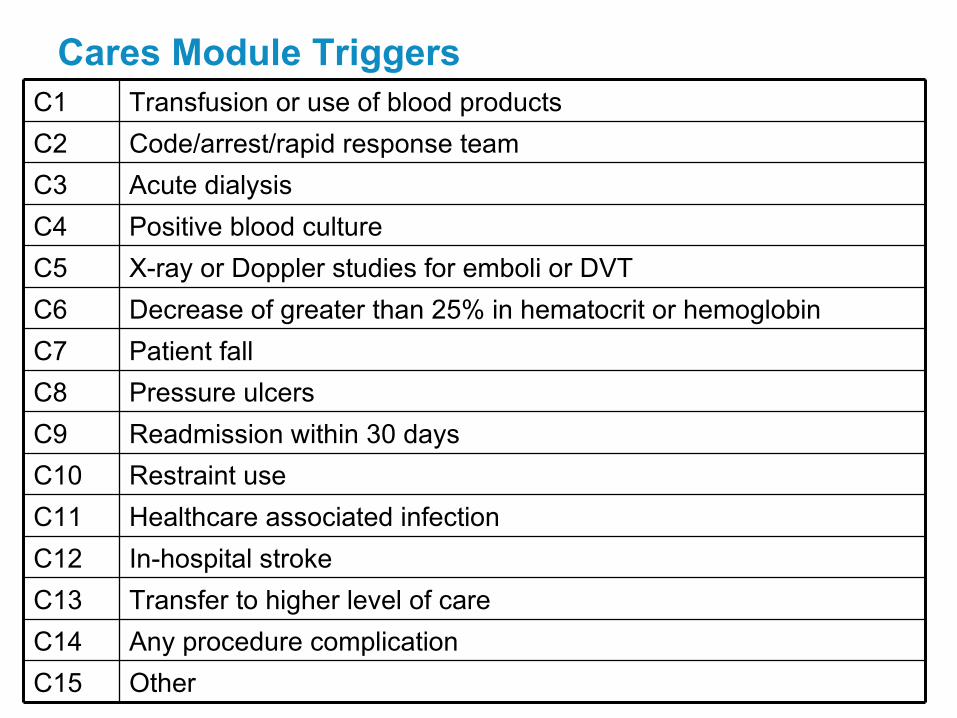
Cares Module TriggersC1 Transfusion or use of blood products
C2 Code/arrest/rapid response team
C3 Acute dialysis
C4 Positive blood culture
C5 X-ray or Doppler studies for emboli or DVT
C6 Decrease of greater than 25% in hematocrit or hemoglobin
C7 Patient fall
C8 Pressure ulcers
C9 Readmission within 30 days
C10 Restraint use
C11 Healthcare associated infection
C12 In-hospital stroke
C13 Transfer to higher level of care
C14 Any procedure complication
C15 Other
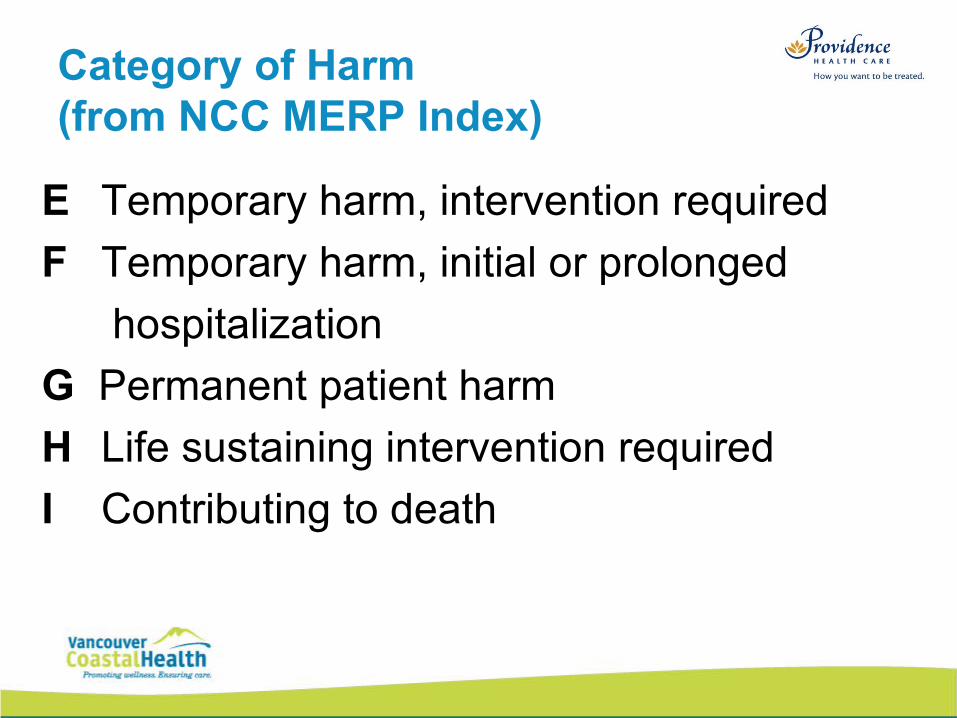
Category of Harm (from NCC MERP Index)
E Temporary harm, intervention required
F Temporary harm, initial or prolonged
hospitalization
G Permanent patient harm
H Life sustaining intervention required
I Contributing to death
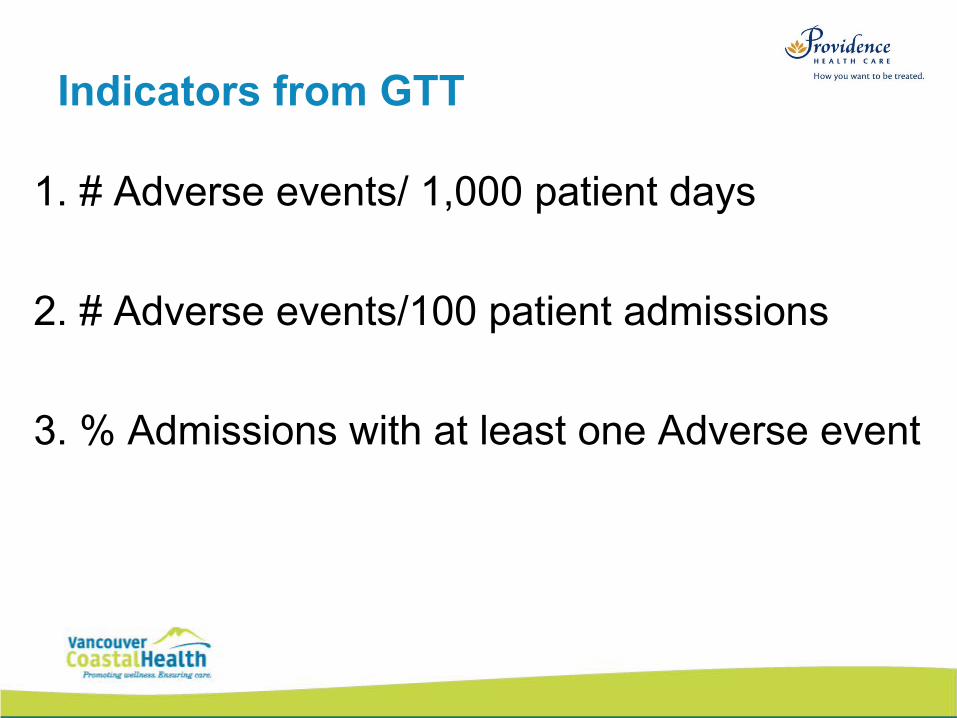
Indicators from GTT
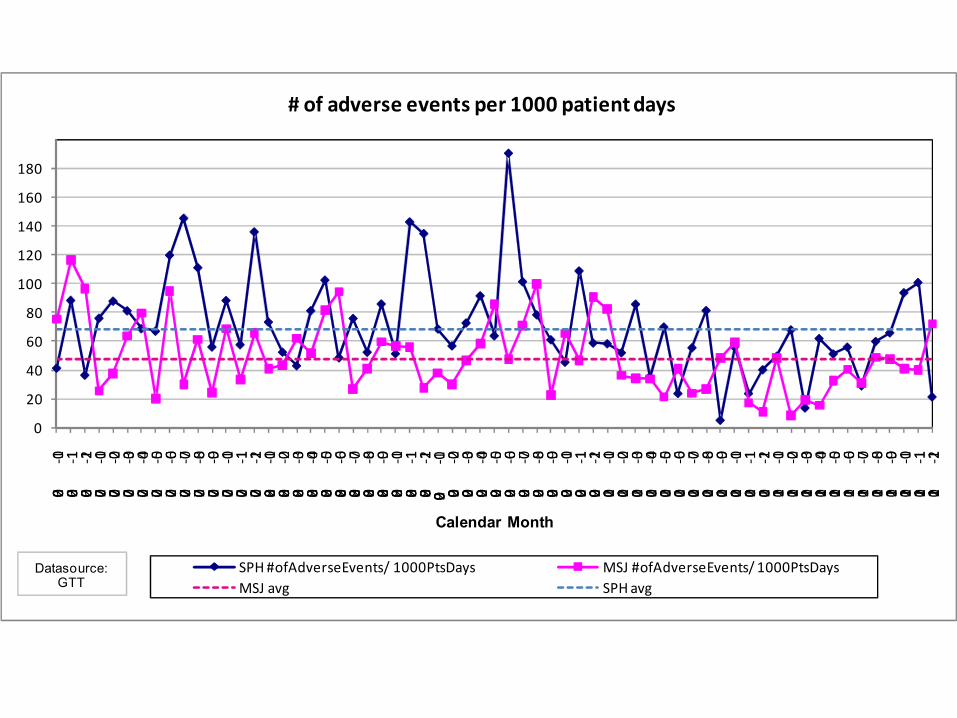
1. # Adverse events/ 1,000 patient days
2. # Adverse events/100 patient admissions
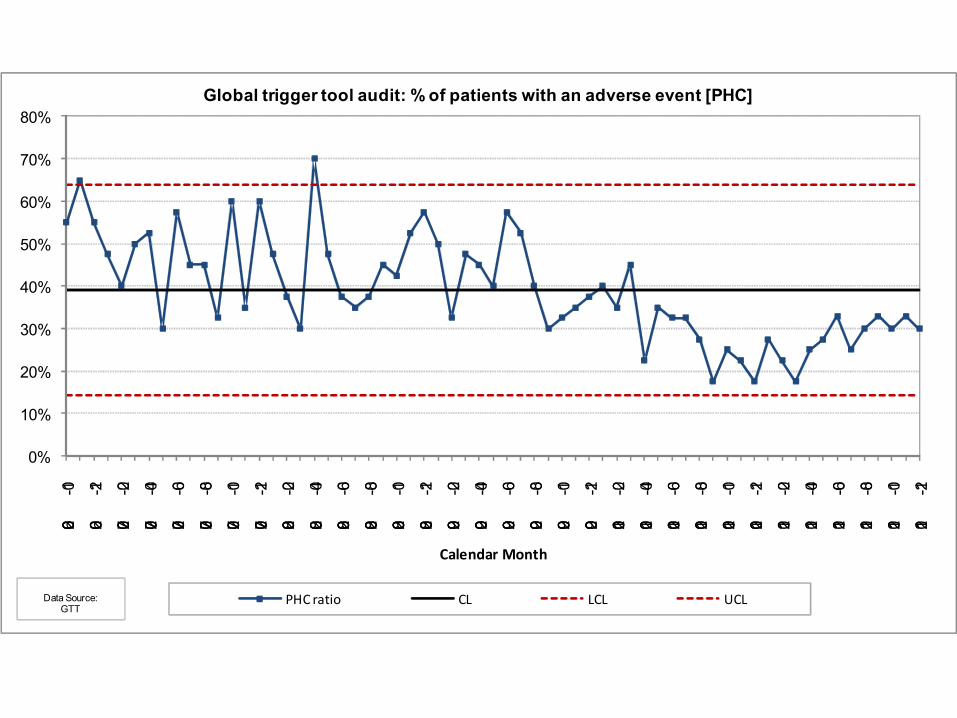
3. % Admissions with at least one Adverse event
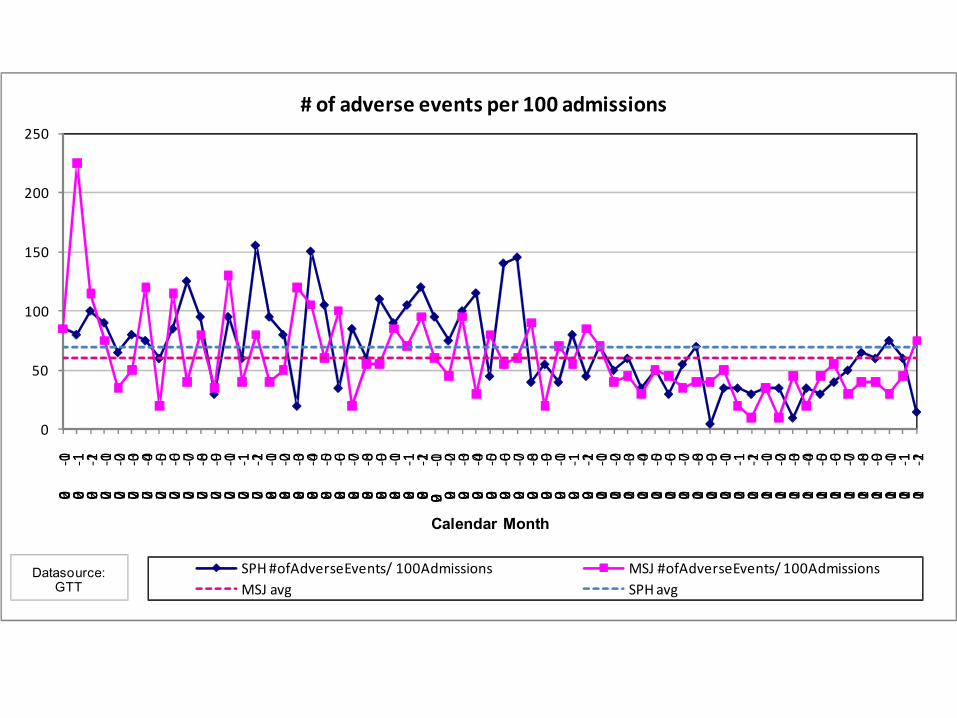
0
50
100
150
200
250
2006-10
2006-11
2006-12
2007-01
2007-02
2007-03
2007-04
2007-05
2007-06
2007-07
2007-08
2007-09
2007-10
2007-11
2007-12
2008-01
2008-02
2008-03
2008-04
2008-05
2008-06
2008-07
2008-08
2008-09
2008-10
2008-11
2008-12
2009 -01
2009-02
2009-03
2009-04
2009-05
2009-06
2009-07
2009-08
2009-09
2009-10
2009-11
2009-12
2010-01
2010-02
2010-03
2010-04
2010-05
2010-06
2010-07
2010-08
2010-09
2010-10
2010-11
2010-12
2011-01
2011-02
2011-03
2011-04
2011-05
2011-06
2011-07
2011-08
2011-09
2011-10
2011-11
2011-12
Calendar Month
SPH #ofAdverseEvents/ 100Admissions MSJ #ofAdverseEvents/ 100AdmissionsMSJ avg SPH avg
# of adverse events per 100 admissions
Datasource: GTT
0
20
40
60
80
100
120
140
160
180
2006-10
2006-11
2006-12
2007-01
2007-02
2007-03
2007-04
2007-05
2007-06
2007-07
2007-08
2007-09
2007-10
2007-11
2007-12
2008-01
2008-02
2008-03
2008-04
2008-05
2008-06
2008-07
2008-08
2008-09
2008-10
2008-11
2008-12
2009 -01
2009-02
2009-03
2009-04
2009-05
2009-06
2009-07
2009-08
2009-09
2009-10
2009-11
2009-12
2010-01
2010-02
2010-03
2010-04
2010-05
2010-06
2010-07
2010-08
2010-09
2010-10
2010-11
2010-12
2011-01
2011-02
2011-03
2011-04
2011-05
2011-06
2011-07
2011-08
2011-09
2011-10
2011-11
2011-12
Calendar Month
SPH #ofAdverseEvents/ 1000PtsDays MSJ #ofAdverseEvents/ 1000PtsDaysMSJ avg SPH avg
# of adverse events per 1000 patient days
Datasource:GTT

0%
10%
20%
30%
40%
50%
60%
70%
80%
2006-10
2006-12
2007-02
2007-04
2007-06
2007-08
2007-10
2007-12
2008-02
2008-04
2008-06
2008-08
2008-10
2008-12
2009-02
2009-04
2009-06
2009-08
2009-10
2009-12
2010-02
2010-04
2010-06
2010-08
2010-10
2010-12
2011-02
2011-04
2011-06
2011-08
2011-10
2011-12
Calendar Month
Global trigger tool audit: % of patients with an adverse event [PHC]
PHC ratio CL LCL UCLData Source:GTT

0
0.1
0.2
0.3
0.4
0.5
0.6
0.7
0.8
0.9
1
2006
-10
2006
-11
2006
-12
2007
-01
2007
-02
2007
-03
2007
-04
2007
-05
2007
-06
2007
-07
2007
-08
2007
-09
2007
-10
2007
-11
2007
-12
2008
-01
2008
-02
2008
-03
2008
-04
2008
-05
2008
-06
2008
-07
2008
-08
2008
-09
2008
-10
2008
-11
2008
-12
2009
-01
2009
-02
2009
-03
2009
-04
2009
-05
2009
-06
2009
-07
2009
-08
2009
-09
2009
-10
2009
-11
2009
-12
2010
-01
2010
-02
2010
-03
2010
-04
2010
-05
2010
-06
2010
-07
2010
-08
2010
-09
2010
-10
2010
-11
2010
-12
2011
-01
2011
-02
2011
-03
2011
-04
2011
-05
2011
-06
2011
-07
2011
-08
2011
-09
2011
-10
2011
-11
2011
-12
Calendar Month
% p
atie
nts
wit
h a
t le
ast
on
e ad
vers
e ev
ent
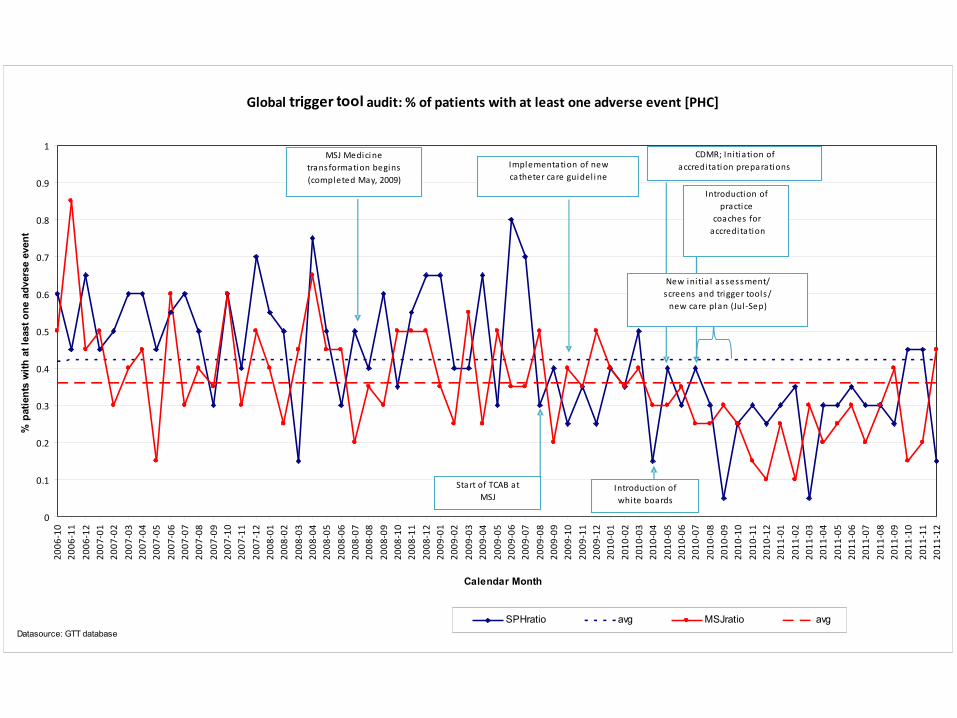
SPHratio avg MSJratio avgDatasource: GTT database
Global trigger tool audit: % of patients with at least one adverse event [PHC]
Implementation of newcatheter care guidel i ne
CDMR; Ini tia tion of accreditati on preparations
MSJ Medici netransformation begins(completed May, 2009)
Start of TCAB atMSJ
Introduction ofwhite boards
New ini tia l assessment/screens and trigger tools/
new care pl an (Jul -Sep)
Introduction of practice
coaches for accreditation
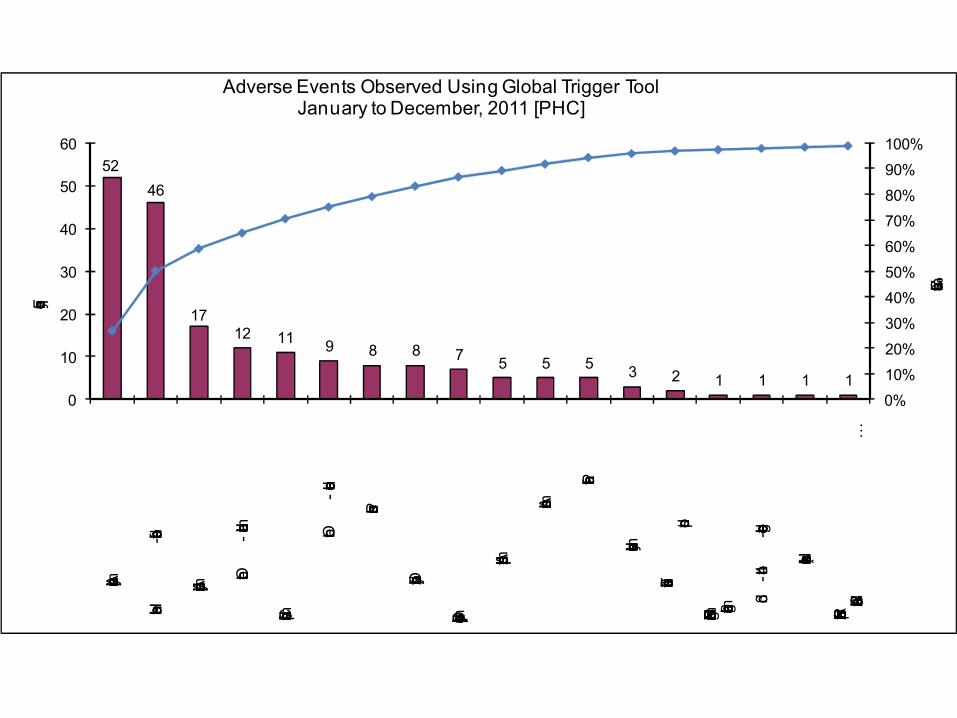
52
46
1712 11 9 8 8 7
5 5 5 3 2 1 1 1 10%
10%
20%
30%
40%
50%
60%
70%
80%
90%
100%
0
10
20
30
40
50
60
Any operative complication
Healthcare-associated infection
Any procedure complication
Other -
medication related
Clostridium difficile positive stool
Other -
care related
Pressure ulcers
Over sedation/hypotension
Benadryl (Diphenhydramine) use
Abrupt medication stop
Antiemetic use
Patient fall
Instrumented delivery
Transfusion or use of blood products
Rising BUN or Serum Creatinine greather than 2 times baseline
3rd-or 4th
-degree lacerations
Narcan (Naloxone ) use
Intubation/Reintubation/BiPap in Post Anesthesia Care Unit
…
Cumulative %
Frequency
Adverse Events Observed Using Global Trigger ToolJanuary to December, 2011 [PHC]
3.74.6
1.6 0.8 0.7
5.0
0.3 0.2 0.3 0.30.0
1.0
2.0
3.0
4.0
5.0
6.0Healthcare
-associated infection
Any operative complication
Any procedure complication
Clostridium difficile positive stool
Over-
sedation/hypotension
Monthly rate
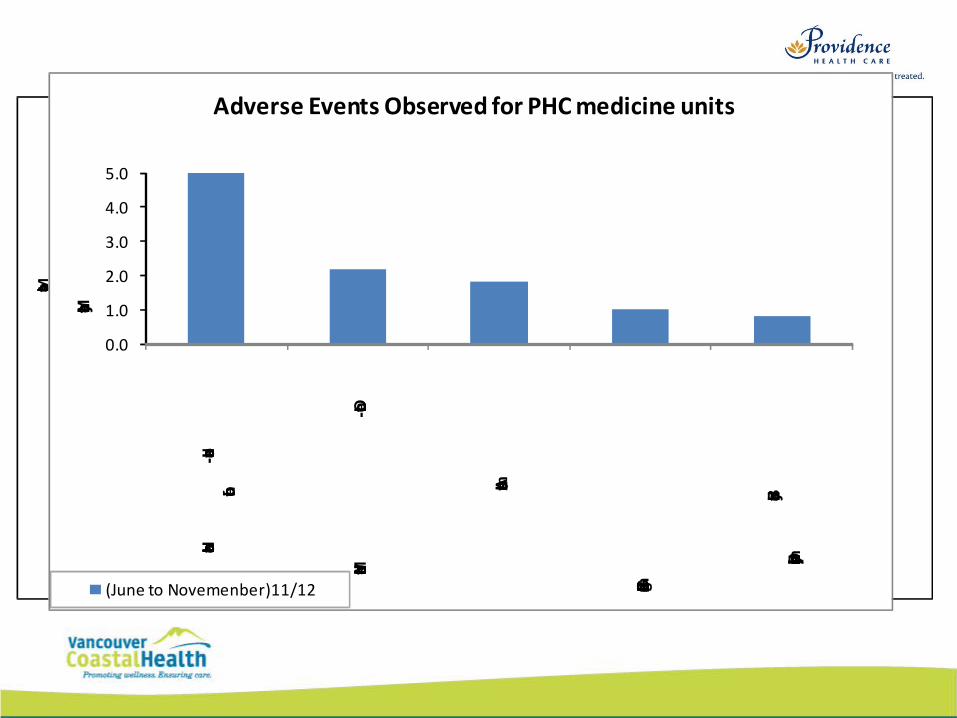
Adverse Events Observed Using Global Trigger Tool for PHC and PHC medicine units
PHC (January to Novemenber)11/12 PHC medicine(June to Novemenber)11/12
0.0
1.0
2.0
3.0
4.0
5.0
Healthcare-associated
infection
Medication related-Other
Antiemetic use
Glucose less than 50mg/dl
Benadryl (Diphenhydramine) use
Monthly rate
Adverse Events Observed for PHC medicine units
(June to Novemenber)11/12

How can a stranger tell if two people are married?
You might have to guess, based on whether they seem to be yelling at the same kids. - Derrick, age 8

24
Trigger Tools around the world
NHS
• Pediatric, Acute, and Primary care
• Even have a portal, plus videos, tools,etc.
http://www.institute.nhs.uk/safer_care/safer_care/trigger_tool_portal.html
25
Examples of other Trigger Tools
• Adverse drug events
• NICU• ICU
• Acute hospital
• Outpatient
• Pediatric• Oncology
• Primary Care (UK)
26
Baylor (North Texas)- 8 acute sites
Adverse events:
•68.1 per 1000 patient days
•50.8 per 100 encounters•39.8% of admissions were found to have at least one 1 AE
27
Of all AEs identified
• 61.2% were hospital-acquired
• 10.1% of which were H or I (near death or death)
28
U.S.
• IHI and Premier; developed a new ADE trigger tool based on Classen’s work.
• Trialed it in 86 hospitals across US• 2837 charts reviewed
– Rozich et al
29
Some Triggers
• Nalaxone
• Flumenazil
• Vitamin K • INR greater than 6
• Abrupt medication stop
• Transfer to higher level of care
30
Findings
• Only 5 of 274 adverse drug events were reported in their incident reporting system
• Average 2.94 events per 1000 doses• Most frequent was antiemetic
• Most valuable trigger was ‘abrupt medication stop
31
CPSI
• Developing a pediatric trigger tool
32

How do you make a marriage work?
Tell your wife that she looks pretty, even if she looks like a dump truck.
- Ricky, age 10
Multiple indicators
• Need a variety of measures to monitor activity
• One methodology is not enough e.g. reporting vs. chart review vs. survey
• Gives more complete picture
• Provides direction and priority for action.
Trigger Tool data for Patient Safety
VCH/PHC Quality/Patient Safety Indicators
1. Hospital Standardized Mortality Ratio (HSMR)
2. Adverse Event Rates (using the GTT)
3. Safety Culture Survey (staff and patient)
4. In-hospital fractures
5. Pharmacy Indicators (e.g. Medication reconciliation, unsafe abbreviations, illegible handwriting audits)
6. Infection Control Surveillance Data (e.g.. MRSA, VRE, CDAD, HH audits)
Trigger Tool Practical Use
• Establishes within an institution a baseline of harm
• Resources can be focused effectively• Affect of interventions can be followed
when adverse event rate is measured over time
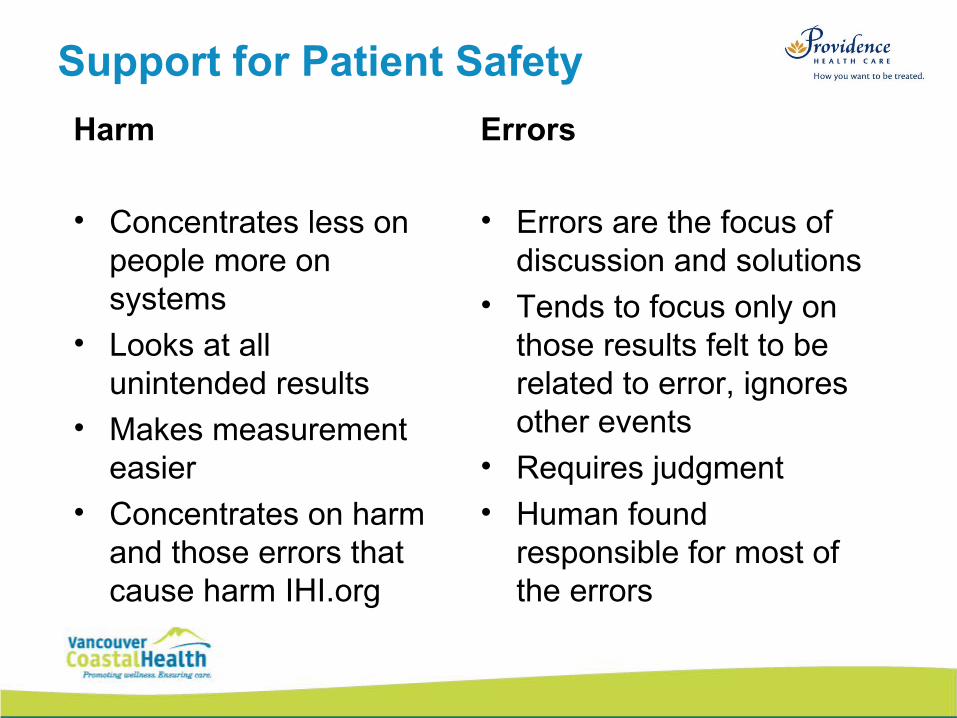
Support for Patient Safety
Harm
• Concentrates less on people more on systems
• Looks at all unintended results
• Makes measurement easier
• Concentrates on harm and those errors that cause harm IHI.org
Errors
• Errors are the focus of discussion and solutions
• Tends to focus only on those results felt to be related to error, ignores other events
• Requires judgment
• Human found responsible for most of the errors

VCH/PHC Database
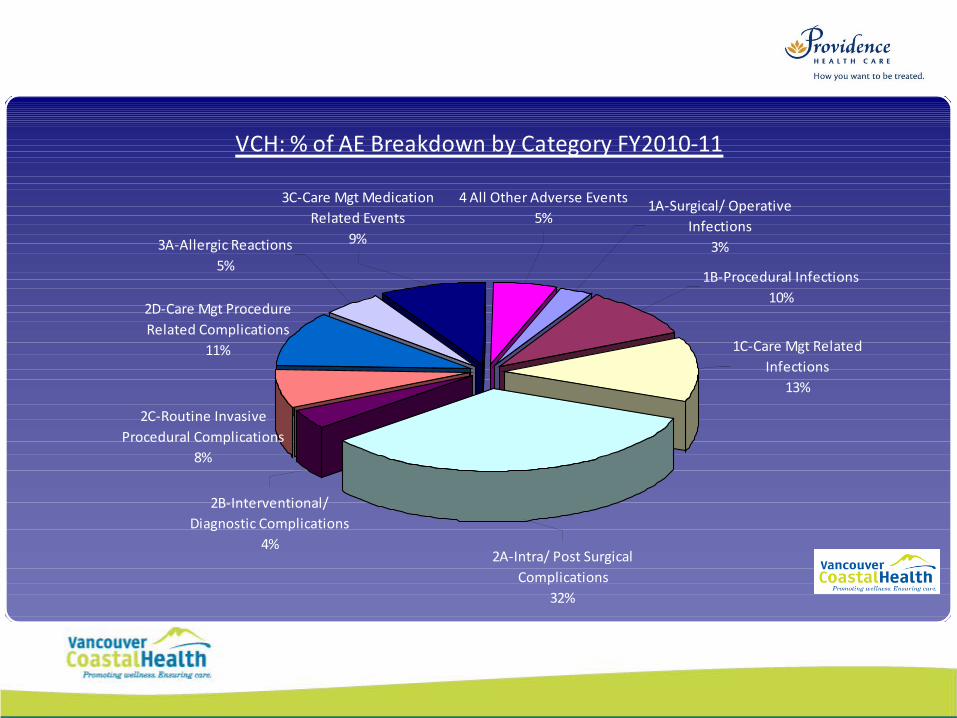
VCH: % of AE Breakdown by Category FY2010-11
4 All Other Adverse Events5%
3C-Care Mgt Medication Related Events
9%3A-Allergic Reactions5%
2D-Care Mgt Procedure Related Complications
11%
2C-Routine Invasive Procedural Complications
8%
2B-Interventional/ Diagnostic Complications
4%2A-Intra/ Post Surgical
Complications32%
1C-Care Mgt Related Infections
13%
1B-Procedural Infections10%
1A-Surgical/ Operative Infections
3%
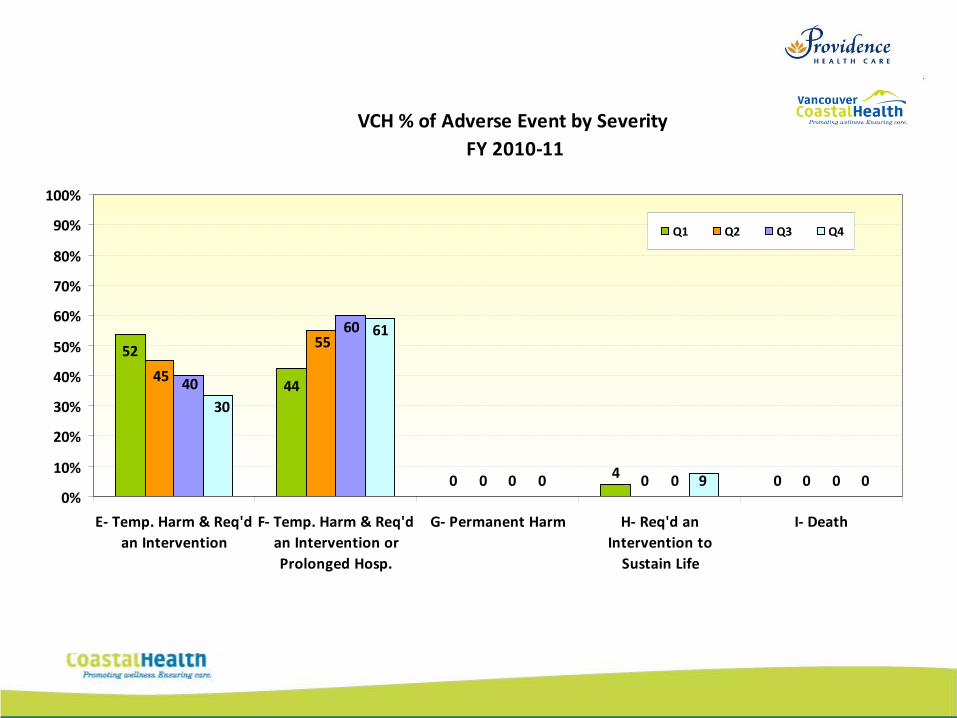
VCH % of Adverse Event by Severity FY 2010-11
040
44
52
000
55
45
000
60
40
090
61
30
0%
10%
20%
30%
40%
50%
60%
70%
80%
90%
100%
E- Temp. Harm & Req'dan Intervention
F- Temp. Harm & Req'dan Intervention orProlonged Hosp.
G- Permanent Harm H- Req'd anIntervention to
Sustain Life
I- Death
Q1 Q2 Q3 Q4
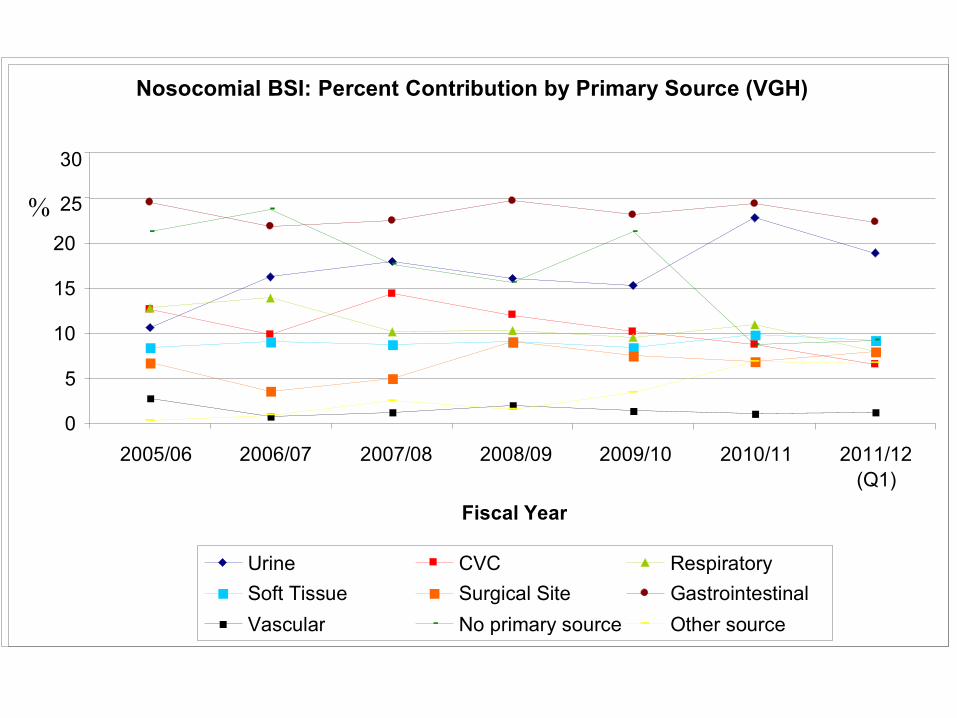
Nosocomial BSI: Percent Contribution by Primary Source (VGH)
0
5
10
15
20
25
30
2005/06 2006/07 2007/08 2008/09 2009/10 2010/11 2011/12 (Q1)
Fiscal Year
%
Urine CVC Respiratory Soft Tissue Surgical Site Gastrointestinal Vascular No primary source Other source
43
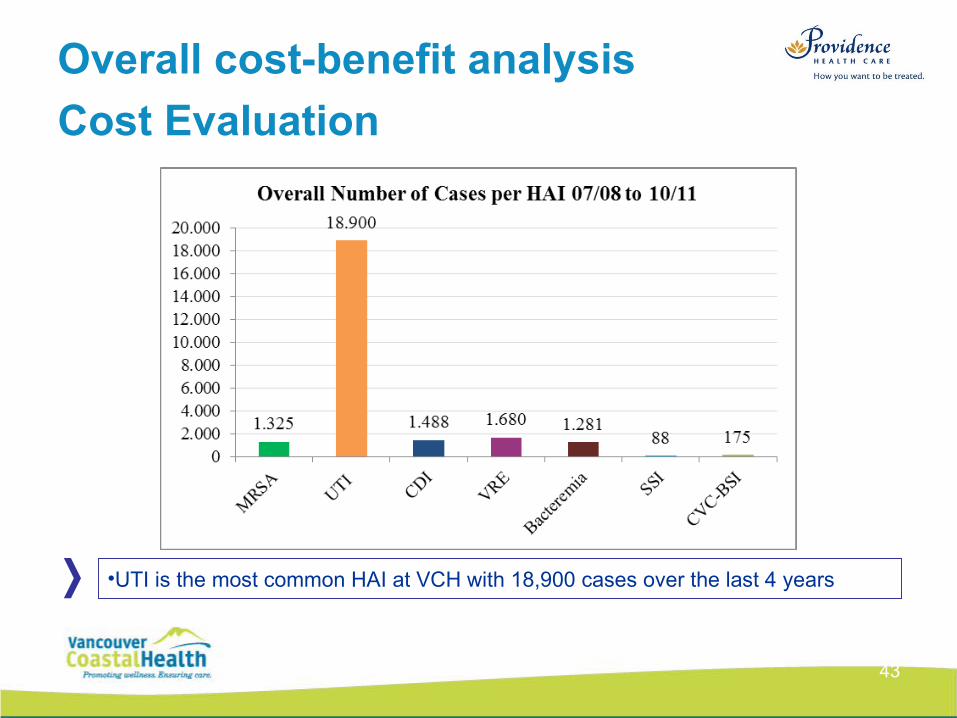
Overall cost-benefit analysis
Cost Evaluation
•UTI is the most common HAI at VCH with 18,900 cases over the last 4 years
44
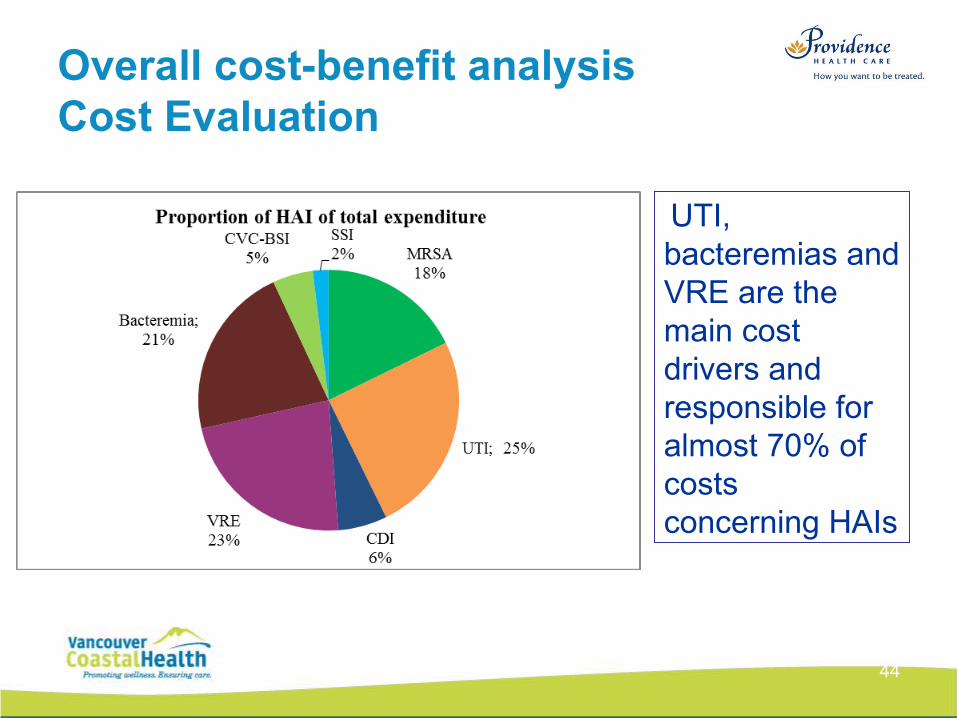
Overall cost-benefit analysisCost Evaluation
•Cost drivers UTI, bacteremias and VRE are the main cost drivers and responsible for almost 70% of costs concerning HAIs
Summary
• Gain basic understanding of Trigger Tool methodology
• Learn how Trigger Tool data is used to support Patient Safety
• Gain knowledge of the capability of the VCH/PHC database

Questions?


![Decision Fusion using Dempster-Schaffer Theory · 2016. 3. 15. · The theory was first developed by Arthur P. Dempster[2] and Glenn Shafer.[1][3]! In a narrow sense, the term Dempster–Shafer](https://img.pdfslide.us/doc/110x75/5fc160715f66fc622061ede5/decision-fusion-using-dempster-schaffer-theory-2016-3-15-the-theory-was-first.jpg)