Embed Size (px)
Citation preview
Patient Focused Funding in BC
A Revolution or Just a System Tweak?
Les Vertesi
BCPSQ Forum
March 9, 2012
Why Change at All?
• Are you satisfied with the current state of health care in which you work?
– Waitlists (20% > a year)
– Crowding & Delays in Emergency Departments?
– ALC rates near 20% of In-hospital Days
– “Quality” is an uphill struggle
– And one more small thing …
2
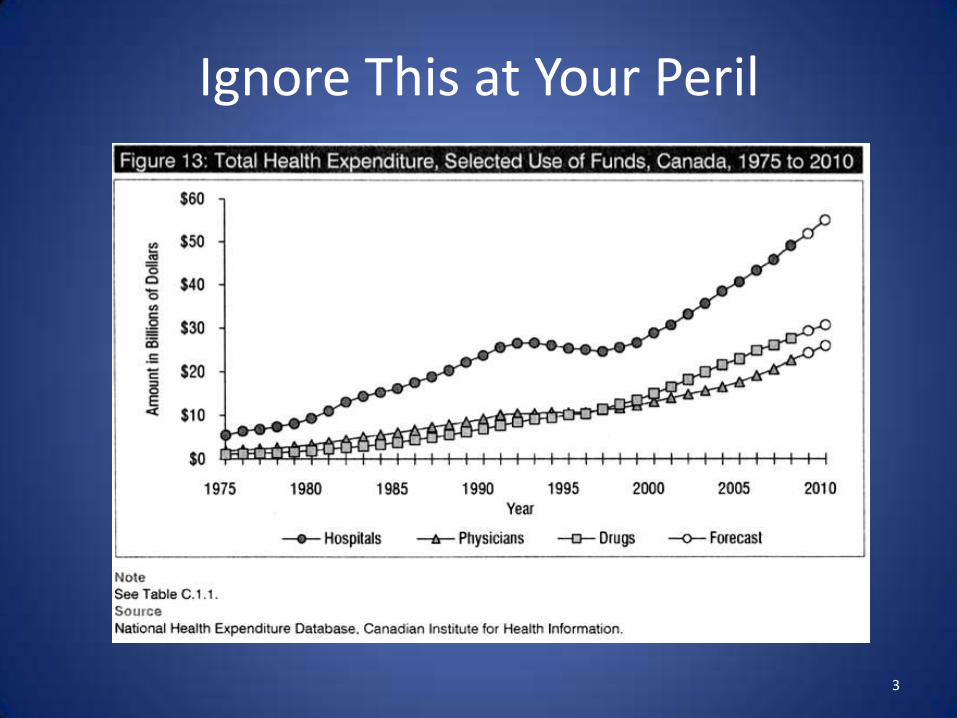
Ignore This at Your Peril
3
Changing the Game
• A Conversation with Government (2006)
• If you could fix One Thing in Healthcare …?
– Will You Pay for it?
– No? Why not?
• What if it were fixed and the bill was …. ?
• What if you only had to pay if it was fixed?
4
A New Game in Town
• Governments are less willing to put money in when they don’t think they are getting Quality
– Would YOU be willing to keep paying for something you are not getting?
– Who is best placed to manage the RISK of success or failure?
• Can government be a “purchaser” and let the Health Authorities be (competitive) providers?
5
Where to Start?
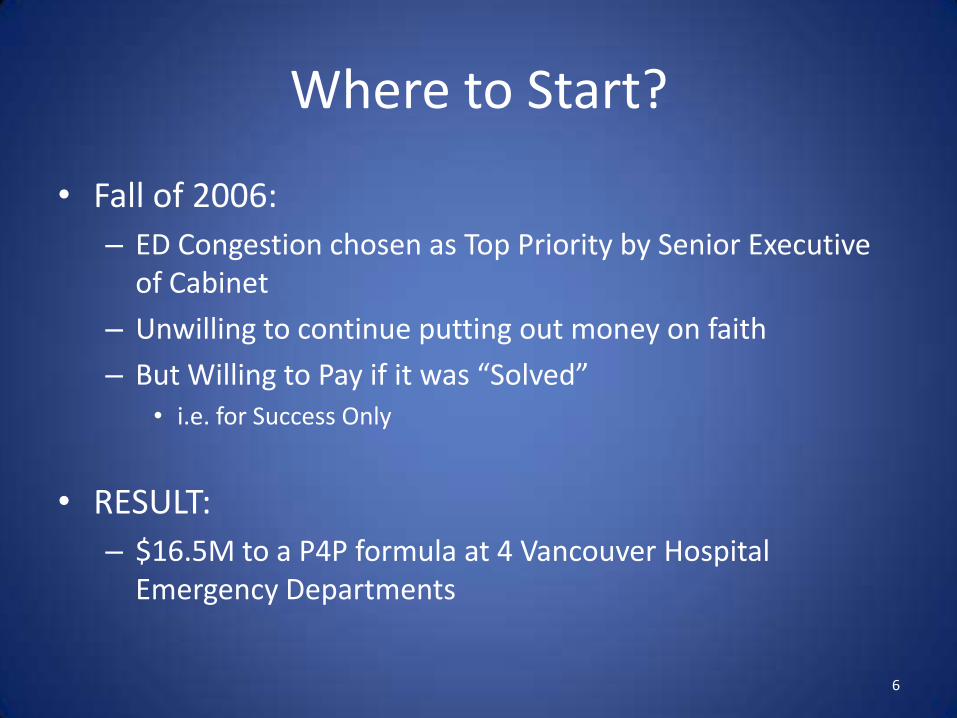
• Fall of 2006:
– ED Congestion chosen as Top Priority by Senior Executive of Cabinet
– Unwilling to continue putting out money on faith
– But Willing to Pay if it was “Solved”• i.e. for Success Only
• RESULT:
– $16.5M to a P4P formula at 4 Vancouver Hospital Emergency Departments
6
EDP4P Basics
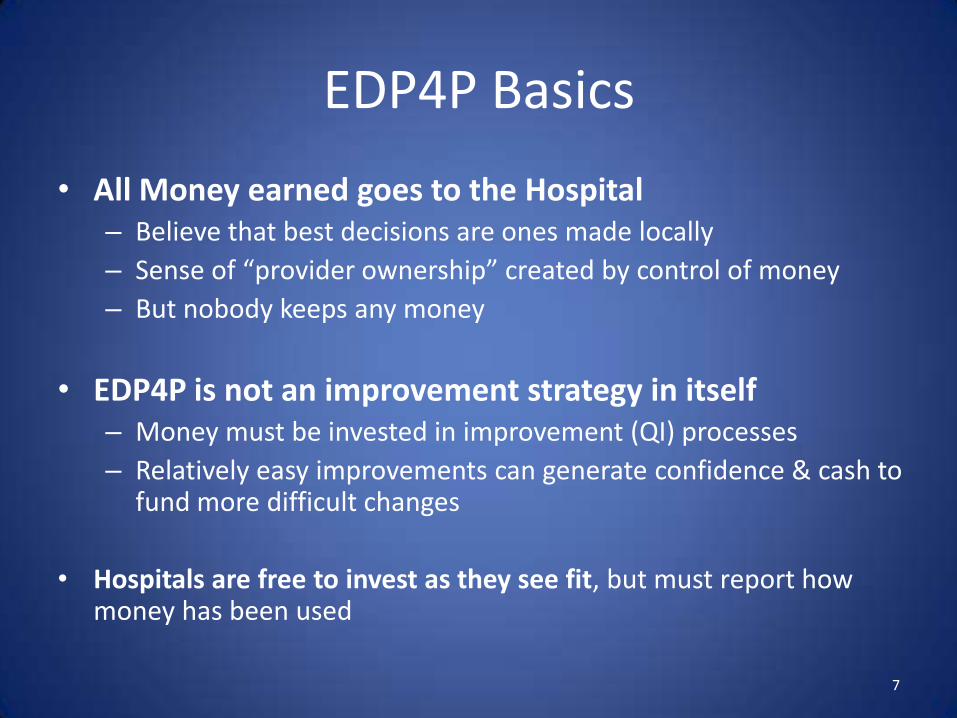
• All Money earned goes to the Hospital– Believe that best decisions are ones made locally
– Sense of “provider ownership” created by control of money
– But nobody keeps any money
• EDP4P is not an improvement strategy in itself– Money must be invested in improvement (QI) processes
– Relatively easy improvements can generate confidence & cash to fund more difficult changes
• Hospitals are free to invest as they see fit, but must report how money has been used
7
What P4P is NOT
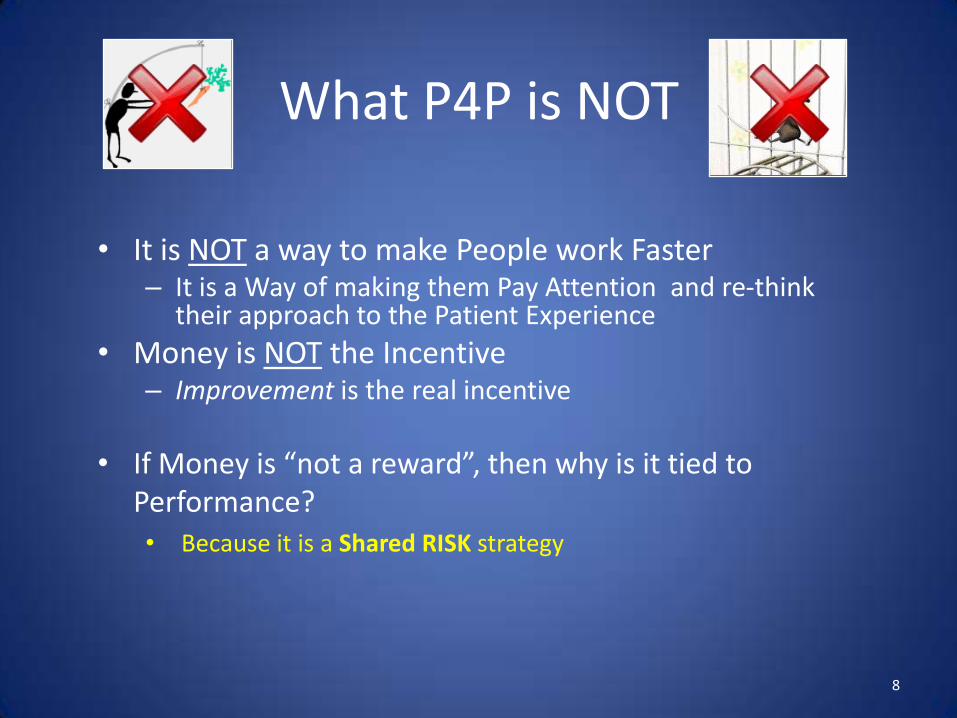
• It is NOT a way to make People work Faster– It is a Way of making them Pay Attention and re-think
their approach to the Patient Experience
• Money is NOT the Incentive – Improvement is the real incentive
• If Money is “not a reward”, then why is it tied to Performance?• Because it is a Shared RISK strategy
8
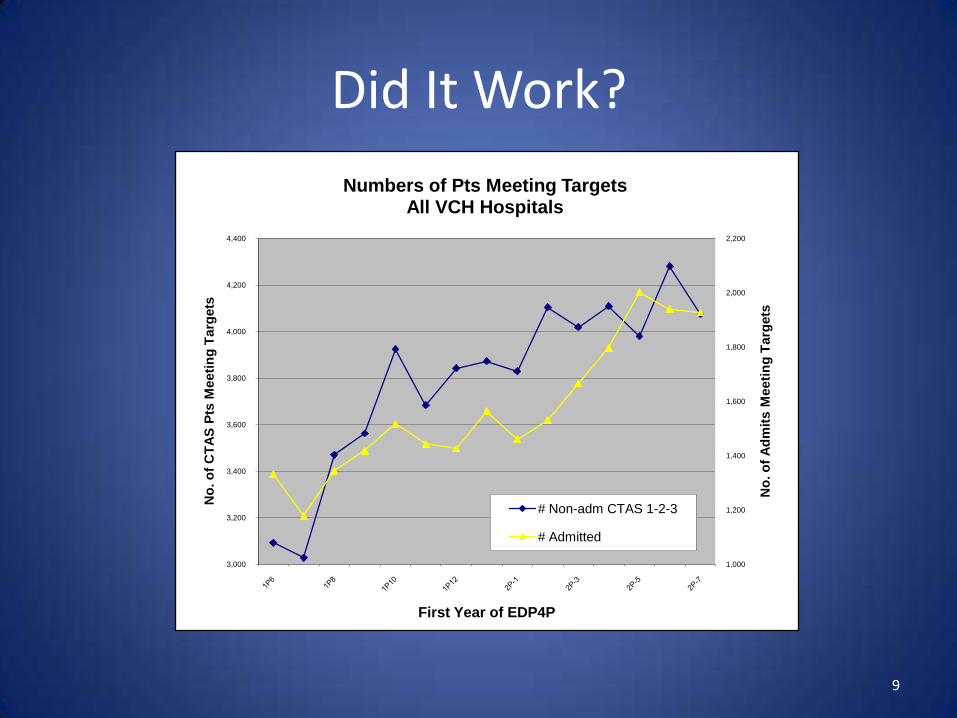
Did It Work?
1,000
1,200
1,400
1,600
1,800
2,000
2,200
3,000
3,200
3,400
3,600
3,800
4,000
4,200
4,400
No
. o
f A
dm
its M
eeti
ng
Targ
ets
No
. o
f C
TA
S P
ts M
eeti
ng
Targ
ets
First Year of EDP4P
Numbers of Pts Meeting TargetsAll VCH Hospitals
# Non-adm CTAS 1-2-3
# Admitted
9
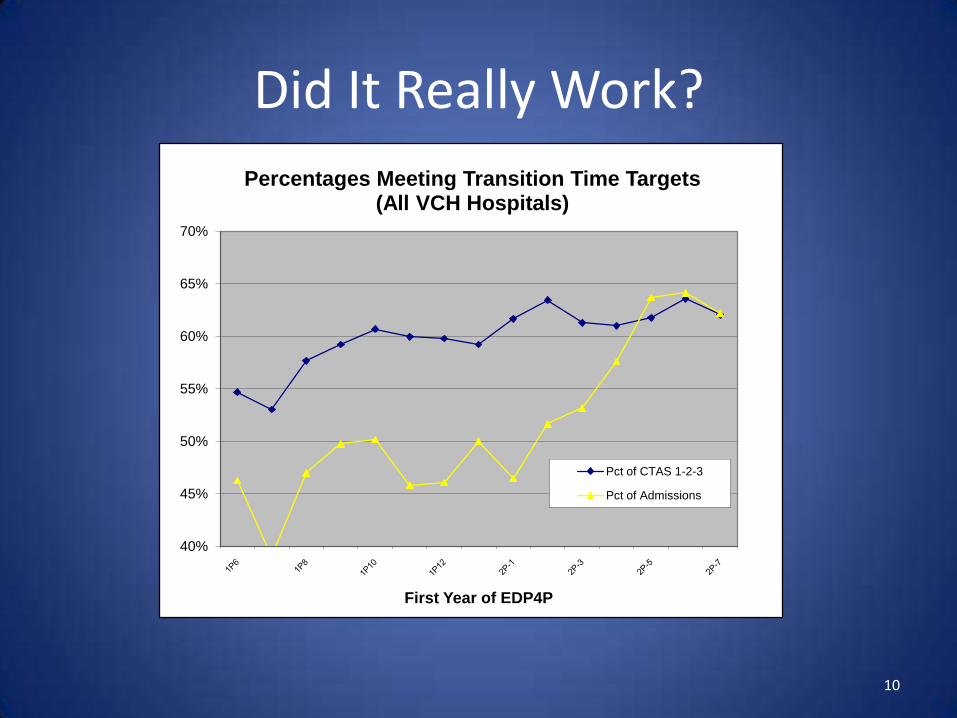
Did It Really Work?
40%
45%
50%
55%
60%
65%
70%
First Year of EDP4P
Percentages Meeting Transition Time Targets(All VCH Hospitals)
Pct of CTAS 1-2-3
Pct of Admissions
10
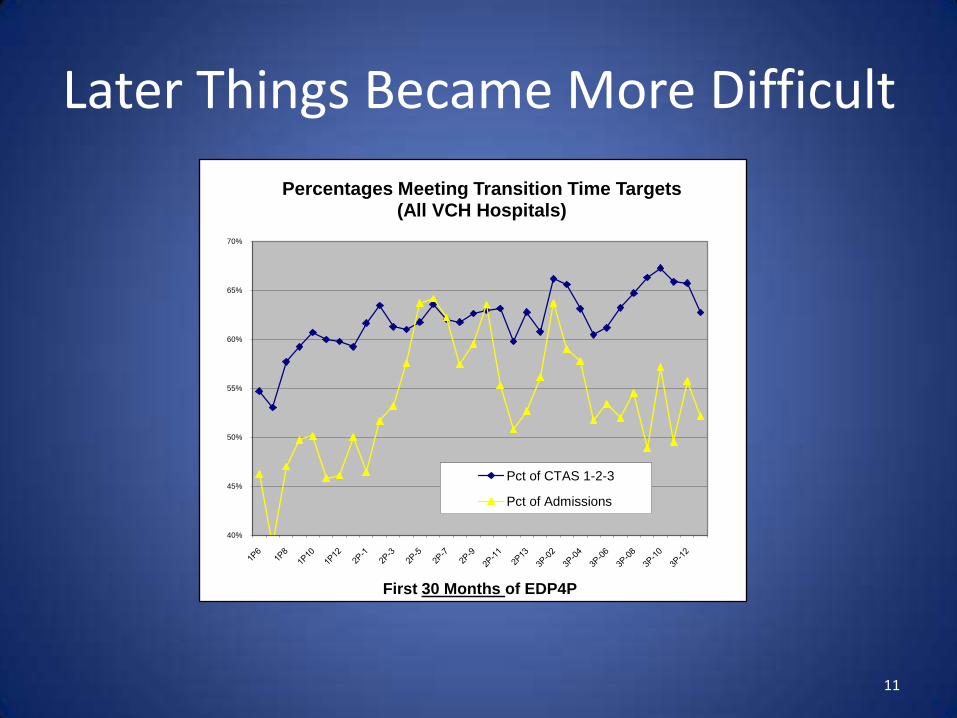
Later Things Became More Difficult
40%
45%
50%
55%
60%
65%
70%
First 30 Months of EDP4P
Percentages Meeting Transition Time Targets(All VCH Hospitals)
Pct of CTAS 1-2-3
Pct of Admissions
11
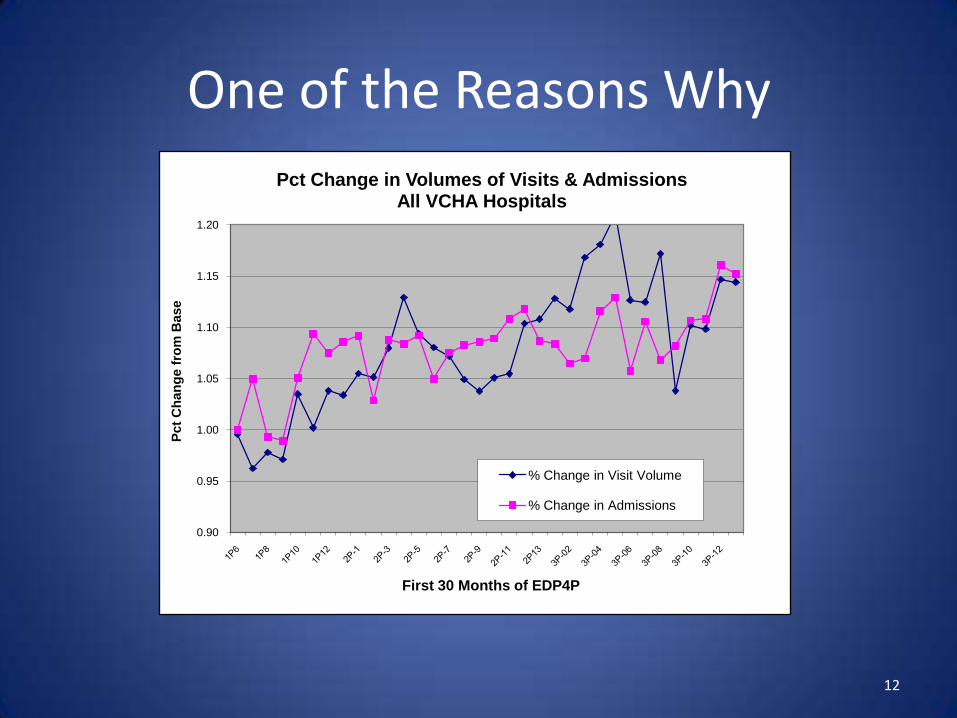
One of the Reasons Why
0.90
0.95
1.00
1.05
1.10
1.15
1.20
Pct
Ch
an
ge f
rom
Base
First 30 Months of EDP4P
Pct Change in Volumes of Visits & AdmissionsAll VCHA Hospitals
% Change in Visit Volume
% Change in Admissions
12
13
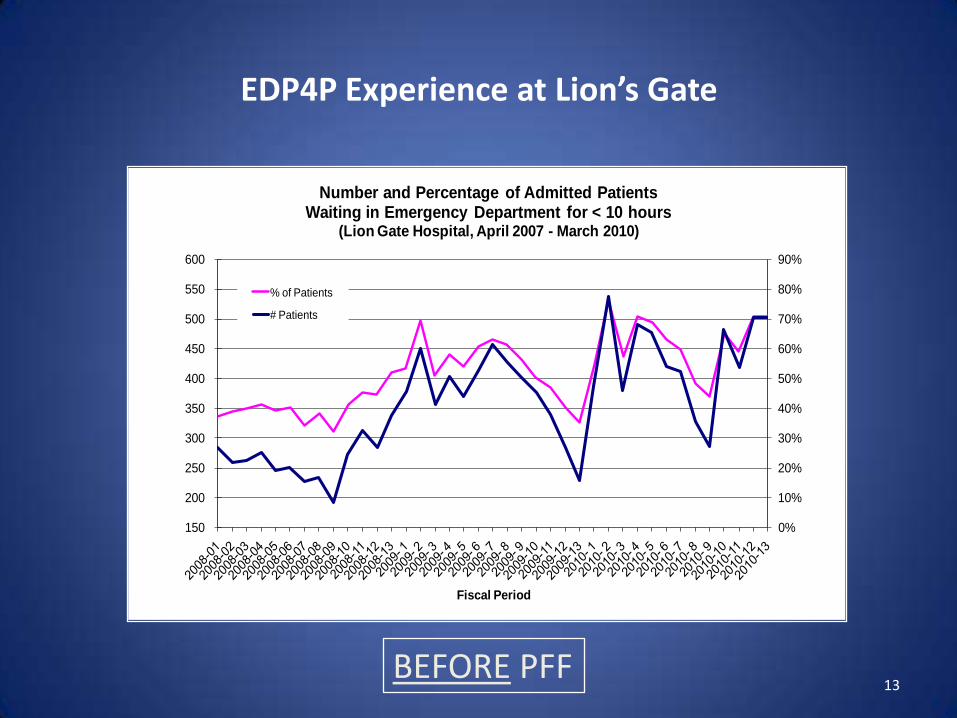
EDP4P Experience at Lion’s Gate
150
200
250
300
350
400
450
500
550
600
0%
10%
20%
30%
40%
50%
60%
70%
80%
90%
Fiscal Period
Number and Percentage of Admitted Patients Waiting in Emergency Department for < 10 hours
(Lion Gate Hospital, April 2007 - March 2010)
% of Patients
# Patients
BEFORE PFF
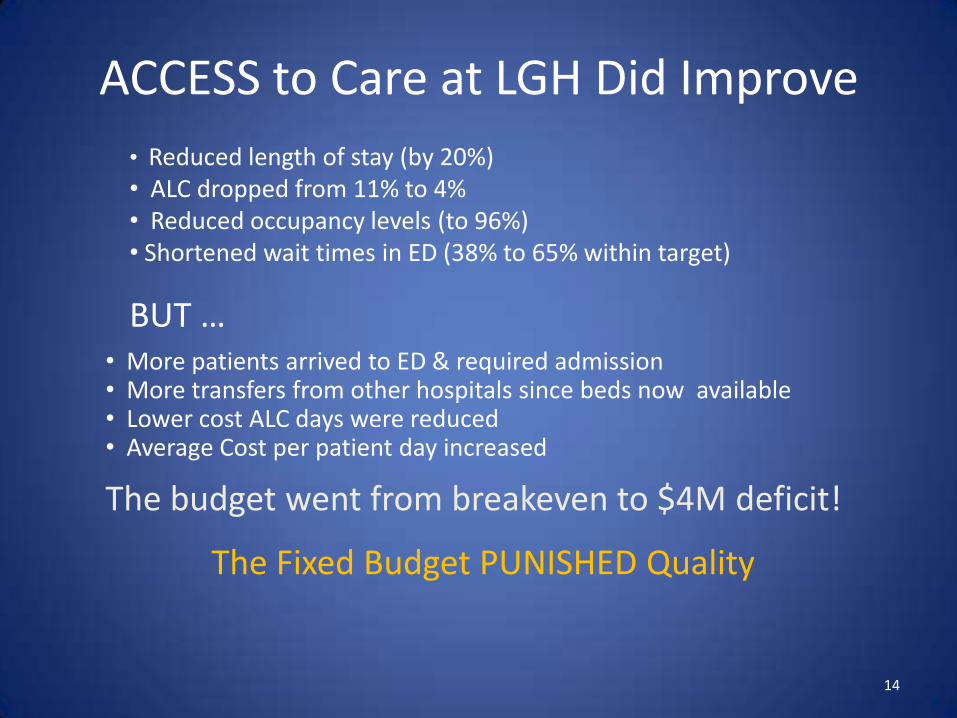
ACCESS to Care at LGH Did Improve
• Reduced length of stay (by 20%)• ALC dropped from 11% to 4%• Reduced occupancy levels (to 96%)• Shortened wait times in ED (38% to 65% within target)
BUT …• More patients arrived to ED & required admission• More transfers from other hospitals since beds now available• Lower cost ALC days were reduced• Average Cost per patient day increased
The budget went from breakeven to $4M deficit!
14
The Fixed Budget PUNISHED Quality
Why?
Because Patient Care Costs Money … and Money Comes in Boxes
Things Work Best When the Money & the Patients are in the Same Place
15
The Message about Quality
• For Quality to be Sustainable, Patients & Money have to be Matched
• It is Hard to Move Patients, but Easy to Move Money
• Activity Based Funding is NOT necessarily a stimulus
• It is a way of Making Sure Money can move to Support Care Where it is Most Needed
16
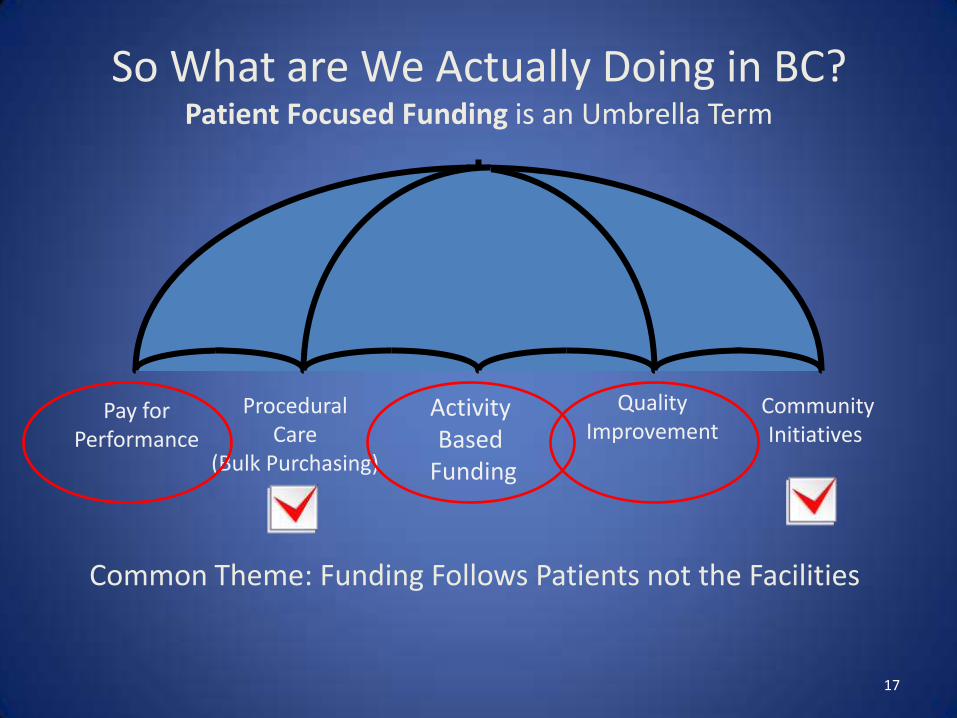
So What are We Actually Doing in BC?Patient Focused Funding is an Umbrella Term
Activity Based
Funding
ProceduralCare
(Bulk Purchasing)
CommunityInitiatives
Pay forPerformance
QualityImprovement
Common Theme: Funding Follows Patients not the Facilities
17
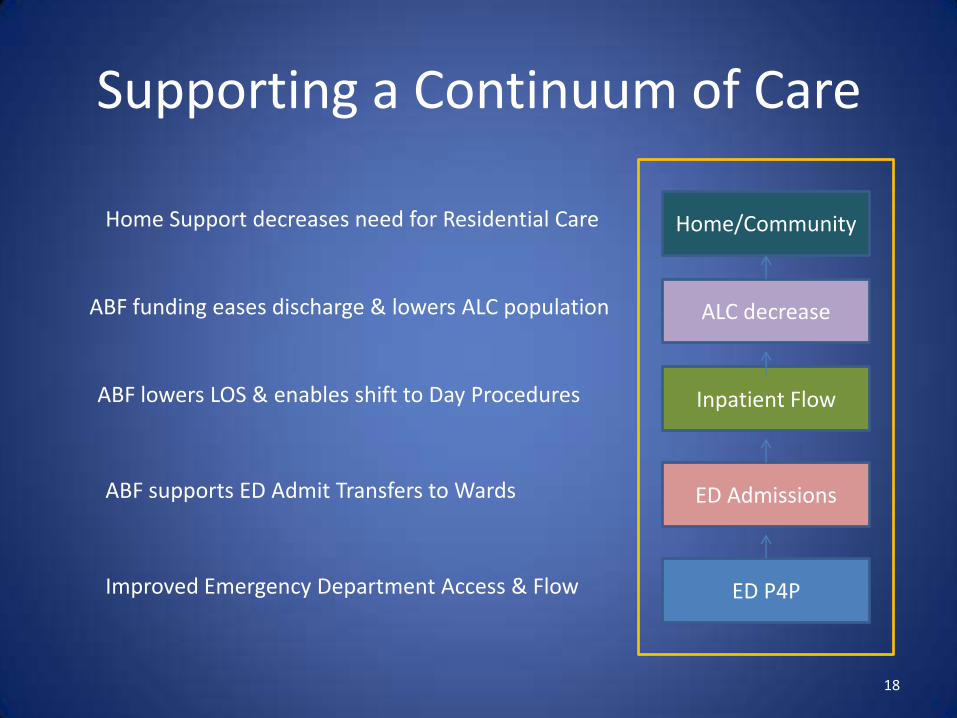
Supporting a Continuum of Care
Home/CommunityHome Support decreases need for Residential Care
ED P4PImproved Emergency Department Access & Flow
ALC decrease
ED AdmissionsABF supports ED Admit Transfers to Wards
ABF lowers LOS & enables shift to Day Procedures Inpatient Flow
ABF funding eases discharge & lowers ALC population
18
19
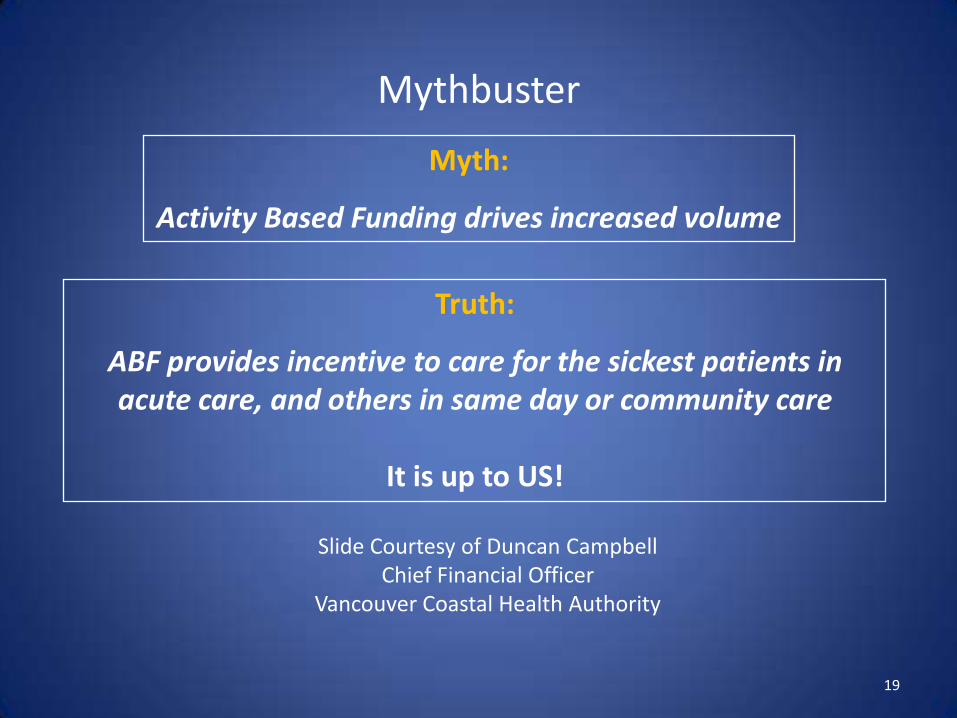
Mythbuster
Myth:
Activity Based Funding drives increased volume
Truth:
ABF provides incentive to care for the sickest patients in acute care, and others in same day or community care
It is up to US!
Slide Courtesy of Duncan CampbellChief Financial Officer
Vancouver Coastal Health Authority

From Theory to Reality
The Vancouver Coastal Health Experience with Patient Focused Funding
20
Vancouver Coastal HealthPatient Focused Funding
What Have We Achieved and Where
Will It Take Us
Quality Forum
Darcia Pope, Executive Director, Transformation
March 9, 2012
22
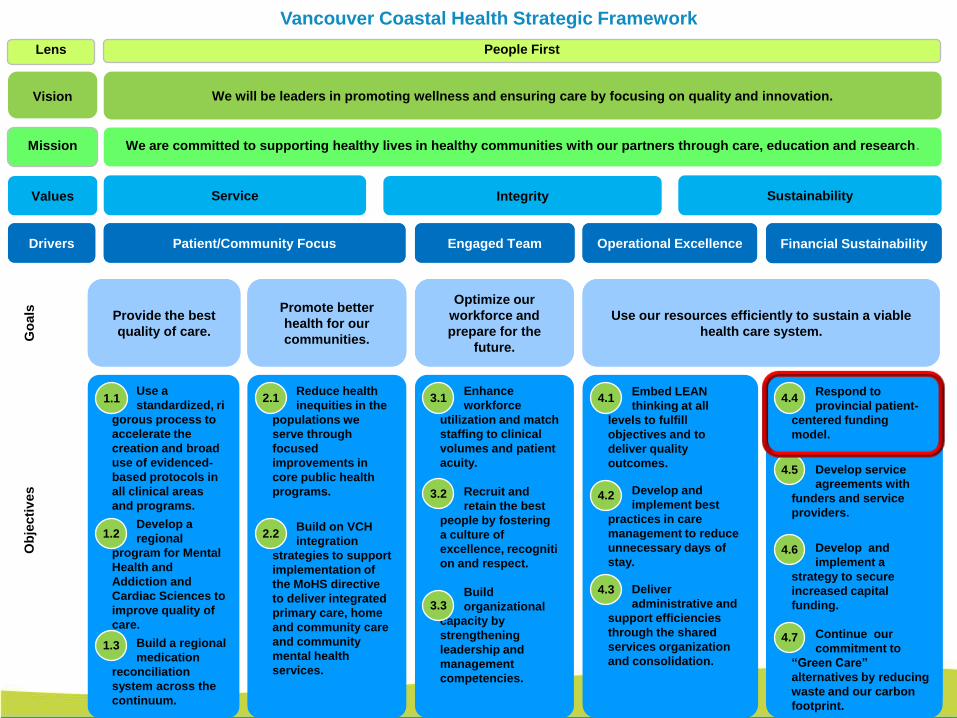
Vancouver Coastal Health Strategic Framework
Lens People First
Vision We will be leaders in promoting wellness and ensuring care by focusing on quality and innovation.
Mission We are committed to supporting healthy lives in healthy communities with our partners through care, education and research.
Values Service Integrity Sustainability
Drivers Patient/Community Focus Engaged Team Operational Excellence Financial Sustainability
Go
als
Ob
jecti
ves
Provide the best
quality of care.
Promote better
health for our
communities.
Optimize our
workforce and
prepare for the
future.
Use our resources efficiently to sustain a viable
health care system.
Use a
standardized, ri
gorous process to
accelerate the
creation and broad
use of evidenced-
based protocols in
all clinical areas
and programs.
Develop a
regional
program for Mental
Health and
Addiction and
Cardiac Sciences to
improve quality of
care.
Build a regional
medication
reconciliation
system across the
continuum.
Reduce health
inequities in the
populations we
serve through
focused
improvements in
core public health
programs.
Build on VCH
integration
strategies to support
implementation of
the MoHS directive
to deliver integrated
primary care, home
and community care
and community
mental health
services.
Enhance
workforce
utilization and match
staffing to clinical
volumes and patient
acuity.
Recruit and
retain the best
people by fostering
a culture of
excellence, recogniti
on and respect.
Build
organizational
capacity by
strengthening
leadership and
management
competencies.
Embed LEAN
thinking at all
levels to fulfill
objectives and to
deliver quality
outcomes.
Develop and
implement best
practices in care
management to reduce
unnecessary days of
stay.
Deliver
administrative and
support efficiencies
through the shared
services organization
and consolidation.
Respond to provincial
patient-centered
funding model.
Develop service
agreements with
funders and service
providers.
Develop and
implement a strategy to
secure increased
capital funding.
Continue our
commitment to “Green
Care” alternatives by
reducing waste and our
carbon footprint.
Respond to
provincial patient-
centered funding
model.
Develop service
agreements with
funders and service
providers.
Develop and
implement a
strategy to secure
increased capital
funding.
Continue our
commitment to
“Green Care”
alternatives by reducing
waste and our carbon
footprint.
1.1
1.2
1.3
2.1
2.2
3.1
3.2
4.1
4.2
4.3
4.4
4.5
4.6
4.7
3.3
Drivers Engaged TeamPatient/Community Focus
Optimize our
workforce and
prepare for the
future.
Provide the best
quality of care.
Promote better
health for our
communities.
Use our resources efficiently to sustain a viable
health care system.
Operational Excellence Financial Sustainability
23
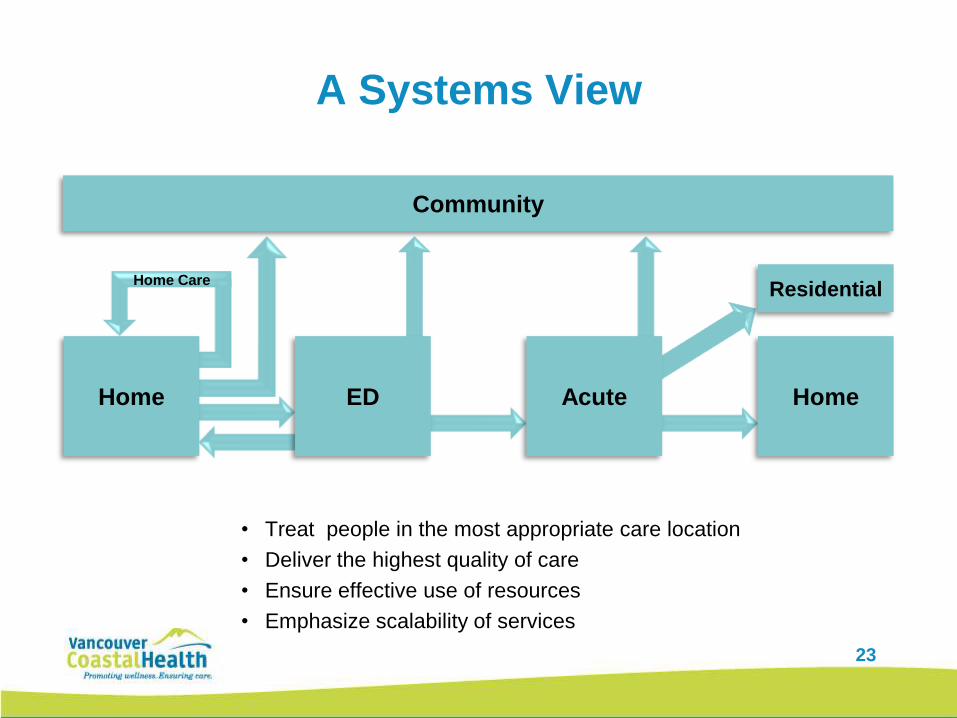
A Systems View
• Treat people in the most appropriate care location
• Deliver the highest quality of care
• Ensure effective use of resources
• Emphasize scalability of services
Home Care
Home ED Home
Residential
Acute
Community
24
Examples of Pay for Performance at VCH
1. P4P in the Emergency Department
2. Activity Based Funding in Acute Care
3. Procedural Care
4. National Surgical Quality Improvement Program
(NSQIP) Implementation
5. Community Initiatives
25
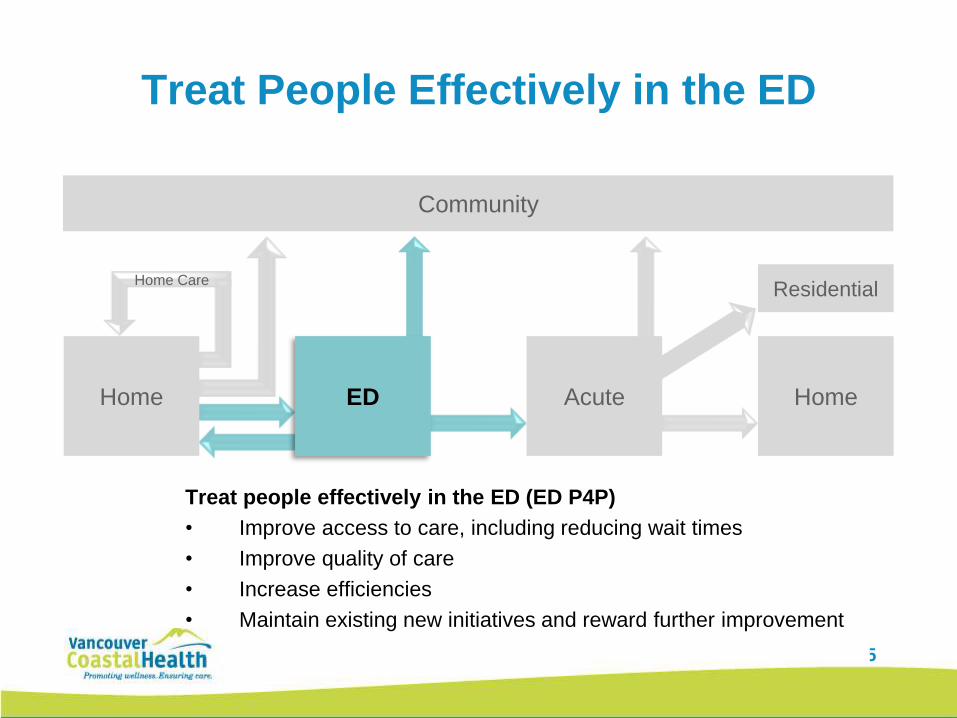
Treat People Effectively in the ED
Treat people effectively in the ED (ED P4P)
• Improve access to care, including reducing wait times
• Improve quality of care
• Increase efficiencies
• Maintain existing new initiatives and reward further improvement
Home Care
Home ED Home
Residential
Acute
Community
26
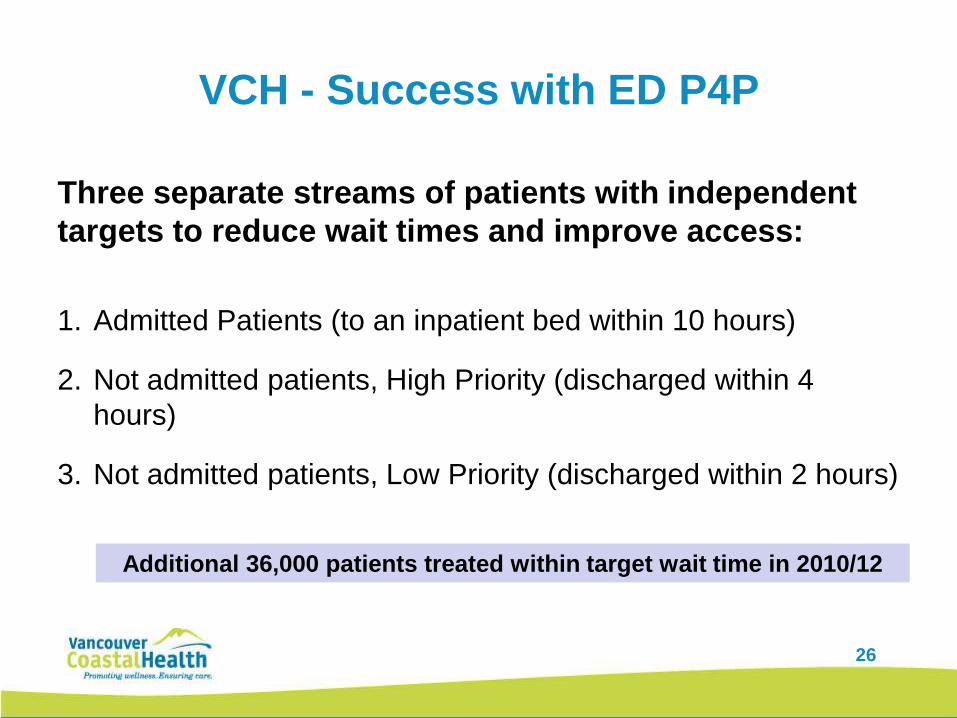
VCH - Success with ED P4P
Three separate streams of patients with independent
targets to reduce wait times and improve access:
1. Admitted Patients (to an inpatient bed within 10 hours)
2. Not admitted patients, High Priority (discharged within 4
hours)
3. Not admitted patients, Low Priority (discharged within 2 hours)
Additional 36,000 patients treated within target wait time in 2010/12
27
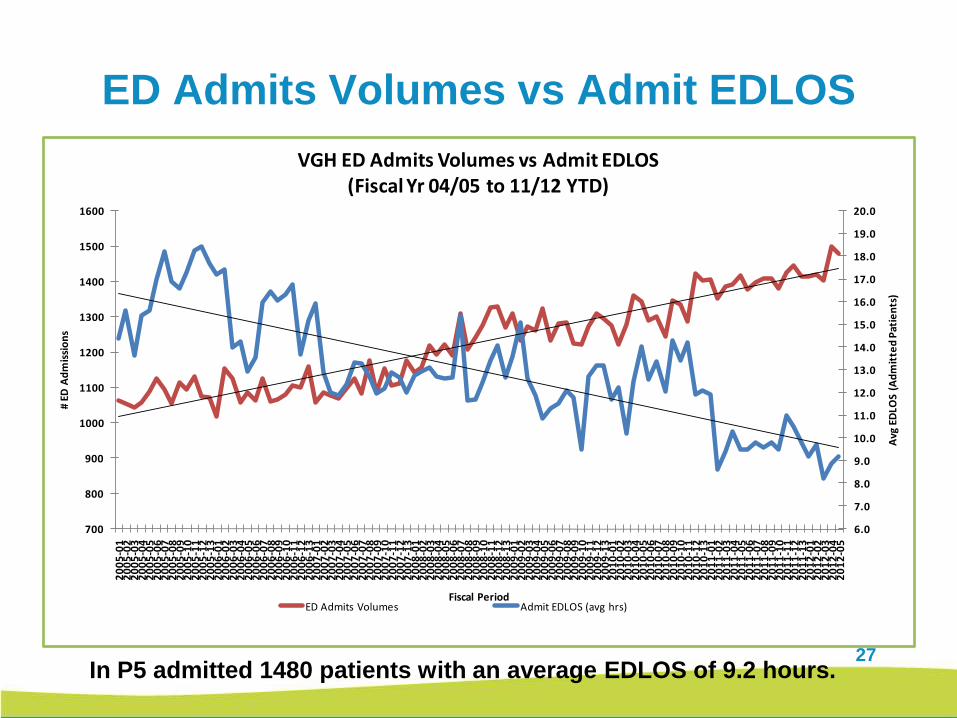
ED Admits Volumes vs Admit EDLOS
In P5 admitted 1480 patients with an average EDLOS of 9.2 hours.
6.0
7.0
8.0
9.0
10.0
11.0
12.0
13.0
14.0
15.0
16.0
17.0
18.0
19.0
20.0
700
800
900
1000
1100
1200
1300
1400
1500
1600
20
05
-01
20
05
-02
20
05
-03
20
05
-04
20
05
-05
20
05
-06
20
05
-07
20
05
-08
20
05
-09
20
05
-10
20
05
-11
20
05
-12
20
05
-13
20
06
-01
20
06
-02
20
06
-03
20
06
-04
20
06
-05
20
06
-06
20
06
-07
20
06
-08
20
06
-09
20
06
-10
20
06
-11
20
06
-12
20
06
-13
20
07
-01
20
07
-02
20
07
-03
20
07
-04
20
07
-05
20
07
-06
20
07
-07
20
07
-08
20
07
-09
20
07
-10
20
07
-11
20
07
-12
20
07
-13
20
08
-01
20
08
-02
20
08
-03
20
08
-04
20
08
-05
20
08
-06
20
08
-07
20
08
-08
20
08
-09
20
08
-10
20
08
-11
20
08
-12
20
08
-13
20
09
-01
20
09
-02
20
09
-03
20
09
-04
20
09
-05
20
09
-06
20
09
-07
20
09
-08
20
09
-09
20
09
-10
20
09
-11
20
09
-12
20
09
-13
20
10
-01
20
10
-02
20
10
-03
20
10
-04
20
10
-05
20
10
-06
20
10
-07
20
10
-08
20
10
-09
20
10
-10
20
10
-11
20
10
-12
20
10
-13
20
11
-01
20
11
-02
20
11
-03
20
11
-04
20
11
-05
20
11
-06
20
11
-07
20
11
-08
20
11
-09
20
11
-10
20
11
-11
20
11
-12
20
11
-13
20
12
-01
20
12
-02
20
12
-03
20
12
-04
20
12
-05
Avg
ED
LOS
(Ad
mit
ted
Pat
ien
ts)
# E
D A
dm
issi
on
s
Fiscal Period
VGH ED Admits Volumes vs Admit EDLOS(Fiscal Yr 04/05 to 11/12 YTD)
ED Admits Volumes Admit EDLOS (avg hrs)
28
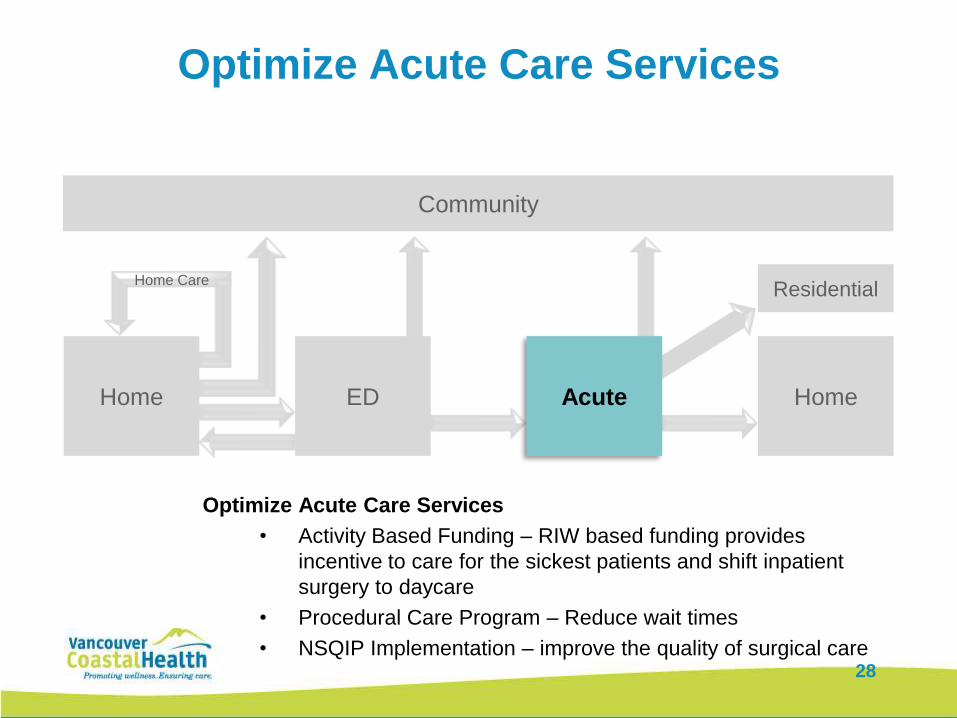
Optimize Acute Care Services
Optimize Acute Care Services
• Activity Based Funding – RIW based funding provides
incentive to care for the sickest patients and shift inpatient
surgery to daycare
• Procedural Care Program – Reduce wait times
• NSQIP Implementation – improve the quality of surgical care
Home Care
Home ED Home
Residential
Acute
Community
28
29
Activity vs. Gobal Funding
for Acute Care
• The shift from global funding to activity based funding has
helped VCH to achieve desired performance, behaviour
change and transformation of systems across
acute, community and primary care service
• Goal:
To move acute care to outpatient services
To decrease length of stay
30
Activity Based Funding at VCH
• The ABF model for inpatient and same day procedures
provides a tool for VCH to focus on service level changes and
reallocate resources accordingly
• The marginal funding rate fosters the requirement for efficiency
and cost management
• VCH continues to work with physicians and Health Records to
improve quality and timeliness to ensure funding reflects acuity
levels accurately
• The ED P4P earnings + RIW earnings equals the cost of
opening extra beds
31
Procedural Care Program
• The Procedural Care Program was established
to reduce the wait times for patients waiting the
longest for care:
• “Top 10” Day Surgeries
• VCH Selected Procedures with High Wait Times
• Surgical and Medical Procedures Mainly Performed in
Procedure Rooms
• Magnetic Resonance Imaging (MRI) Exams
32
15
20
25
30
35
40
452
01
0-0
8
20
10
-09
20
10
-10
20
10
-11
20
10
-12
20
11
-01
20
11
-02
20
11
-03
Month End
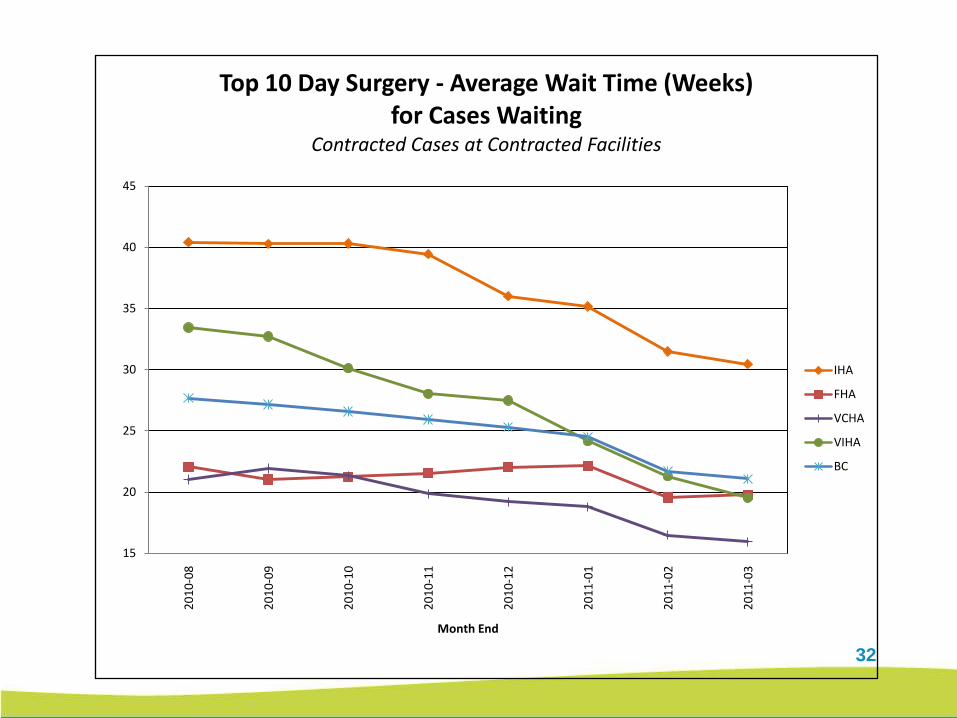
Top 10 Day Surgery - Average Wait Time (Weeks) for Cases Waiting
Contracted Cases at Contracted Facilities
IHA
FHA
VCHA
VIHA
BC
33
33
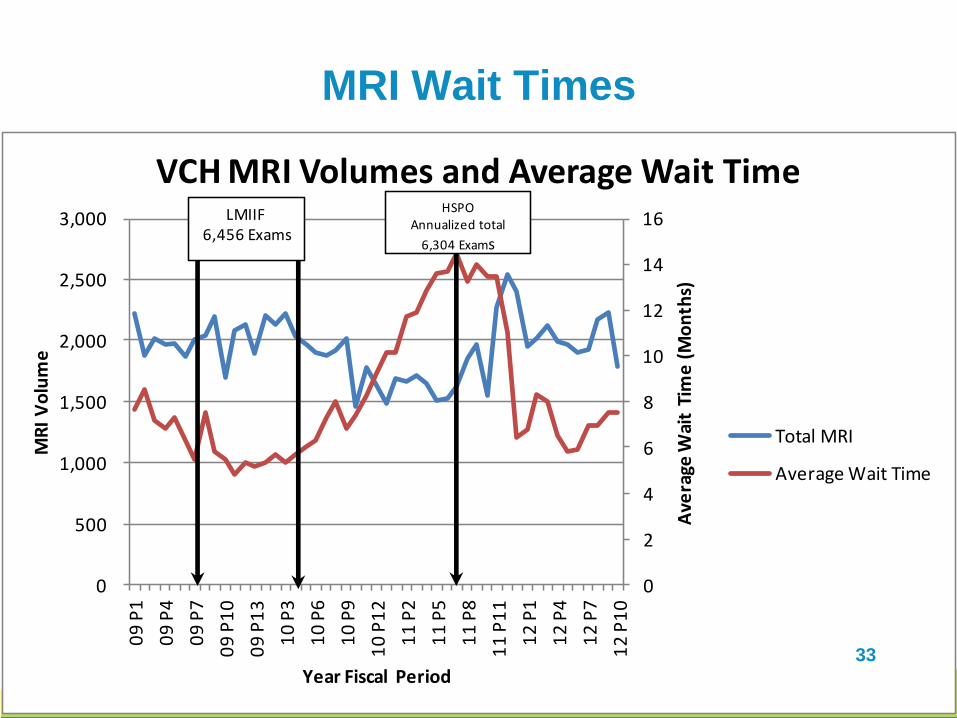
MRI Wait Times
0
2
4
6
8
10
12
14
16
0
500
1,000
1,500
2,000
2,500
3,000
09
P1
09
P4
09
P7
09
P1
0
09
P1
3
10
P3
10
P6
10
P9
10
P1
2
11
P2
11
P5
11
P8
11
P1
1
12
P1
12
P4
12
P7
12
P1
0
Ave
rage
Wai
t Ti
me
(M
on
ths)
MR
I V
olu
me
Year Fiscal Period
VCH MRI Volumes and Average Wait Time
Total MRI
Average Wait Time
LMIIF6,456 Exams
HSPOAnnualized total
6,304 Exams
33
34
NSQIP Program
• Thesis: improve overall surgical outcomes by joining the
American College of Surgeons’ National Surgical Quality
Improvement Project
• In October of 2002, the U.S. Institute of Medicine named
NSQIP the “best in the nation” for measuring and
reporting surgical quality and outcomes
• Data can be used to help:
– increase patient satisfaction
– reduce the median length of stay
– reduce postoperative mortality rates
35
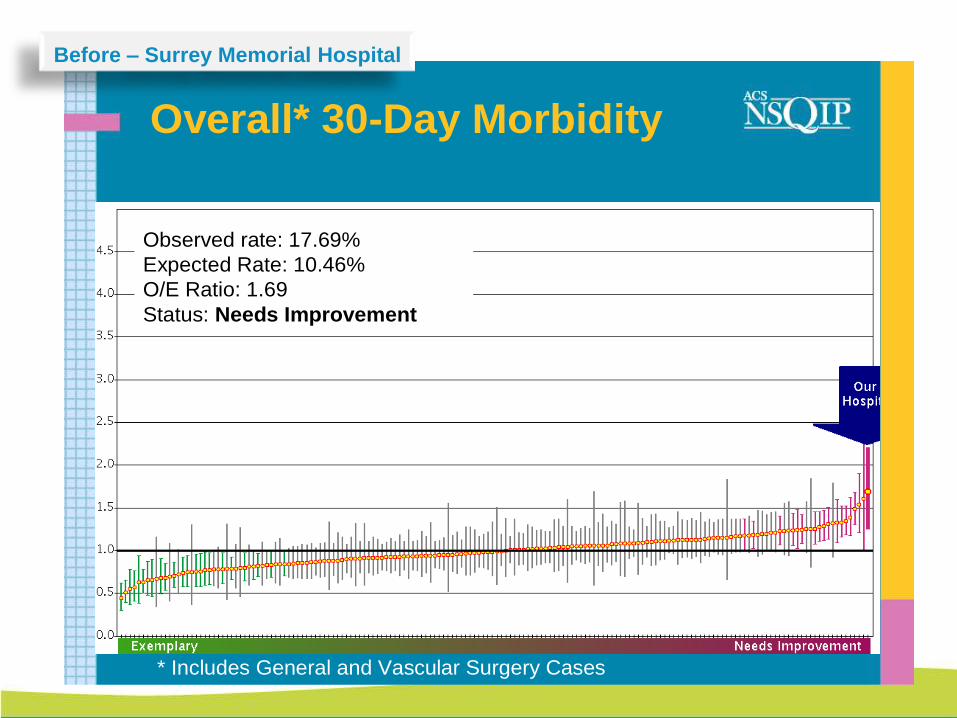
Overall* 30-Day Morbidity
* Includes General and Vascular Surgery Cases
Observed rate: 17.69%
Expected Rate: 10.46%
O/E Ratio: 1.69
Status: Needs Improvement
Before – Surrey Memorial Hospital
36
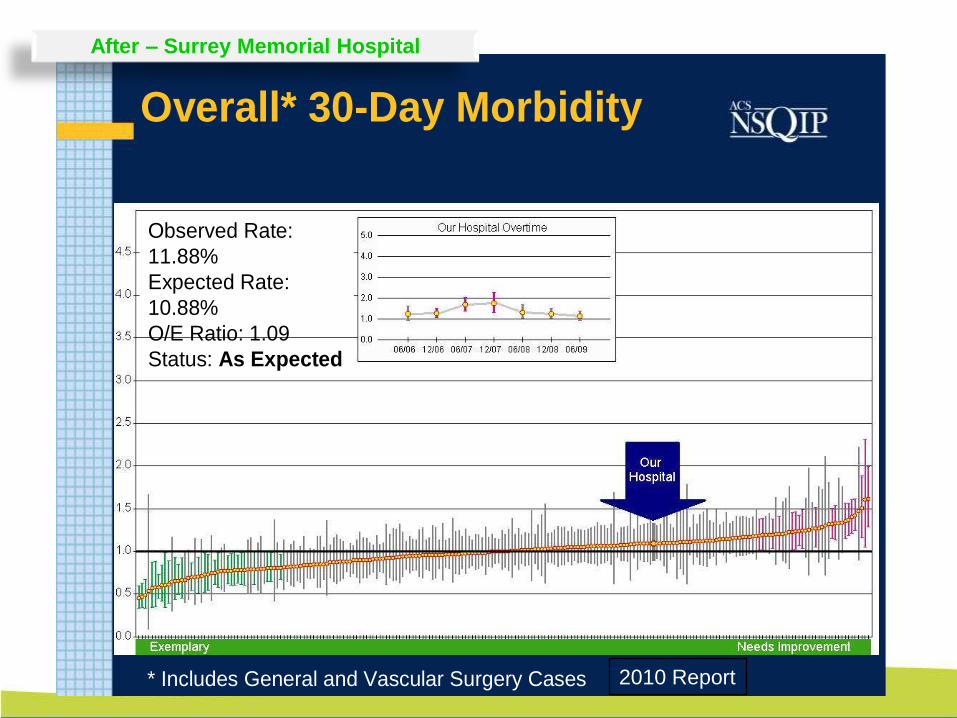
Overall* 30-Day Morbidity
* Includes General and Vascular Surgery Cases
Observed Rate:
11.88%
Expected Rate:
10.88%
O/E Ratio: 1.09
Status: As Expected
2010 Report
After – Surrey Memorial Hospital
37
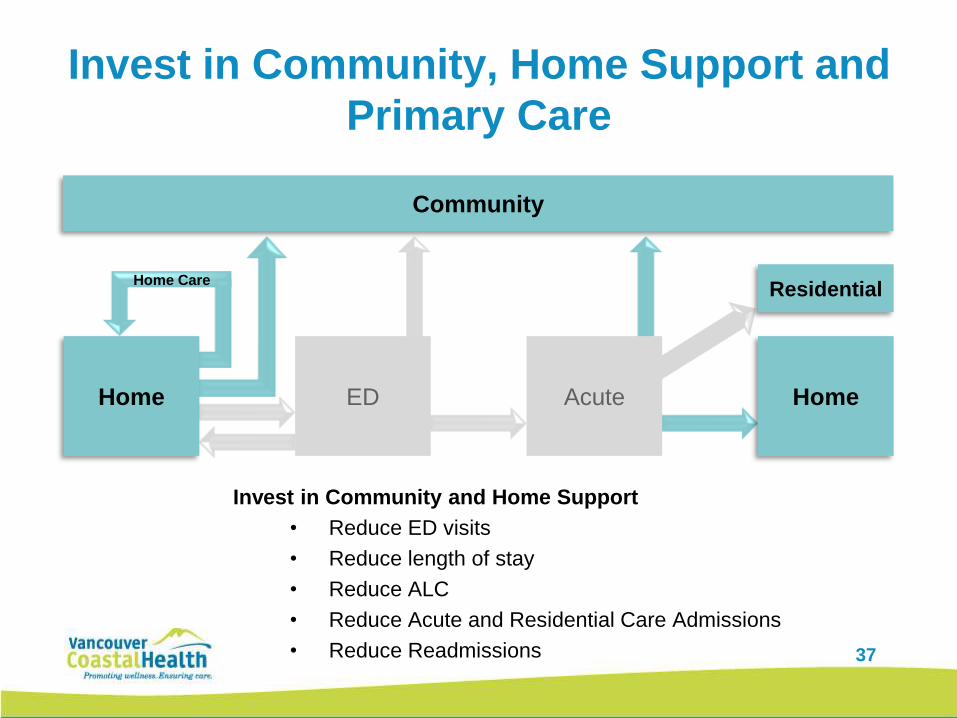
Invest in Community, Home Support and
Primary Care
Home Care
Invest in Community and Home Support
• Reduce ED visits
• Reduce length of stay
• Reduce ALC
• Reduce Acute and Residential Care Admissions
• Reduce Readmissions
Home Home
Residential
Acute
Community
ED
38
Avoidance of Unnecessary Residential
Care and Acute Admissions (AURAA)
• A comprehensive set of community-based services
designed to provide proactive care to prevent
exacerbation of known complex disease
• Will prevent avoidable ED, Acute and Residential Care
admissions and reduce LOS amongst the population at
highest risk, while improving overall health status at
home
• Targets:
– Decrease RC use by 6 months per client
– Reduction in ALC days by 30% per client continued…
39
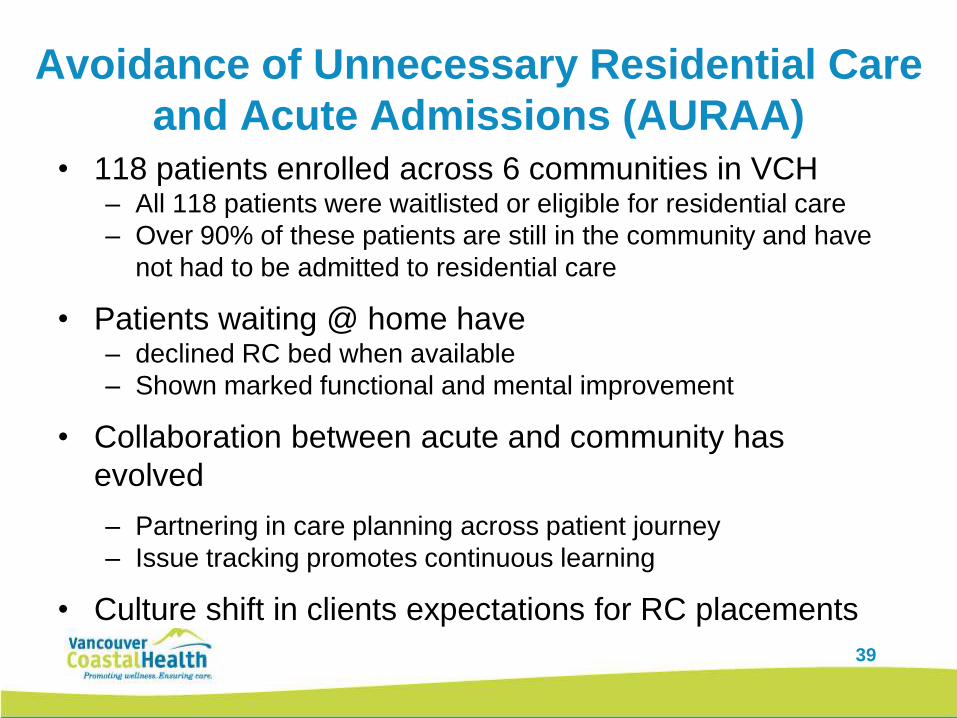
Avoidance of Unnecessary Residential Care
and Acute Admissions (AURAA)• 118 patients enrolled across 6 communities in VCH
– All 118 patients were waitlisted or eligible for residential care
– Over 90% of these patients are still in the community and have
not had to be admitted to residential care
• Patients waiting @ home have– declined RC bed when available
– Shown marked functional and mental improvement
• Collaboration between acute and community has
evolved
– Partnering in care planning across patient journey
– Issue tracking promotes continuous learning
• Culture shift in clients expectations for RC placements
40
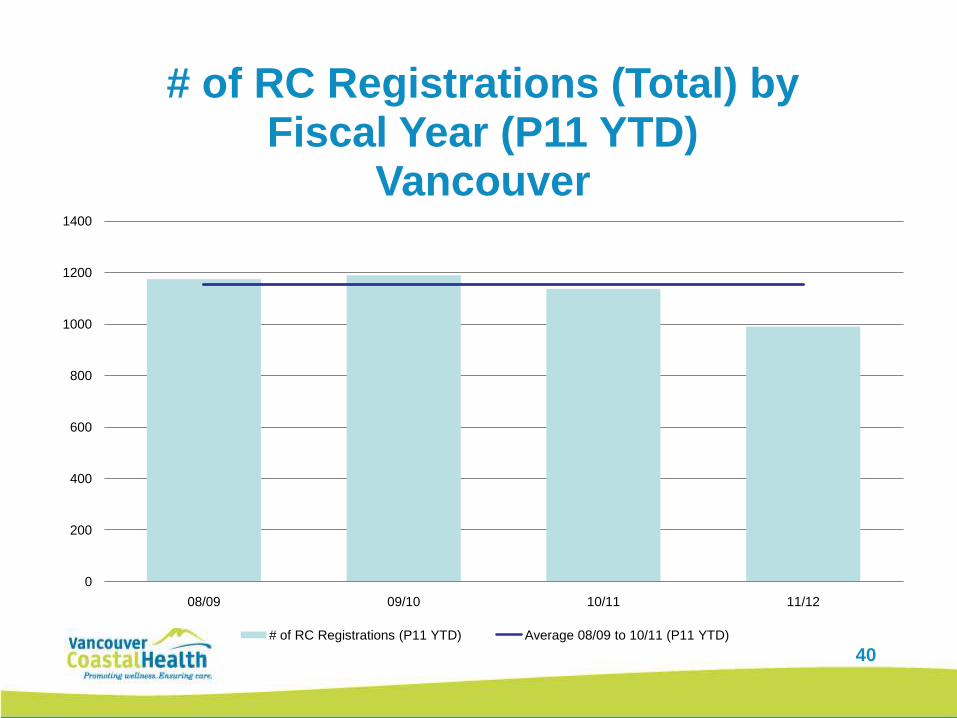
0
200
400
600
800
1000
1200
1400
08/09 09/10 10/11 11/12
# of RC Registrations (Total) by Fiscal Year (P11 YTD)
Vancouver
# of RC Registrations (P11 YTD) Average 08/09 to 10/11 (P11 YTD)
41
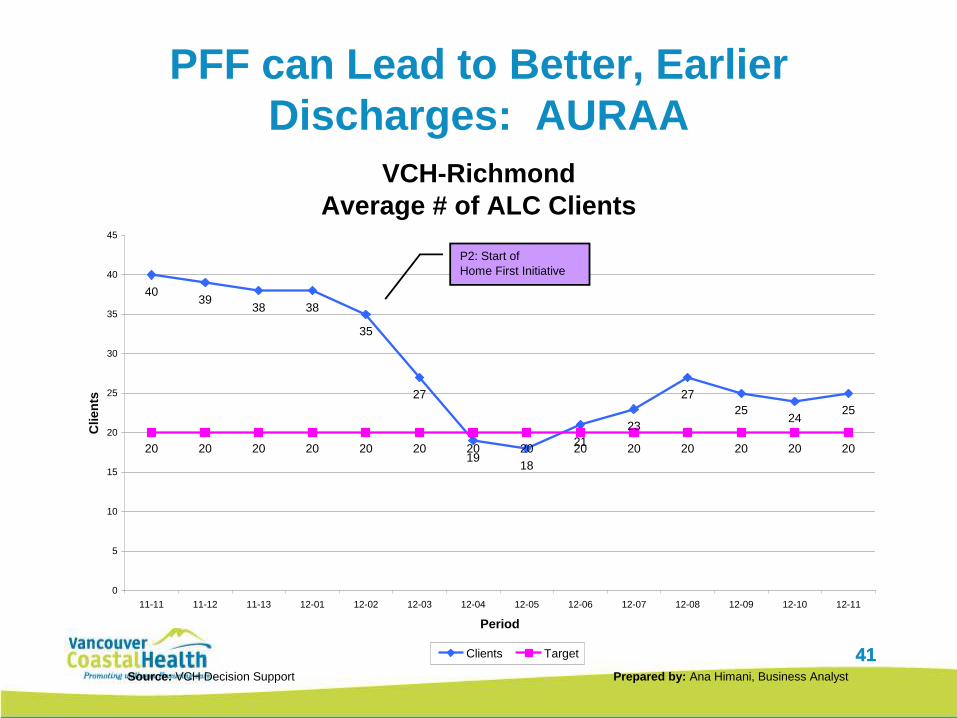
PFF can Lead to Better, Earlier
Discharges: AURAA
41
VCH-Richmond
Average # of ALC Clients
4039
38 38
35
27
1918
21
23
27
2524
25
20 20 20 20 20 20 20 20 20 20 20 20 20 20
0
5
10
15
20
25
30
35
40
45
11-11 11-12 11-13 12-01 12-02 12-03 12-04 12-05 12-06 12-07 12-08 12-09 12-10 12-11
Period
Clien
ts
Clients Target
Source: VCH Decision Support Prepared by: Ana Himani, Business Analyst
P2: Start of
Home First Initiative
42
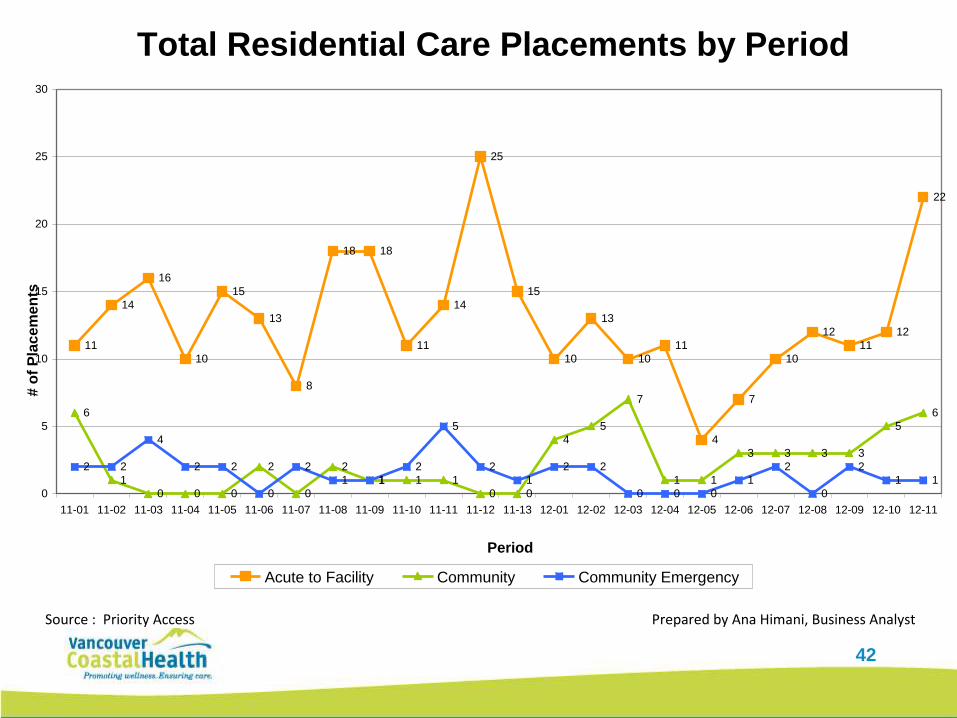
Total Residential Care Placements by Period
11
14
16
10
15
13
8
18 18
11
14
25
15
10
13
10
11
4
7
10
12
11
12
22
6
1
0 0 0
2
0
2
1 1 1
0 0
4
5
7
1 1
3 3 3 3
5
6
2 2
4
2 2
0
2
1 1
2
5
2
1
2 2
0 0 0
1
2
0
2
1 1
0
5
10
15
20
25
30
11-01 11-02 11-03 11-04 11-05 11-06 11-07 11-08 11-09 11-10 11-11 11-12 11-13 12-01 12-02 12-03 12-04 12-05 12-06 12-07 12-08 12-09 12-10 12-11
Period
# o
f P
lacem
en
ts
Acute to Facility Community Community Emergency
Source : Priority Access Prepared by Ana Himani, Business Analyst

43
You can lead a horse to water but can
you make it drink? 43
44
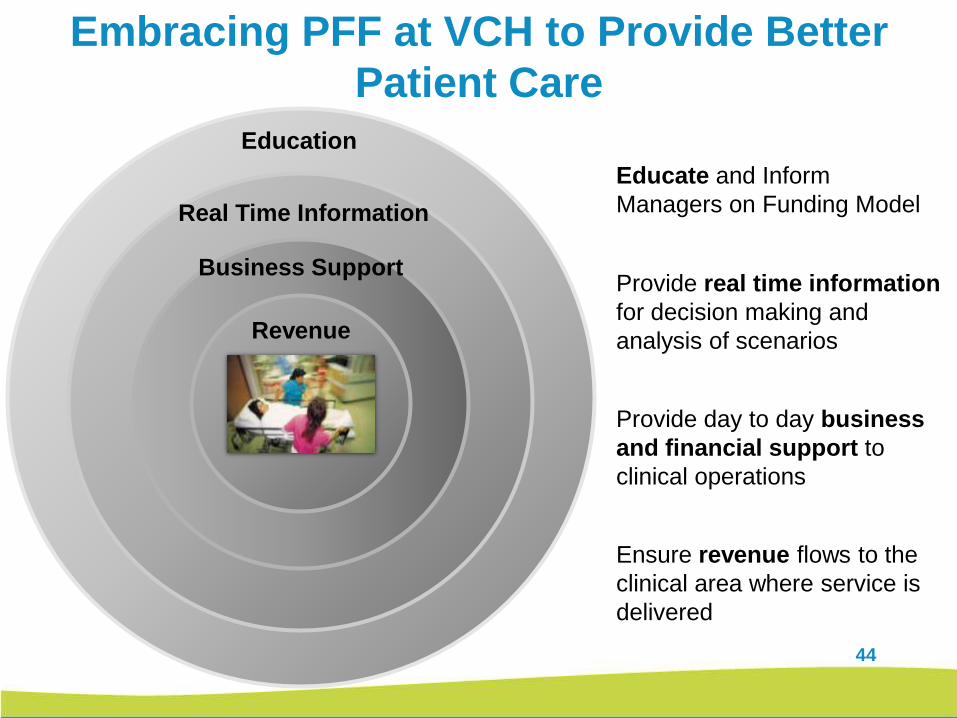
Embracing PFF at VCH to Provide Better
Patient Care
Educate and Inform
Managers on Funding Model
Education
Provide real time information
for decision making and
analysis of scenarios
Real Time Information
Provide day to day business
and financial support to
clinical operations
Business Support
Ensure revenue flows to the
clinical area where service is
delivered
Revenue
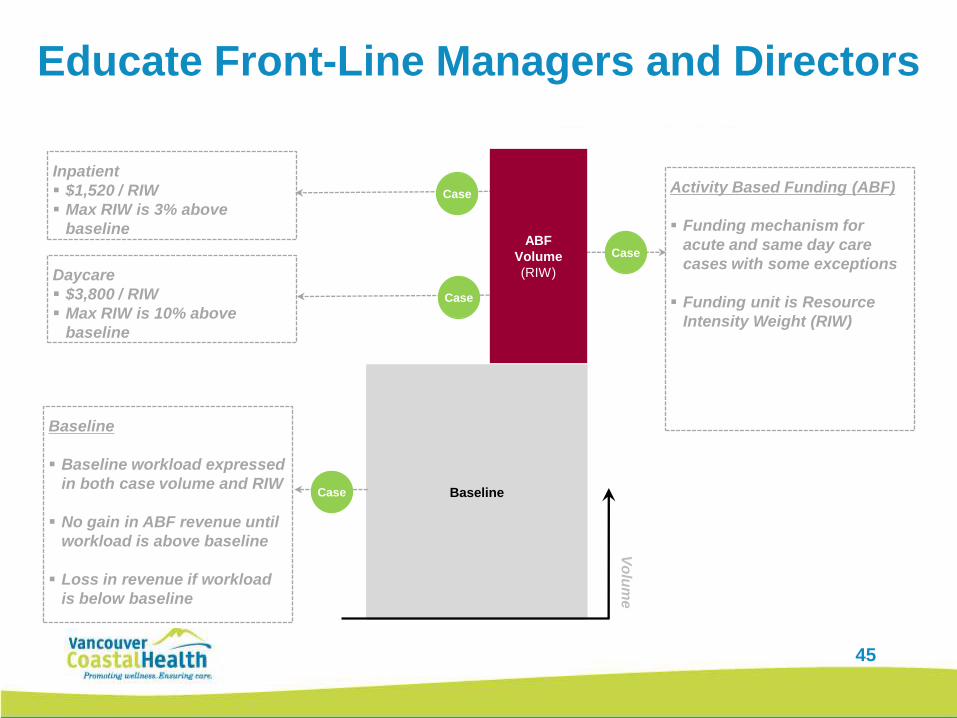
Educate Front-Line Managers and Directors
Baseline
Vo
lum
e
Baseline
Baseline workload expressed
in both case volume and RIW
No gain in ABF revenue until
workload is above baseline
Loss in revenue if workload
is below baseline
Activity Based Funding (ABF)
Funding mechanism for
acute and same day care
cases with some exceptions
Funding unit is Resource
Intensity Weight (RIW)
Case
Case
Daycare
$3,800 / RIW
Max RIW is 10% above
baseline
Inpatient
$1,520 / RIW
Max RIW is 3% above
baseline
Case
Case
ABF
Volume
(RIW)
45
46
Utilizing Emendo Cap Plan to Forecast
Patient Volume and ABF Revenue
How VCH is utilizing the tool:
• Includes 3 years of history and current activity to forecast demand and trends
• Shift from producing a manual retrospective report to look at ABF revenue to
forecasting ABF revenue and analyzing “what if” scenarios
• Determine impact on capacity and strive to exceed projected discharge targets to
create capacity
• Develop a plan and budget and project revenue stream
• Establish baseline, input RIWs and see how volumes have increased or decreased
Objectives of Cap Plan Forecasting Tool at VCH:
• Optimize the match between staffing and clinical volumes
• Optimize productive hours per patient day and reduce overtime by planning for
fluctuations in demand
• Exceed Discharge targets to create capacity for incoming volumes
• Predict ABF Revenue
47
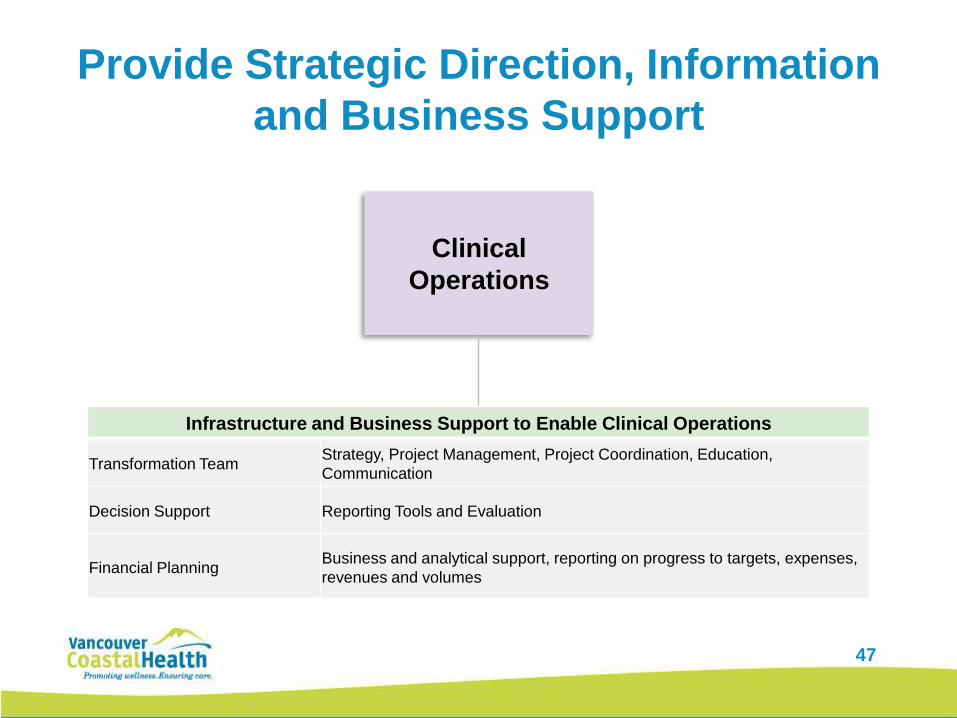
Provide Strategic Direction, Information
and Business Support
Clinical
Operations
Infrastructure and Business Support to Enable Clinical Operations
Transformation TeamStrategy, Project Management, Project Coordination, Education,
Communication
Decision Support Reporting Tools and Evaluation
Financial PlanningBusiness and analytical support, reporting on progress to targets, expenses,
revenues and volumes
48
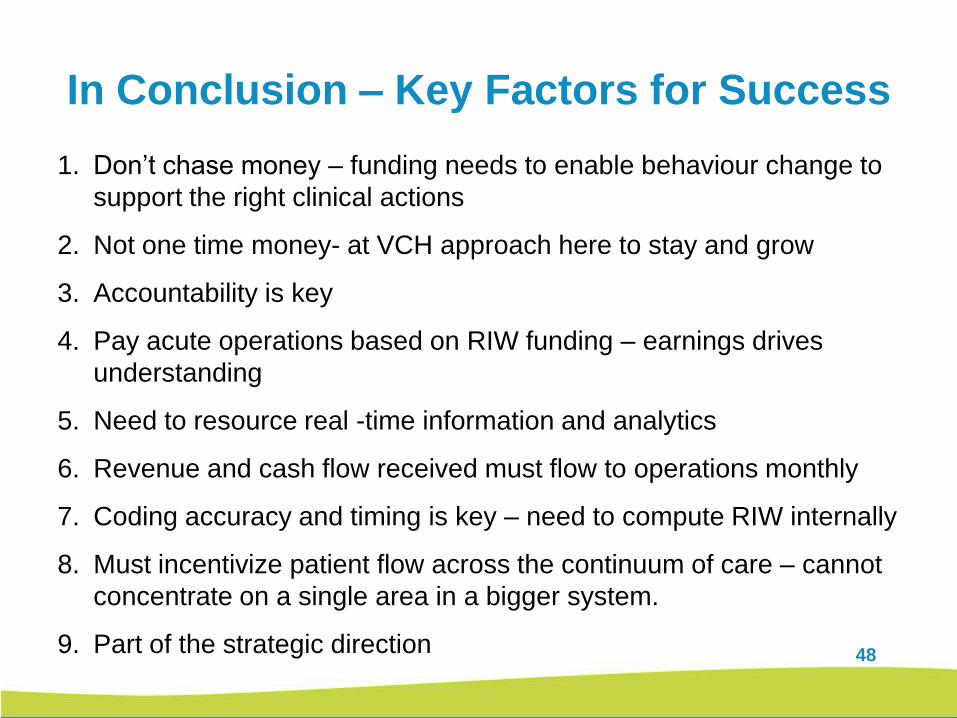
In Conclusion – Key Factors for Success
1. Don’t chase money – funding needs to enable behaviour change to
support the right clinical actions
2. Not one time money- at VCH approach here to stay and grow
3. Accountability is key
4. Pay acute operations based on RIW funding – earnings drives
understanding
5. Need to resource real -time information and analytics
6. Revenue and cash flow received must flow to operations monthly
7. Coding accuracy and timing is key – need to compute RIW internally
8. Must incentivize patient flow across the continuum of care – cannot
concentrate on a single area in a bigger system.
9. Part of the strategic direction

49
Questions?
50
Appendices
51
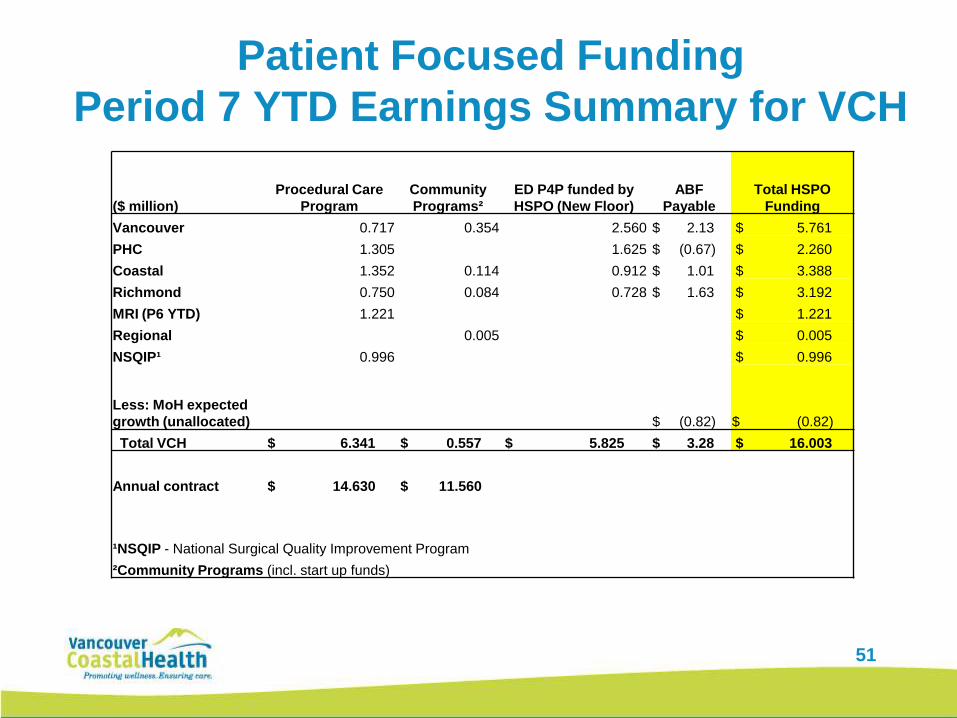
Patient Focused Funding
Period 7 YTD Earnings Summary for VCH
($ million)
Procedural Care
Program
Community
Programs²
ED P4P funded by
HSPO (New Floor)
ABF
Payable
Total HSPO
Funding
Vancouver 0.717 0.354 2.560 $ 2.13 $ 5.761
PHC 1.305 1.625 $ (0.67) $ 2.260
Coastal 1.352 0.114 0.912 $ 1.01 $ 3.388
Richmond 0.750 0.084 0.728 $ 1.63 $ 3.192
MRI (P6 YTD) 1.221 $ 1.221
Regional 0.005 $ 0.005
NSQIP¹ 0.996 $ 0.996
Less: MoH expected
growth (unallocated) $ (0.82) $ (0.82)
Total VCH $ 6.341 $ 0.557 $ 5.825 $ 3.28 $ 16.003
Annual contract $ 14.630 $ 11.560
¹NSQIP - National Surgical Quality Improvement Program
²Community Programs (incl. start up funds)
52
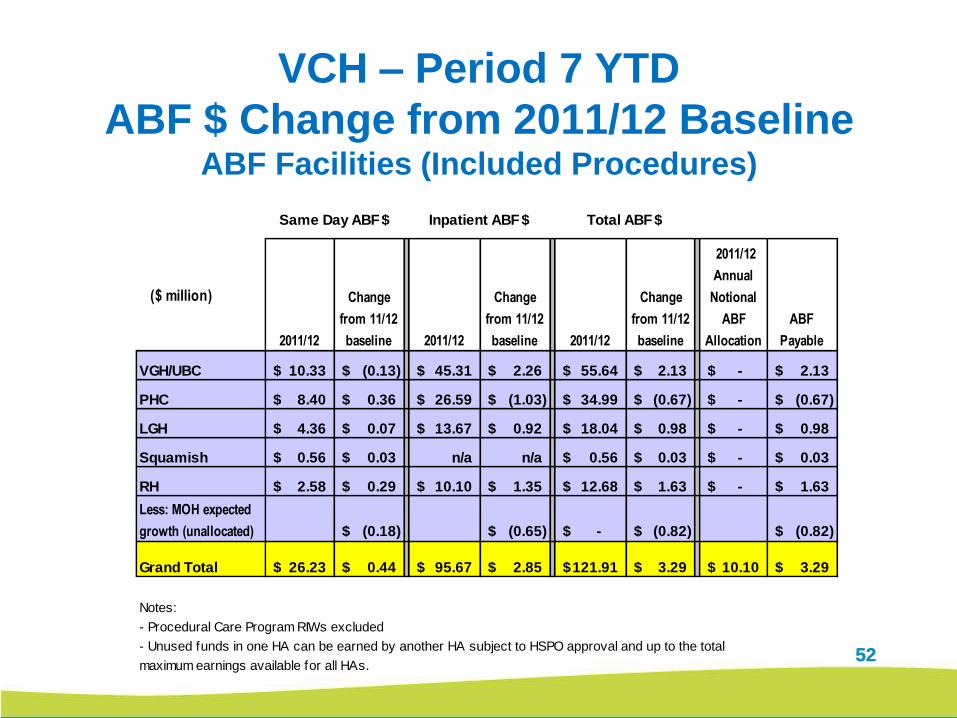
VCH – Period 7 YTD
ABF $ Change from 2011/12 BaselineABF Facilities (Included Procedures)
52
($ million)
2011/12
Change
from 11/12
baseline 2011/12
Change
from 11/12
baseline 2011/12
Change
from 11/12
baseline
2011/12
Annual
Notional
ABF
Allocation
ABF
Payable
VGH/UBC 10.33$ (0.13)$ 45.31$ 2.26$ 55.64$ 2.13$ -$ 2.13$
PHC 8.40$ 0.36$ 26.59$ (1.03)$ 34.99$ (0.67)$ -$ (0.67)$
LGH 4.36$ 0.07$ 13.67$ 0.92$ 18.04$ 0.98$ -$ 0.98$
Squamish 0.56$ 0.03$ n/a n/a 0.56$ 0.03$ -$ 0.03$
RH 2.58$ 0.29$ 10.10$ 1.35$ 12.68$ 1.63$ -$ 1.63$
(0.18)$ (0.65)$ -$ (0.82)$ (0.82)$
Grand Total 26.23$ 0.44$ 95.67$ 2.85$ 121.91$ 3.29$ 10.10$ 3.29$
Notes:
- Procedural Care Program RIWs excluded
- Unused funds in one HA can be earned by another HA subject to HSPO approval and up to the total
maximum earnings available for all HAs.
Same Day ABF $ Inpatient ABF $ Total ABF $
Less: MOH expected
growth (unallocated)
53
VCH PFF Community Projects
• Avoidance of Unnecessary Residential Care and Acute
Admissions (AURAA)
• Early Supported Discharge – Chronic Disease
• ED Adverse Drug Events Screening
• Home Based Treatment for Mental Health and Addiction
• Supporting Transition of Seniors from Emergency