Embed Size (px)
Citation preview

FOURTH FUSE PHYSICAL ACTIVITY WORKSHOP
Have wearable cameras taught us anything about measuring physical activity?
Dr Paul Kelly
Physical Activity for Health Research Centre (PAHRC) Institute for Sport, Physical Education and Health Sciences
University of Edinburgh
15th May 2015
Physical Activity for Health Research Centre (PAHRC)

Introductions
Paul
Physical Activity for
Health Research Centre
(PAHRC)
Prof Nanette Mutrie MBE

MSc Physical Activity for Health
Applications open now for September 2015 start

Describe the physical activity behaviours you did yesterday…

“Physical Activity Epidemiology”
“I walked to work” “I cycled to town”
“I went to the gym” “I went for a run”
“I tidied the house” “I worked in the garden”
“I sat at a computer screen
for 8 hours”

“Physical Activity Epidemiology”
“I moved my hip/wrist in 3 dimensions”
“I raised my heart rate”
“I changed my geographic
location”
“I allowed my metabolic rate to remain low”
How do we think about
measurement?

FOURTH FUSE PHYSICAL ACTIVITY WORKSHOP
Have wearable cameras taught us anything about measuring physical activity?

Wearable camera images

Study 1:
Active travel behaviour

Percentage of adults meeting physical activity recommendations:
NHANES (self report): 50%
Accelerometer: 5% (Troiano et al, 2009)
Self-report questionnaire: 38%
Accelerometer: 5% (HSE, 2009)
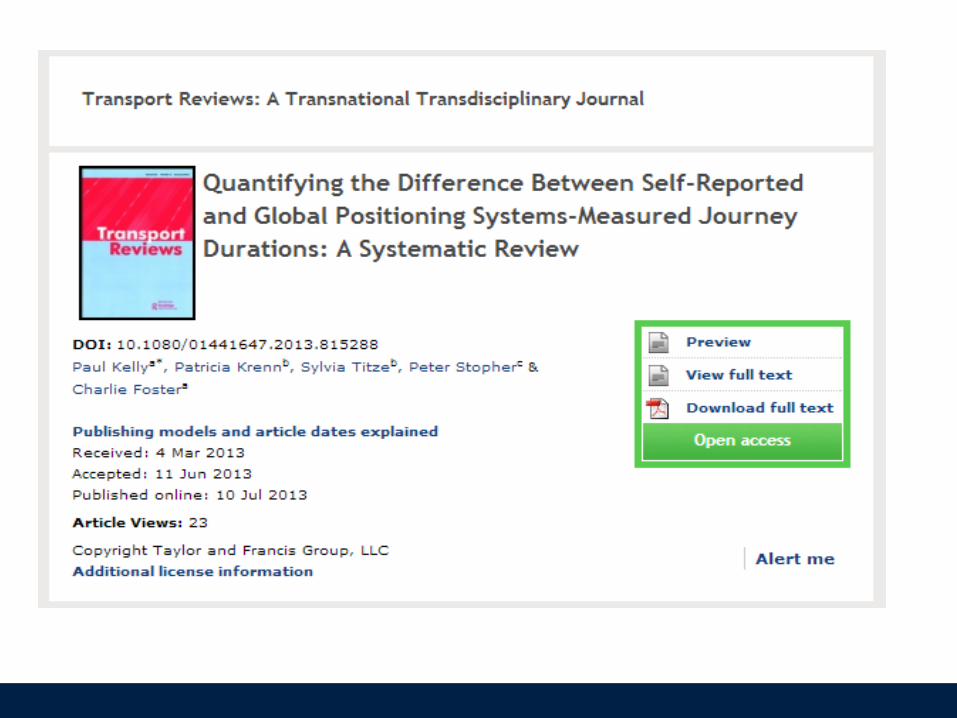


Journey time = 20 minutes

Journey time = 12 min 48 sec

-5000
-4000
-3000
-2000
-1000
0
1000
2000
3000
4000
5000
0 1000 2000 3000 4000 5000 6000 7000
Dif
fere
nce
be
twe
en
Se
nse
Cam
an
d d
iary
(se
con
ds)
Average of SenseCam and diary (seconds)
Reporting error at the day level
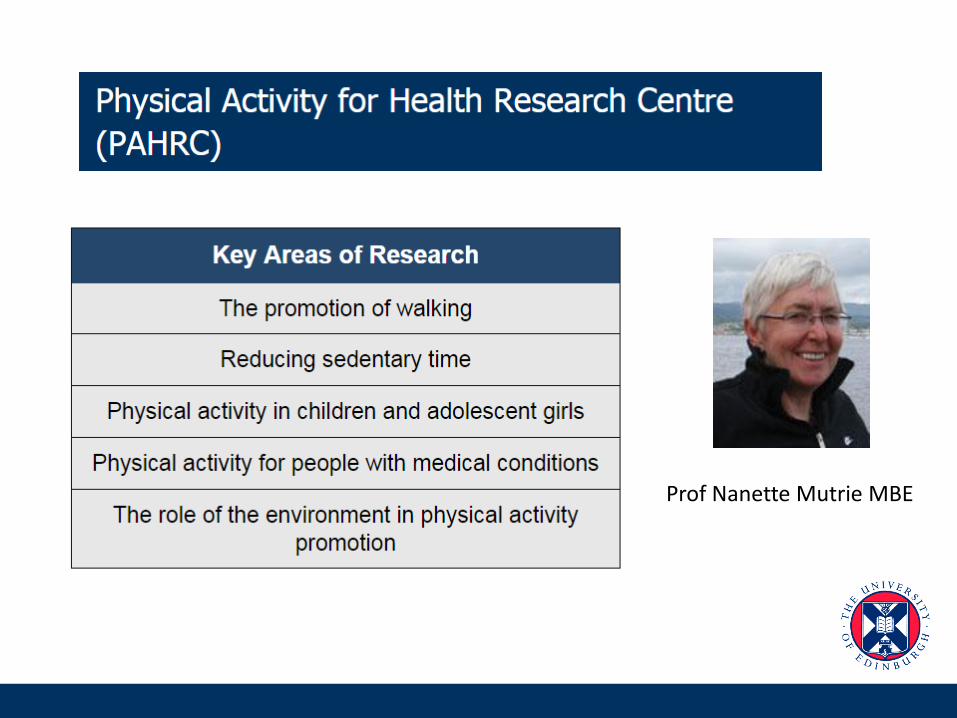
Kelly et al., (2014) Journal of Transport and Health
Lower limit-of-agreement = -50:29 min
Bias = +1:41 min
Upper limit-of-agreement = +53:41 min

1 2 3 4 5??
1 2 3 4 5

-5000
-4000
-3000
-2000
-1000
0
1000
2000
3000
4000
5000
0 1000 2000 3000 4000 5000 6000 7000
Dif
fere
nce
be
twe
en
Se
nse
Cam
an
d d
iary
(se
con
ds)
Average of SenseCam and diary (seconds)
Reporting error at the day level
Kelly et al., (2014) Journal of Transport and Health
Lower limit-of-agreement = -50:29 min
Bias = +1:41 min
Upper limit-of-agreement = +53:41 min


Percentage of adults meeting physical activity recommendations:
NHANES (self report): 50%
Accelerometer: 5% (Troiano et al, 2009)
Self-report questionnaire: 38%
Accelerometer: 5% (HSE, 2009)

What have wearable cameras taught us about measuring
physical activity?
1. Self reported active travel is good enough for describing groups
(Good enough for your behavioural epidemiology?)

What have wearable cameras taught us about measuring
physical activity?
2. Self reported travel does not look like it can detect change at the individual level
(without multiple measurements – perhaps 10)

What have wearable cameras taught us about measuring
physical activity? 3. Wearable cameras are feasible (more
scalable) alternative to direct observation for validation

Percentage of adults meeting physical activity recommendations:
NHANES (self report): 50%
Accelerometer: 5% (Troiano et al, 2009)
Self-report questionnaire: 38%
Accelerometer: 5% (HSE, 2009)

“Physical Activity Epidemiology”
“I walked to work” “I cycled to town”
“I went to the gym” “I went for a run”
“I tidied the house” “I worked in the garden”
“I sat at a computer screen
for 8 hours”

“Physical Activity Epidemiology”
“I moved my hip/wrist in 3 dimensions”
“I raised my heart rate”
“I changed my geographic
location”
“I allowed my metabolic rate to remain low”

Do our measures and methods have
content or face validity?
Content validity – the extent to which a
measure assesses the construct of interest

In our hunt for precision, have we forgotten
to consider content and face validity?

http://www.biomedcentral.com/content/pdf/s12966-014-0132-x.pdf
“Physical Activity Epidemiology”

Cycling: Risk of all-cause mortality reduced by 10%
Relative risk = 0.90 (0.87-0.94)
7 studies, 187,000 individuals and 2.1 million person- years
Mean age = 56; Mean follow-up = 14.2 years
Exposure = 11.25 MET.hrs per week

Relative risk = 0.89 (0.83-0.96)
14 studies, 280,000 individuals and 2.6 million person years
Mean age = 56; Mean follow-up 10.1 years Exposure = 11.25 MET.hrs per week
Walking: Risk of all-cause mortality reduced by 11%

Matthews et al., 2007

Matthews et al., 2007 Matthews et al., 2007
Transportation-related activity was assessed with four questions that asked about time spent (minutes/day) walking to and from work, walking for other reasons (e.g., household errands), cycling to and from work, and cycling for other reasons.
Behaviour or energy expenditure?

(Leisure Time Physical Activity and Mortality, Fons Johnsen, Nina; Ekblond, Annette; Thomsen, Birthe; Overvad,
Kim; Tjonneland, Anne, Epidemiology. 24(5):717-725, September 2013. DOI: 10.1097/EDE.0b013e31829e3dda)
TABLE 3 . Mortality Rate Ratios and 95% CIs of All-cause Mortality According to Participation in Six Types of Leisure Time Physical Activity Among 29,129 Women and 26,576 Men in the Diet, Cancer and Health Study, Denmark, 1993-1997
© 2013 by Lippincott Williams & Wilkins, Inc. Published by Lippincott Williams & Wilkins, Inc.
Referent group: less than 2 hours per week
Exposed group: more than 2 hours per week

Not just one question…


Direct observation would be best for behaviour…

Are wearable cameras an alternative to direct
observation?


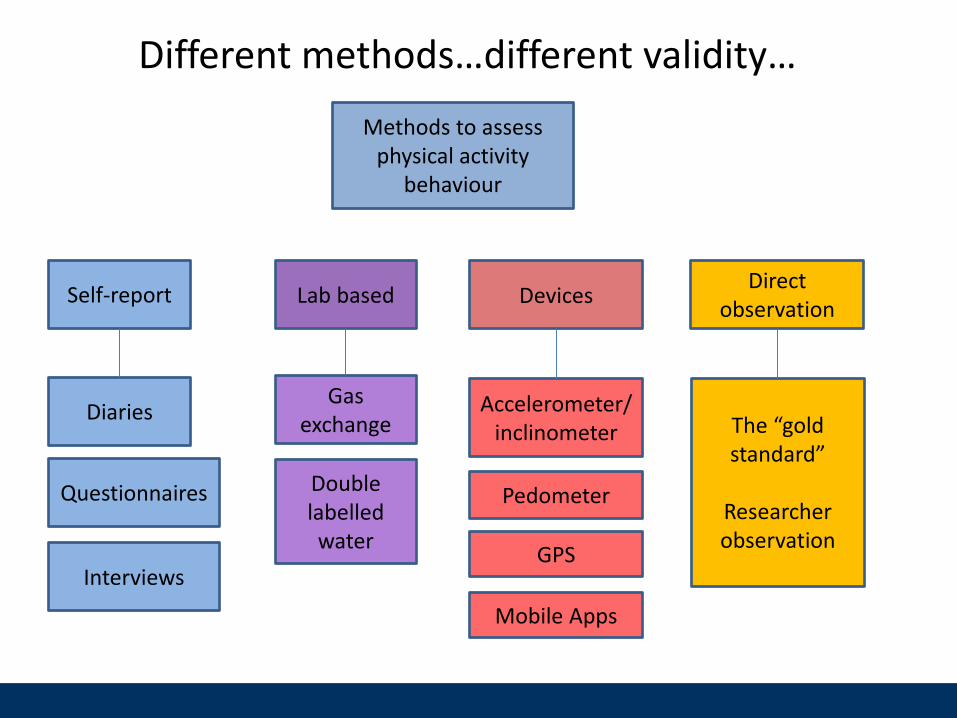
Different methods…different validity…
Questionnaires
Self-report Lab based
Diaries
Pedometer
Accelerometer/ inclinometer
Direct observation
The “gold standard”
Researcher observation
Gas exchange
Devices
GPS
Mobile Apps
Double labelled water
Methods to assess physical activity
behaviour
Interviews
Questionnaires
Self-report Lab based
Diaries
Pedometer
Accelerometer/ inclinometer
Direct observation
Gas exchange
Devices
GPS
Mobile Apps
Double labelled water
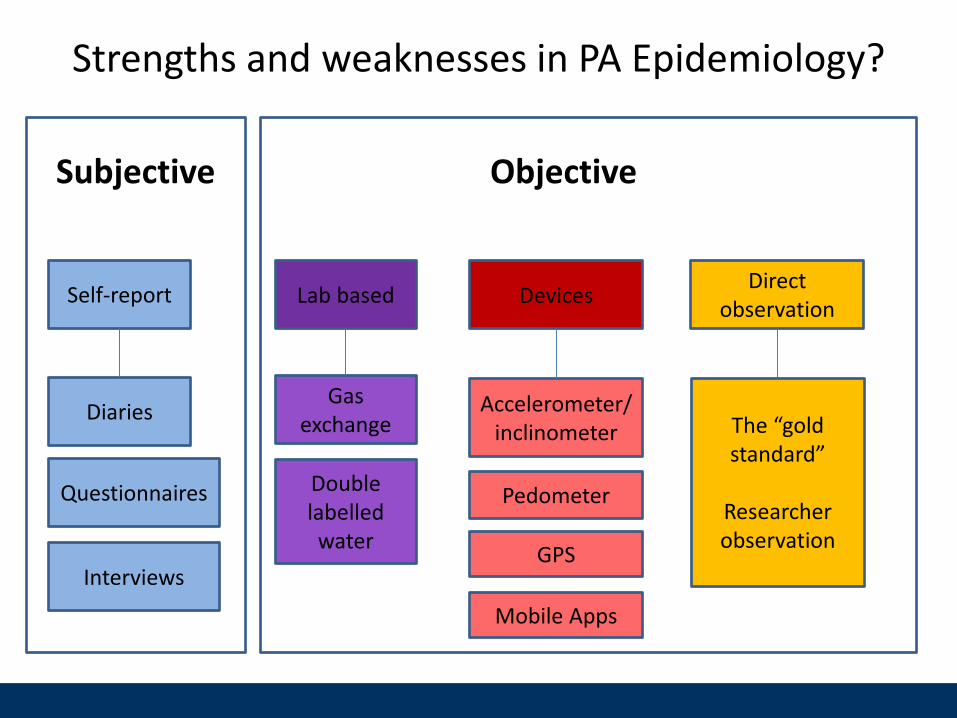
Subjective Objective
Interviews
Different methods… Strengths and weaknesses in PA Epidemiology?
The “gold standard”
Researcher observation

ReliabilityValidity
Test validity
Face validity
Convergent validity
Absolute validity (gold
standard)
Construct validity
Criterion validity
Inter-instrument reliability
Intra-instrument reliability
Absolute reliability
Inter-raterreliability
Intra-raterreliability
Test-retest reliability
Assessment depends on research design and nature of data. Statistical tests may include Bland Altman plots, paired t-tests,
interclass correlation coefficient, coefficient of variation, Pearson’s r, percentage agreement. Consider whether data are continuous,
ordinal or categorical.
Assessment usually theoretical
examination or expert consensus
Relative reliability
Concurrent validity
Experimental validity
Content validity
Internal validity
External validity
Examination of sources of bias.
Internal: reactivity, missing data, drop out
External: selection, generalizability
Does it measure what we think it
measures?
Does it do this consistently?
Validity Reliability

Physical Activity Epidemiology
1. Convergent validity – do scores from 2 measures
correlate or agree? (see also predictive validity)
2. Criterion validity – does a score from a measure
correlate or agree with a criterion or gold standard?
3. Face validity – to what extent am I measuring the
construct of interest?

Physical Activity Epidemiology
3. Face validity – to what extent am I measuring the
construct of interest?
E.g. Are we counting steps and forgetting to measure
(and understand) walking behaviour?

ReliabilityValidity
Test validity
Face validity
Convergent validity
Absolute validity (gold
standard)
Construct validity
Concurrent or predictive
Inter- and Intra-
measure reliability
Absolute reliability
Inter- and intra-rater
reliability
Test-retest reliability
Assessment depends on research design and nature of data. Statistical tests may include Bland Altman plots, paired t-tests,
interclass correlation coefficient, coefficient of variation, Pearson’s r, percentage agreement. Consider whether data are continuous,
ordinal or categorical.
Assessment usually theoretical
examination or expert consensus
Relative reliability
Criterion validity
Experimental validity
Content validity
Internal validity
External validity
Examination of sources of bias.
Internal: reactivity, missing data, drop out
External: selection, generalizability
Within and between
individuals
Kelly et al, 2015

Study 2:
24 hour behaviour

CAPTURE-24 Comparing Annotated Pictures with Time-Use Diaries’
Report of Events over 24-hours

Funders and Research Team
• This project is supported by the British Heart Foundation, the Wellcome Trust and the UK Economic and Social Research Council (ESRC).
• The research team:
– Professor Jonathan Gershuny (Principal Investigator) – Associate Professor Charlie Foster (Principal Investigator) – Dr. Teresa Harms (Research Lead, CTUR) – Dr. Aiden Doherty – Emma Thomas (Research Lead, DPH) – Dr. Paul Kelly (Edinburgh University)

HETUS UK Time Use Diary

Axivity AX3 Band accelerometer


24 hour time-use
45 different activities
Time spent in various activities
Time spent in locations
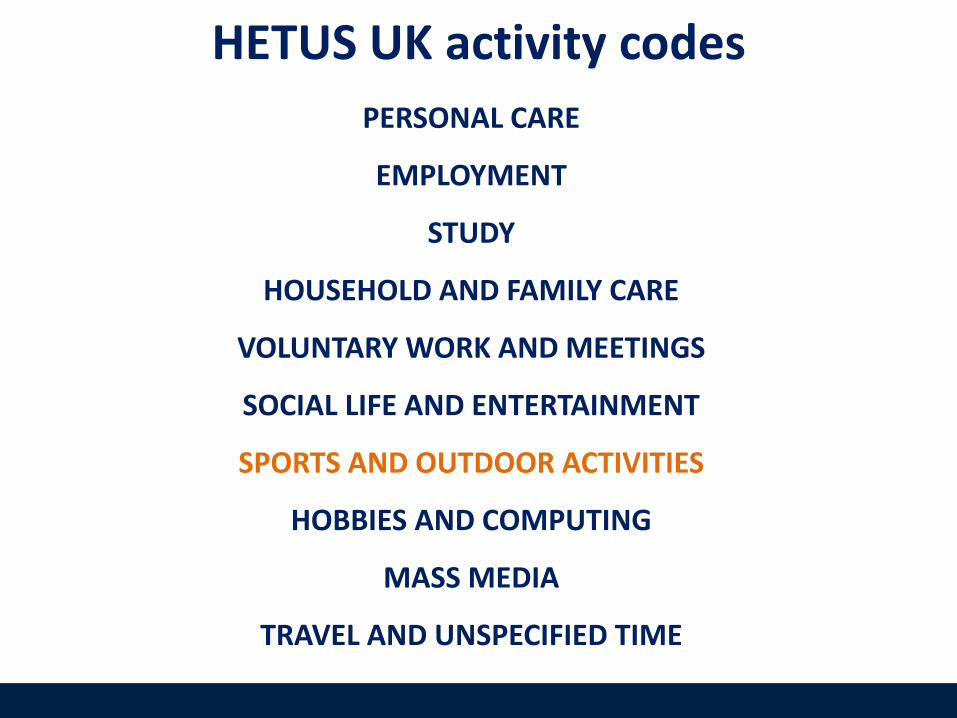
HETUS UK activity codes
PERSONAL CARE
EMPLOYMENT
STUDY
HOUSEHOLD AND FAMILY CARE
VOLUNTARY WORK AND MEETINGS
SOCIAL LIFE AND ENTERTAINMENT
SPORTS AND OUTDOOR ACTIVITIES
HOBBIES AND COMPUTING
MASS MEDIA
TRAVEL AND UNSPECIFIED TIME
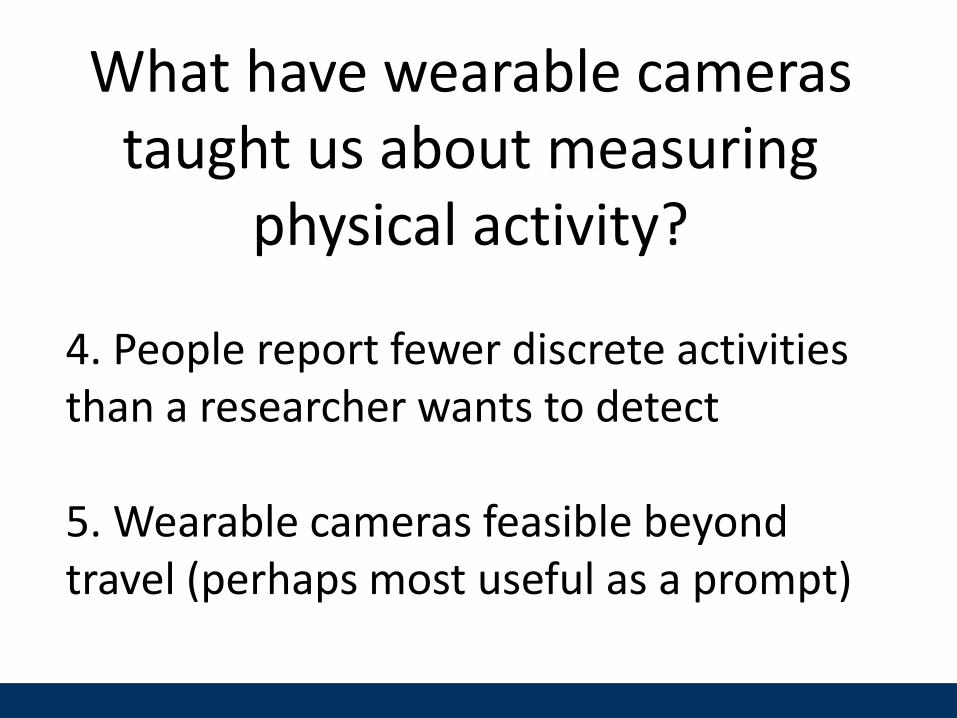
What have wearable cameras taught us about measuring
physical activity? 4. People report fewer discrete activities than a researcher wants to detect 5. Wearable cameras feasible beyond travel (perhaps most useful as a prompt)
Next step:
N = 150 study underway
81 participants completed
Validation of 24 hour time-use diaries
And converted MET scores?

Other research…?

Travel environment
24 hour food intake
Food purchasing behaviour
PA in chronic pain and breast cancer patients
Memory research
Energy expenditure with GPS

In summary…

What have wearable cameras taught us about measuring physical activity?

1. Self reported travel is good enough for describing groups (Good enough for your epidemiology?)
2. Self reported travel does not look like it can detect change at the individual level (without multiple measurements)
3. Wearable cameras are feasible (more scalable) alternative to direct observation for validation
4. People report fewer discrete activities than a researcher wants to detect
5. Wearable cameras feasible beyond travel – perhaps most useful as a prompt

“Physical Activity Epidemiology”
“I walked to work” “I cycled to town”
“I went to the gym” “I tidied the house”
“I worked in the garden”
“I sat at a computer screen for 8 hours”

“Physical Activity Epidemiology”
“I moved my hip/wrist in 3 dimensions”
I raised my heart rate”
“I changed my geographic
location”
“I allowed my metabolic rate to remain low”

Physical Activity Epidemiology
Content and face validity – to what extent am I
measuring the construct of interest?
E.g. Are we counting steps and forgetting to measure
(and understand) walking behaviour?

Wearable cameras…the future of physical activity measurement…?


Pedometer vs. Moves App n=1 (me!); 51 days of data

Pedometer vs. Moves App
Mean diff = 89 steps LoA = ±4243

In summary
In physical activity epidemiology, have we neglected content and face validity?
Are wearable cameras a scalable alternative to
direct researcher observation?

FOURTH FUSE PHYSICAL ACTIVITY WORKSHOP
Any questions?
15th May 2015
Physical Activity for Health Research Centre (PAHRC)


![A Multimodal-Sensor-Enabled Room for Unobtrusive Group ...rjradke/papers/bhattacharya-icmi18.pdf · wearable sensors [42], one or more cameras [10, 27], or front-facing Microsoft](https://img.pdfslide.us/doc/110x75/5f349e7fa9b7273fba1bfc5a/a-multimodal-sensor-enabled-room-for-unobtrusive-group-rjradkepapersbhattacharya-.jpg)