Embed Size (px)
Citation preview

1
Cash Balance 201Interest Crediting Rates
Explained
Kevin DonovanCPA, EA, MSPA, FCAPinnacle Plan Design
www.pinnacle-plan.com

2
The information contained in this presentation is accurate as of August 2015
3
Agenda
Ideal Cash Balance Candidates Cash Balance Overview Cash Balance Possibilities Cash Balance Plan Contributions Interest Crediting Rates Investing Cash Balance Plan Assets Tools for Reviews Fees and Disclosures Next Steps
4
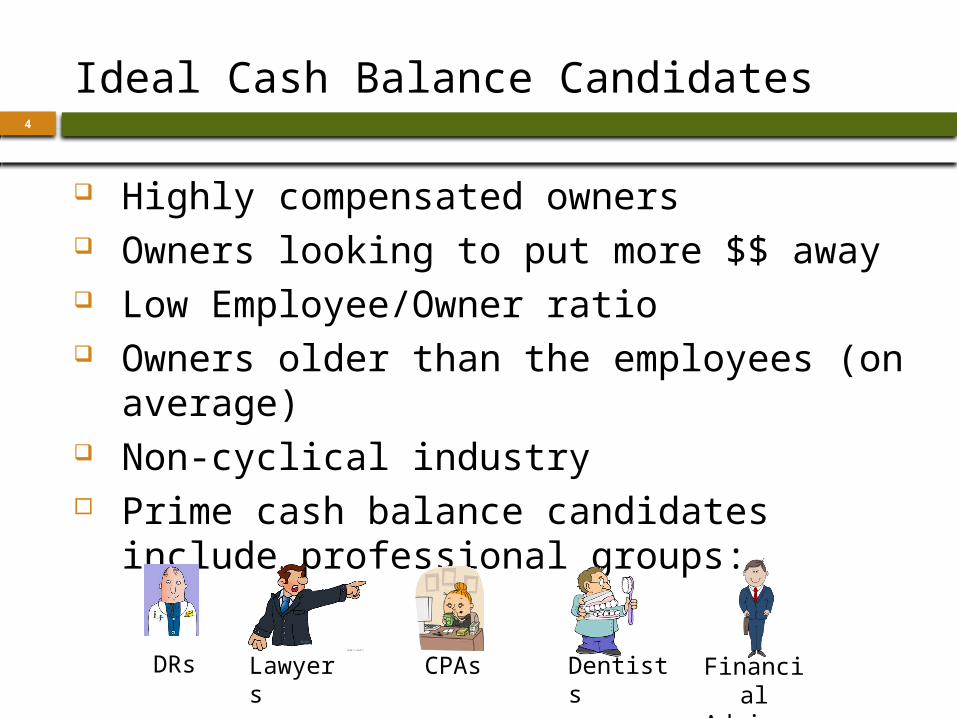
Ideal Cash Balance Candidates
Highly compensated owners Owners looking to put more $$ away Low Employee/Owner ratio Owners older than the employees (on
average) Non-cyclical industry Prime cash balance candidates include
professional groups:
DRs Lawyers
CPAs Dentists Financial
Advisors

5 Cash Balance Overview
6
Cash Balance Overview
Cash balance plans:
A defined benefit (DB) plan
Permanent in nature with required contributions by the employer
Provides employees with an account value versus periodic payments of a traditional DB plan
Significant contribution limits over and above defined contribution (DC) plan limits
7
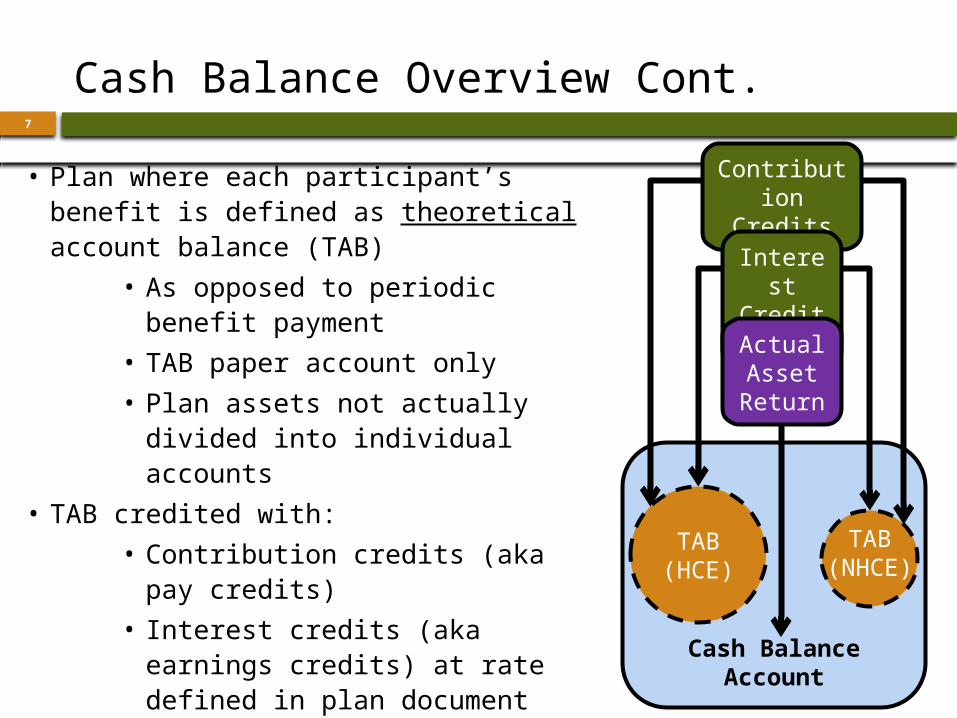
Cash Balance Overview Cont.
• Plan where each participant’s benefit is defined as theoretical account balance (TAB)
• As opposed to periodic benefit payment
• TAB paper account only
• Plan assets not actually divided into individual accounts
• TAB credited with:
• Contribution credits (aka pay credits)
• Interest credits (aka earnings credits) at rate defined in plan document
• It is a DB plan: benefit not based on actual asset return
Cash Balance Account
TAB(HCE)
Contribution Credits
Interest Credits
Actual Asset Return
TAB(NHCE)
8
PPA and Cash Balance Plans
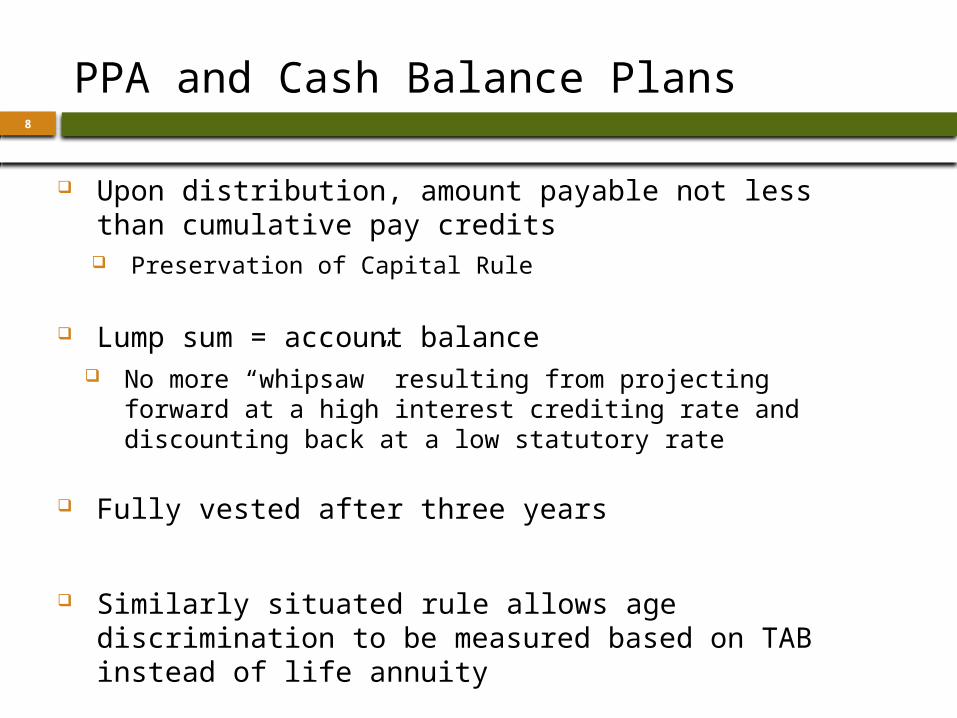
Upon distribution, amount payable not less than cumulative pay credits Preservation of Capital Rule
Lump sum = account balance No more “whipsaw” resulting from projecting forward
at a high interest crediting rate and discounting back at a low statutory rate
Fully vested after three years
Similarly situated rule allows age discrimination to be measured based on TAB instead of life annuity
9
Cash Balance Plan Retirement Benefit
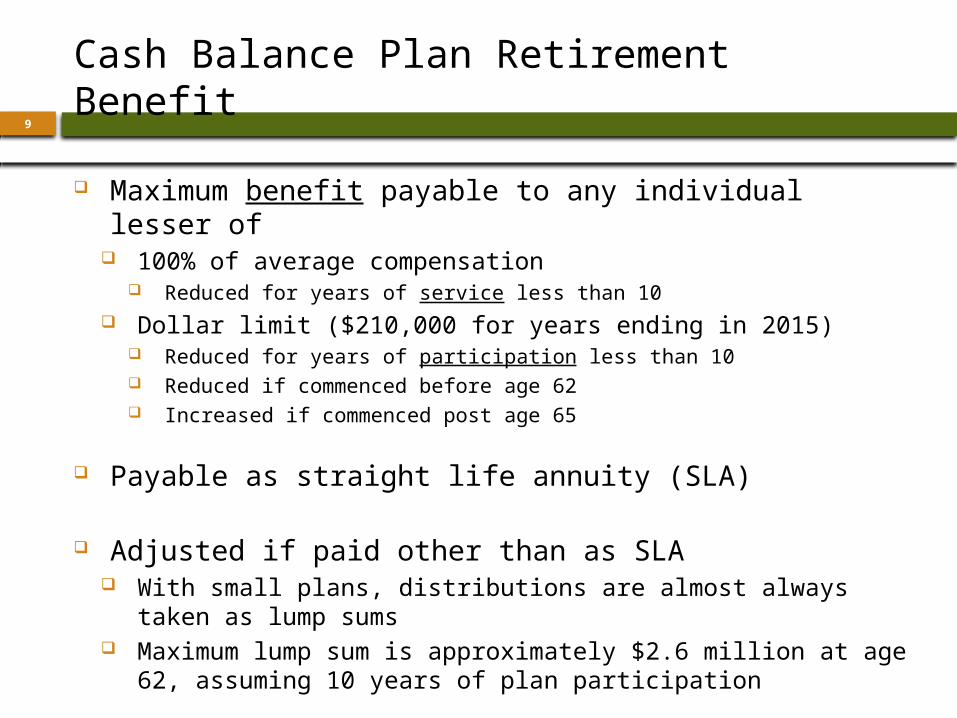
Maximum benefit payable to any individual lesser of 100% of average compensation
Reduced for years of service less than 10 Dollar limit ($210,000 for years ending in 2015)
Reduced for years of participation less than 10 Reduced if commenced before age 62 Increased if commenced post age 65
Payable as straight life annuity (SLA)
Adjusted if paid other than as SLA With small plans, distributions are almost always taken as
lump sums Maximum lump sum is approximately $2.6 million at age
62, assuming 10 years of plan participation
10
Cash Balance Contribution Limits
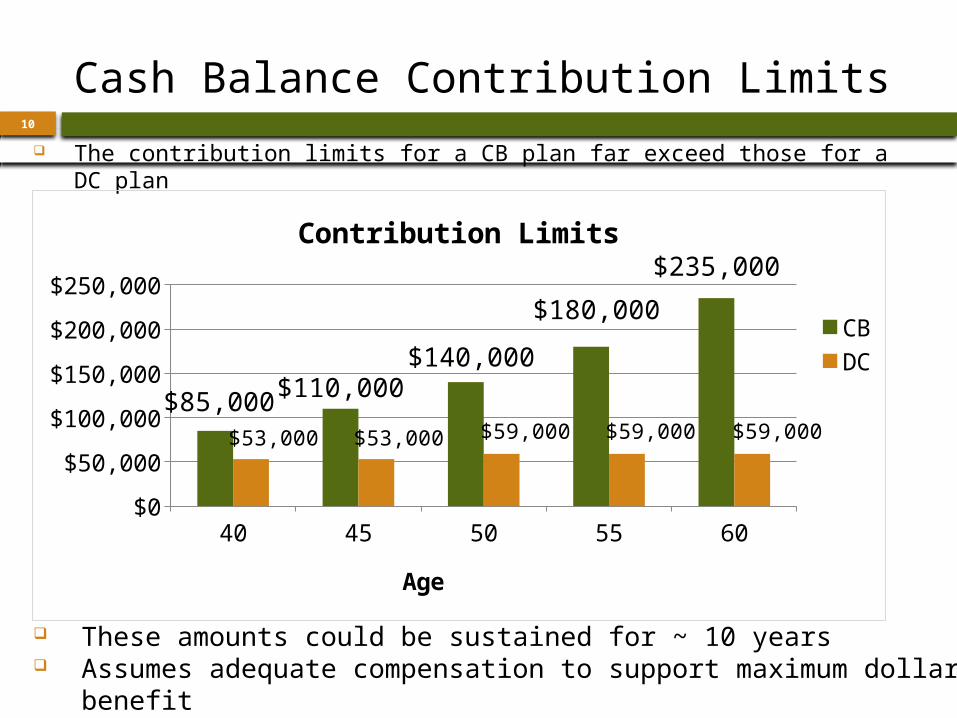
The contribution limits for a CB plan far exceed those for a DC plan
40 45 50 55 60$0
$50,000
$100,000
$150,000
$200,000
$250,000
$85,000$110,000
$140,000
$180,000
$235,000
$53,000 $53,000 $59,000 $59,000 $59,000
Contribution Limits
CBDC
Age
These amounts could be sustained for ~ 10 years Assumes adequate compensation to support maximum dollar
benefit
11
Cash Balance Possibilities
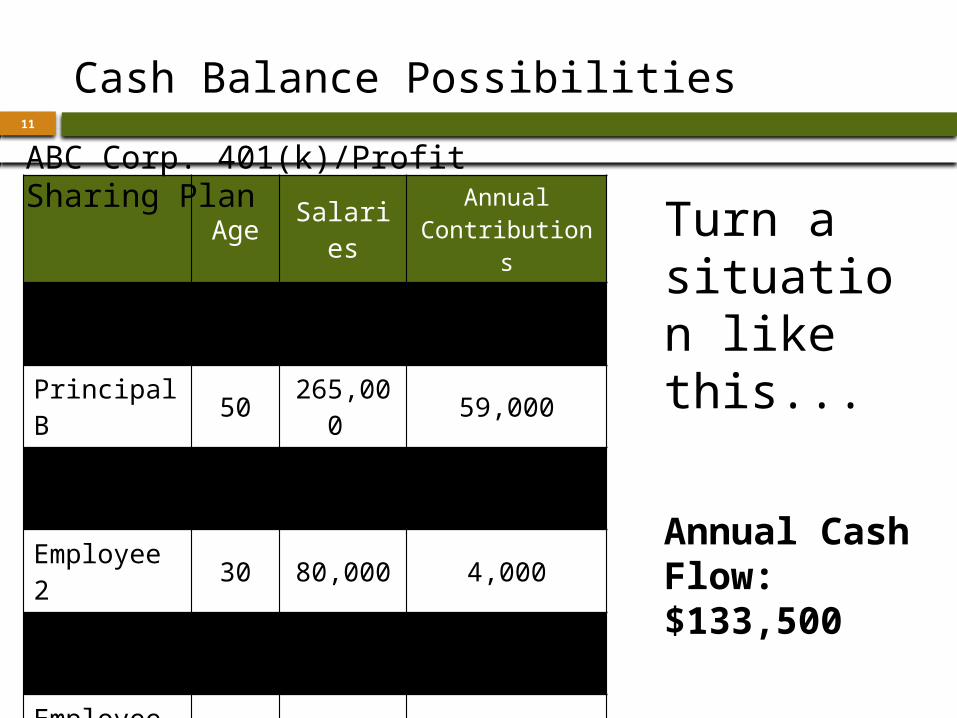
Age Salaries AnnualContributions
Principal A 56265,00
0 59,000
Principal B 50265,00
0 59,000
Employee 1 40
100,000 5,000
Employee 2 30 80,000 4,000
Employee 3 28 70,000 3,500
Employee 4 25 60,000 3,000
Total840,00
0 133,500
Turn a situation like this...
Annual Cash Flow:$133,500
ABC Corp. 401(k)/Profit Sharing Plan
12
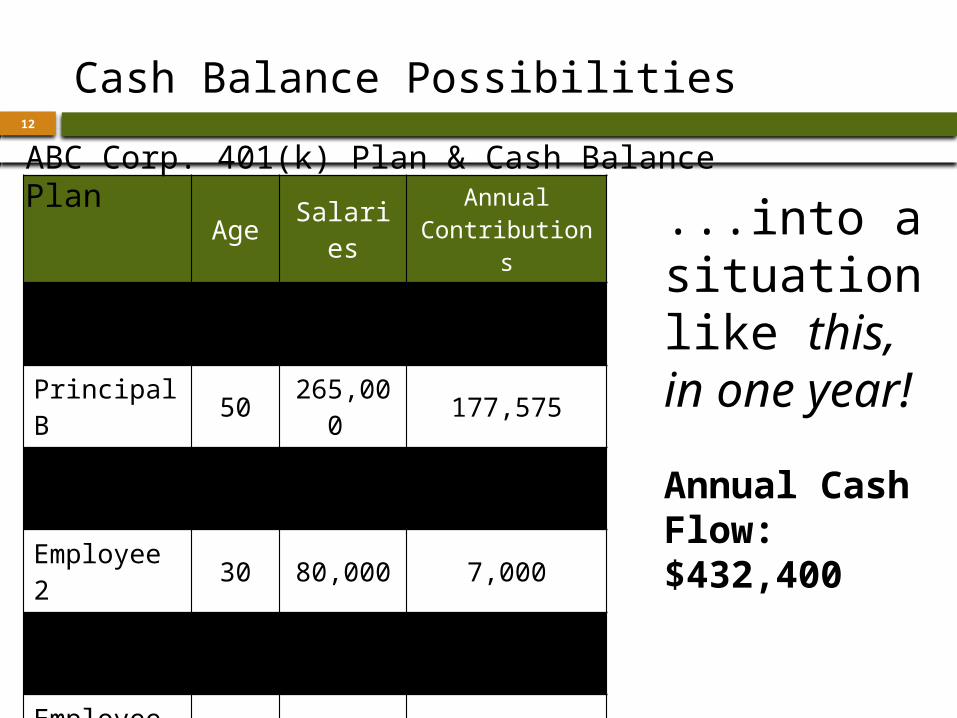
Cash Balance Possibilities
Age Salaries AnnualContributions
Principal A 56265,00
0 227,575
Principal B 50265,00
0 177,575
Employee 1 40
100,000 8,500
Employee 2 30 80,000 7,000
Employee 3 28 70,000 6,250
Employee 4 25 60,000 5,500
Total840,00
0 432,400
...into a situation like this, in one year!
Annual Cash Flow:$432,400
ABC Corp. 401(k) Plan & Cash Balance Plan

13 Cash Balance Case Study

14
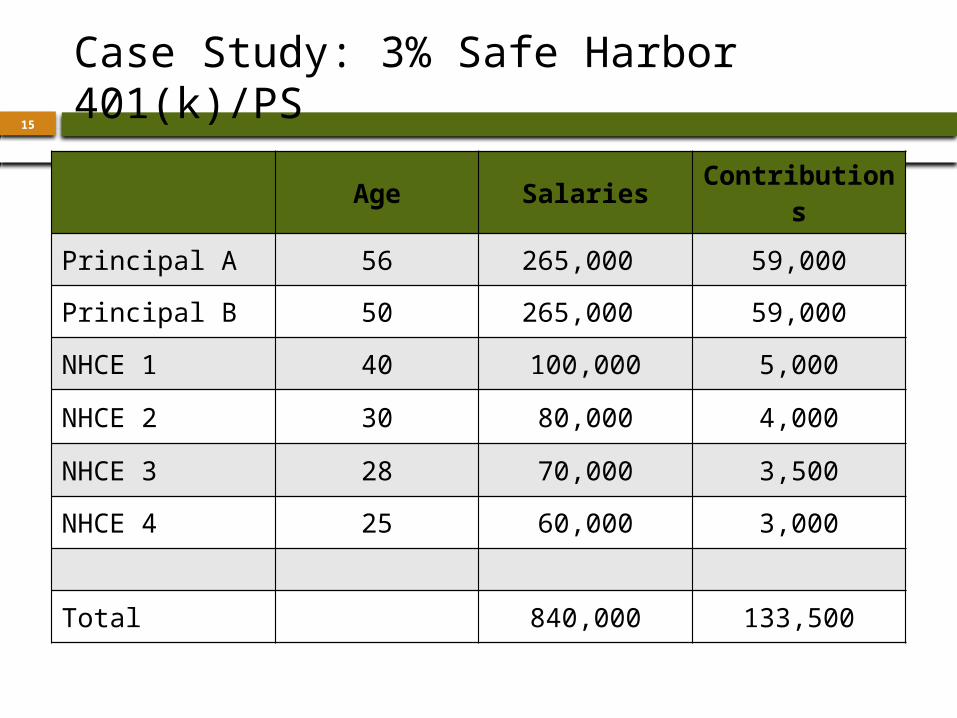
Case Study: 3% Safe Harbor 401(k)/PS
Principals
$35,000 in PS +$24,000 in deferrals$59,000
Employees
3% safe harbor +2% non-elective profit sharing5% of pay
15
Age SalariesContribution
s
Principal A 56 265,000 59,000
Principal B 50 265,000 59,000
NHCE 1 40 100,000 5,000
NHCE 2 30 80,000 4,000
NHCE 3 28 70,000 3,500
NHCE 4 25 60,000 3,000
Total 840,000 133,500
Case Study: 3% Safe Harbor 401(k)/PS
16
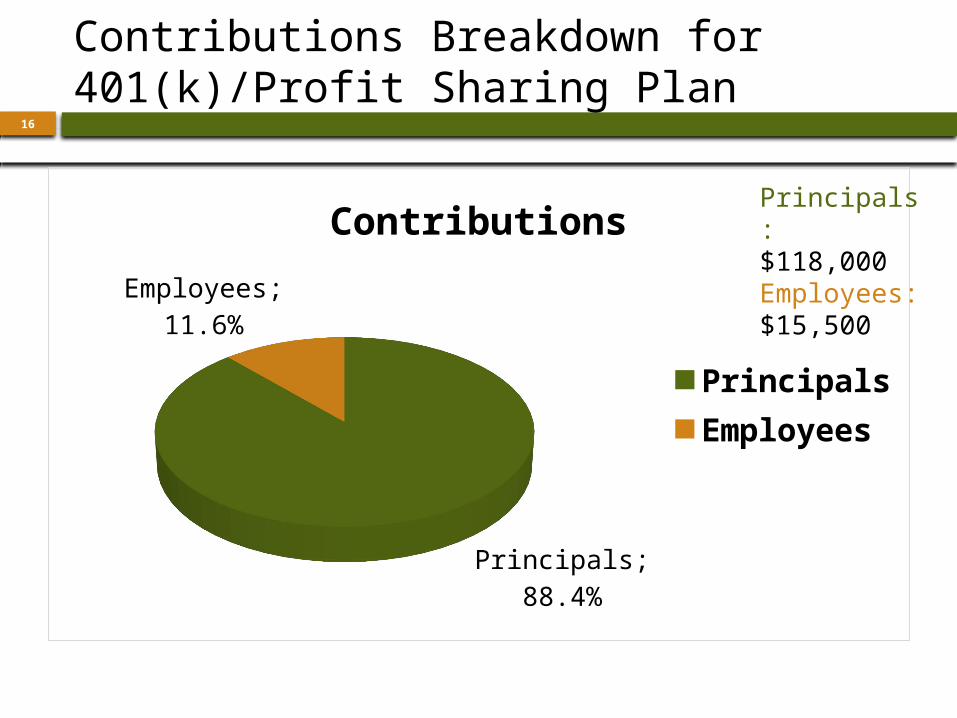
Contributions Breakdown for 401(k)/Profit Sharing Plan
Principals; 88.4%
Employees; 11.6%
Contributions
PrincipalsEmployees
Principals:$118,000Employees:$15,500
17
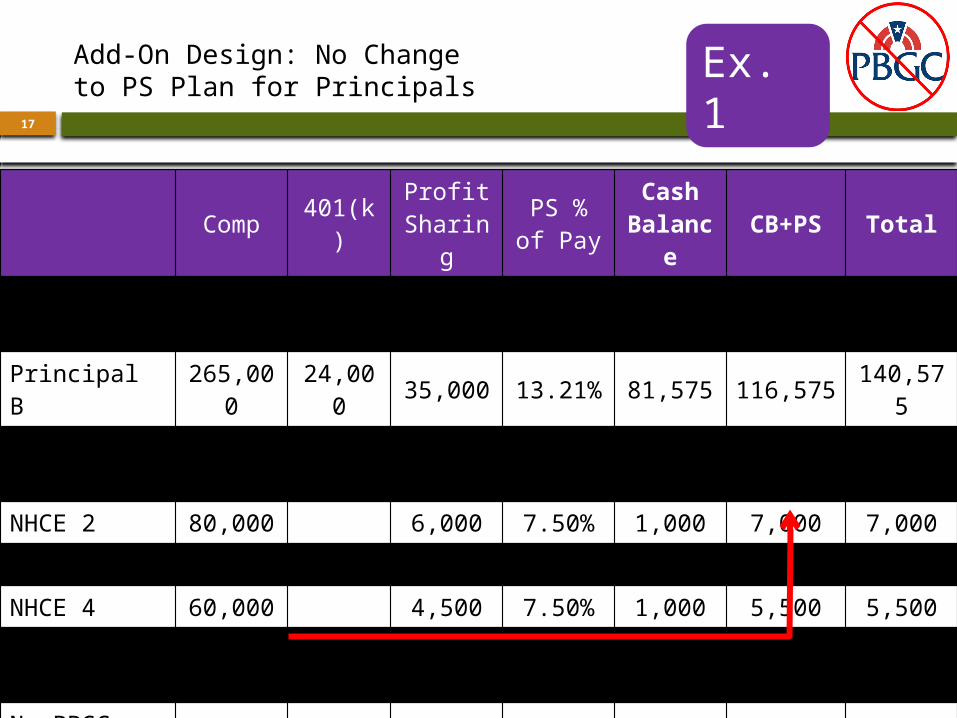
Add-On Design: No Change to PS Plan for Principals
Comp 401(k) Profit Sharing
PS % of Pay
Cash Balanc
eCB+PS Total
Principal A 265,000 24,000 35,000 13.21% 81,575 116,575 140,57
5
Principal B 265,000 24,000 35,000 13.21% 81,575 116,575 140,57
5
NHCE 1 100,000 7,500 7.50% 1,000 8,500 8,500
NHCE 2 80,000 6,000 7.50% 1,000 7,000 7,000
NHCE 3 70,000 5,250 7.50% 1,000 6,250 6,250
NHCE 4 60,000 4,500 7.50% 1,000 5,500 5,500
Totals 840,000 48,000 93,250 167,15
0 260,400 308,400
No PBGC Coverage: CB+PS ≤ 31%
x 31%
CB+PS Limit 260,400
Ex. 1
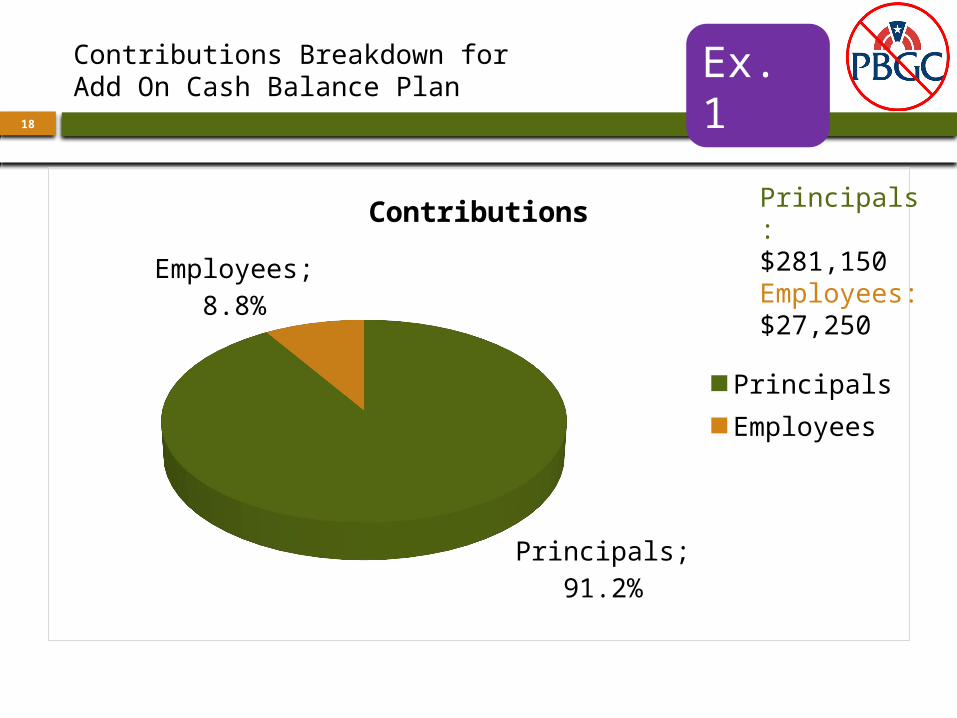
18
Principals; 91.2%
Employees; 8.8%
Contributions
PrincipalsEmployees
Principals:$281,150Employees:$27,250
Contributions Breakdown for Add On Cash Balance Plan
Ex. 1
19
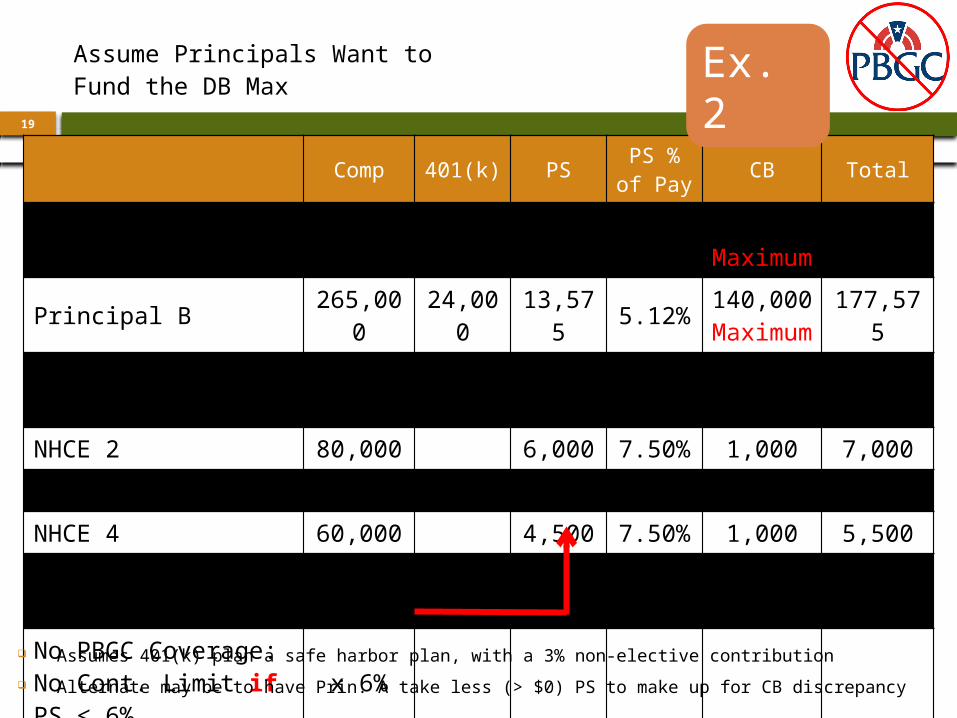
Comp 401(k) PS PS % of Pay CB Total
Principal A 265,000
24,000
13,575 5.12% 190,000
Maximum227,57
5
Principal B 265,000
24,000
13,575 5.12% 140,000
Maximum177,57
5
NHCE 1 100,000 7,500 7.50% 1,000 8,500
NHCE 2 80,000 6,000 7.50% 1,000 7,000
NHCE 3 70,000 5,250 7.50% 1,000 6,250
NHCE 4 60,000 4,500 7.50% 1,000 5,500
Totals 840,000
48,000
50,400 334,000 432,40
0
No PBGC Coverage: No Cont. Limit if PS ≤ 6%
x 6%
PS Limit 50,400 Assumes 401(k) plan a safe harbor plan, with a 3% non-elective contribution Alternate may be to have Prin. A take less (> $0) PS to make up for CB discrepancy
Assume Principals Want to Fund the DB Max
Ex. 2
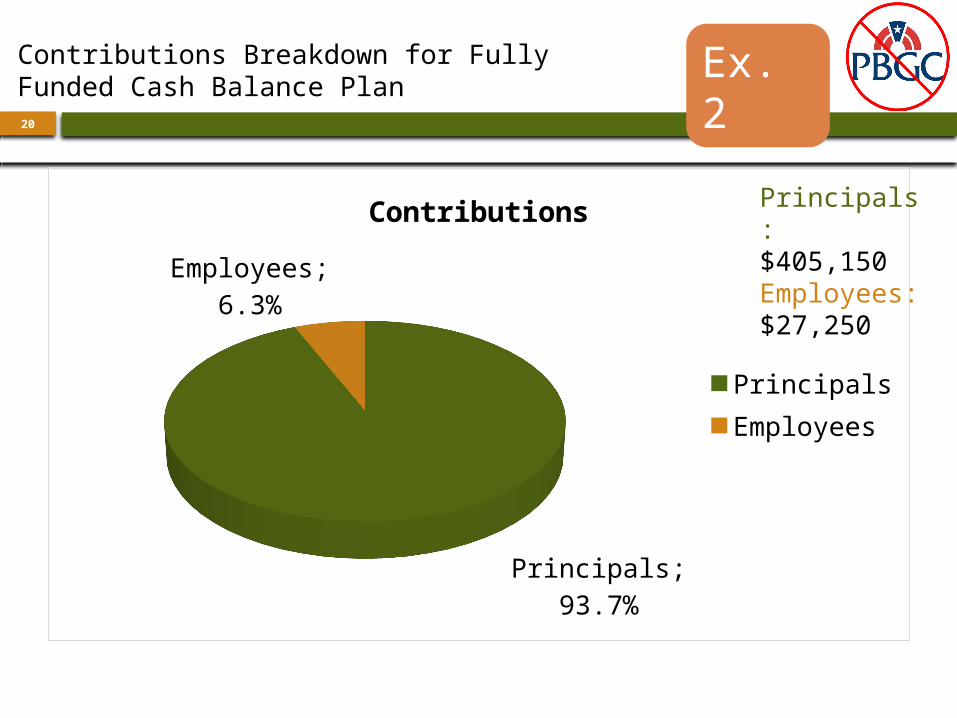
20
Principals; 93.7%
Employees; 6.3%
Contributions
PrincipalsEmployees
Principals:$405,150Employees:$27,250
Contributions Breakdown for Fully Funded Cash Balance Plan
Ex. 2

21 Cash Balance Plan Contributions
22
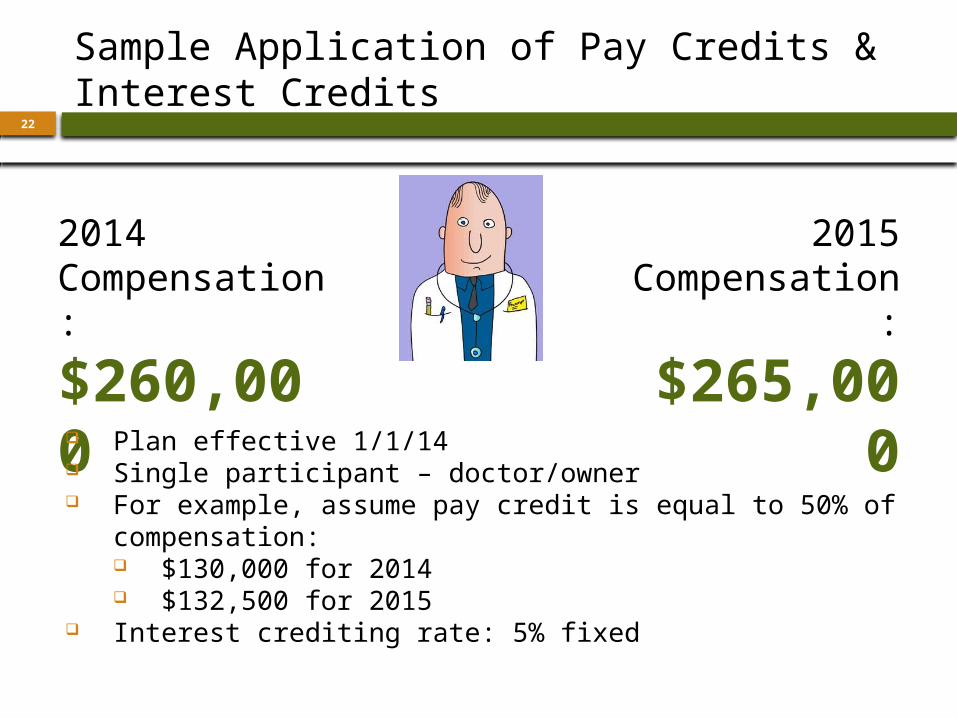
Sample Application of Pay Credits & Interest Credits
2014 Compensation:
$260,000
2015 Compensatio
n:
$265,000 Plan effective 1/1/14
Single participant – doctor/owner For example, assume pay credit is equal to 50% of
compensation: $130,000 for 2014 $132,500 for 2015
Interest crediting rate: 5% fixed
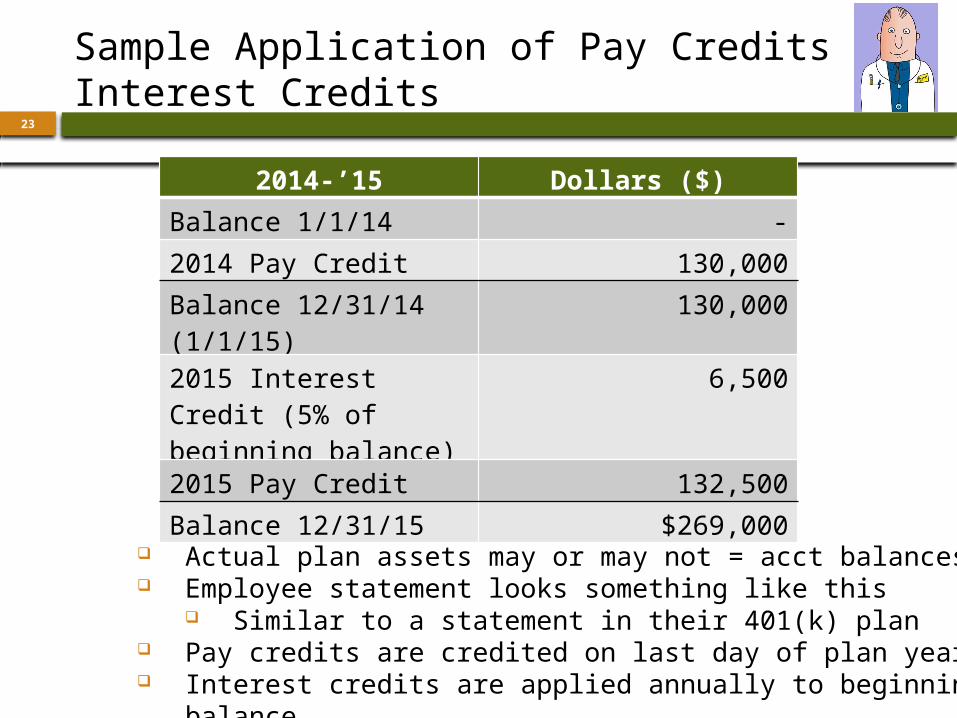
23
Sample Application of Pay Credits & Interest Credits
Actual plan assets may or may not = acct balances Employee statement looks something like this
Similar to a statement in their 401(k) plan Pay credits are credited on last day of plan year Interest credits are applied annually to beginning balance
2014-’15 Dollars ($)
Balance 1/1/14 -
2014 Pay Credit 130,000
Balance 12/31/14 (1/1/15)
130,000
2015 Interest Credit (5% of beginning balance)
6,500
2015 Pay Credit 132,500
Balance 12/31/15 $269,000
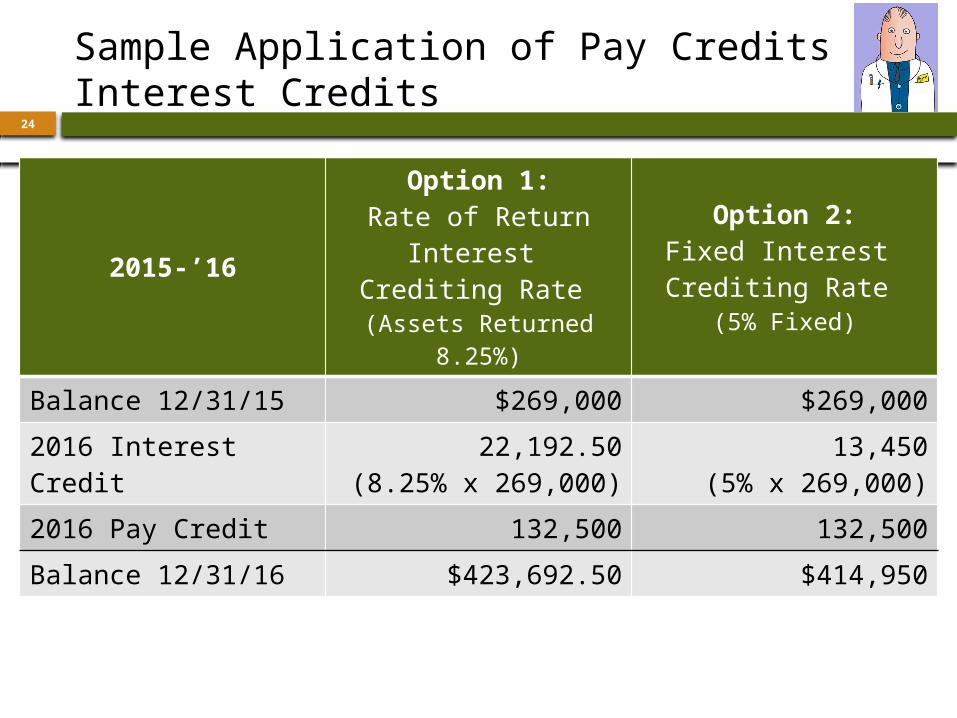
24
Sample Application of Pay Credits & Interest Credits
2015-’16
Option 1:Rate of Return Interest
Crediting Rate (Assets Returned 8.25%)
Option 2:Fixed Interest Crediting Rate
(5% Fixed)
Balance 12/31/15 $269,000 $269,000
2016 Interest Credit 22,192.50(8.25% x 269,000)
13,450(5% x 269,000)
2016 Pay Credit 132,500 132,500
Balance 12/31/16 $423,692.50 $414,950
25
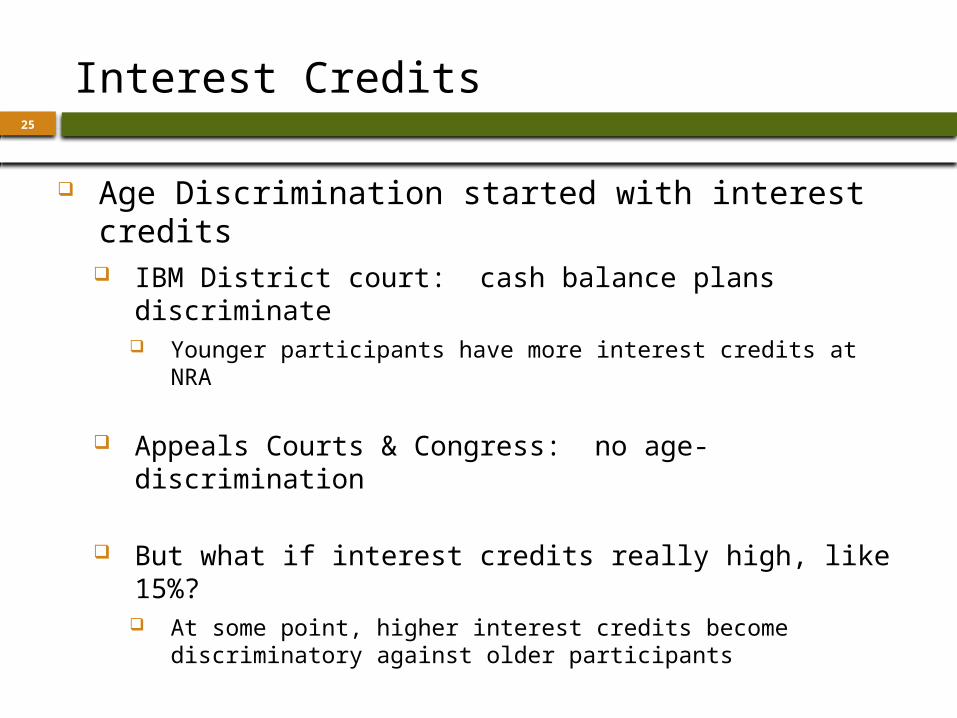
Interest Credits
Age Discrimination started with interest credits IBM District court: cash balance plans
discriminate Younger participants have more interest credits at NRA
Appeals Courts & Congress: no age-discrimination
But what if interest credits really high, like 15%? At some point, higher interest credits become
discriminatory against older participants
26
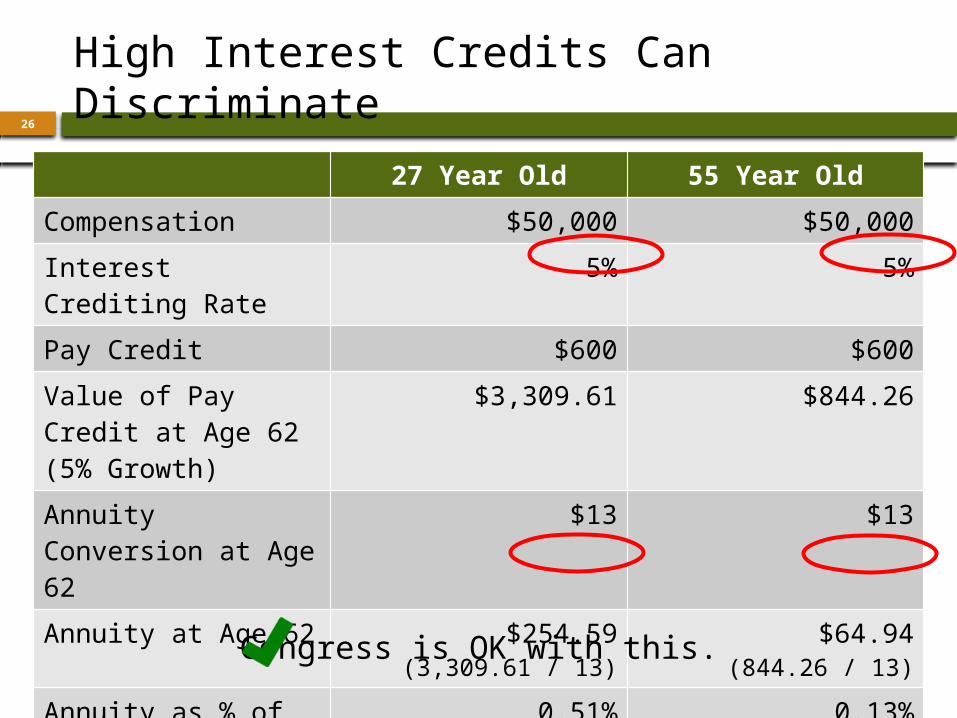
High Interest Credits Can Discriminate
27 Year Old 55 Year Old
Compensation $50,000 $50,000
Interest Crediting Rate 5% 5%
Pay Credit $600 $600
Value of Pay Credit at Age 62 (5% Growth)
$3,309.61 $844.26
Annuity Conversion at Age 62
$13 $13
Annuity at Age 62 $254.59(3,309.61 / 13)
$64.94(844.26 / 13)
Annuity as % of Compensation
0.51%(254.59 / 50,000)
0.13%(64.94 / 50,000)
Congress is OK with this.
27
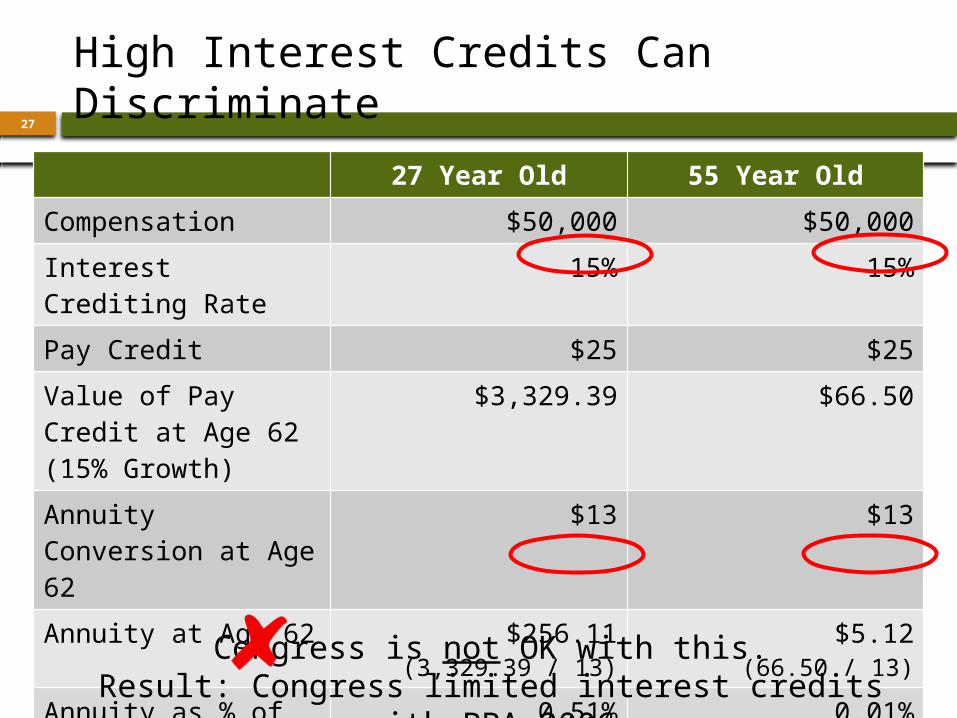
High Interest Credits Can Discriminate
27 Year Old 55 Year Old
Compensation $50,000 $50,000
Interest Crediting Rate 15% 15%
Pay Credit $25 $25
Value of Pay Credit at Age 62 (15% Growth)
$3,329.39 $66.50
Annuity Conversion at Age 62
$13 $13
Annuity at Age 62 $256.11(3,329.39 / 13)
$5.12(66.50 / 13)
Annuity as % of Compensation
0.51%(256.11 / 50,000)
0.01%(5.12 / 50,000)
Congress is not OK with this.Result: Congress limited interest credits with PPA
2006

28 Interest Crediting Rates
29
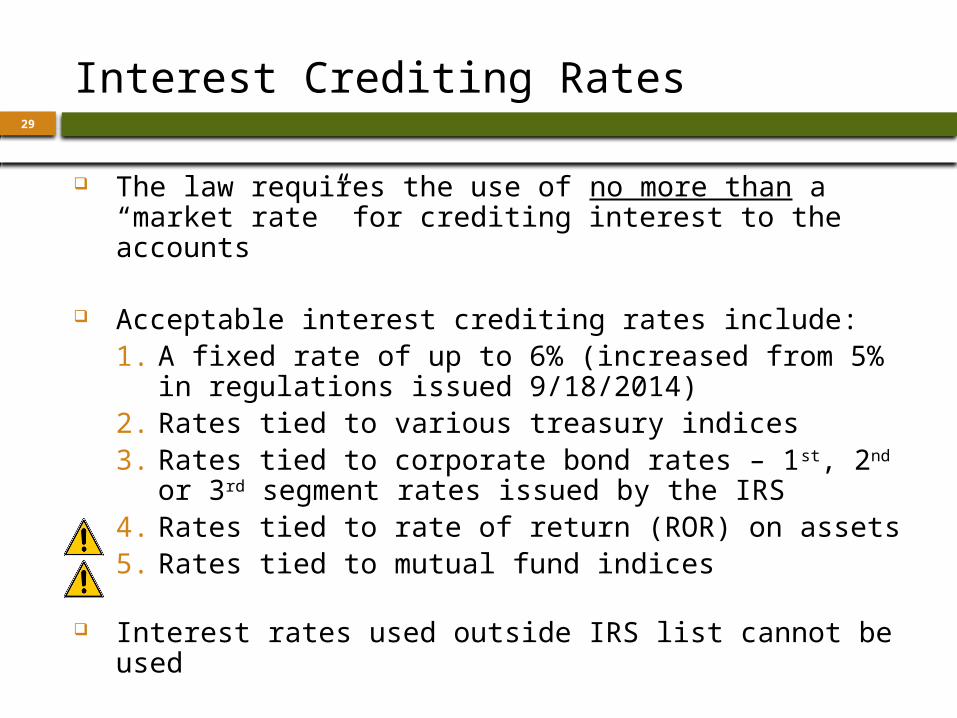
Interest Crediting Rates
The law requires the use of no more than a “market rate” for crediting interest to the accounts
Acceptable interest crediting rates include:1. A fixed rate of up to 6% (increased from 5% in
regulations issued 9/18/2014)2. Rates tied to various treasury indices3. Rates tied to corporate bond rates – 1st, 2nd or
3rd segment rates issued by the IRS4. Rates tied to rate of return (ROR) on assets5. Rates tied to mutual fund indices
Interest rates used outside IRS list cannot be used
30
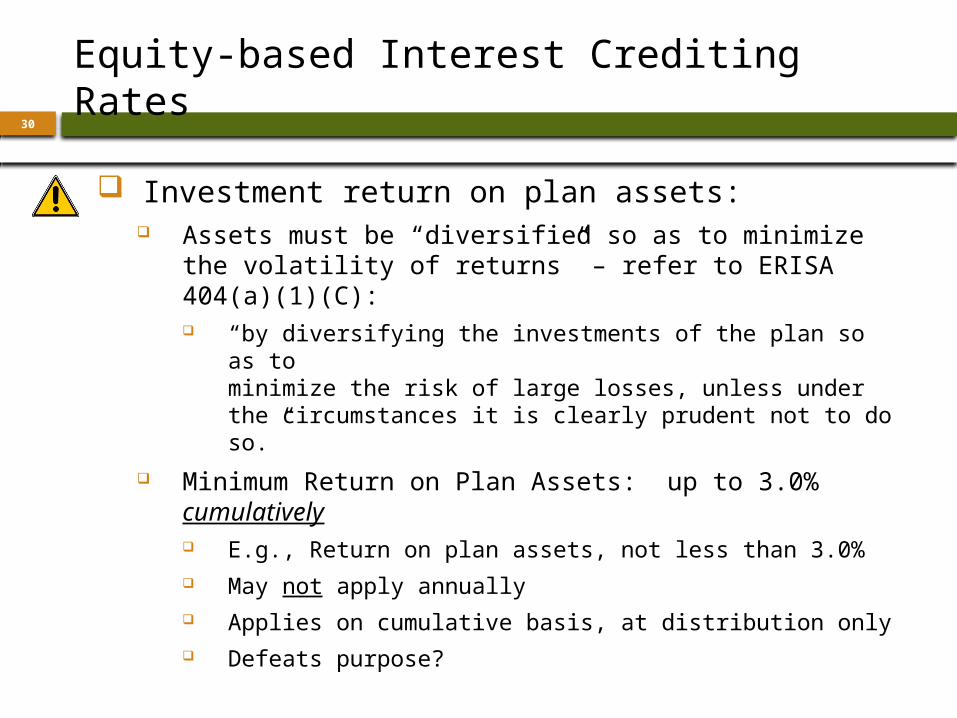
Equity-based Interest Crediting Rates
Investment return on plan assets: Assets must be “diversified so as to minimize
the volatility of returns” – refer to ERISA 404(a)(1)(C): “by diversifying the investments of the plan so as to
minimize the risk of large losses, unless under the circumstances it is clearly prudent not to do so.”
Minimum Return on Plan Assets: up to 3.0% cumulatively E.g., Return on plan assets, not less than 3.0% May not apply annually Applies on cumulative basis, at distribution only Defeats purpose?
31
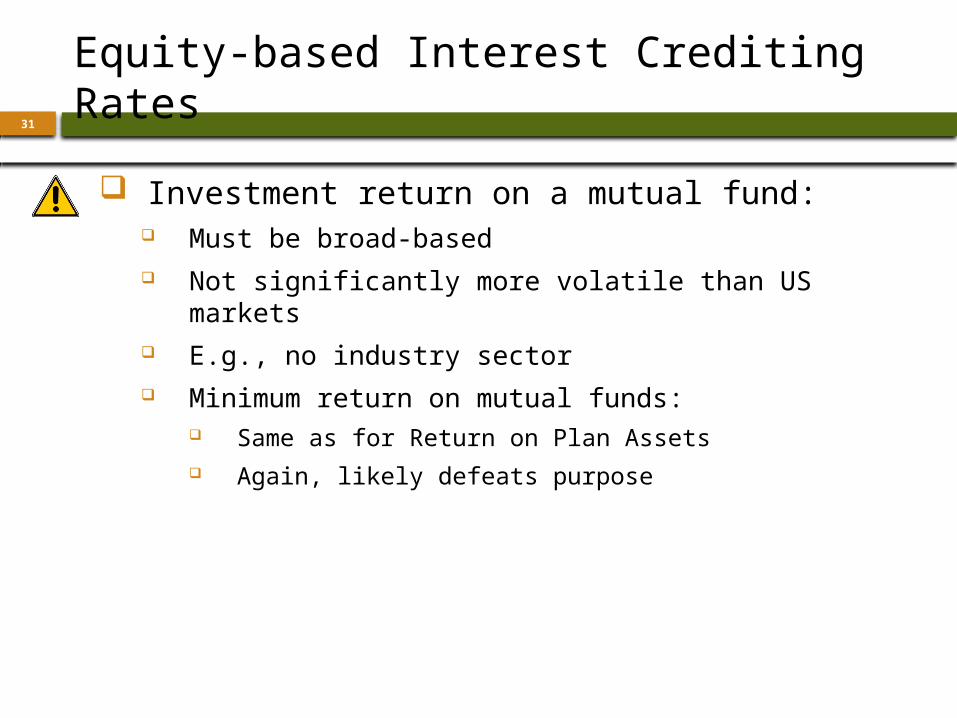
Equity-based Interest Crediting Rates
Investment return on a mutual fund: Must be broad-based Not significantly more volatile than US markets E.g., no industry sector Minimum return on mutual funds:
Same as for Return on Plan Assets Again, likely defeats purpose
32
Interest Crediting Rates
Can Investment Direction be provided by employee? Suggested by IRS in 2010 regulations
Preamble to 2014 regulations: “It is possible that the Treasury Department
and the IRS will conclude that such plan designs are not permitted.”
This follows 4 pages of criticism of investment direction.
I take this as “No.” But could be wrong…
33
Crediting ROR or Mutual Fund
Why use rate of return or mutual fund? Goal is generally to invest assets to mirror
interest crediting rate Using ROR makes this goal easier to achieve Much of the investment risk is shifted to
employees Losses do not create a funding shortfall
Goal is to deposit pay credits and have interest credits equal actual earnings
34
Crediting ROR or Mutual Fund
Why not to use rate of return or mutual fund? Benefit Limits Discrimination testing Coverage testing Preservation of Capital Rule: requires
ultimate payout to be not less than cumulative pay credits So early losses could cause problem
35
Crediting ROR or Mutual Fund – Benefit Limits
The maximum distribution at any age for a person at the maximum benefit level is based on roughly $2.6 million at age 62, prorated for years of participation less than 10.
Where distribution takes place prior to age 62 the $2.6 million figure is reduced for interest and mortality
36
Crediting ROR or Mutual Fund – Benefit Limits
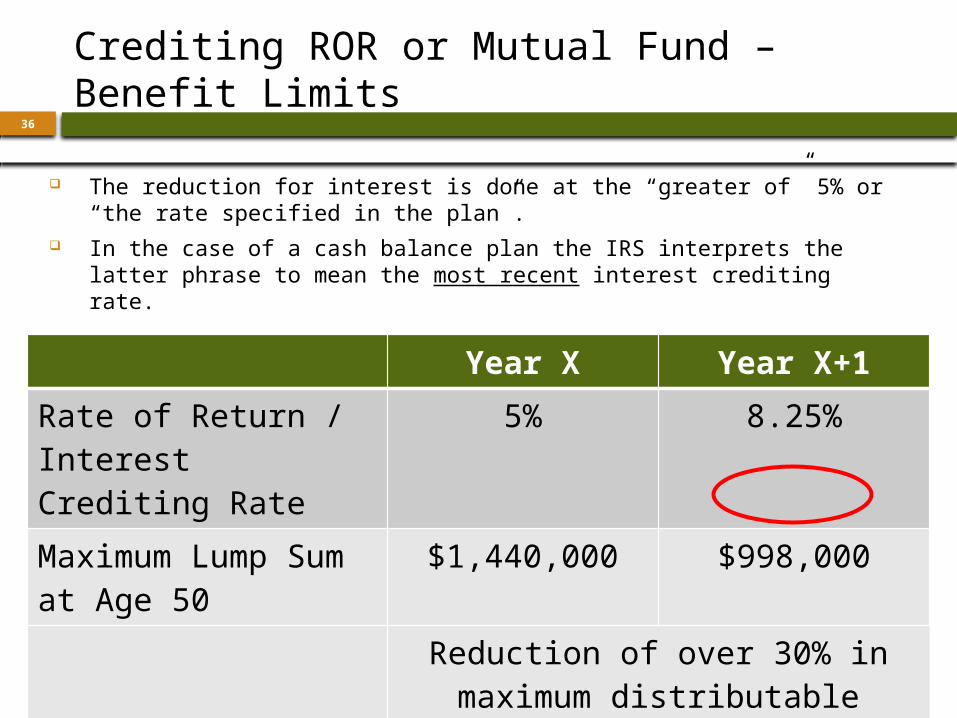
The reduction for interest is done at the “greater of” 5% or “the rate specified in the plan”.
In the case of a cash balance plan the IRS interprets the latter phrase to mean the most recent interest crediting rate.
Year X Year X+1
Rate of Return / Interest Crediting Rate
5% 8.25%
Maximum Lump Sum at Age 50
$1,440,000 $998,000
Reduction of over 30% in maximum distributable amount!
37
Crediting ROR or Mutual Fund – Benefit Limits
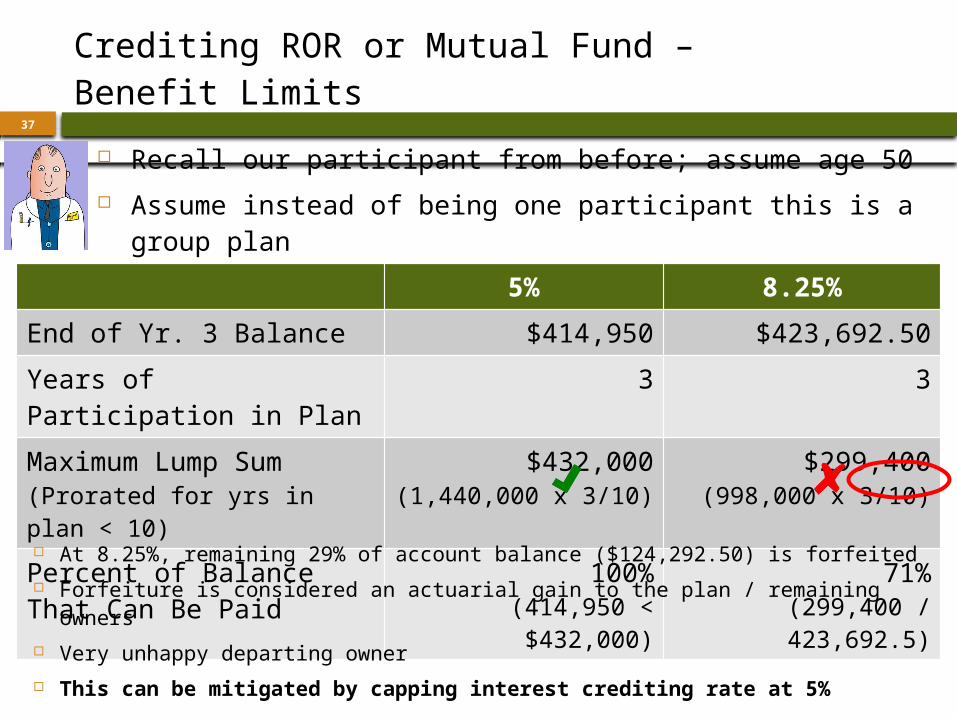
Recall our participant from before; assume age 50 Assume instead of being one participant this is a group
plan Wants to leave practice and take distribution5% 8.25%
End of Yr. 3 Balance $414,950 $423,692.50
Years of Participation in Plan 3 3
Maximum Lump Sum (Prorated for yrs in plan < 10)
$432,000(1,440,000 x 3/10)
$299,400(998,000 x 3/10)
Percent of Balance That Can Be Paid
100%(414,950 < $432,000)
71%(299,400 / 423,692.5)
At 8.25%, remaining 29% of account balance ($124,292.50) is forfeited Forfeiture is considered an actuarial gain to the plan / remaining owners Very unhappy departing owner This can be mitigated by capping interest crediting rate at 5%
38
Crediting ROR or Mutual Fund – Discrimination Testing
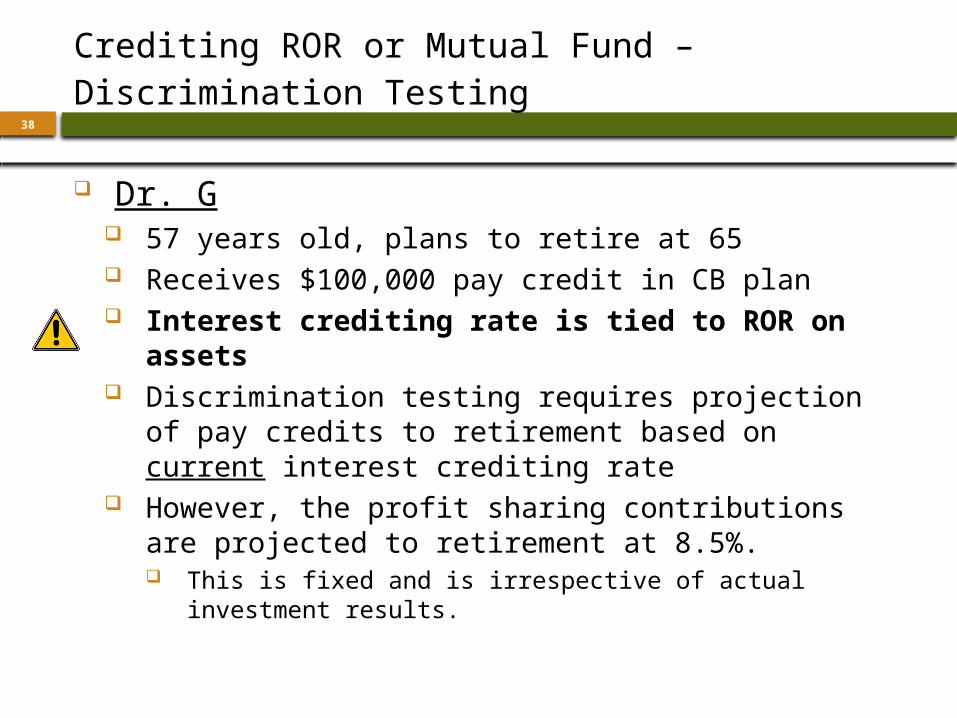
Dr. G 57 years old, plans to retire at 65 Receives $100,000 pay credit in CB plan Interest crediting rate is tied to ROR on
assets Discrimination testing requires projection of
pay credits to retirement based on current interest crediting rate
However, the profit sharing contributions are projected to retirement at 8.5%. This is fixed and is irrespective of actual
investment results.
39
Crediting ROR or Mutual Fund – Discrimination Testing
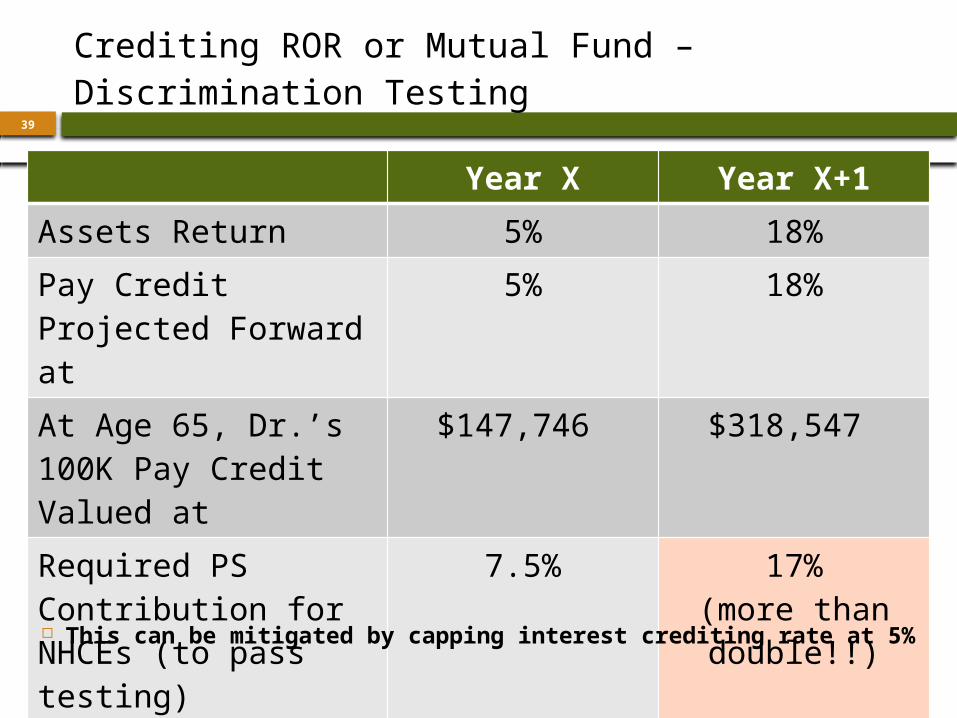
Year X Year X+1
Assets Return 5% 18%
Pay Credit Projected Forward at
5% 18%
At Age 65, Dr.’s 100K Pay Credit Valued at
$147,746 $318,547
Required PS Contribution for NHCEs (to pass testing)
7.5% 17%(more than double!!)
This can be mitigated by capping interest crediting rate at 5%
40
Crediting ROR or Mutual Fund – Coverage Testing
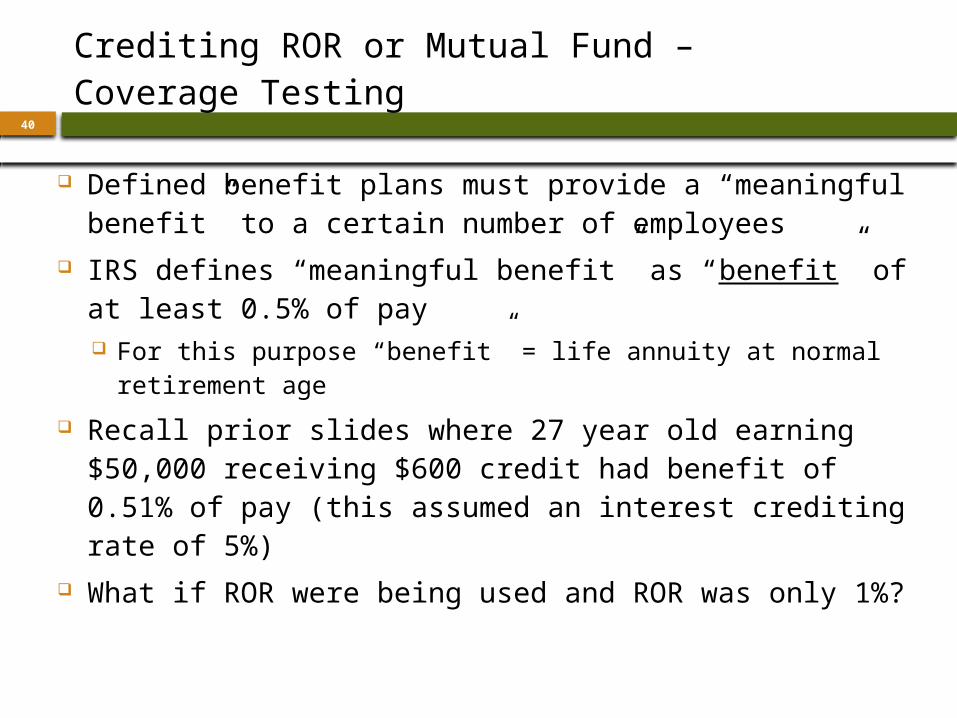
Defined benefit plans must provide a “meaningful benefit” to a certain number of employees
IRS defines “meaningful benefit” as “benefit” of at least 0.5% of pay For this purpose “benefit” = life annuity at normal
retirement age Recall prior slides where 27 year old earning $50,000
receiving $600 credit had benefit of 0.51% of pay (this assumed an interest crediting rate of 5%)
What if ROR were being used and ROR was only 1%?
41
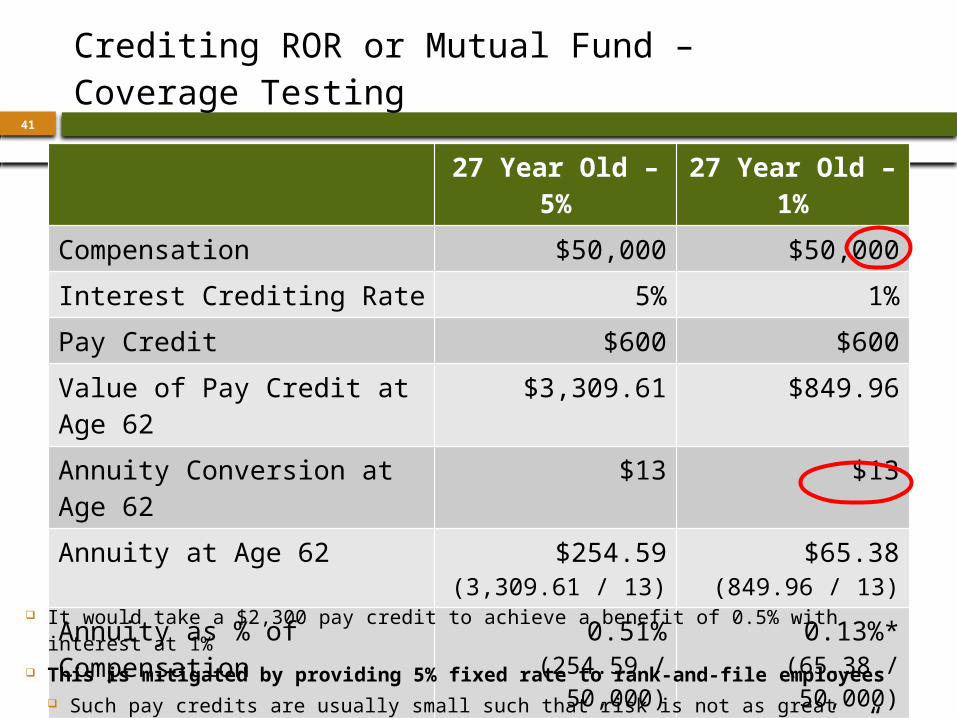
Crediting ROR or Mutual Fund – Coverage Testing
27 Year Old – 5% 27 Year Old – 1%
Compensation $50,000 $50,000
Interest Crediting Rate 5% 1%
Pay Credit $600 $600
Value of Pay Credit at Age 62 $3,309.61 $849.96
Annuity Conversion at Age 62 $13 $13
Annuity at Age 62 $254.59(3,309.61 / 13)
$65.38(849.96 / 13)
Annuity as % of Compensation 0.51%(254.59 / 50,000)
0.13%*(65.38 / 50,000)
* At 1%, the annuity is not a “meaningful benefit” (0.13% < 0.5%)
It would take a $2,300 pay credit to achieve a benefit of 0.5% with interest at 1% This is mitigated by providing 5% fixed rate to rank-and-file employees
Such pay credits are usually small such that risk is not as great
42
Crediting ROR or Mutual Fund – Preservation of Capital Rule
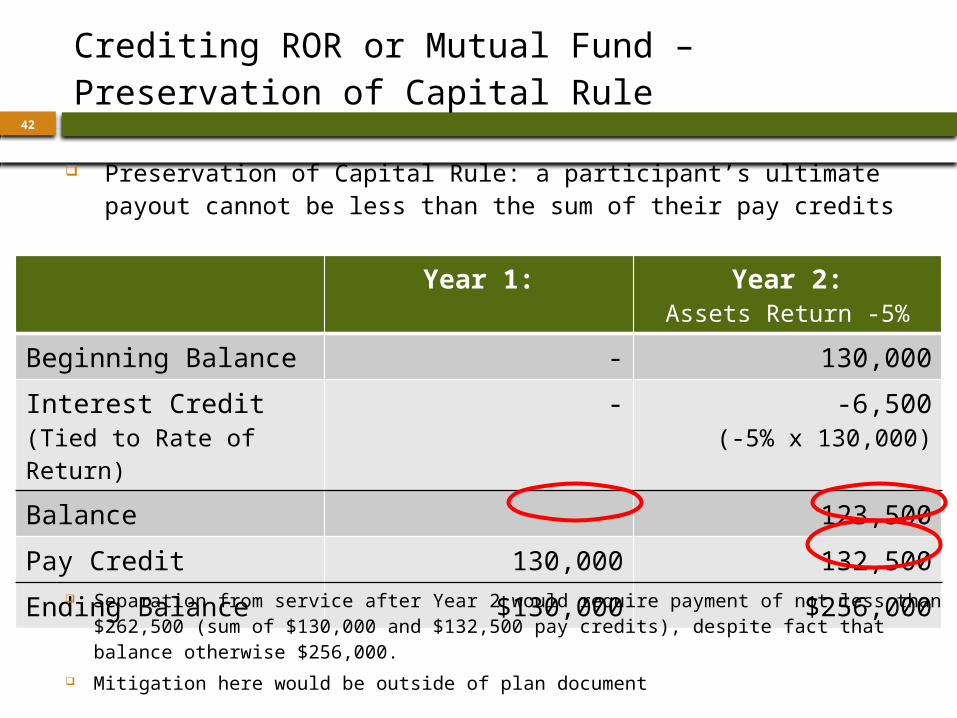
Year 1: Year 2:Assets Return -5%
Beginning Balance - 130,000
Interest Credit (Tied to Rate of Return)
- -6,500(-5% x 130,000)
Balance - 123,500
Pay Credit 130,000 132,500
Ending Balance $130,000 $256,000
Preservation of Capital Rule: a participant’s ultimate payout cannot be less than the sum of their pay credits
Separation from service after Year 2 would require payment of not less than $262,500 (sum of $130,000 and $132,500 pay credits), despite fact that balance otherwise $256,000.
Mitigation here would be outside of plan document
43
Summary of Interest Crediting Rates
The law requires the use of no more than a “market rate” for crediting interest to cash balance accounts
The interest crediting rate can be fixed or variable Care must be taken when tying to ROR on plan assets or
mutual fund indices Consider capping when crediting such rates
Mitigates issues with respect to reduced maximum benefits Can minimize fluctuation from year to year in test results
Consider fixed interest crediting rate for lower benefiting employees to alleviate “meaningful benefit” concerns
Interest credits must be applied no less often than annually Annual certainly the norm, at least in small plan market

44 Investing Cash Balance Plan Assets
45
Follow the Rate
Actuary and plan sponsor, with advisor input, select an appropriate Interest Crediting Rate when the plan is established
How do you invest to meet the stated goal? Allocation and portfolio to meet rate over time Avoid volatility
The goal is to meet the interest crediting rate over a period of time.
46
Cash Balance Investments
Cash Balance Investments Are: Pooled Trustee-Directed Guaranteed
Pay credit and interest credit are required for all eligible participants annually
47
Investment Policy Statement
ERISA does not explicitly require a written governance process or IPS, however most feel it is best practice
If you provide an IPS, follow it.
IPS includes Investments allowed and disallowed Risk and liquidity profile Investment monitoring and replacement process Roles and responsibilities of responsible parties Selecting and monitoring investment
professionals
48
Fees and Disclosures
Direct participant expenses cannot be charged to the employee
e.g. Termination fees or distribution fees
No ERISA or PARA buckets in a DB plan
Fee disclosures not required for plan participants
49
Investment Options & Models
Use investment(s) or a model that meets the return objective
Single Cash Balance Funds Single manager fund Fund of funds
Selection and monitoring meets the IPS
Choice of pooled brokerage account or eligible recordkeeper account
50
Tools for Reviews
Fi360 Individual funds Models
Morningstar Reports
Zephyr Reports

51 Next Steps

Retirement Plan Design▲Administration▲Consulting▲Actuarial Services
www.pinnacle-plan.com
53
Beth A. Cooper, CRPS®Strategic Development [email protected](520) 906-4821