Embed Size (px)
DESCRIPTION
Internal Medicine
Citation preview
Atrial FibrillationKaram Ayoub
PGY-2
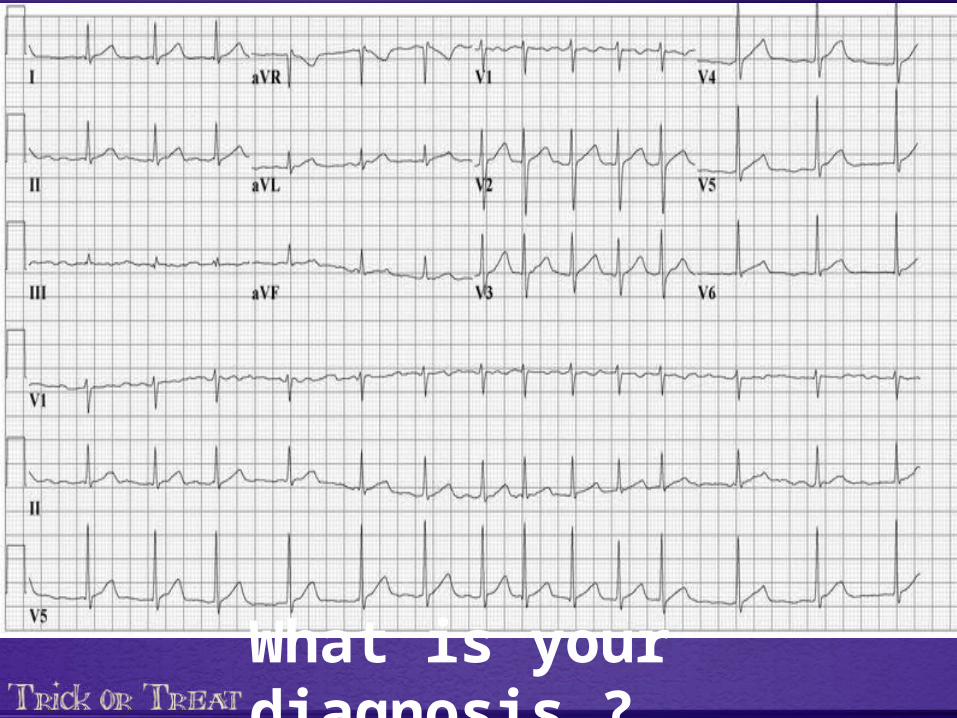
Mr. X is a 68 Y/O WM, with PMH of HTN, DM II, dyslipidemia, presented to the ED complaining of increasing shortness of breath, dizziness, and the sensation of his "heart racing." Patient said his symptoms started abruptly earlier that day and have steadily become worse.
On admission, his heart rate is 160 bpm, blood pressure 100/50 mm Hg, respirations 26 breaths per minute, and oxygen saturation is 95% on room air.
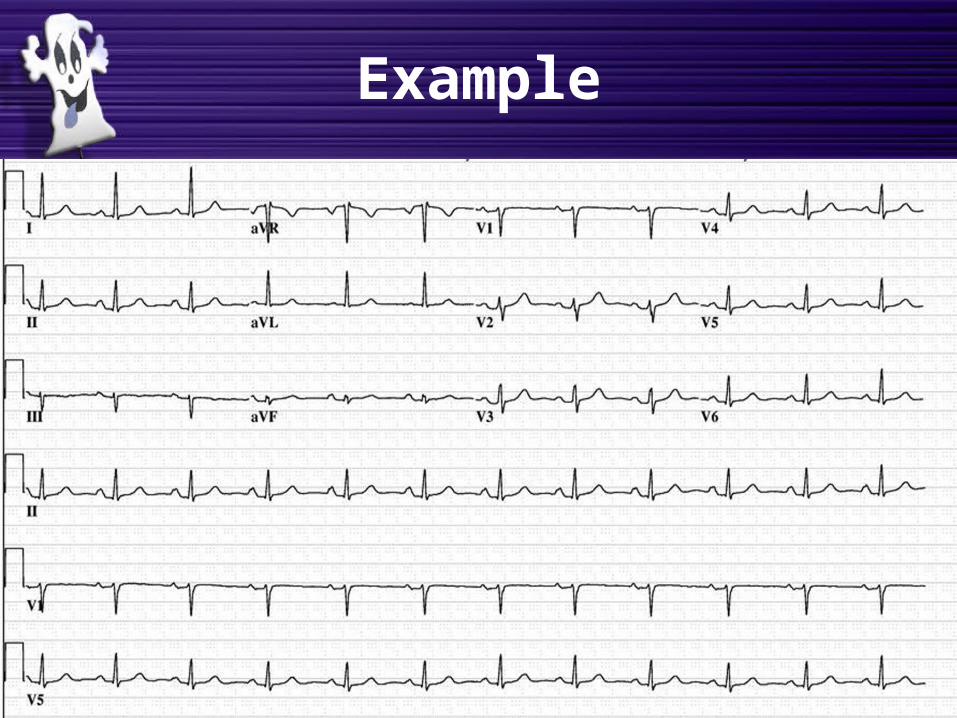
12 lead ECG done ( as shown in the next slide ).
Case:
How to read an ECG ?
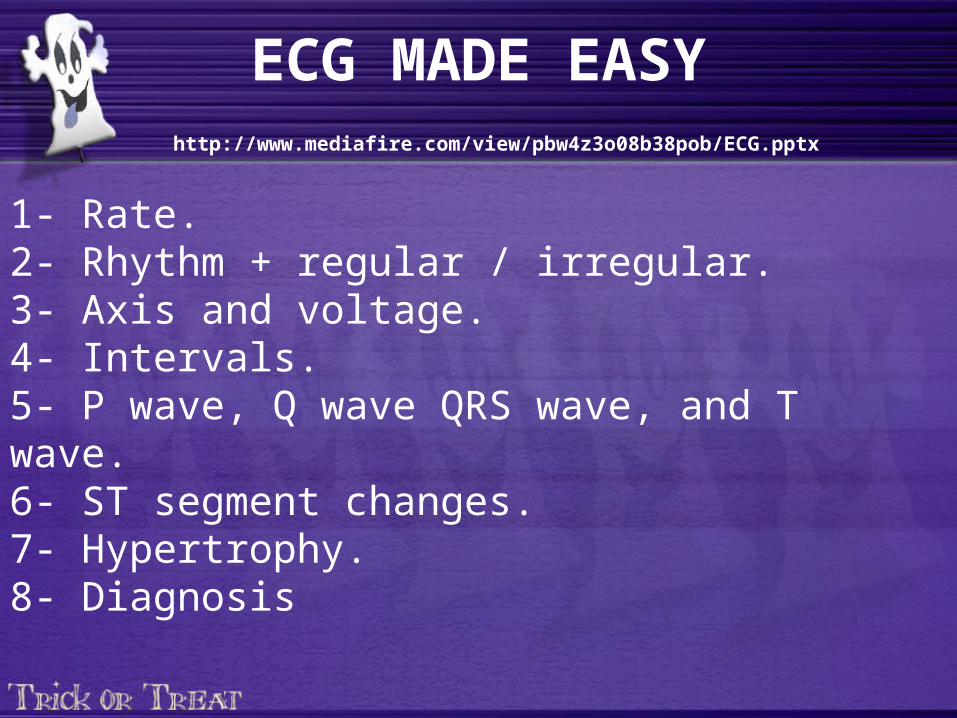
ECG MADE EASY http://www.mediafire.com/view/pbw4z3o08b38pob/ECG.pptx
1- Rate.2- Rhythm + regular / irregular.3- Axis and voltage.4- Intervals.5- P wave, Q wave QRS wave, and T wave.6- ST segment changes.7- Hypertrophy.8- Diagnosis
Example
Why
Miyasaka Y. Circulation 2006; 114: 119-125
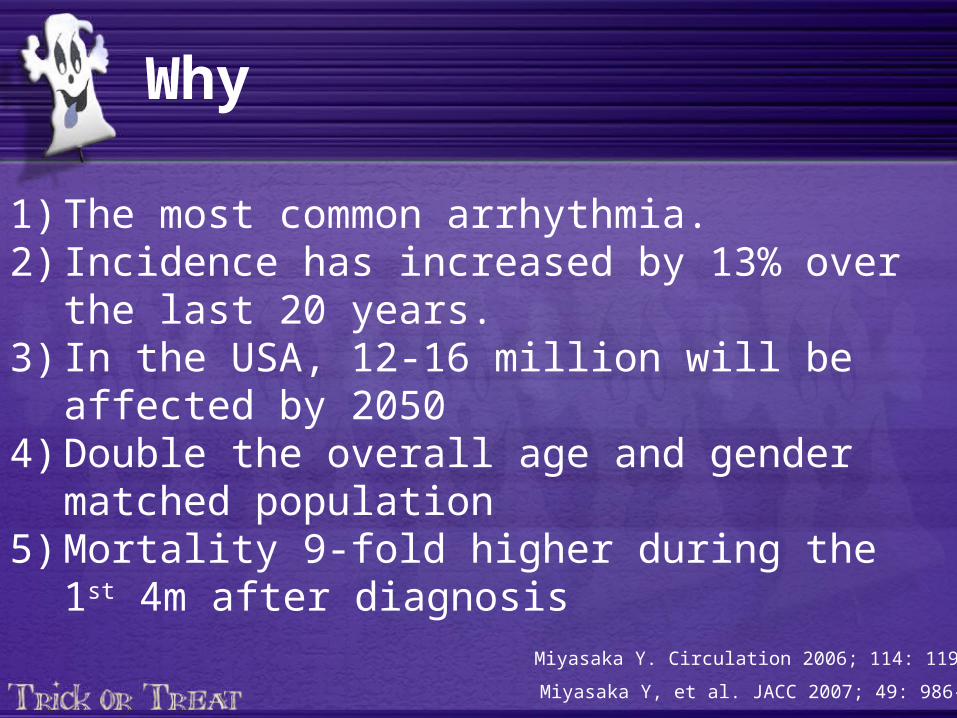
1) The most common arrhythmia.2) Incidence has increased by 13% over the last 20
years.3) In the USA, 12-16 million will be affected by 20504) Double the overall age and gender matched
population5) Mortality 9-fold higher during the 1st 4m after
diagnosis
Miyasaka Y, et al. JACC 2007; 49: 986-992
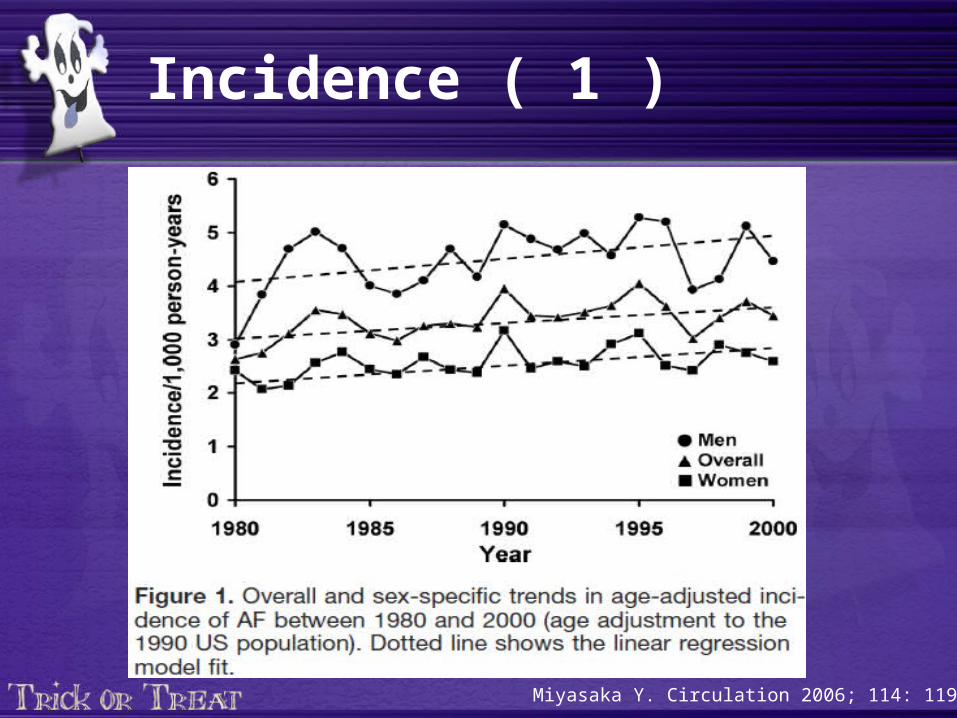
Incidence ( 1 )
Miyasaka Y. Circulation 2006; 114: 119-125
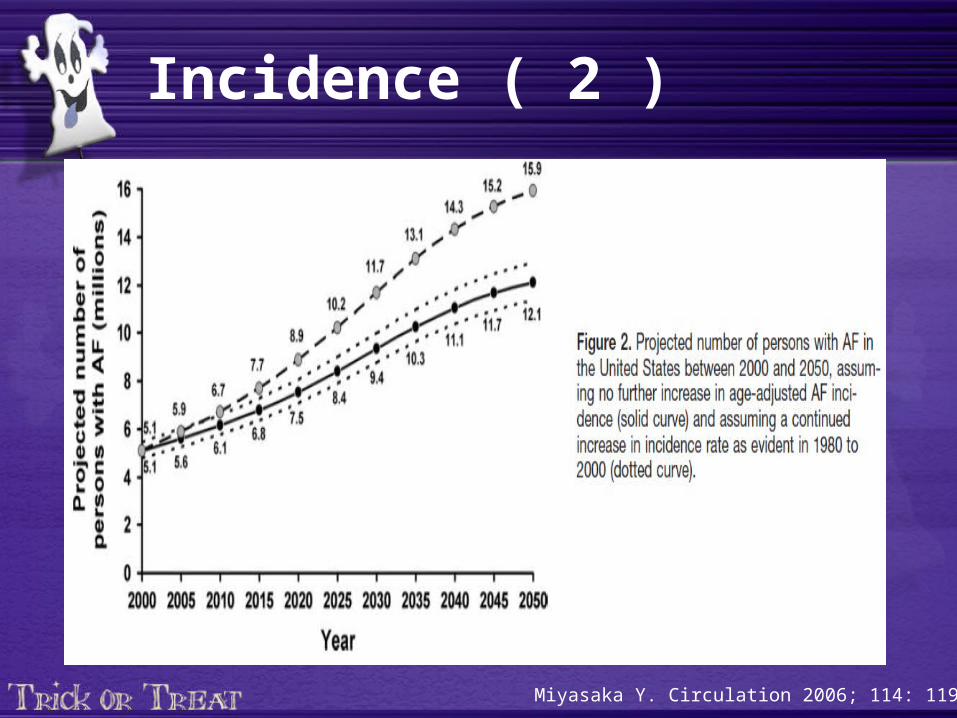
Incidence ( 2 )
Miyasaka Y. Circulation 2006; 114: 119-125
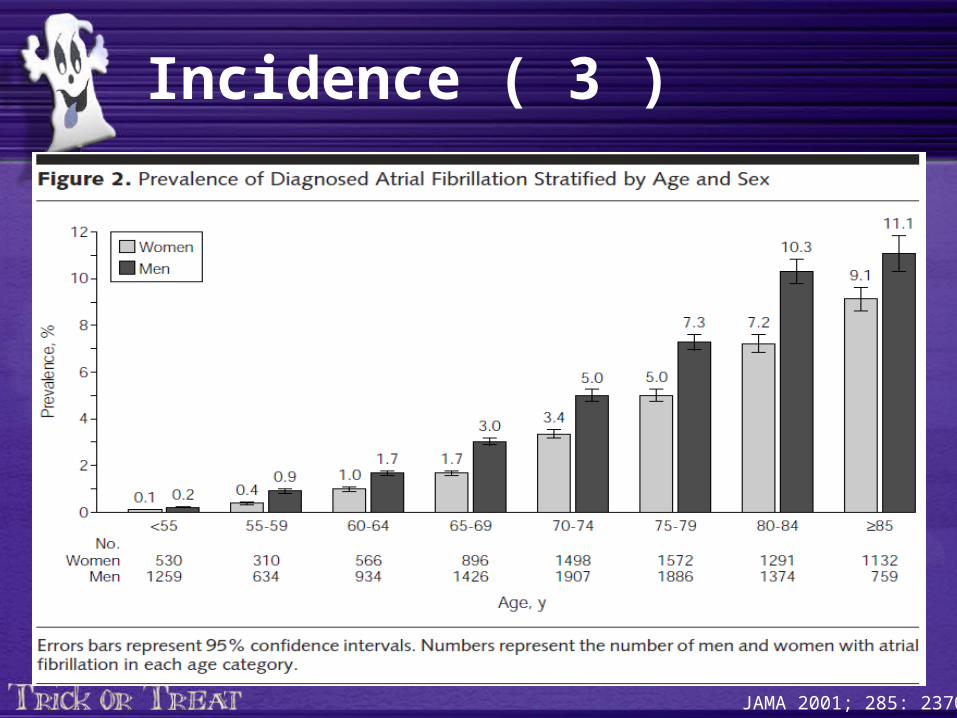
JAMA 2001; 285: 2370
Incidence ( 3 )
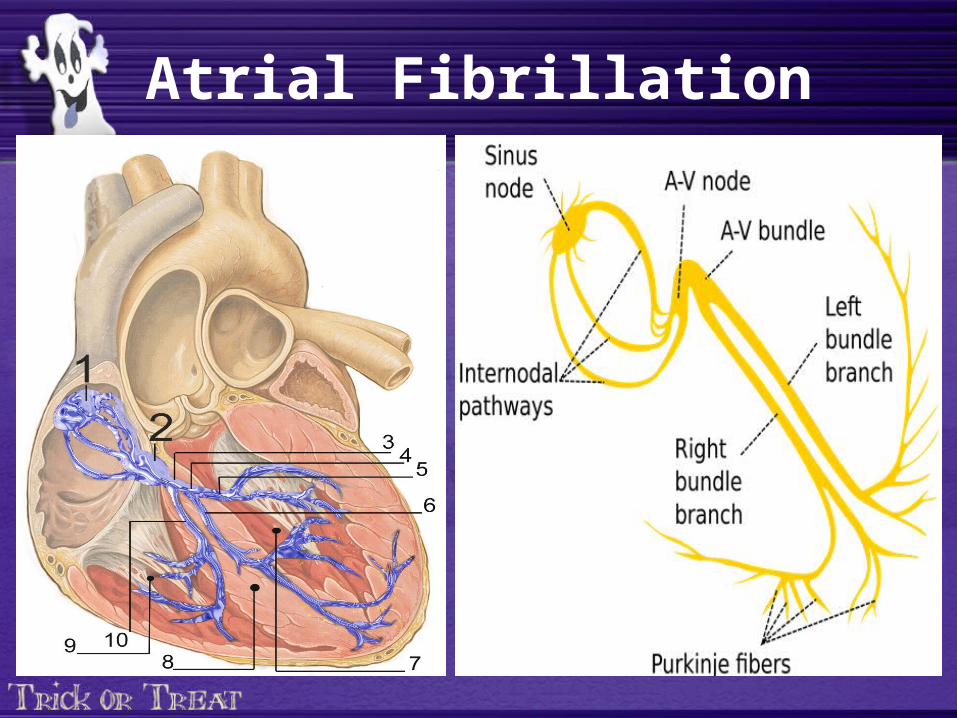
Atrial Fibrillation
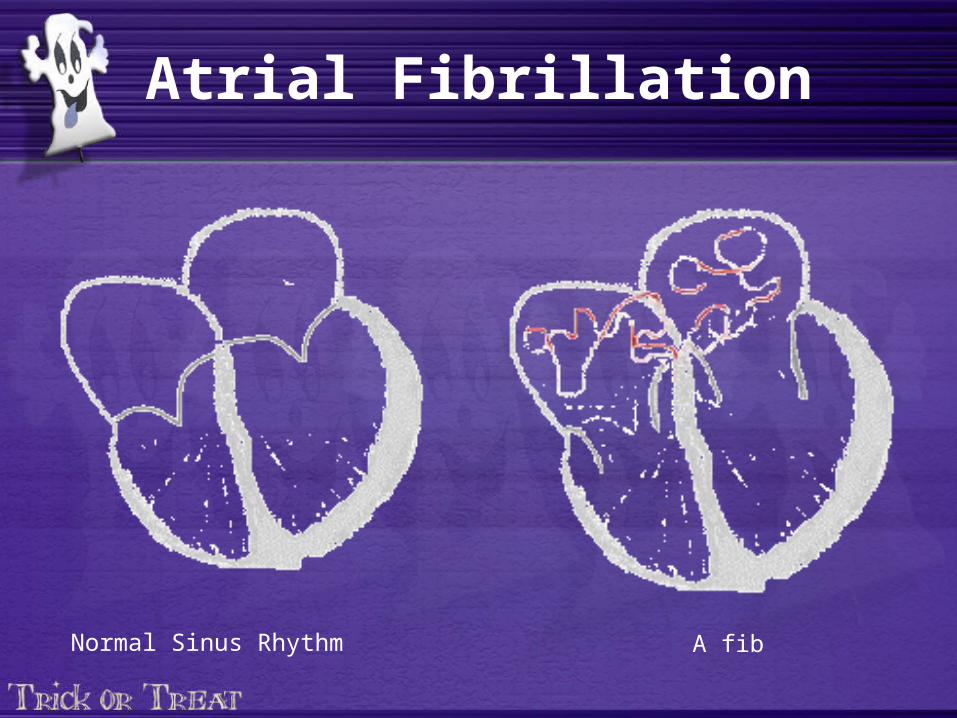
Atrial Fibrillation
Normal Sinus Rhythm A fib
Disease Associations
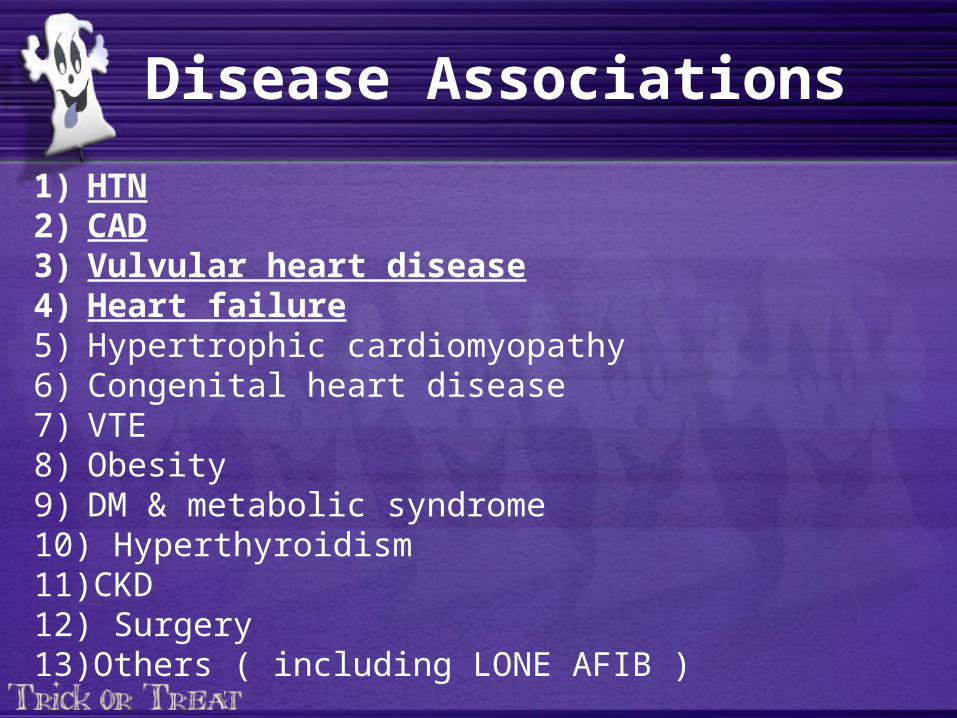
1) HTN2) CAD3) Vulvular heart disease4) Heart failure5) Hypertrophic cardiomyopathy6) Congenital heart disease7) VTE8) Obesity9) DM & metabolic syndrome10) Hyperthyroidism11) CKD12) Surgery13) Others ( including LONE AFIB )
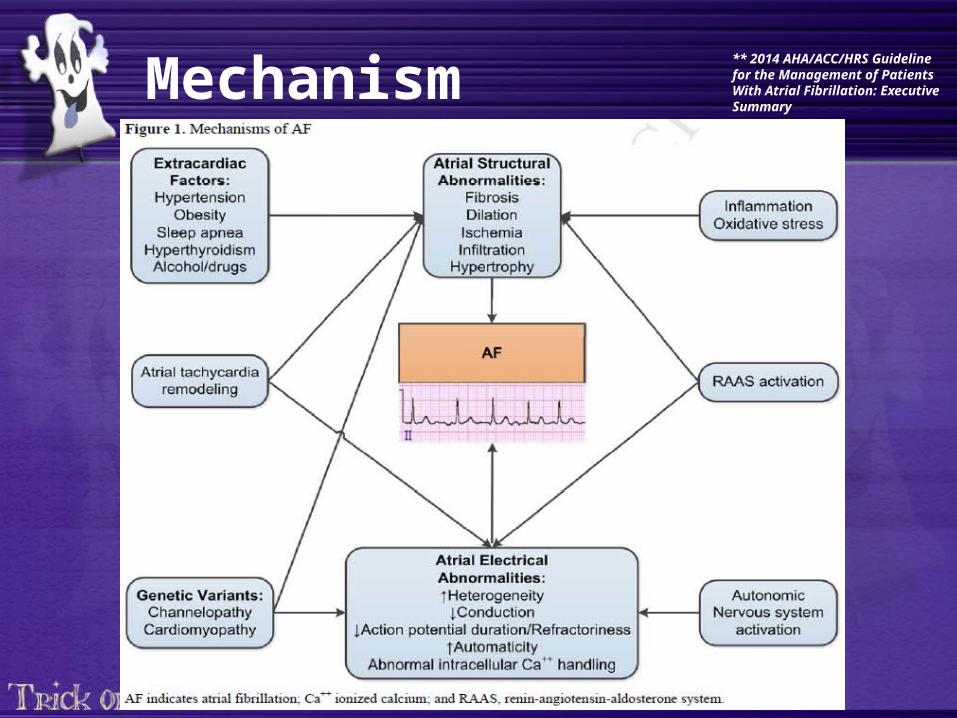
Mechanism** 2014 AHA/ACC/HRS Guideline for the Management of Patients With Atrial Fibrillation: Executive Summary
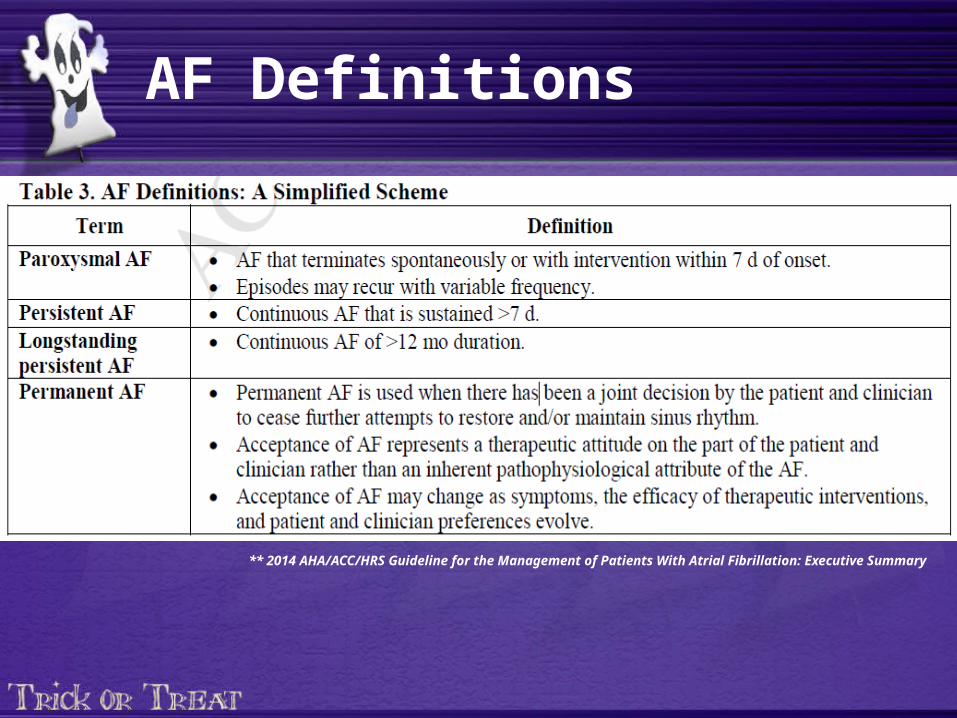
AF Definitions
** 2014 AHA/ACC/HRS Guideline for the Management of Patients With Atrial Fibrillation: Executive Summary
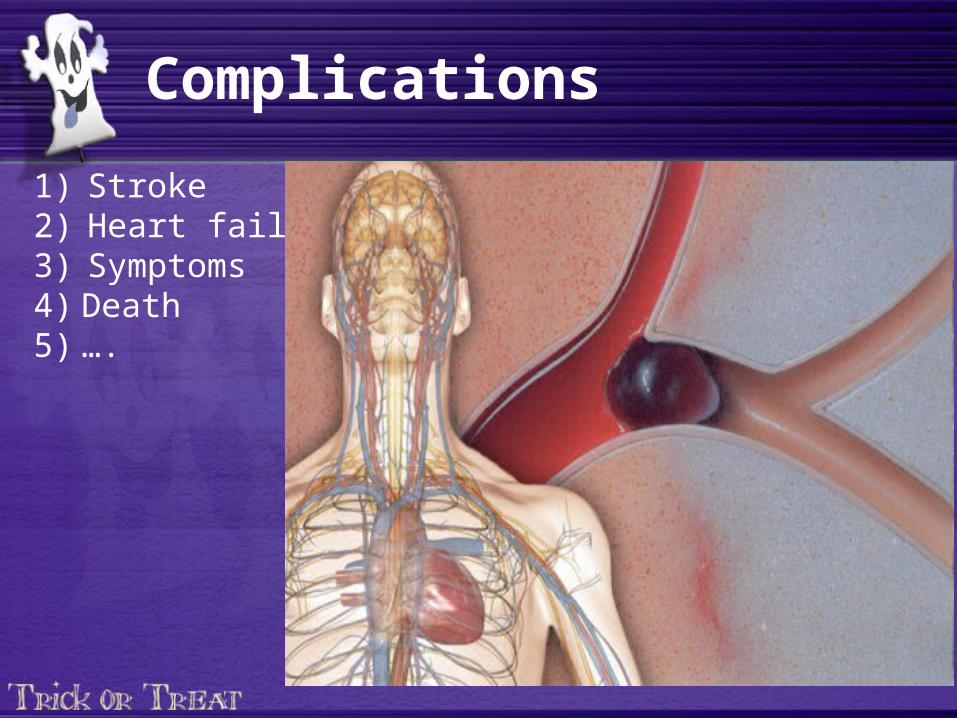
Complications
1) Stroke2) Heart failure3) Symptoms4) Death5) ….
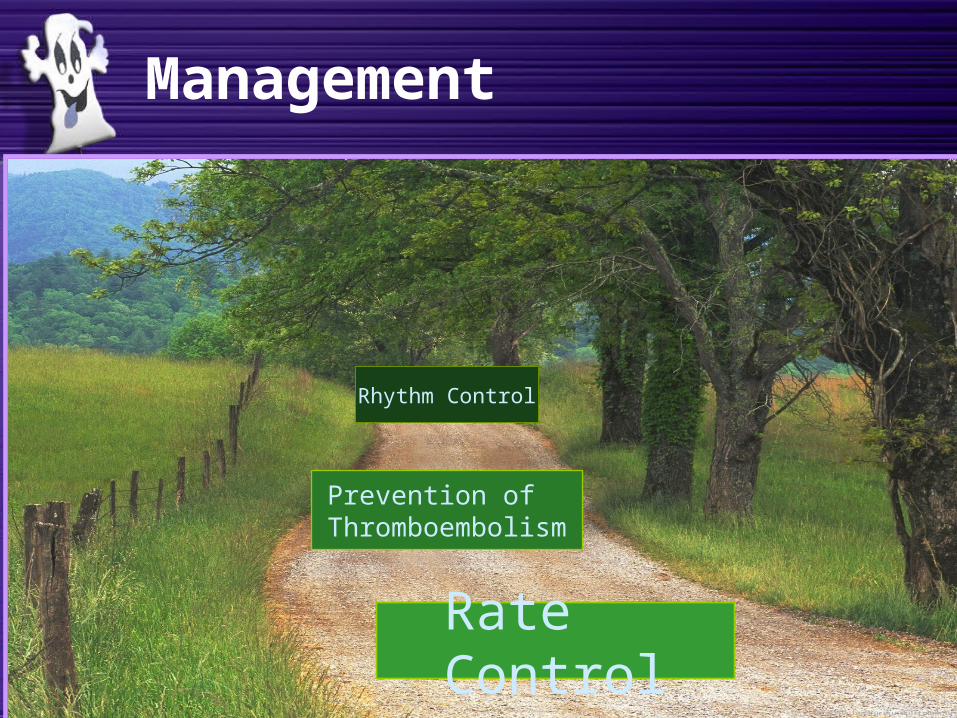
Rate Control
Prevention of Thromboembolism
Rhythm Control
Management
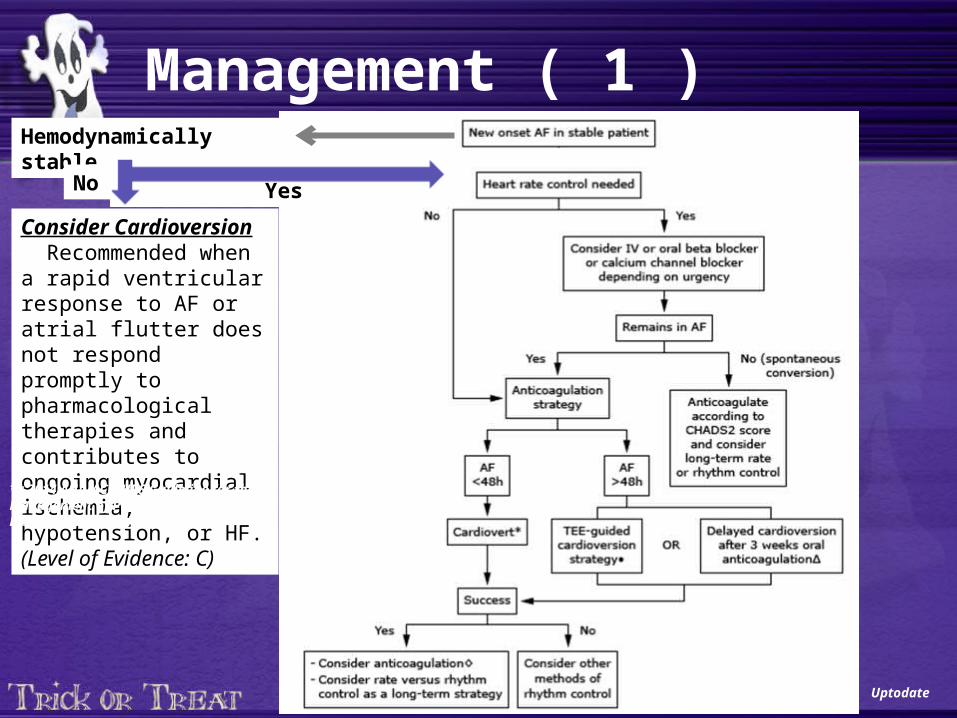
Management ( 1 )
Uptodate
Hemodynamically stable
YesNo
Consider Cardioversion Recommended when a rapid ventricular response to AF or atrial flutter does not respond promptly to pharmacological therapies and contributes to ongoing myocardial ischemia, hypotension, or HF. (Level of Evidence: C)
** 2014 AHA/ACC/HRS Guideline for the Management of Patients With Atrial Fibrillation: Executive Summary
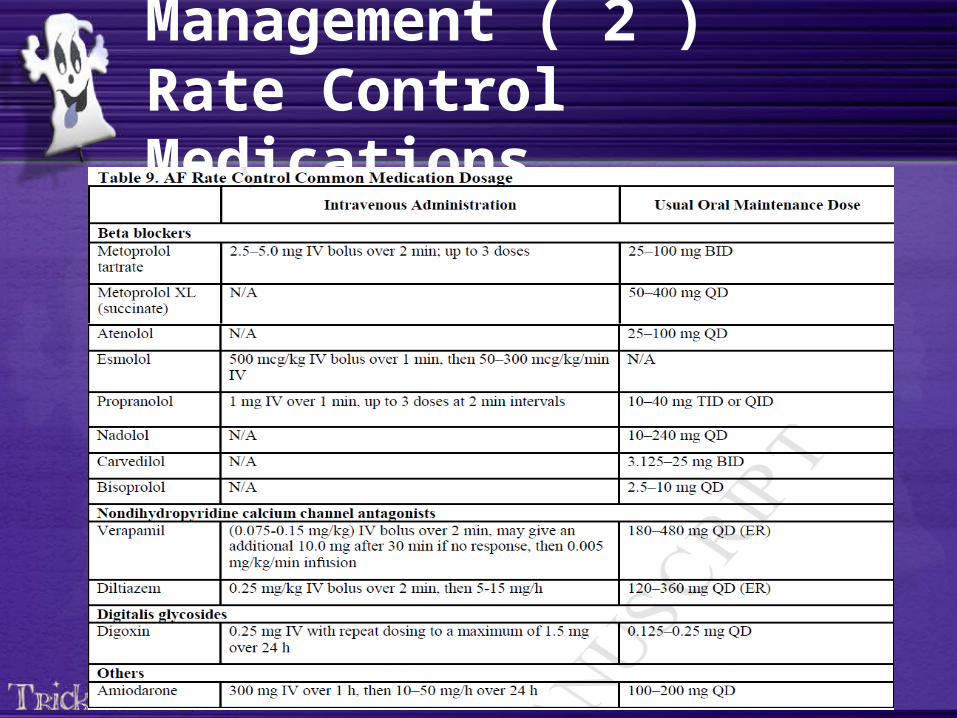
Management ( 2 )Rate Control Medications
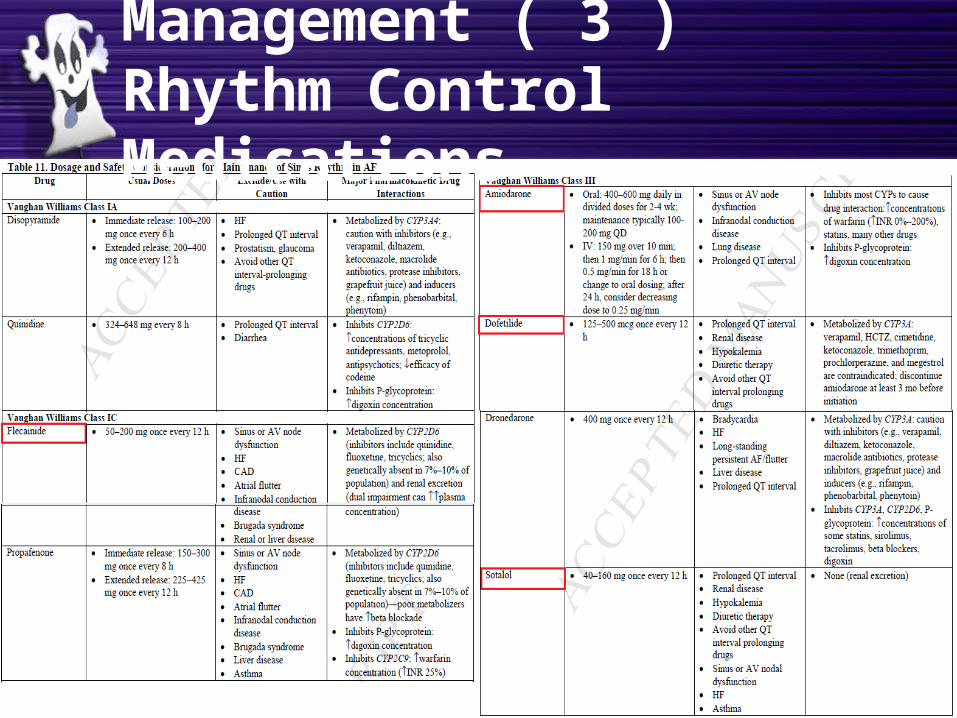
Management ( 3 )Rhythm Control Medications
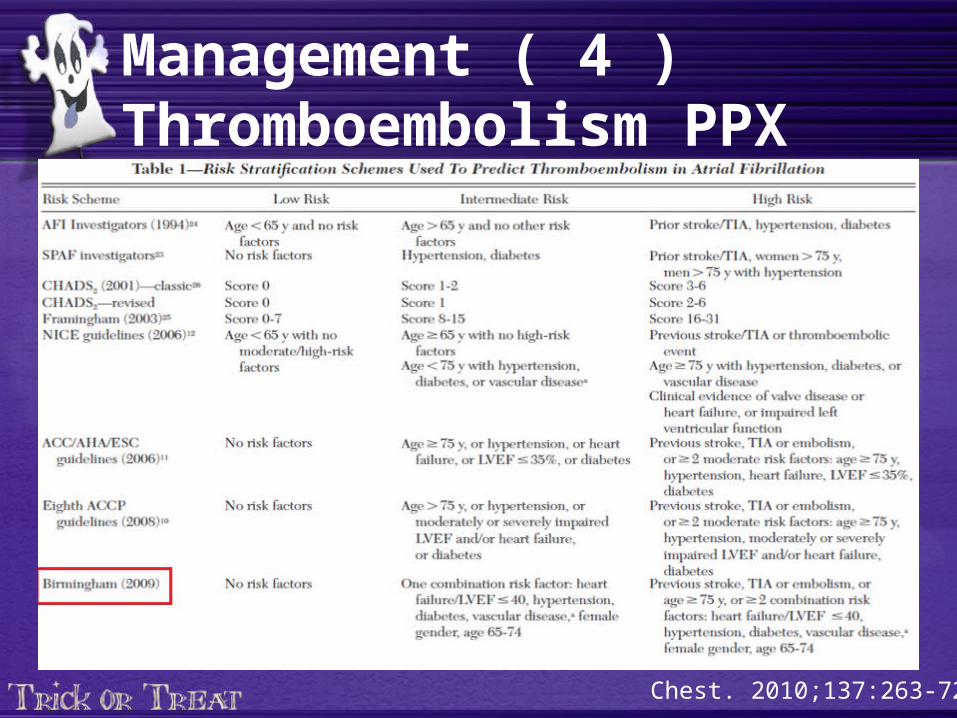
Management ( 4 )Thromboembolism PPX
Chest. 2010;137:263-72.
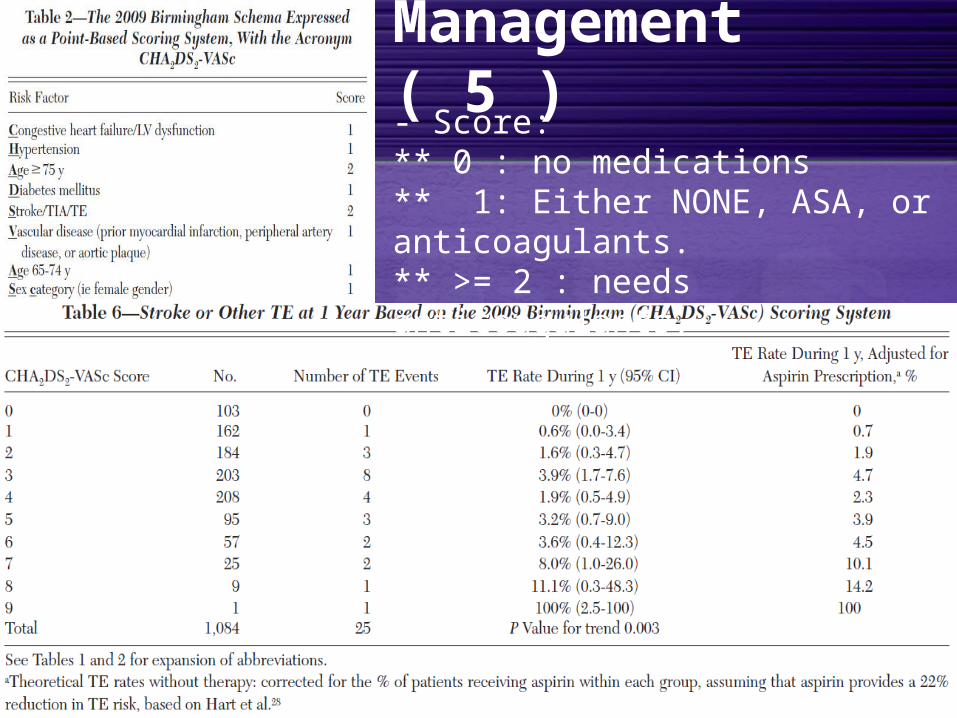
Management ( 5 )- Score:** 0 : no medications** 1: Either NONE, ASA, or anticoagulants.** >= 2 : needs anticoagulants.
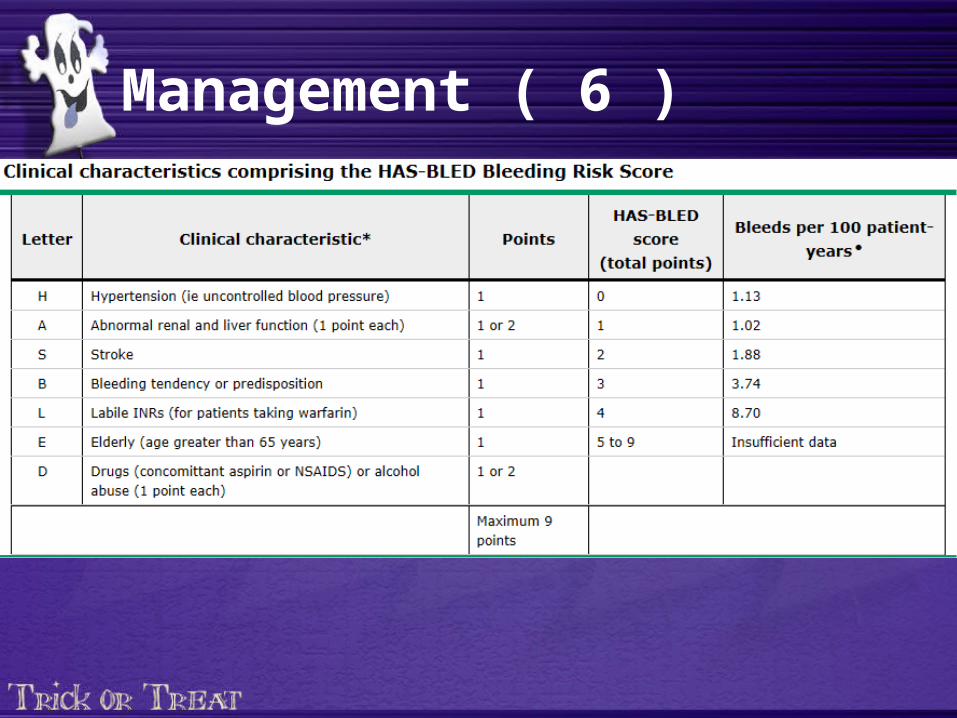
Management ( 6 )
Management ( 7 )Falling Down ?
1) Attitudes of physicians regarding anticoagulation for atrial fibrillation: a systematic review. Age Ageing. 2011 Nov;40(6):675-83. “They found that, for a patient with an average risk of stroke from AF (5% per year), it would require the patient to fall roughly 300 times per year for the risks of anticoagulant therapy to outweigh its benefits, in terms of intracranial bleeding [66]. The mean number of falls sustained annually by elderly individuals who fall is, however, only 1.81“
2) Anticoagulant-related bleeding in older persons with atrial fibrillation: physicians' fears often unfounded. Arch Intern Med. 2003;163(13):1580.
3) Choosing antithrombotic therapy for elderly patients with atrial fibrillation who are at risk for falls. Arch Intern Med. 1999;159(7):677.
4) Atrial fibrillation, anticoagulation, fall risk, and outcomes in elderly patients. Am Heart J. 2011;161(2):241.
Management ( 8 )
Others:1) DCC2) AV nodal ablation with permeant ventricular pacing.
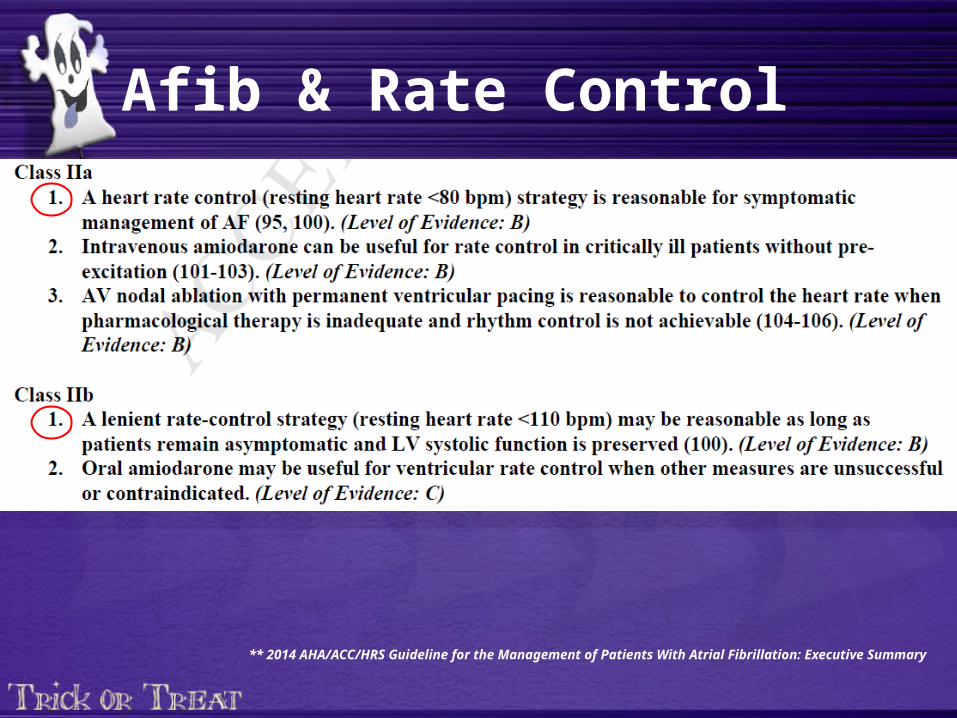
Afib & Rate Control
** 2014 AHA/ACC/HRS Guideline for the Management of Patients With Atrial Fibrillation: Executive Summary
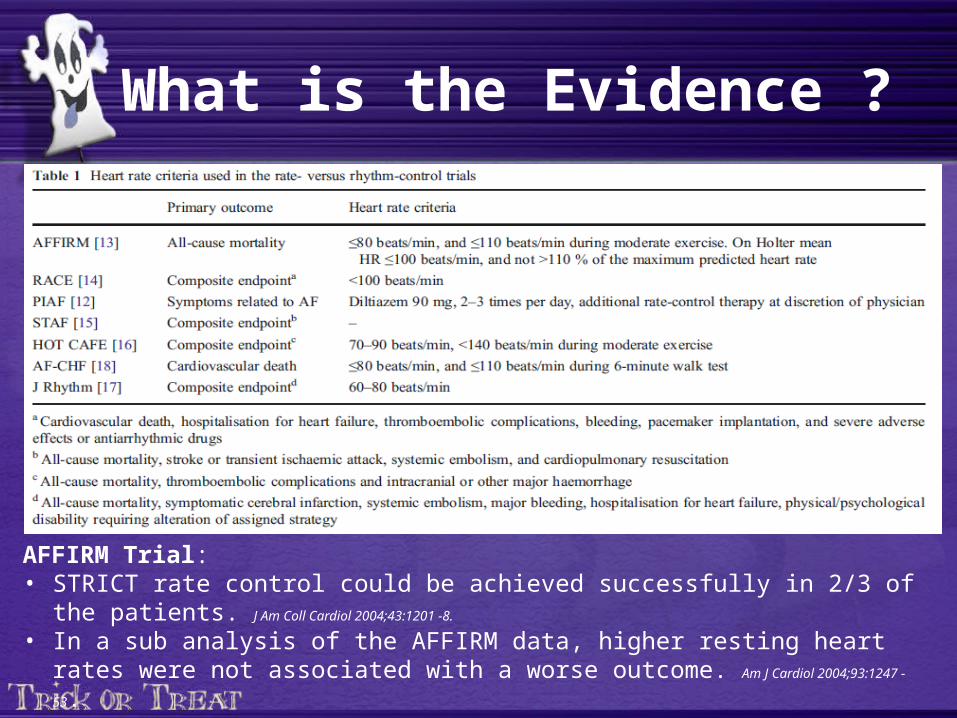
What is the Evidence ?
AFFIRM Trial:• STRICT rate control could be achieved successfully in 2/3 of the patients. J Am Coll
Cardiol 2004;43:1201 -8.
• In a sub analysis of the AFFIRM data, higher resting heart rates were not associated with a worse outcome. Am J Cardiol 2004;93:1247 - 53.
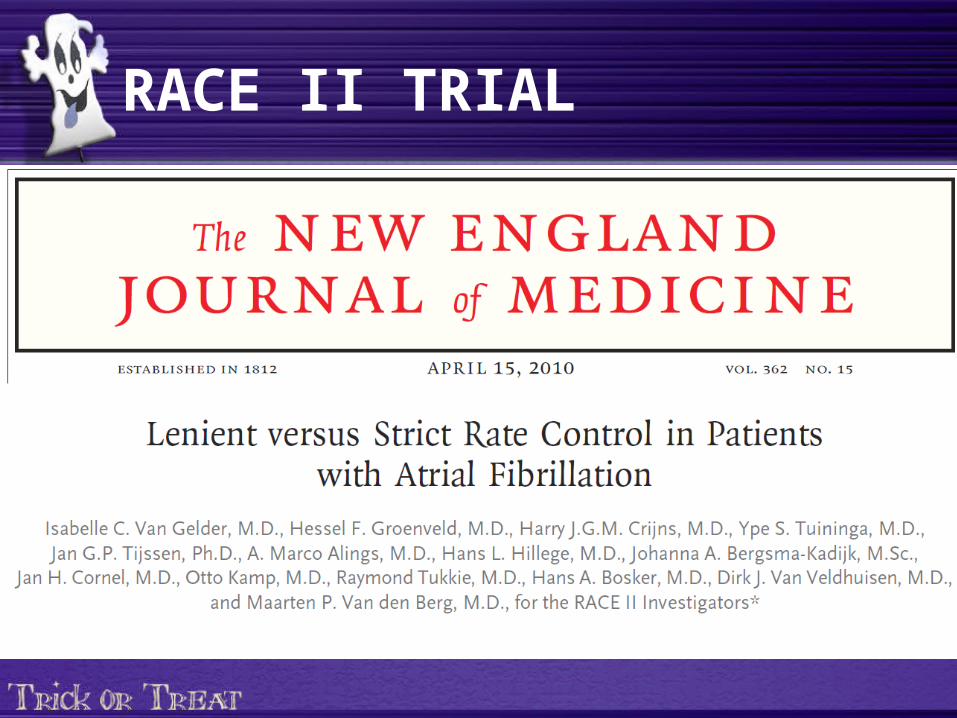
RACE II TRIAL
* The RAte Control Efficacy in Permanent Atrial Fibrillation: a Comparison between Lenient versus Strict Rate Control II (RACE II).
* Designed to find the optimal heart-rate control in permeant afib. IS STRICT RATE CONTROL ASSOCIATED WITH IMPROVED PROGNOSIS COMPARED TO MORE LENIENT APPROACH ?
* The study was funded by a major grant from the Netherlands Heart Foundation and by unrestricted educational grants from pharmaceutical and device companies
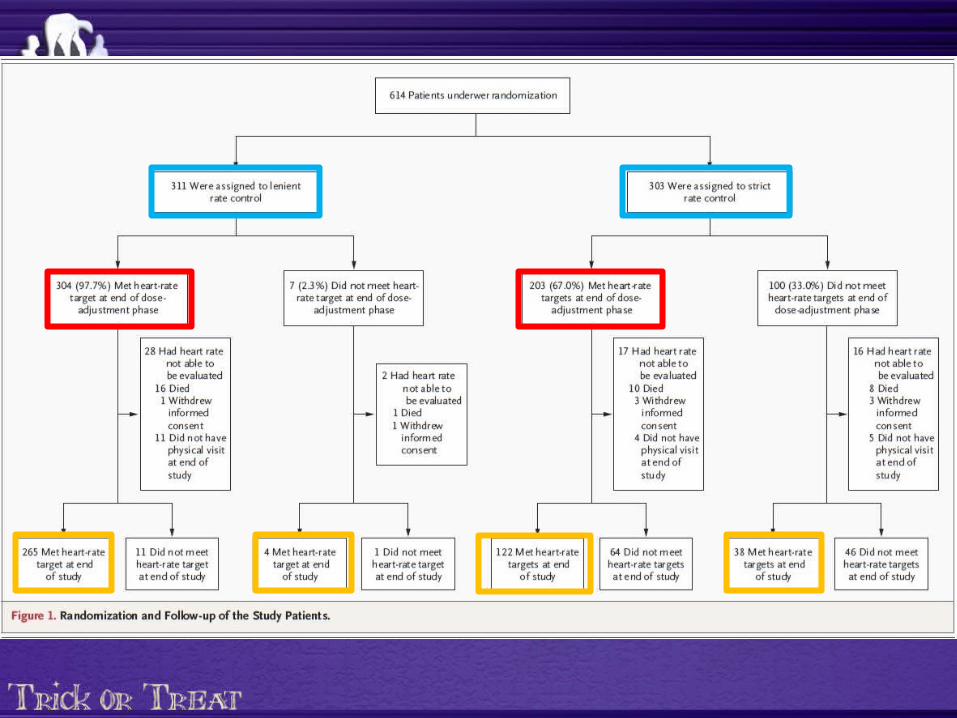
RACE II TRIAL
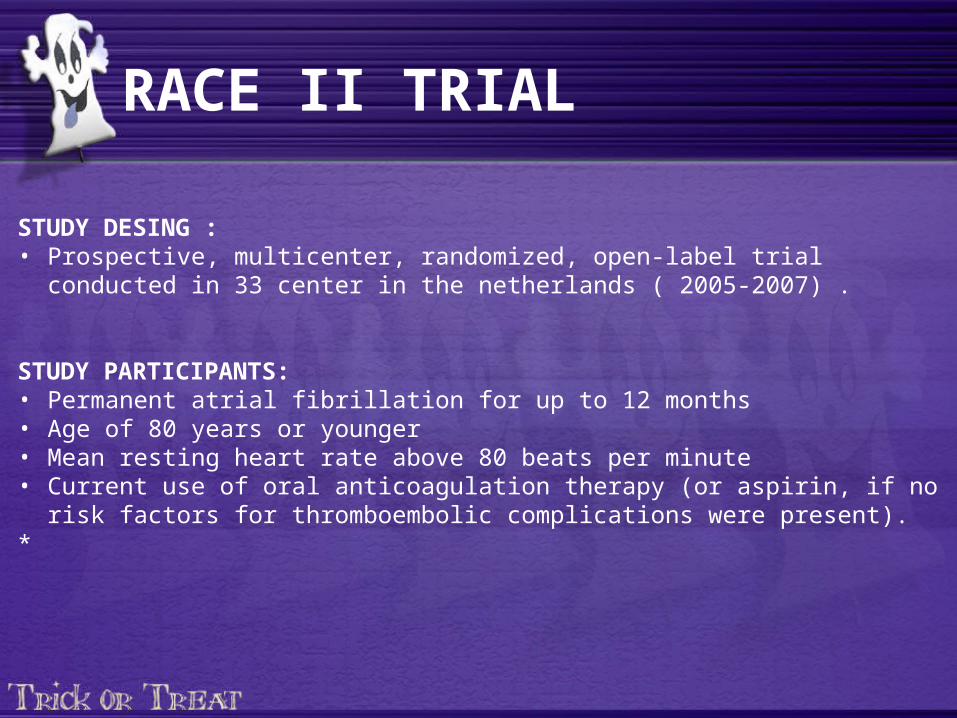
STUDY DESING :• Prospective, multicenter, randomized, open-label trial conducted in 33 center in the
netherlands ( 2005-2007) .
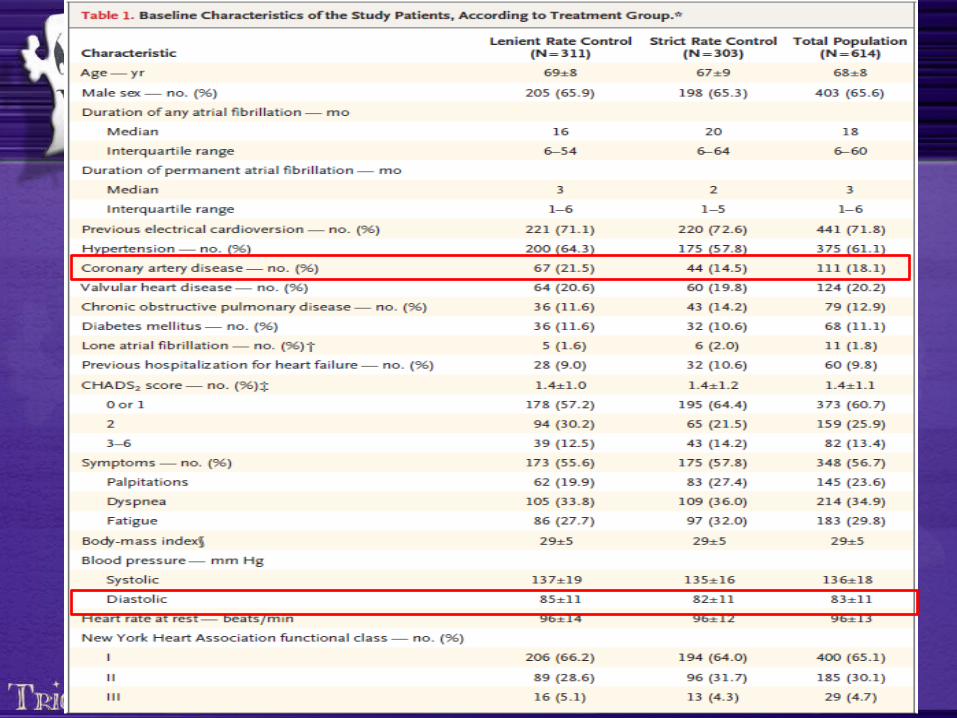
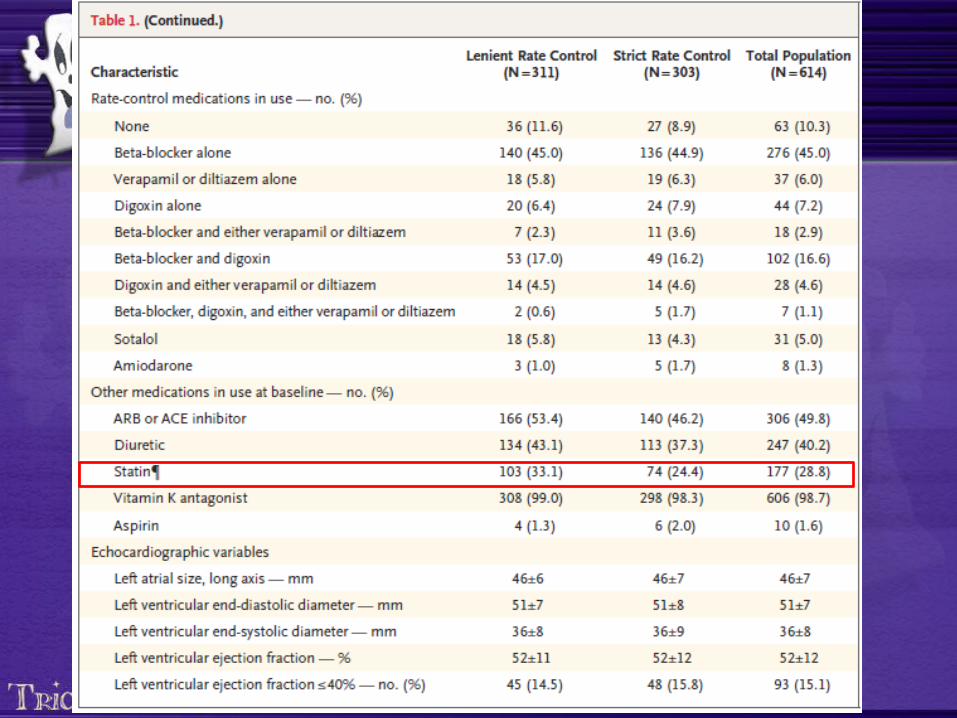
STUDY PARTICIPANTS:• Permanent atrial fibrillation for up to 12 months• Age of 80 years or younger• Mean resting heart rate above 80 beats per minute• Current use of oral anticoagulation therapy (or aspirin, if no risk factors for
thromboembolic complications were present).*
RACE II TRIAL
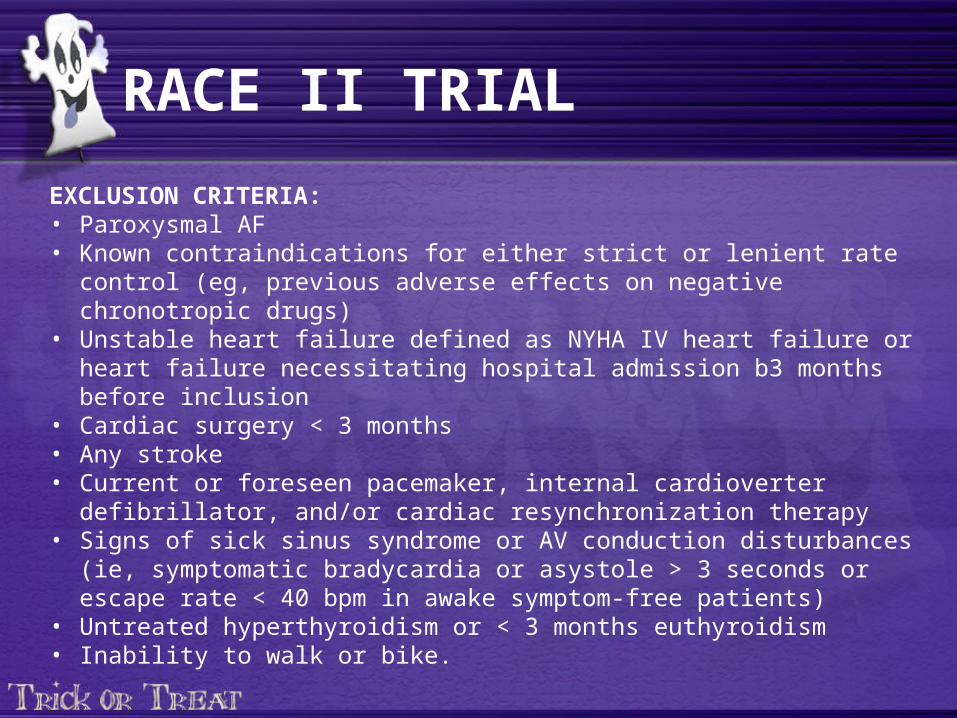
EXCLUSION CRITERIA:• Paroxysmal AF• Known contraindications for either strict or lenient rate control (eg, previous
adverse effects on negative chronotropic drugs)• Unstable heart failure defined as NYHA IV heart failure or heart failure
necessitating hospital admission b3 months before inclusion• Cardiac surgery < 3 months• Any stroke• Current or foreseen pacemaker, internal cardioverter defibrillator, and/or cardiac
resynchronization therapy• Signs of sick sinus syndrome or AV conduction disturbances (ie, symptomatic
bradycardia or asystole > 3 seconds or escape rate < 40 bpm in awake symptom-free patients)
• Untreated hyperthyroidism or < 3 months euthyroidism• Inability to walk or bike.
RACE II TRIAL
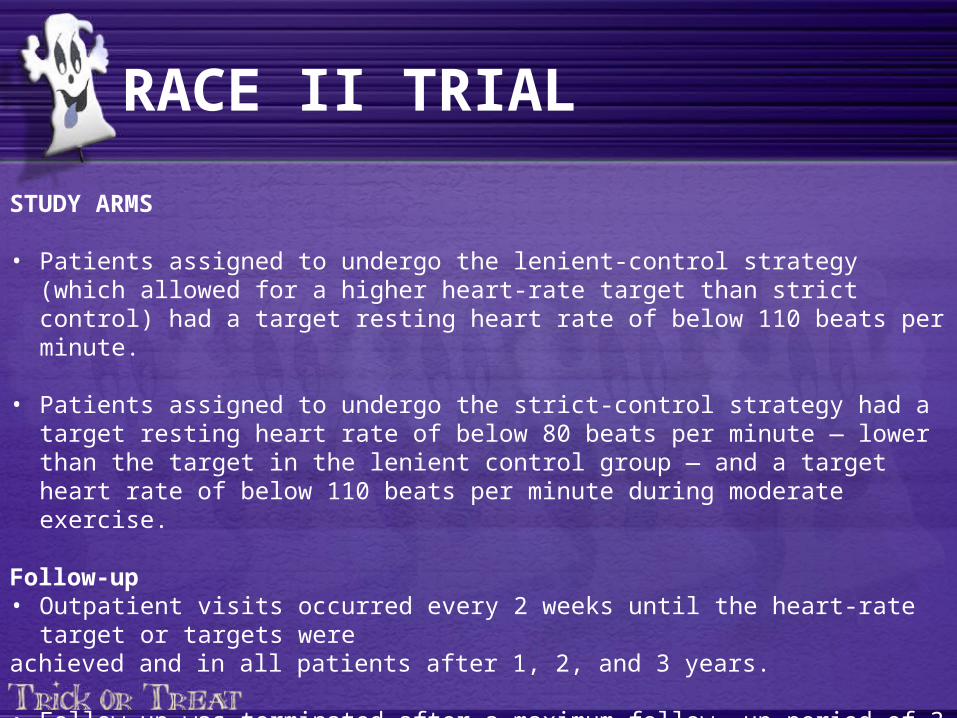
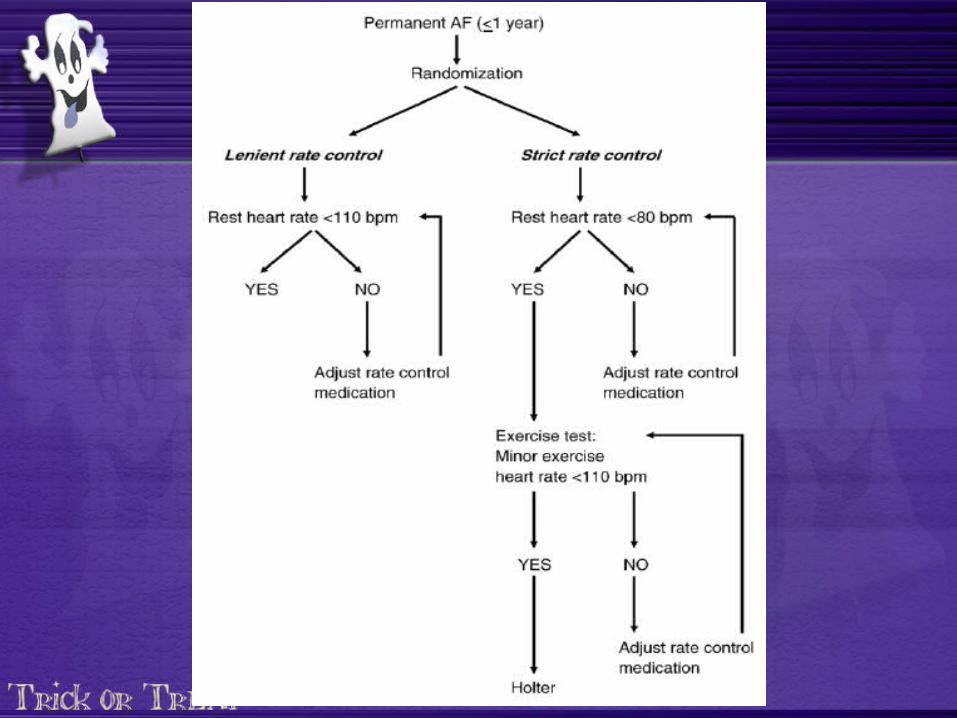
STUDY ARMS
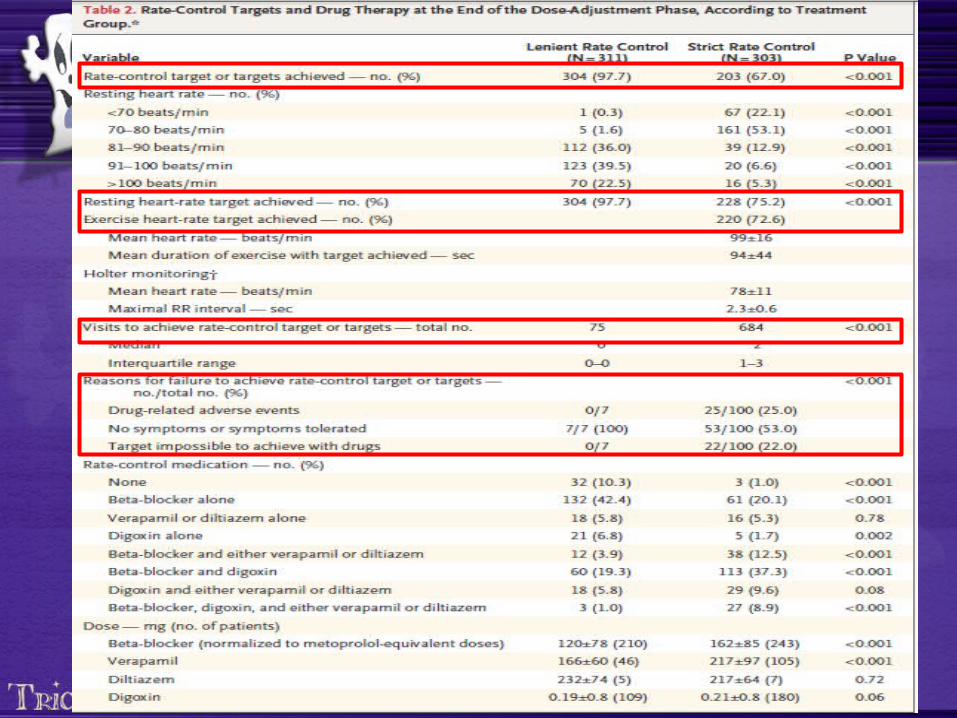
• Patients assigned to undergo the lenient-control strategy (which allowed for a higher heart-rate target than strict control) had a target resting heart rate of below 110 beats per minute.
• Patients assigned to undergo the strict-control strategy had a target resting heart rate of below 80 beats per minute — lower than the target in the lenient control group — and a target heart rate of below 110 beats per minute during moderate exercise.
Follow-up • Outpatient visits occurred every 2 weeks until the heart-rate target or targets wereachieved and in all patients after 1, 2, and 3 years.
• Follow-up was terminated after a maximum follow- up period of 3 years or on June 30, 2009,whichever came first.
RACE II TRIAL
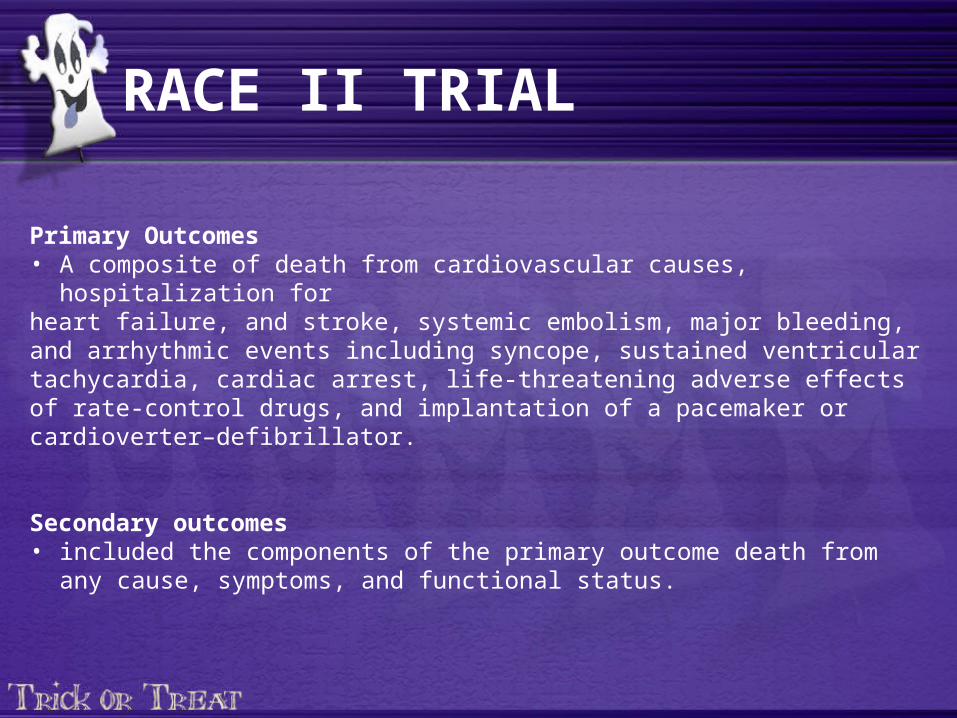
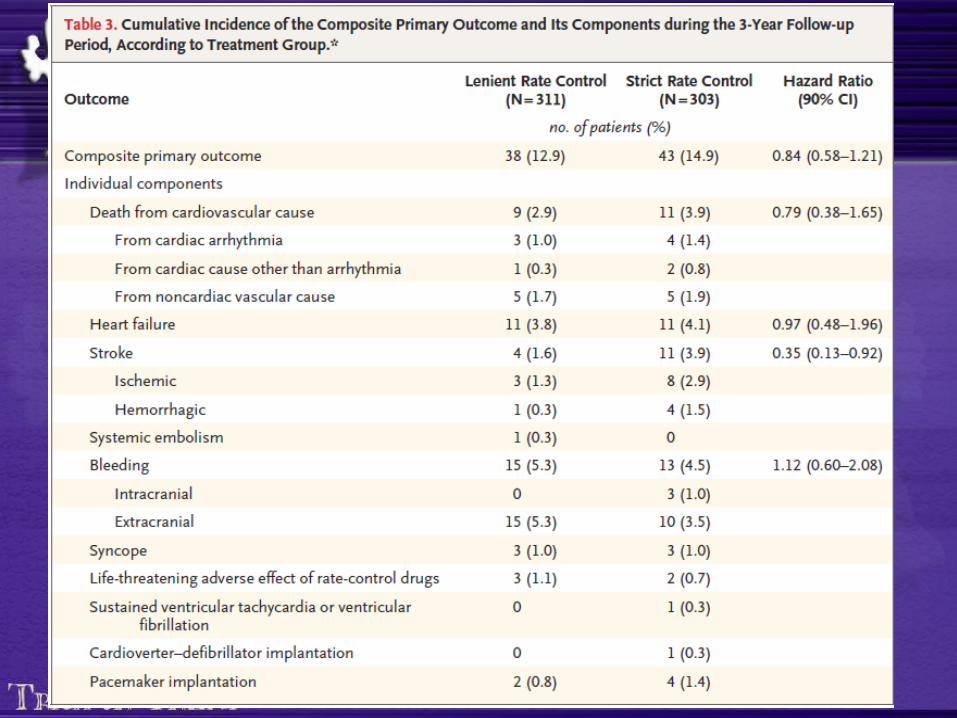
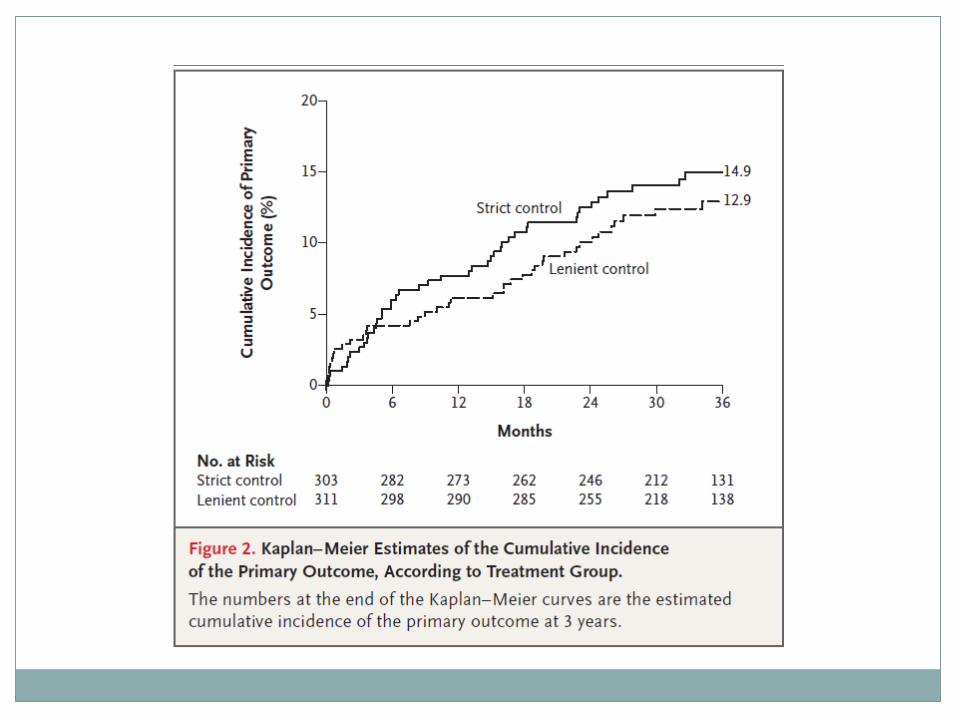
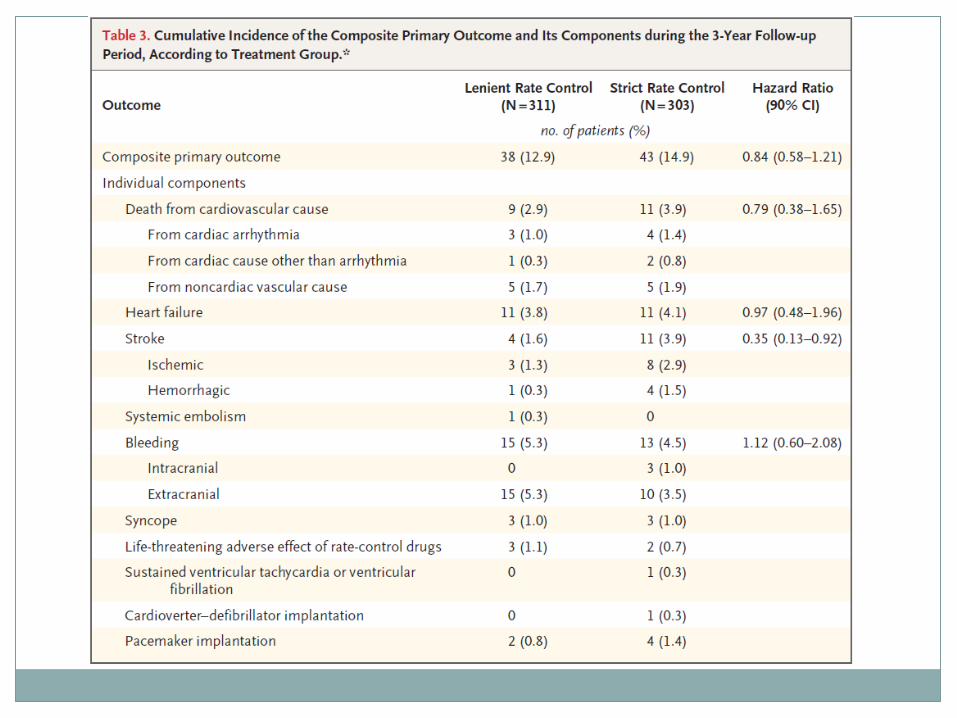
Primary Outcomes• A composite of death from cardiovascular causes, hospitalization forheart failure, and stroke, systemic embolism, major bleeding, and arrhythmic events including syncope, sustained ventricular tachycardia, cardiac arrest, life-threatening adverse effects of rate-control drugs, and implantation of a pacemaker or cardioverter–defibrillator.
Secondary outcomes • included the components of the primary outcome death from any cause,
symptoms, and functional status.
RACE II TRIAL
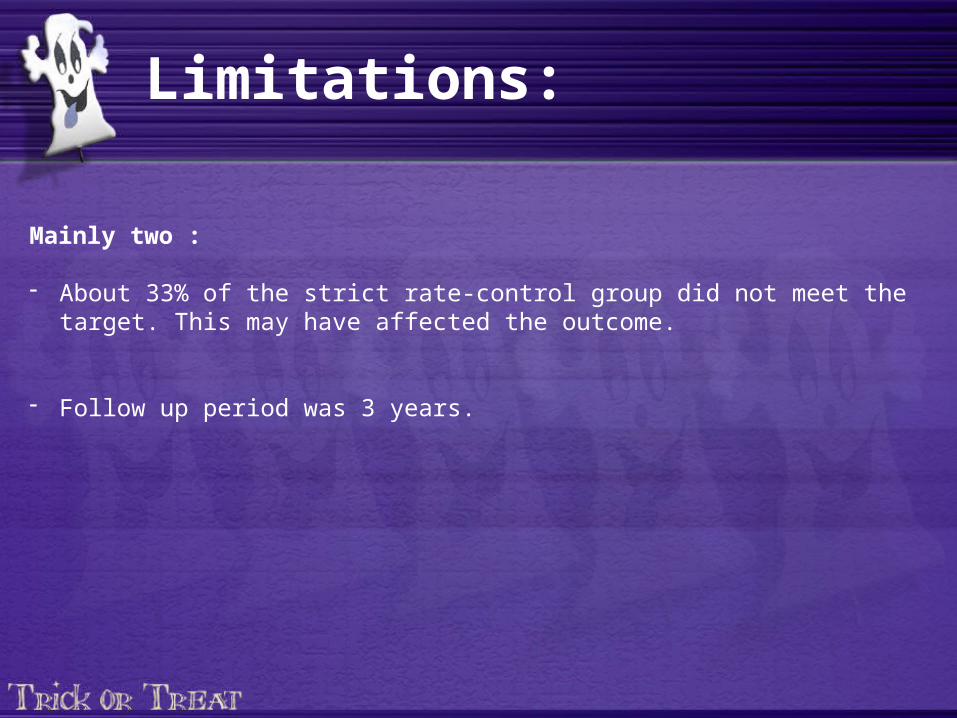
Limitations:
Mainly two :
- About 33% of the strict rate-control group did not meet the target. This may have affected the outcome.
- Follow up period was 3 years.
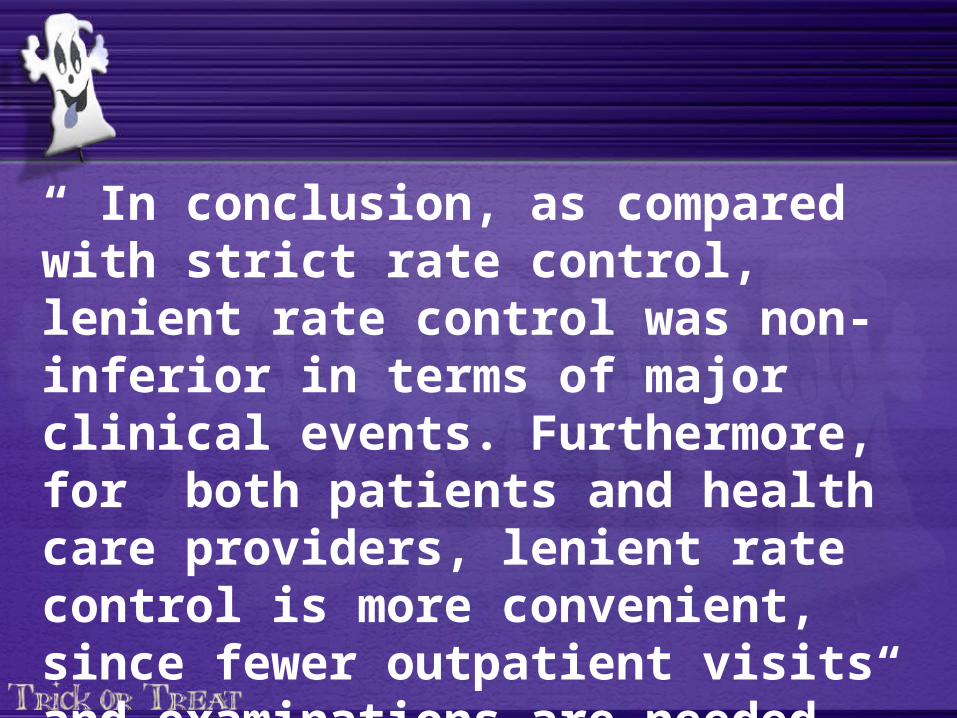
“ In conclusion, as compared with strict rate control, lenient rate control was non-inferior in terms of major clinical events. Furthermore, for both patients and health care providers, lenient rate control is more convenient, since fewer outpatient visits and examinations are needed.”

N e x t : S t a t i s t i c s
CONFIDENCE INTERVALS AND SIGNIFICANCE TESTING
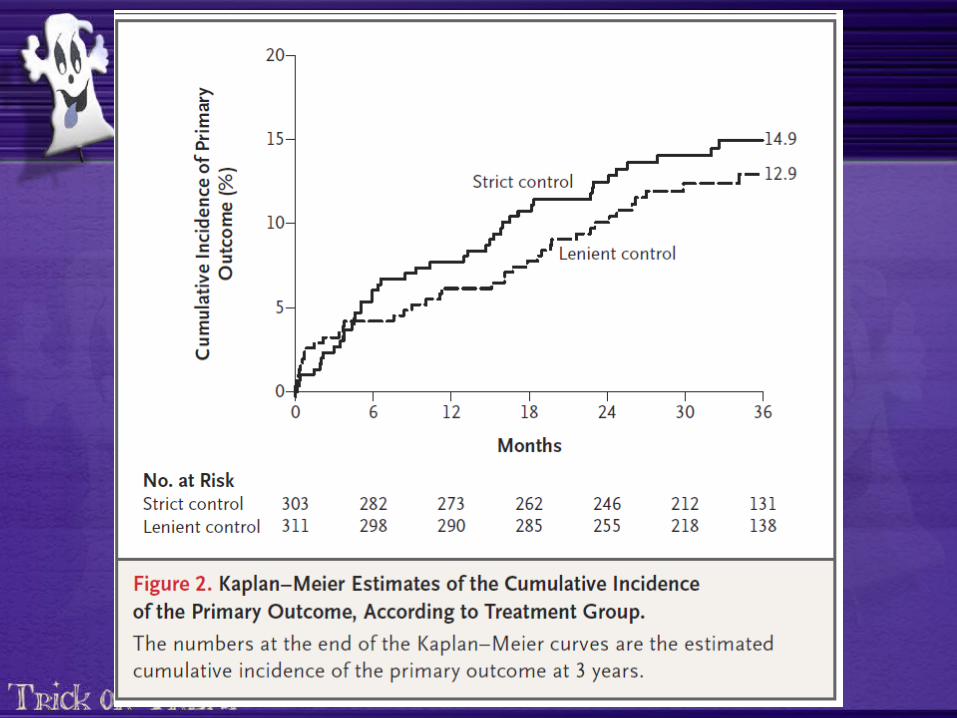
Kaplan Meier Curves with Cumulative Incidence
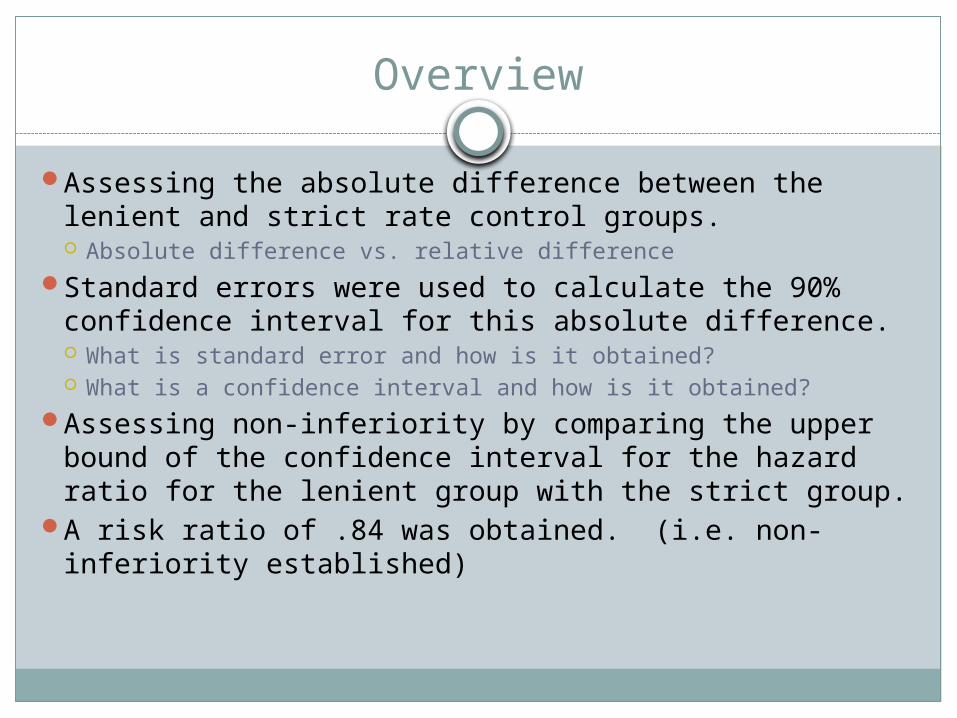
Overview
Assessing the absolute difference between the lenient and strict rate control groups. Absolute difference vs. relative difference
Standard errors were used to calculate the 90% confidence interval for this absolute difference. What is standard error and how is it obtained? What is a confidence interval and how is it obtained?
Assessing non-inferiority by comparing the upper bound of the confidence interval for the hazard ratio for the lenient group with the strict group.
A risk ratio of .84 was obtained. (i.e. non-inferiority established)
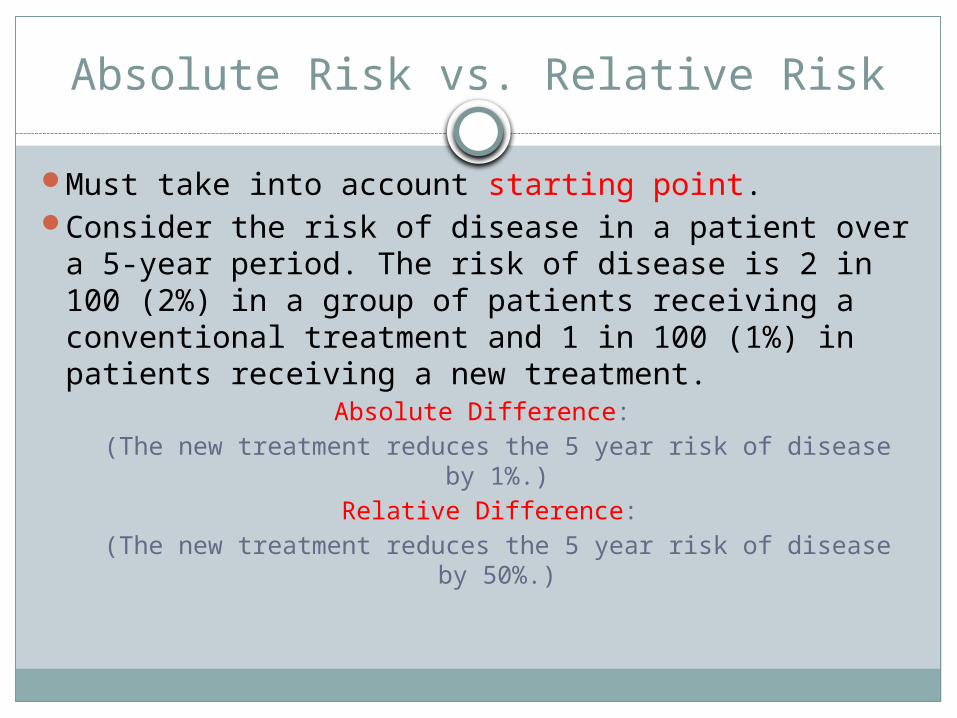
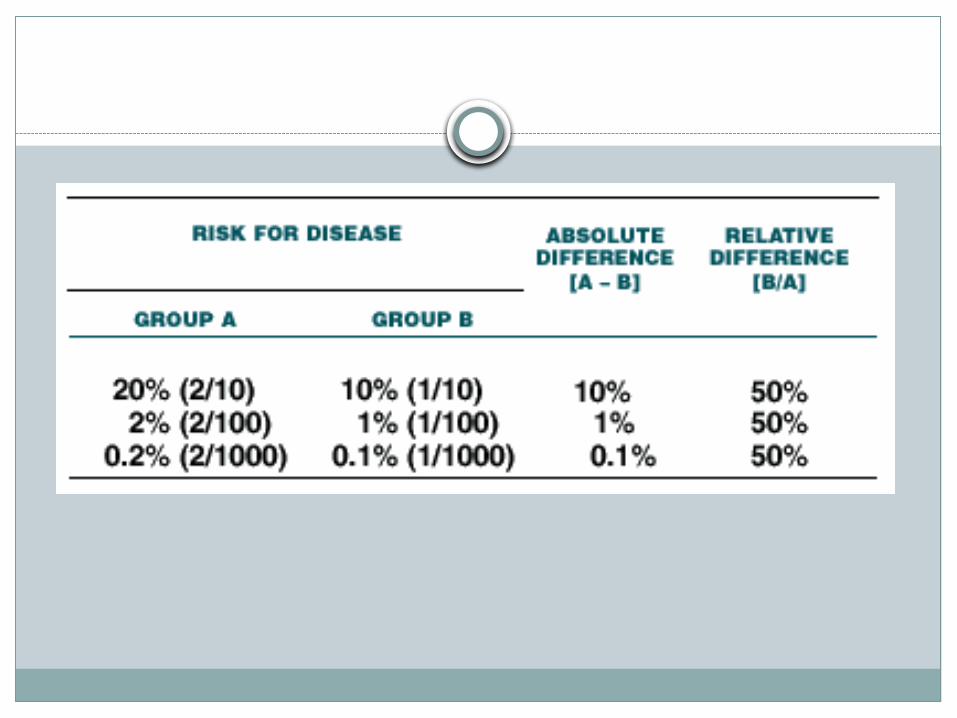
Absolute Risk vs. Relative Risk
Must take into account starting point.Consider the risk of disease in a patient over a 5-
year period. The risk of disease is 2 in 100 (2%) in a group of patients receiving a conventional treatment and 1 in 100 (1%) in patients receiving a new treatment.
Absolute Difference: (The new treatment reduces the 5 year risk of disease by
1%.)Relative Difference:
(The new treatment reduces the 5 year risk of disease by 50%.)
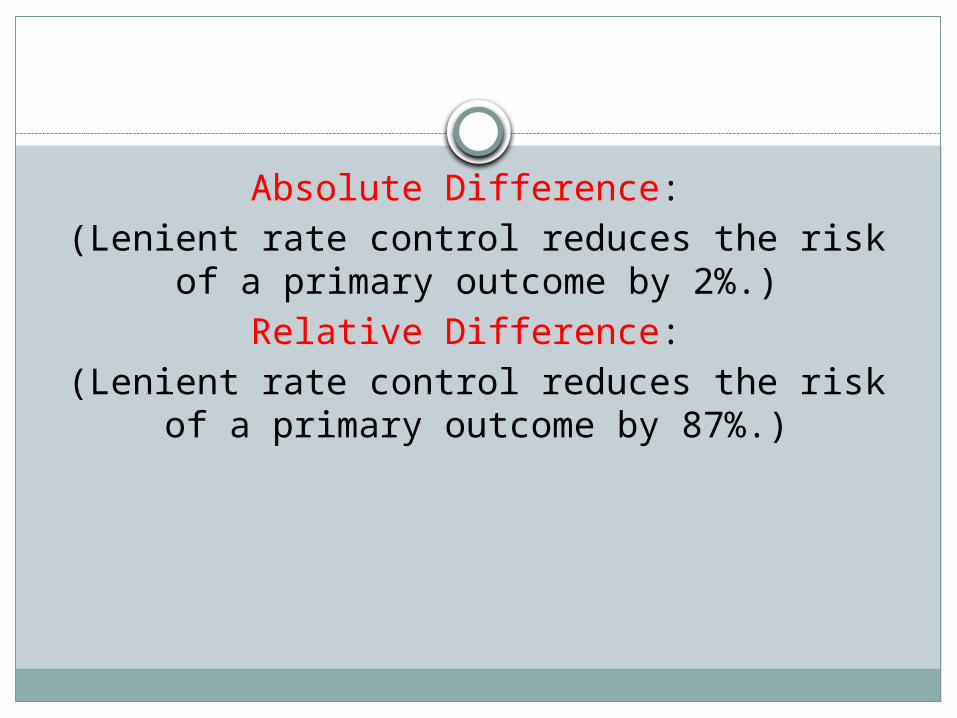
Absolute Difference: (Lenient rate control reduces the risk of a
primary outcome by 2%.)Relative Difference:
(Lenient rate control reduces the risk of a primary outcome by 87%.)
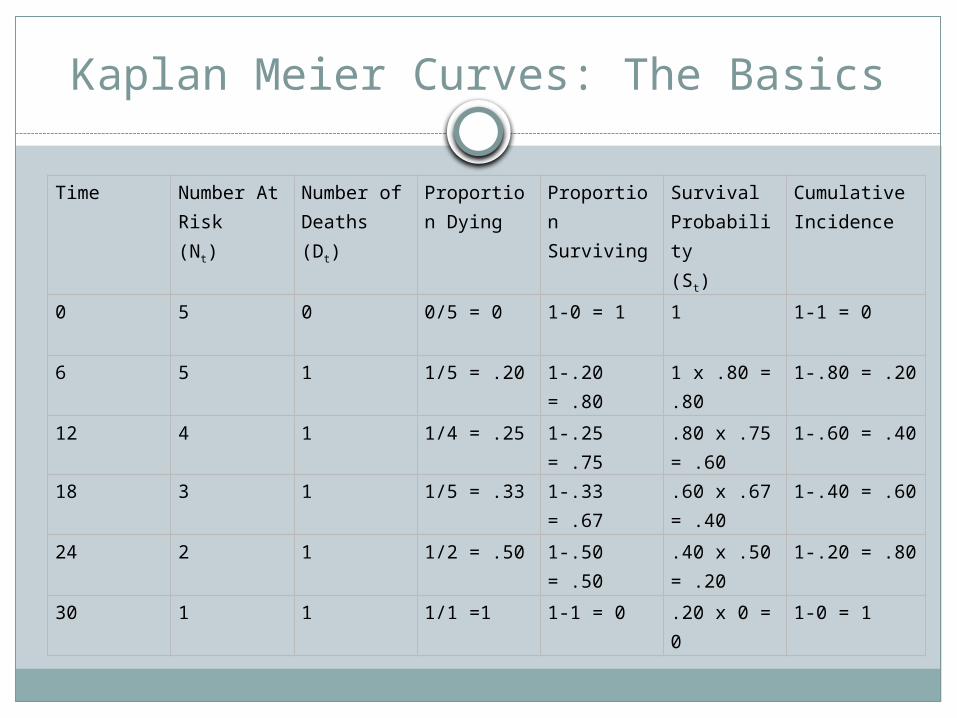
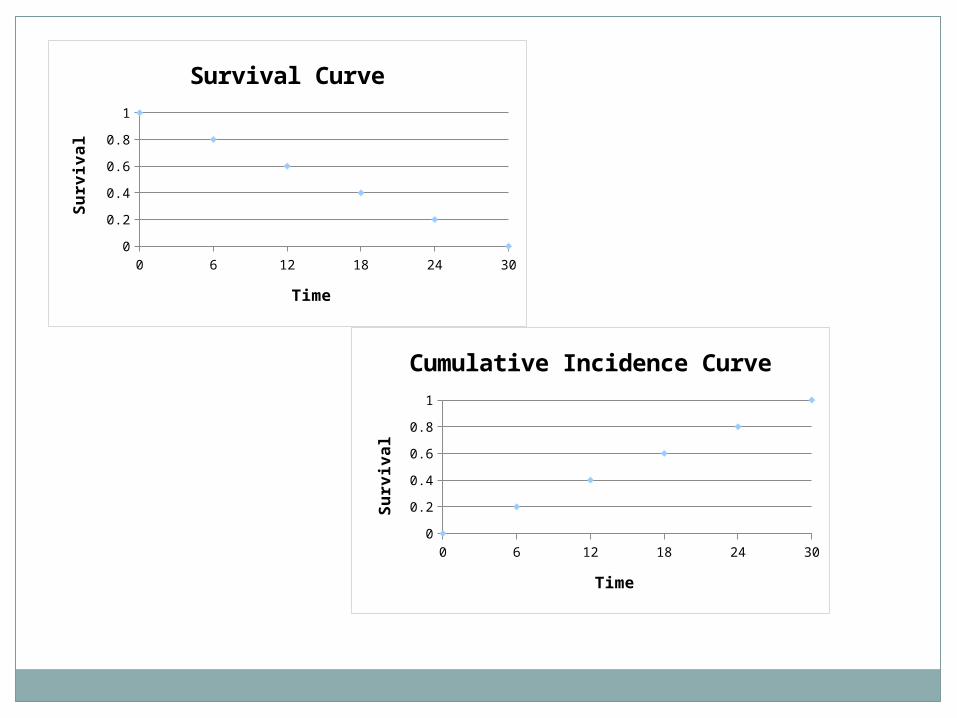
Kaplan Meier Curves: The Basics
Time Number At Risk(Nt)
Number of Deaths(Dt)
Proportion Dying
Proportion Surviving
Survival Probability (St)
Cumulative Incidence
0 5 0 0/5 = 0 1-0 = 1 1 1-1 = 0
6 5 1 1/5 = .20 1-.20 = .80 1 x .80 = .80
1-.80 = .20
12 4 1 1/4 = .25 1-.25 = .75 .80 x .75 = .60
1-.60 = .40
18 3 1 1/5 = .33 1-.33 = .67 .60 x .67 = .40
1-.40 = .60
24 2 1 1/2 = .50 1-.50 = .50 .40 x .50 = .20
1-.20 = .80
30 1 1 1/1 =1 1-1 = 0 .20 x 0 = 0 1-0 = 1
0 6 12 18 24 300
0.2
0.4
0.6
0.8
1
Survival Curve
Time
Su
rviv
al
0 6 12 18 24 300
0.2
0.4
0.6
0.8
1
Cumulative Incidence Curve
Time
Su
rviv
al
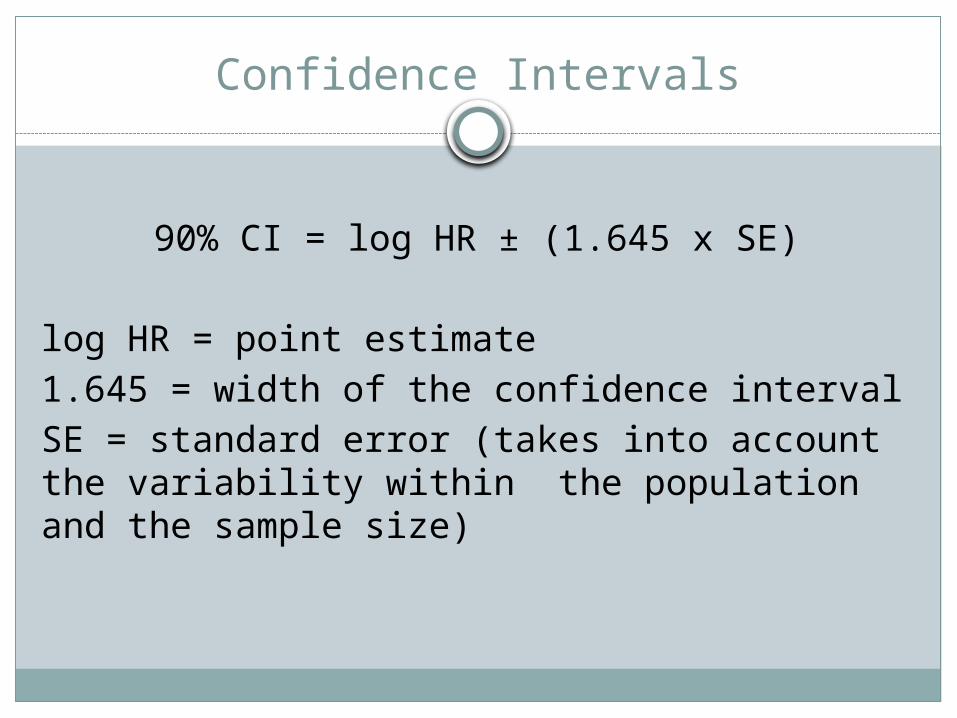
Confidence Intervals
90% CI = log HR ± (1.645 x SE)
log HR = point estimate1.645 = width of the confidence interval SE = standard error (takes into account the variability within the population and the sample size)
Significance Testing
The Log Rank Test
O = Observed EventsE = Expected Events

Resources
http://ecp.acponline.org/janfeb00/primer.htmhttp://www.bmj.com/content/328/7447/1073http://
sphweb.bumc.bu.edu/otlt/MPH-Modules/BS/BS704_Survival/BS704_Survival_print.html
http://www.ncbi.nlm.nih.gov/pmc/articles/PMC3059453/
http://www.ncbi.nlm.nih.gov/pmc/articles/PMC3932959/
http://clincancerres.aacrjournals.org/content/13/2/559.long

![karam@asu.edu arXiv:1804.08020v2 [cs.CV] 26 Apr 2018 · Lina J. Karam Arizona State University karam@asu.edu Abstract Perceptual quality assessment for synthesized textures is a challenging](https://img.pdfslide.us/doc/110x75/5f886c035afb0875436a5e4e/karamasuedu-arxiv180408020v2-cscv-26-apr-2018-lina-j-karam-arizona-state.jpg)