Embed Size (px)
Citation preview

ASH 2014 UPDATE
DR. RAJKUMAR M.D., D.M
CONSULTANT MEDICAL ONCOLOGIST
GURU CANCER CENTER

OVERVIEW
1. CHRONIC MYELOID LEUKEMIA
2. MULTIPLE MYELOMA
3. CHRONIC LYMPHOCYTIC
LEUKEMIA
4. FOLLICULAR LYMPHOMA
CHRONIC MYELOID LEUKEMIA
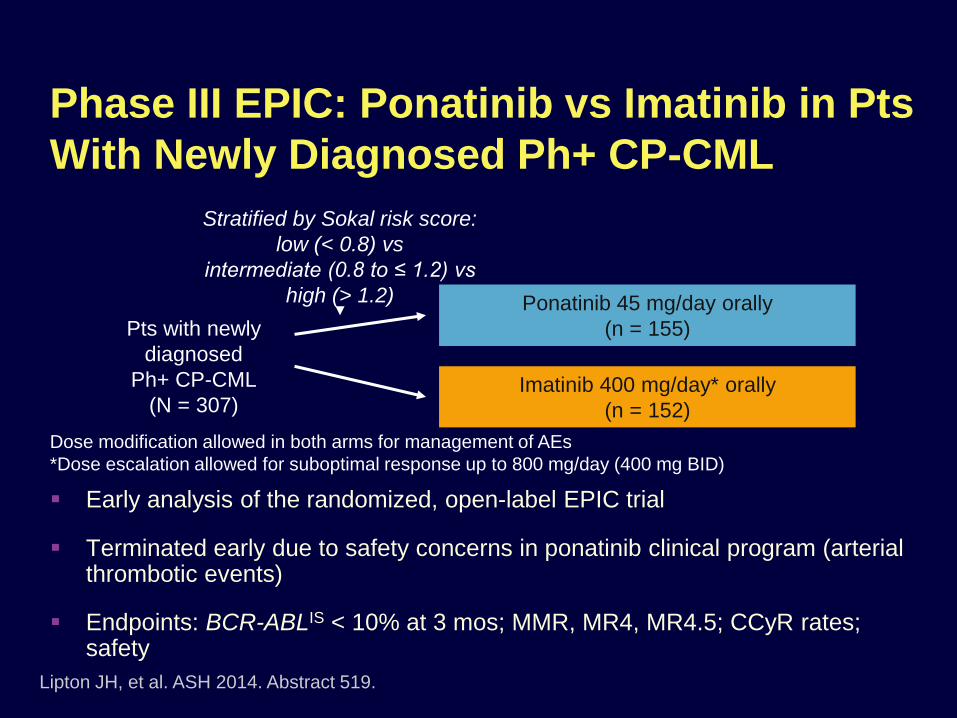
Early analysis of the randomized, open-label EPIC trial
Terminated early due to safety concerns in ponatinib clinical program (arterial thrombotic events)
Endpoints: BCR-ABLIS < 10% at 3 mos; MMR, MR4, MR4.5; CCyR rates; safety
Phase III EPIC: Ponatinib vs Imatinib in Pts
With Newly Diagnosed Ph+ CP-CML
Lipton JH, et al. ASH 2014. Abstract 519.
Pts with newly
diagnosed
Ph+ CP-CML
(N = 307)
Stratified by Sokal risk score:
low (< 0.8) vs
intermediate (0.8 to ≤ 1.2) vs
high (> 1.2) Ponatinib 45 mg/day orally
(n = 155)
Imatinib 400 mg/day* orally
(n = 152)
Dose modification allowed in both arms for management of AEs
*Dose escalation allowed for suboptimal response up to 800 mg/day (400 mg BID)
EPIC: Ponatinib vs Imatinib in Pts With
Newly Diagnosed CP-CML: Results
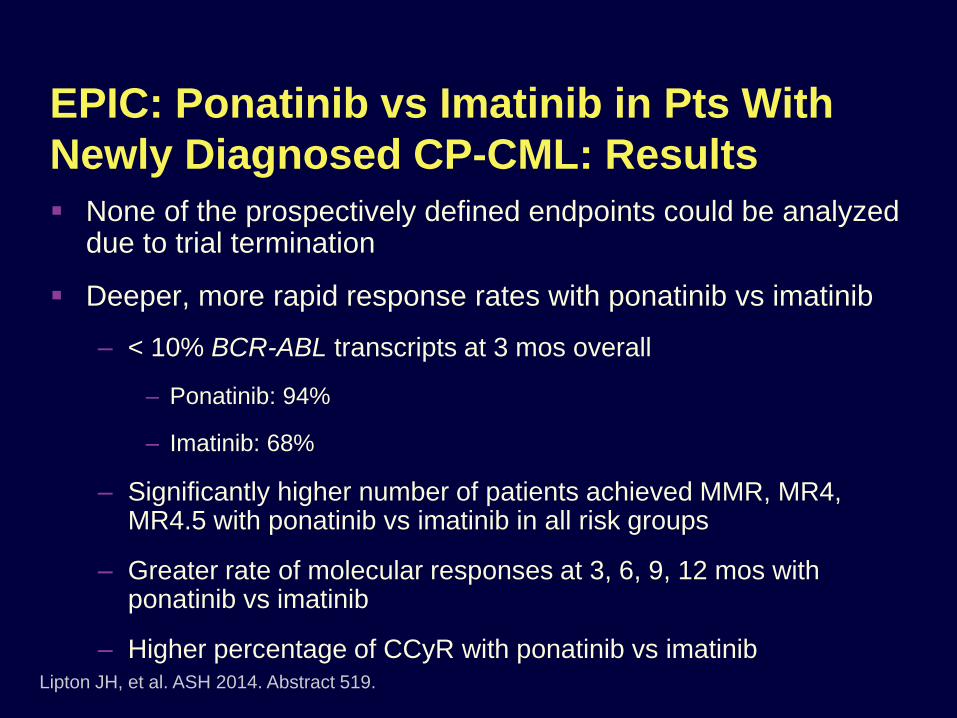
None of the prospectively defined endpoints could be analyzed due to trial termination
Deeper, more rapid response rates with ponatinib vs imatinib
– < 10% BCR-ABL transcripts at 3 mos overall
– Ponatinib: 94%
– Imatinib: 68%
– Significantly higher number of patients achieved MMR, MR4, MR4.5 with ponatinib vs imatinib in all risk groups
– Greater rate of molecular responses at 3, 6, 9, 12 mos with ponatinib vs imatinib
– Higher percentage of CCyR with ponatinib vs imatinibLipton JH, et al. ASH 2014. Abstract 519.
EPIC: Ponatinib vs Imatinib in Newly
Diagnosed Ph+ CP-CML: Conclusions
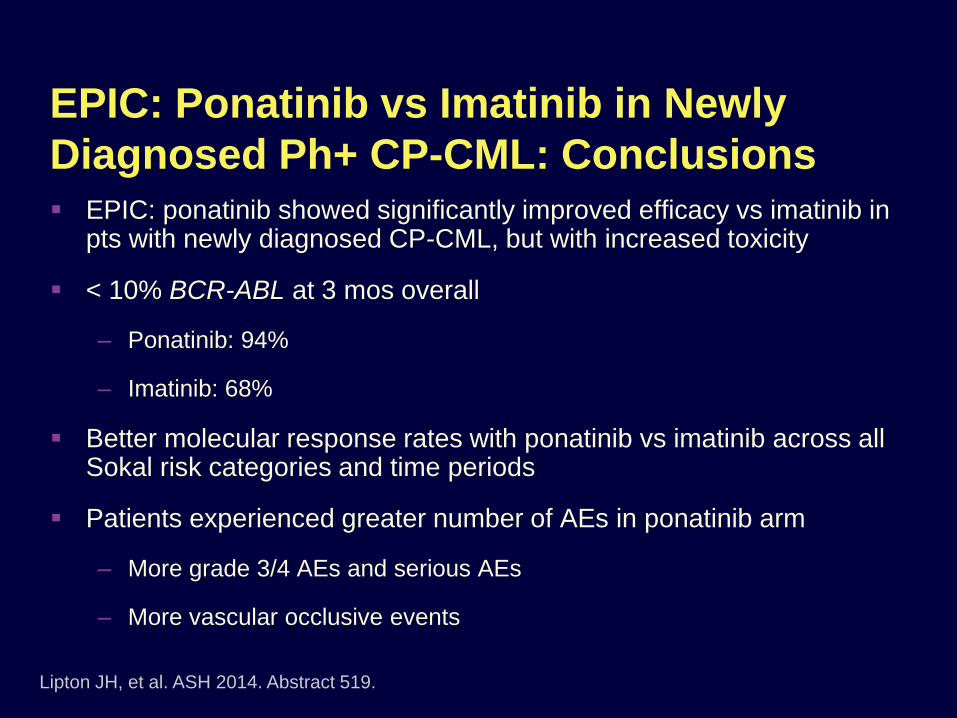
EPIC: ponatinib showed significantly improved efficacy vs imatinib in pts with newly diagnosed CP-CML, but with increased toxicity
< 10% BCR-ABL at 3 mos overall
– Ponatinib: 94%
– Imatinib: 68%
Better molecular response rates with ponatinib vs imatinib across all Sokal risk categories and time periods
Patients experienced greater number of AEs in ponatinib arm
– More grade 3/4 AEs and serious AEs
– More vascular occlusive events
Lipton JH, et al. ASH 2014. Abstract 519.
PACE: Effect of Early Response to
Ponatinib on Outcomes in Pretreated Pts
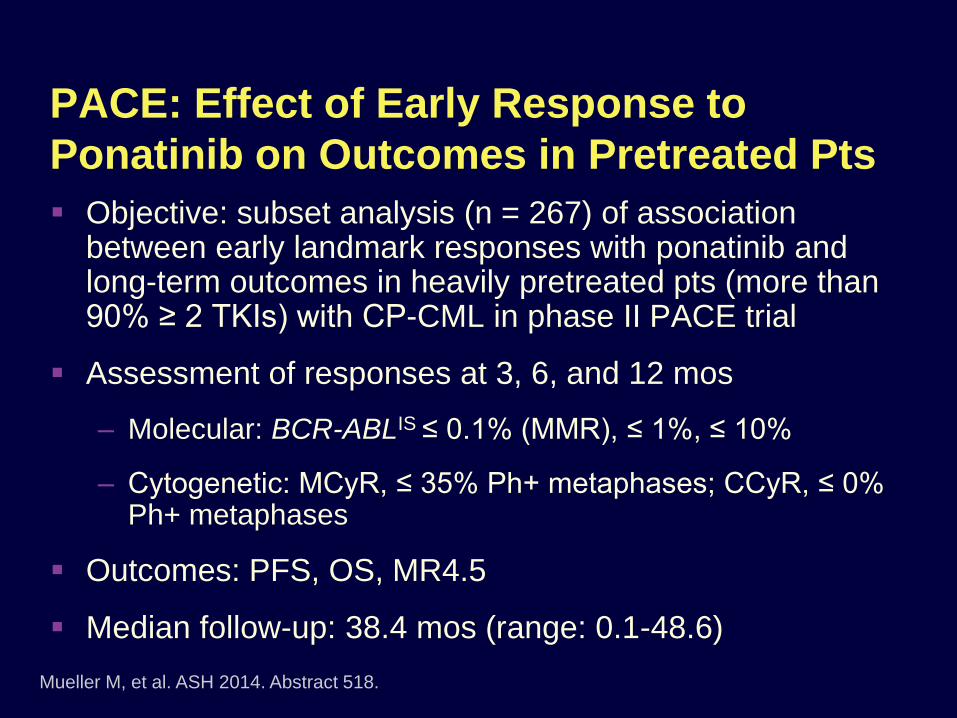
Objective: subset analysis (n = 267) of association between early landmark responses with ponatinib and long-term outcomes in heavily pretreated pts (more than 90% ≥ 2 TKIs) with CP-CML in phase II PACE trial
Assessment of responses at 3, 6, and 12 mos
– Molecular: BCR-ABLIS ≤ 0.1% (MMR), ≤ 1%, ≤ 10%
– Cytogenetic: MCyR, ≤ 35% Ph+ metaphases; CCyR, ≤ 0% Ph+ metaphases
Outcomes: PFS, OS, MR4.5
Median follow-up: 38.4 mos (range: 0.1-48.6)
Mueller M, et al. ASH 2014. Abstract 518.

≤ 1% BCR-ABL by 3 mos associated with longer 2-yr PFS, OS vs BCR-ABL > 1% at 3 mos
Molecular response at 3 mos directly correlated with MR4.5 over time
Response at 3 and 6 mos associated with significant improvement in 2-yr PFS and OS
PACE: Effect of Early Response to
Ponatinib: 2-Yr PFS, OS
Outcome 2-Yr PFS
Probability, %
P Value 2-Yr OS
Probability, %
P Value
3 mos
MMR 97
.0006
97
.0324No MMR 67 84
6 mos
MMR 95
< .0001
95
.0428No MMR 65 88
12 mos
MMR 93
.0010
100
.0089No MMR 74 93
Mueller M, et al. ASH 2014. Abstract 518.

PACE: Effect of Early Response to
Ponatinib: Conclusions
Early MMR in BCR-ABL with ponatinib in heavily pretreated pts with CP-CML correlated with improved long-term outcomes
– 2-yr PFS and OS significantly associated with positive 3-mo, 6-mo, and 12-mo cytogenetic and molecular responses
Mueller M, et al. ASH 2014. Abstract 518.
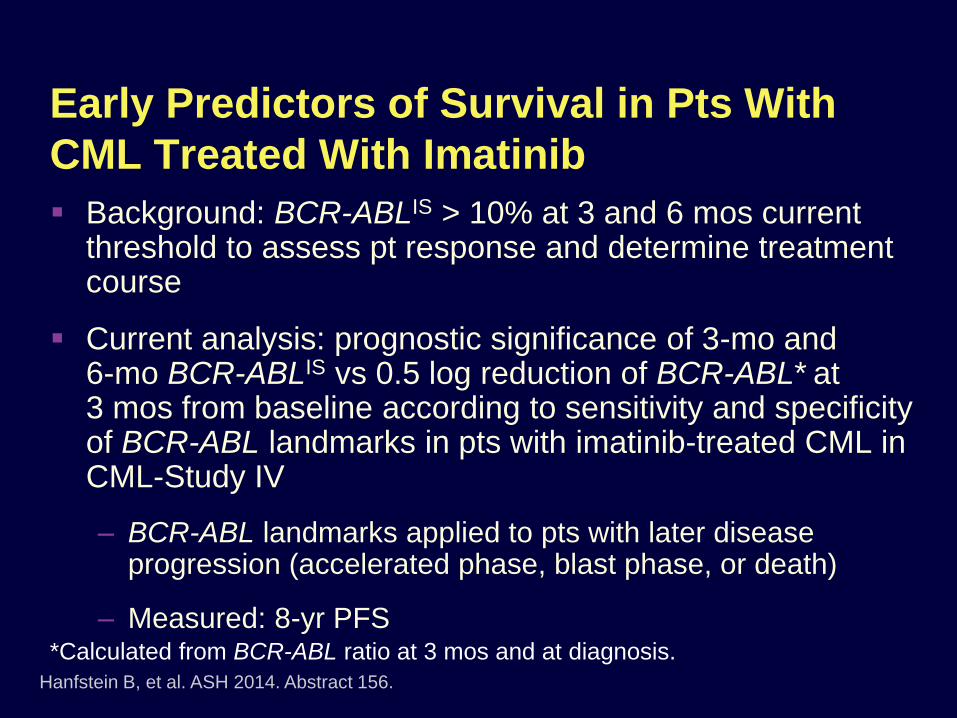
Early Predictors of Survival in Pts With
CML Treated With Imatinib
Background: BCR-ABLIS > 10% at 3 and 6 mos current threshold to assess pt response and determine treatment course
Current analysis: prognostic significance of 3-mo and 6-mo BCR-ABLIS vs 0.5 log reduction of BCR-ABL* at 3 mos from baseline according to sensitivity and specificity of BCR-ABL landmarks in pts with imatinib-treated CML in CML-Study IV
– BCR-ABL landmarks applied to pts with later disease progression (accelerated phase, blast phase, or death)
– Measured: 8-yr PFS
Hanfstein B, et al. ASH 2014. Abstract 156.
*Calculated from BCR-ABL ratio at 3 mos and at diagnosis.

Prognostic Markers for Safely Halting TKI
Therapy in Pts With CP-CML: EURO-SKI
Background: prospective trials suggest imatinib therapy may be sustainably and safely discontinued in CML pts with deep and durable MR (MR4; BCR-ABL <0.01% for at least 1 yr)
EURO-SKI study: define prognostic markers to identify patients most likely to retain deep molecular responses after stopping TKI therapy
Planned interim analysis: after 200 pts available with eligible molecular results at 6 mos
Eligible pts: CP-CML in confirmed deep MR (BCR-ABL < 0.01% for > 12 mos) while on TKI therapy ≥ 3 yrs
Primary endpoint: assessment of duration of MR after discontinuing TKI
Mahon FX, et al. ASH 2014. Abstract 151.
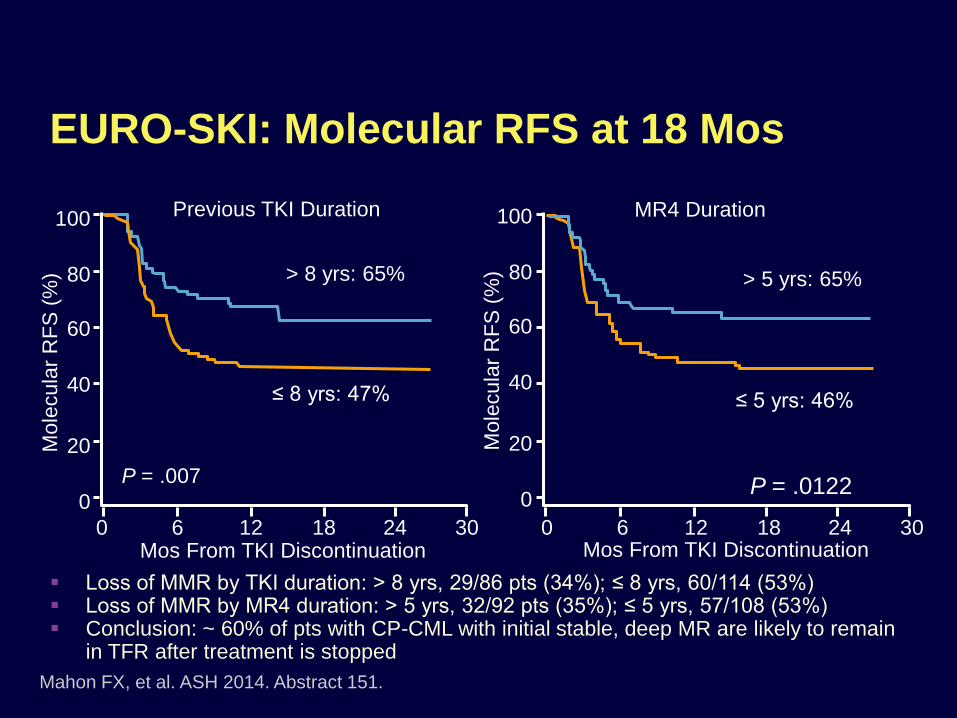
Loss of MMR by TKI duration: > 8 yrs, 29/86 pts (34%); ≤ 8 yrs, 60/114 (53%) Loss of MMR by MR4 duration: > 5 yrs, 32/92 pts (35%); ≤ 5 yrs, 57/108 (53%) Conclusion: ~ 60% of pts with CP-CML with initial stable, deep MR are likely to remain
in TFR after treatment is stopped
100
80
60
40
20
0
EURO-SKI: Molecular RFS at 18 Mos
Previous TKI Duration MR4 Duration
Mahon FX, et al. ASH 2014. Abstract 151.
Mos From TKI Discontinuation
P = .0122
Mos From TKI Discontinuation0 6 12 18 24 30
P = .007
Mole
cula
r R
FS
(%
)
100
80
60
40
20
0
0 6 12 18 24 30
Mole
cula
r R
FS
(%
)> 8 yrs: 65%
≤ 8 yrs: 47%
> 5 yrs: 65%
≤ 5 yrs: 46%

EURO-SKI: Conclusion
EURO-SKI study suggests ~ 60% of pts with CP-CML with deep, durable MR (MR4; BCR-ABL <0.01% for at least 1 yr) on TKIs are likely to remain in remission after TKIs are stopped
Mahon FX, et al. ASH 2014. Abstract 151.

MULTIPLE MYELOMA

Updated IMWG Criteria For Diagnosis of
Multiple Myeloma
*C: Calcium elevation (> 11 mg/dL or > 1 mg/dL higher than ULN)R: Renal insufficiency (creatinine clearance < 40 mL/min or serum creatinine > 2 mg/dL)A: Anemia (Hb < 10 g/dL or 2 g/dL < normal)B: Bone disease (≥ 1 lytic lesions on skeletal radiography, CT, or PET-CT)
Rajkumar SV, et al. Lancet Oncol. 2014;15:e538-e548.
MGUS
M protein < 3 g/dL
Clonal plasma cells in BM < 10%
No myeloma defining events
Smoldering Myeloma
M protein ≥ 3 g/dL (serum) or ≥ 500 mg/24 hrs (urine)
Clonal plasma cells in BM 10% - 60%
No myeloma defining events
Multiple Myeloma
Underlying plasma cell proliferative disorder
AND 1 or more myeloma defining events
≥ 1 CRAB* feature
Clonal plasma cells in BM ≥ 60%
Serum free light chain ratio ≥ 100
>1 MRI focal lesion
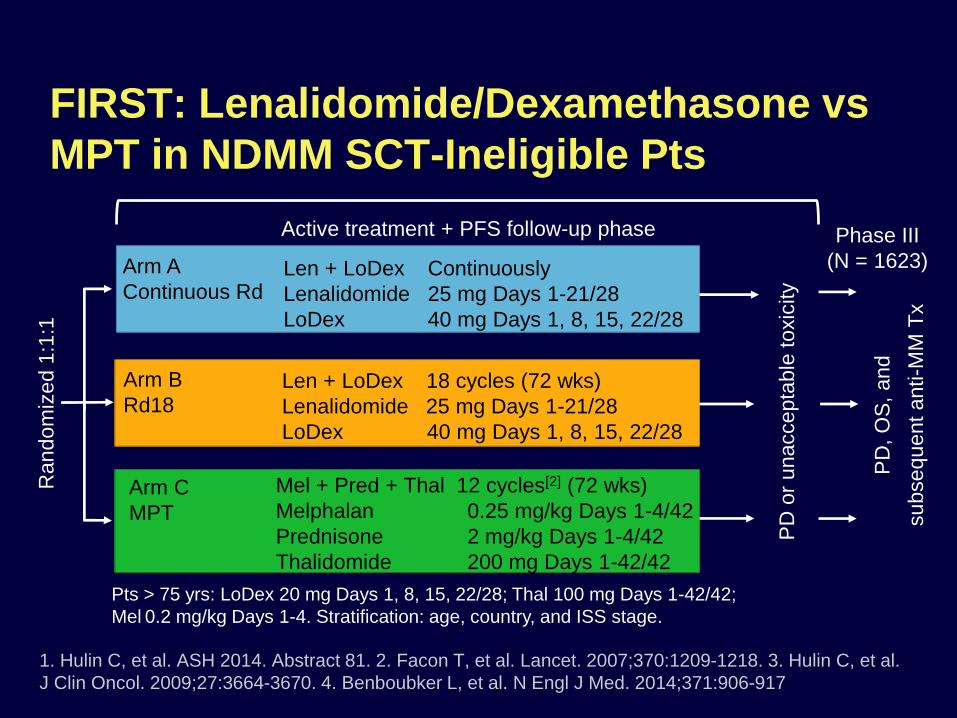
FIRST: Lenalidomide/Dexamethasone vs
MPT in NDMM SCT-Ineligible Pts
Random
ized 1
:1:1
Arm B
Rd18
Arm C
MPT
Len + LoDex 18 cycles (72 wks)
Lenalidomide 25 mg Days 1-21/28
LoDex 40 mg Days 1, 8, 15, 22/28
Mel + Pred + Thal 12 cycles[2] (72 wks)
Melphalan 0.25 mg/kg Days 1-4/42
Prednisone 2 mg/kg Days 1-4/42
Thalidomide 200 mg Days 1-42/42
PD
, O
S,
and
su
bse
qu
en
t a
nti-M
M T
x
PD
or
unaccepta
ble
toxic
ity
Active treatment + PFS follow-up phase
Pts > 75 yrs: LoDex 20 mg Days 1, 8, 15, 22/28; Thal 100 mg Days 1-42/42;
Mel 0.2 mg/kg Days 1-4. Stratification: age, country, and ISS stage.
Len + LoDex Continuously
Lenalidomide 25 mg Days 1-21/28
LoDex 40 mg Days 1, 8, 15, 22/28
Arm A
Continuous Rd
1. Hulin C, et al. ASH 2014. Abstract 81. 2. Facon T, et al. Lancet. 2007;370:1209-1218. 3. Hulin C, et al.
J Clin Oncol. 2009;27:3664-3670. 4. Benboubker L, et al. N Engl J Med. 2014;371:906-917
Phase III
(N = 1623)
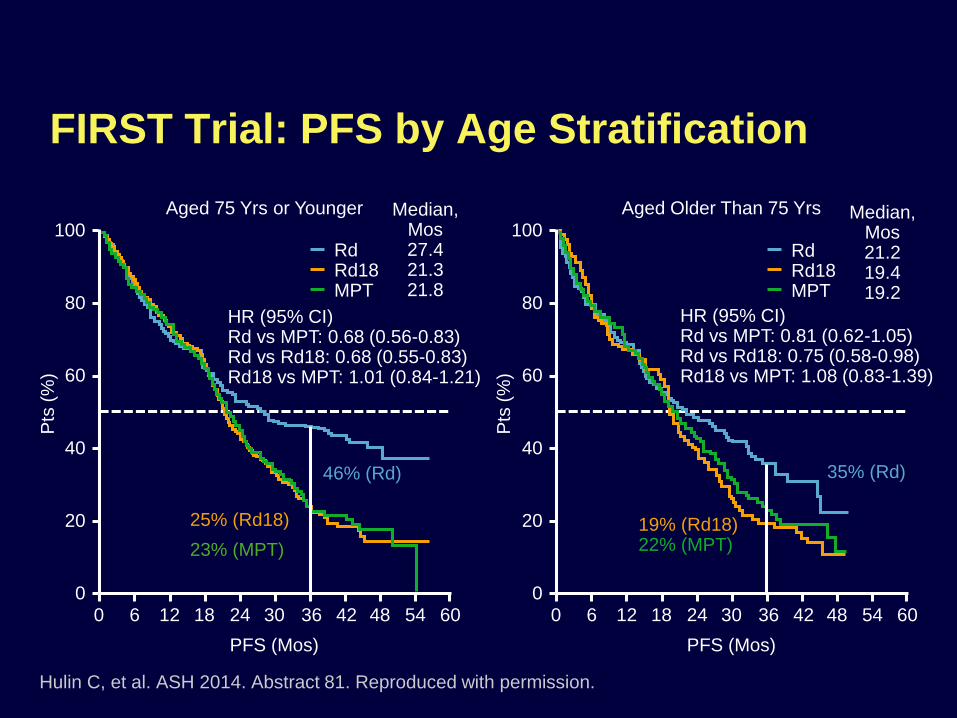
FIRST Trial: PFS by Age Stratification
Hulin C, et al. ASH 2014. Abstract 81. Reproduced with permission.
Aged 75 Yrs or Younger
100
80
60
40
20
0
Pts
(%
)
0 6 12 18 24 30 36 42 48 54 60
PFS (Mos)
HR (95% CI)Rd vs MPT: 0.68 (0.56-0.83)Rd vs Rd18: 0.68 (0.55-0.83)Rd18 vs MPT: 1.01 (0.84-1.21)
Rd Rd18MPT
Median,Mos27.421.321.8
46% (Rd)
25% (Rd18)
23% (MPT)
Aged Older Than 75 Yrs
100
80
60
40
20
0
Pts
(%
)
0 6 12 18 24 30 36 42 48 54 60
PFS (Mos)
HR (95% CI)Rd vs MPT: 0.81 (0.62-1.05)Rd vs Rd18: 0.75 (0.58-0.98)Rd18 vs MPT: 1.08 (0.83-1.39)
Rd Rd18MPT
Median,Mos21.219.419.2
35% (Rd)
19% (Rd18)22% (MPT)
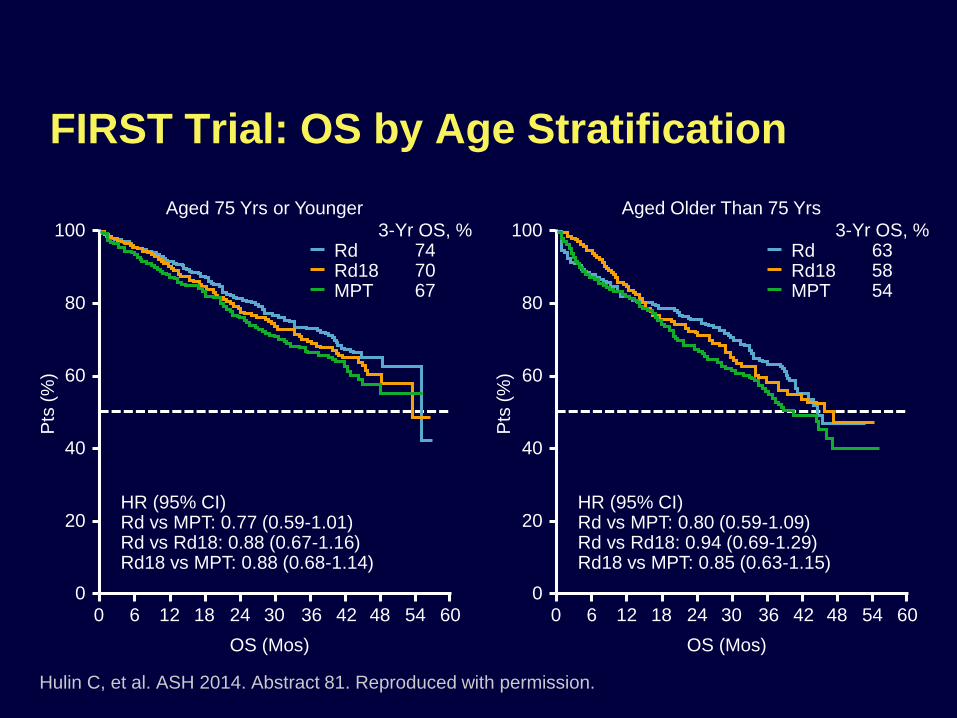
FIRST Trial: OS by Age Stratification
Hulin C, et al. ASH 2014. Abstract 81. Reproduced with permission.
Aged 75 Yrs or Younger
100
80
60
40
20
0
Pts
(%
)
0 6 12 18 24 30 36 42 48 54 60
OS (Mos)
HR (95% CI)Rd vs MPT: 0.77 (0.59-1.01)Rd vs Rd18: 0.88 (0.67-1.16)Rd18 vs MPT: 0.88 (0.68-1.14)
Rd Rd18MPT
3-Yr OS, %747067
Aged Older Than 75 Yrs
100
80
60
40
20
0
Pts
(%
)
0 6 12 18 24 30 36 42 48 54 60
OS (Mos)
HR (95% CI)Rd vs MPT: 0.80 (0.59-1.09)Rd vs Rd18: 0.94 (0.69-1.29)Rd18 vs MPT: 0.85 (0.63-1.15)
Rd Rd18MPT
3-Yr OS, %635854

FIRST Trial: Grade 3/4 Adverse Events
Grade 3/4 Treatment-
Emergent AE, %
Dose for Pts Aged ≤ 75 Yrs Dose for Pts Aged > 75 Yrs
Continuous
Rd
(n = 347)
Rd18
(n = 348)
MPT
(n = 357)
Continuous
Rd
(n = 185)
Rd18
(n = 192)
MPT
(n = 184)
Hematologic in ≥ 10% of pts
Neutropenia 28 25 47 28 29 40
Anemia 18 12 20 19 23 17
Thrombocytopenia 8 9 13 9 7 7
Leukopenia 5 6 11 4 5 8
Nonhematologic
Infection 29 21 16 29 23 20
Cardiac disorders 12 6 6 12 9 13
Fatigue 6 8 5 9 10 8
Peripheral sensory neuropathy
1 1 10 1 0 8
Cataracts 7 3 < 1 3 2 1
DVT and/or PE 8 5 6 7 6 4
Hulin C, et al. ASH 2014. Abstract 81. Reproduced with permission.

FIRST Trial: Conclusions
Continuous Rd improved PFS vs MPT or 18 cycles of Rd for newly diagnosed MM regardless of age
– Median and 3-yr PFS both extended with continuous Rd vs MPT or Rd18 whether pts were younger or older than 75 yrs of age
– 3-yr OS extended with continuous Rd vs MPT whether pts were younger or older than 75 yrs of age
– Analysis of FIRST results based on age consistent with overall trial results
Toxicity profile of Rd similar among pts 75 yrs of age or younger and older than 75 yrs of age
Hulin C, et al. ASH 2014. Abstract 81.

Modified Lenalidomide/Bortezomib/
Dexamethasone in ASCT-Ineligible NDMM
Phase II trial exploring utility of modified RVD (RVD lite); N = 30
– Lenalidomide: single daily oral dose of 15 mg Days 1-21
– Bortezomib: 1.3 mg/m2 SC once weekly Days 1, 8, 15, 22
– Dexamethasone: 20 mg twice weekly if ≤ 75 yrs or once weekly if > 75 yrs
RVD lite resulted in 90% ORR (≥ PR), ≥ VGPR: 53%
– 3 pts discontinued study after <1 cycle due to worsening adrenal insufficiency; rash attributed to lenalidomide; unrelated
AEs manageable and well tolerated in an older population
– Grade 3 AEs in ≥ 5%: hypophosphatemia (32%), rash (12%), mood disorder (9%)
– Grade 4 AEs: hypoglycemia (3%), neutropenia (3%), corneal ulcer (3%)
O’Donnell E, et al. ASH 2014. Abstract 3454.
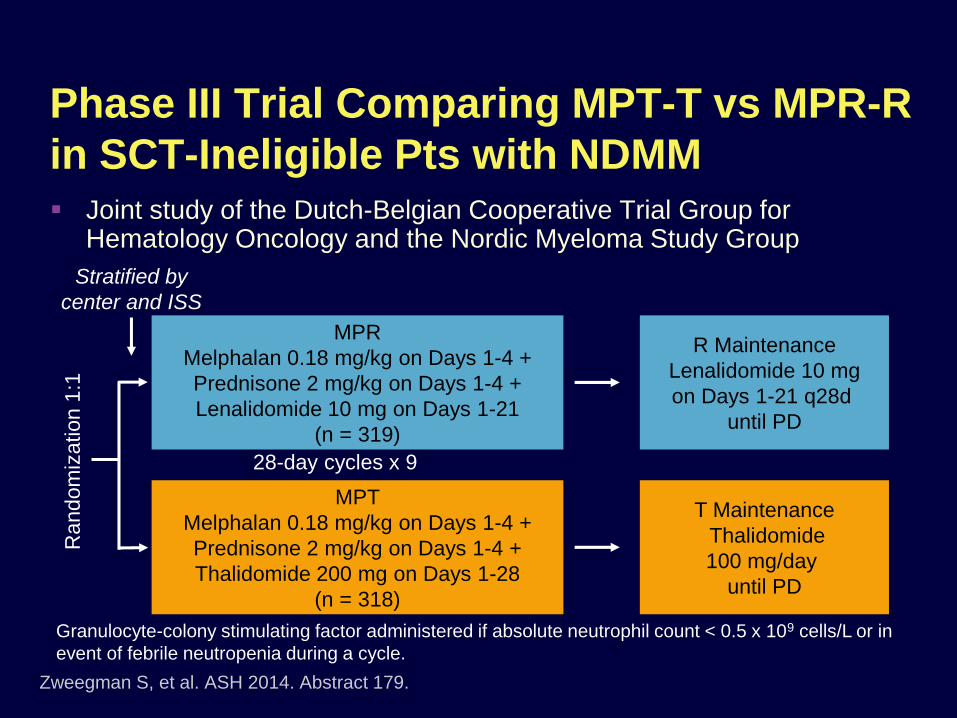
Phase III Trial Comparing MPT-T vs MPR-R
in SCT-Ineligible Pts with NDMM
Joint study of the Dutch-Belgian Cooperative Trial Group for Hematology Oncology and the Nordic Myeloma Study Group
MPR
Melphalan 0.18 mg/kg on Days 1-4 +
Prednisone 2 mg/kg on Days 1-4 +
Lenalidomide 10 mg on Days 1-21
(n = 319)
MPT
Melphalan 0.18 mg/kg on Days 1-4 +
Prednisone 2 mg/kg on Days 1-4 +
Thalidomide 200 mg on Days 1-28
(n = 318)
R Maintenance
Lenalidomide 10 mg
on Days 1-21 q28d
until PD
T Maintenance
Thalidomide
100 mg/day
until PD
Stratified by
center and ISS
28-day cycles x 9
Ra
nd
om
iza
tio
n 1
:1
Zweegman S, et al. ASH 2014. Abstract 179.
Granulocyte-colony stimulating factor administered if absolute neutrophil count < 0.5 x 10⁹ cells/L or in
event of febrile neutropenia during a cycle.
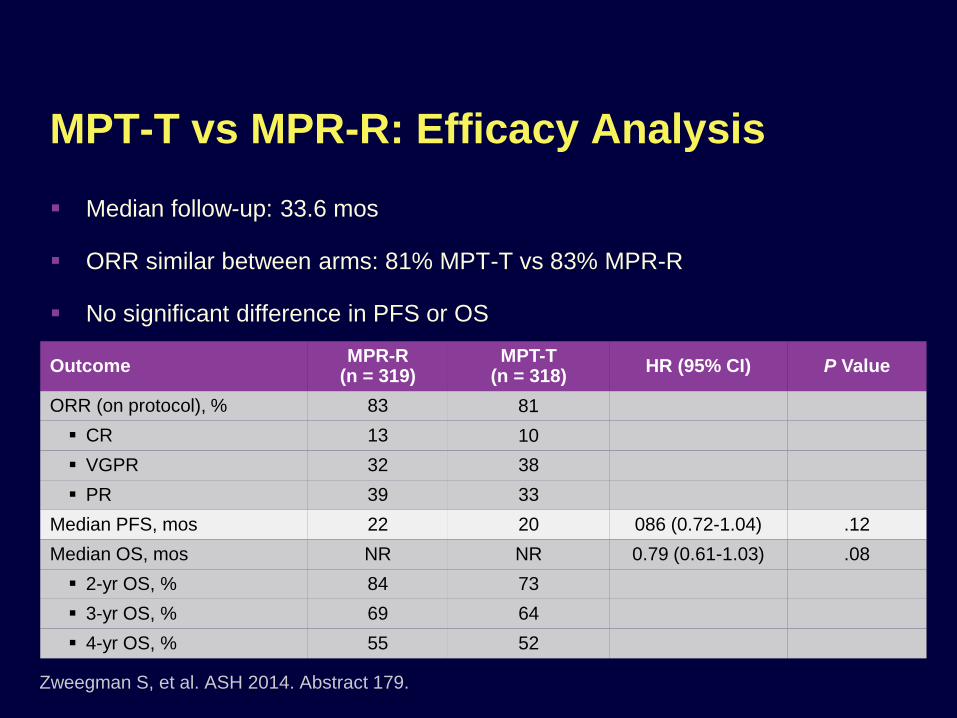
MPT-T vs MPR-R: Efficacy Analysis
Median follow-up: 33.6 mos
ORR similar between arms: 81% MPT-T vs 83% MPR-R
No significant difference in PFS or OS
Zweegman S, et al. ASH 2014. Abstract 179.
OutcomeMPR-R
(n = 319)MPT-T
(n = 318)HR (95% CI) P Value
ORR (on protocol), % 83 81
CR 13 10
VGPR 32 38
PR 39 33
Median PFS, mos 22 20 086 (0.72-1.04) .12
Median OS, mos NR NR 0.79 (0.61-1.03) .08
2-yr OS, % 84 73
3-yr OS, % 69 64
4-yr OS, % 55 52
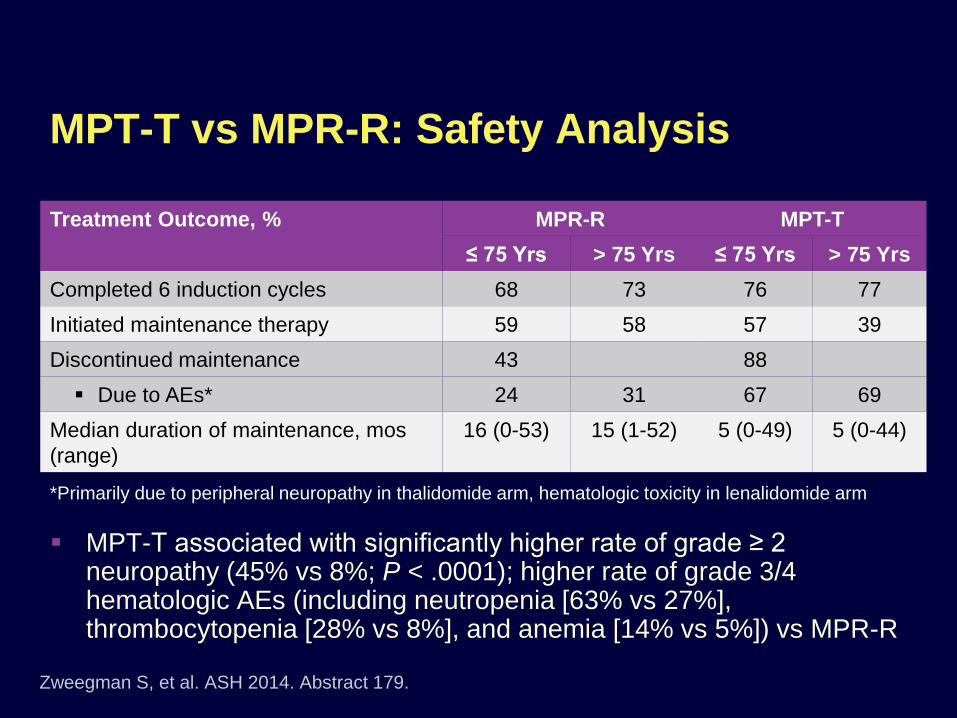
MPT-T vs MPR-R: Safety Analysis
*Primarily due to peripheral neuropathy in thalidomide arm, hematologic toxicity in lenalidomide arm
Zweegman S, et al. ASH 2014. Abstract 179.
Treatment Outcome, % MPR-R MPT-T
≤ 75 Yrs > 75 Yrs ≤ 75 Yrs > 75 Yrs
Completed 6 induction cycles 68 73 76 77
Initiated maintenance therapy 59 58 57 39
Discontinued maintenance 43 88
Due to AEs* 24 31 67 69
Median duration of maintenance, mos
(range)
16 (0-53) 15 (1-52) 5 (0-49) 5 (0-44)
MPT-T associated with significantly higher rate of grade ≥ 2 neuropathy (45% vs 8%; P < .0001); higher rate of grade 3/4 hematologic AEs (including neutropenia [63% vs 27%], thrombocytopenia [28% vs 8%], and anemia [14% vs 5%]) vs MPR-R
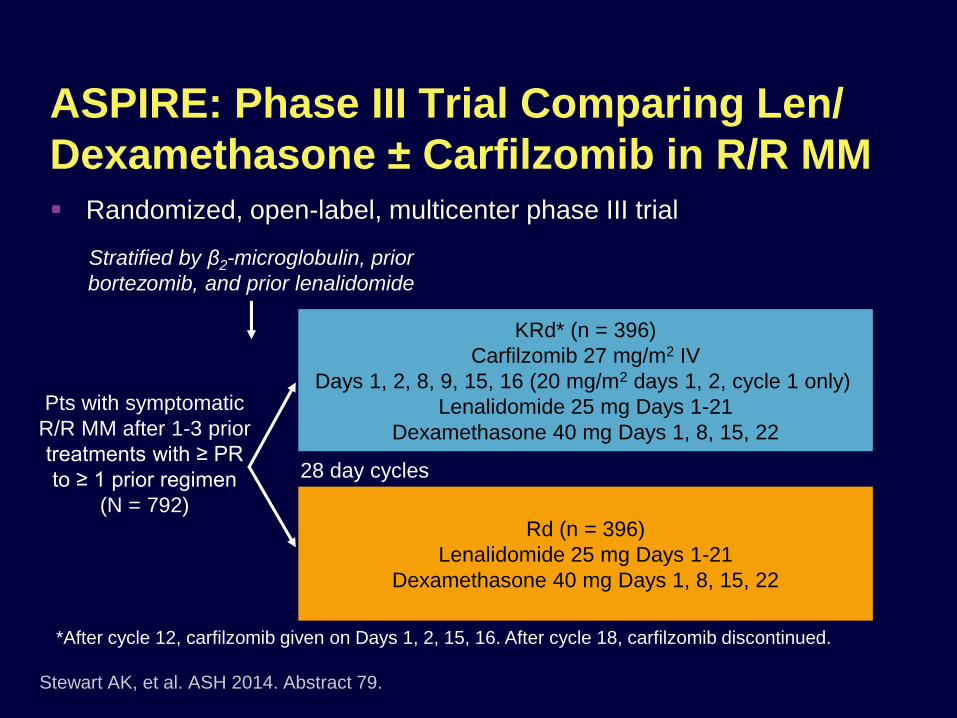
ASPIRE: Phase III Trial Comparing Len/
Dexamethasone ± Carfilzomib in R/R MM
Randomized, open-label, multicenter phase III trial
KRd* (n = 396)
Carfilzomib 27 mg/m2 IV
Days 1, 2, 8, 9, 15, 16 (20 mg/m2 days 1, 2, cycle 1 only)
Lenalidomide 25 mg Days 1-21
Dexamethasone 40 mg Days 1, 8, 15, 22
Rd (n = 396)
Lenalidomide 25 mg Days 1-21
Dexamethasone 40 mg Days 1, 8, 15, 22
Stratified by β2-microglobulin, prior
bortezomib, and prior lenalidomide
*After cycle 12, carfilzomib given on Days 1, 2, 15, 16. After cycle 18, carfilzomib discontinued.
Stewart AK, et al. ASH 2014. Abstract 79.
Pts with symptomatic
R/R MM after 1-3 prior
treatments with ≥ PR
to ≥ 1 prior regimen
(N = 792)
28 day cycles

ASPIRE: PFS in ITT Population (Primary
Endpoint)KRd Rd
(n = 396) (n = 396)
Median PFS, mos 26.3 17.6
HR (KRd/Rd) (95% CI) 0.69 (0.57-0.83)
P value (1 sided) < .0001
1.0
0.8
0.6
0.4
0.2
0.0
Pro
port
ion S
urv
ivin
g
Without
Pro
gre
ssio
n
KRd
Rd
0 6 12 18 24 30 36 42 48Mos Since Randomization
Stewart AK, et al. ASH 2014. Abstract 79. Reproduced with permission.
Risk Group by
FISH
KRd (n = 396) Rd (n = 396) HR P Value
n Median PFS, Mos n Median PFS, Mos
High 48 23.1 52 13.9 0.70 .083
Standard 147 29.6 170 19.5 0.66 .004
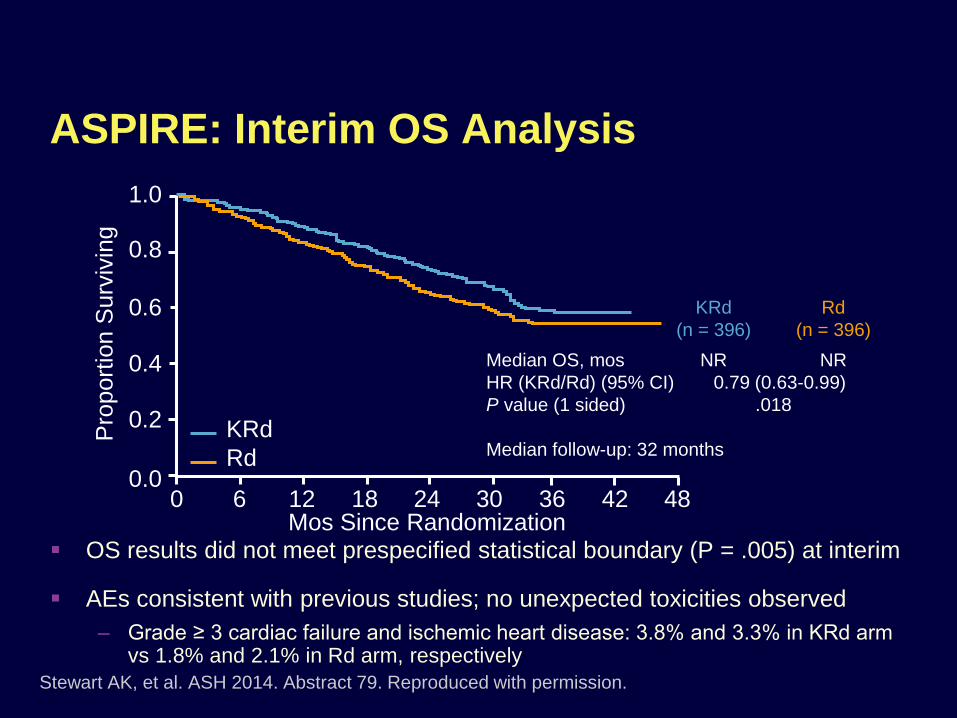
ASPIRE: Interim OS Analysis
OS results did not meet prespecified statistical boundary (P = .005) at interim
AEs consistent with previous studies; no unexpected toxicities observed
– Grade ≥ 3 cardiac failure and ischemic heart disease: 3.8% and 3.3% in KRd arm vs 1.8% and 2.1% in Rd arm, respectively
KRd Rd
(n = 396) (n = 396)
Median OS, mos NR NR
HR (KRd/Rd) (95% CI) 0.79 (0.63-0.99)
P value (1 sided) .018
Median follow-up: 32 months
1.0
0.8
0.6
0.4
0.2
0.0
Pro
port
ion S
urv
ivin
g
KRd
Rd
0 6 12 18 24 30 36 42 48Mos Since Randomization
Stewart AK, et al. ASH 2014. Abstract 79. Reproduced with permission.
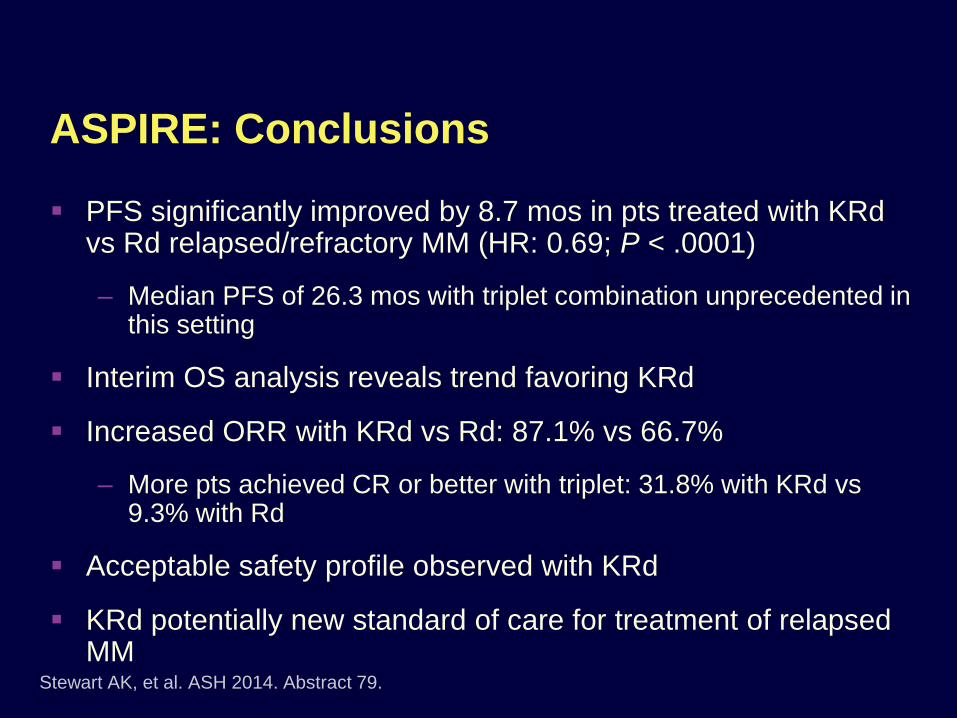
ASPIRE: Conclusions
PFS significantly improved by 8.7 mos in pts treated with KRd vs Rd relapsed/refractory MM (HR: 0.69; P < .0001)
– Median PFS of 26.3 mos with triplet combination unprecedented in this setting
Interim OS analysis reveals trend favoring KRd
Increased ORR with KRd vs Rd: 87.1% vs 66.7%
– More pts achieved CR or better with triplet: 31.8% with KRd vs 9.3% with Rd
Acceptable safety profile observed with KRd
KRd potentially new standard of care for treatment of relapsed MM
Stewart AK, et al. ASH 2014. Abstract 79.
CLL
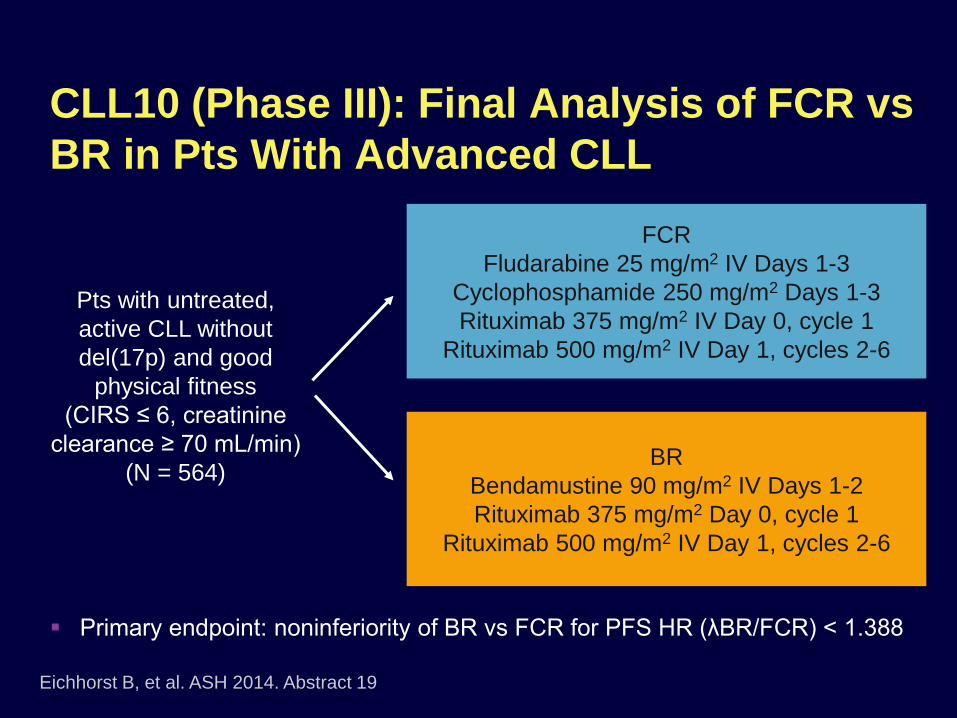
CLL10 (Phase III): Final Analysis of FCR vs
BR in Pts With Advanced CLL
Eichhorst B, et al. ASH 2014. Abstract 19
FCR
Fludarabine 25 mg/m2 IV Days 1-3
Cyclophosphamide 250 mg/m2 Days 1-3
Rituximab 375 mg/m2 IV Day 0, cycle 1
Rituximab 500 mg/m2 IV Day 1, cycles 2-6
BR
Bendamustine 90 mg/m2 IV Days 1-2
Rituximab 375 mg/m2 Day 0, cycle 1
Rituximab 500 mg/m2 IV Day 1, cycles 2-6
Pts with untreated,
active CLL without
del(17p) and good
physical fitness
(CIRS ≤ 6, creatinine
clearance ≥ 70 mL/min)
(N = 564)
Primary endpoint: noninferiority of BR vs FCR for PFS HR (λBR/FCR) < 1.388

1.0
0.8
0.6
0.4
0.2
0
FCR vs BR in Pts With Advanced CLL:
PFS
Eichhorst B, et al. ASH 2014. Abstract 19
Cum
ula
tive
Su
rviv
al
ITT PFS = Primary Endpoint
PFS in IGHV-Matched Population (n = 398; FCR = 201; BR = 197)
0 12 24 36 48 60
Median PFSFCR: 55.2 mosBR: 41.7 mos
P < .001HR: 1.626C
um
ula
tive S
urv
ival
1.0
0.8
0.6
0.4
0.2
0
0 12 24 36 48 60
Median PFSFCR: NRBR: 43.1 mos
P < .005HR: 1.565

1.0
0.8
0.6
0.4
0.2
0
FCR vs BR in Pts With Advanced CLL: OS
Eichhorst B, et al. ASH 2014. Abstract 19
0 12 24 36 48 60
Cum
ula
tive S
urv
ival
Mos to Event (OS)
OS at 36 MosFCR: 90.6%BR: 92.2%
P = .897
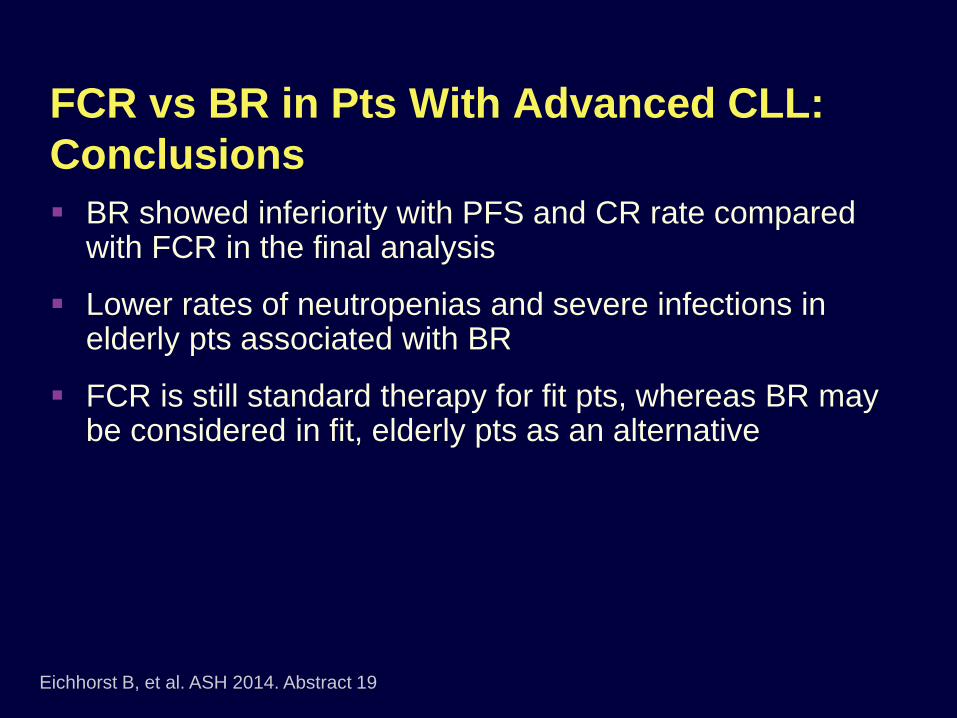
FCR vs BR in Pts With Advanced CLL:
Conclusions
BR showed inferiority with PFS and CR rate compared with FCR in the final analysis
Lower rates of neutropenias and severe infections in elderly pts associated with BR
FCR is still standard therapy for fit pts, whereas BR may be considered in fit, elderly pts as an alternative
Eichhorst B, et al. ASH 2014. Abstract 19

RESONATE-17: Phase II Ibrutinib in
del(17p) Relapsed/Refractory CLL/SLL CLL/SLL
– Relapsed/refractory disease after 1-4 prior therapies
– del(17p)13.1 in peripheralblood*
– ECOG PS 0-1
– Measurable nodal disease
Primary endpoint: ORR
Secondary endpoints
– DoR
– Safety
– Tolerability
Exploratory endpoints
– PFS
– OSO’Brien SM, et al. ASH 2014. Abstract 327.
Ibrutinib 420 mg/day PO
(N = 144)
*Confirmed by FISH.
Until unacceptable toxicity or disease progression
Primary analysis 12 mos after last enrolled pt
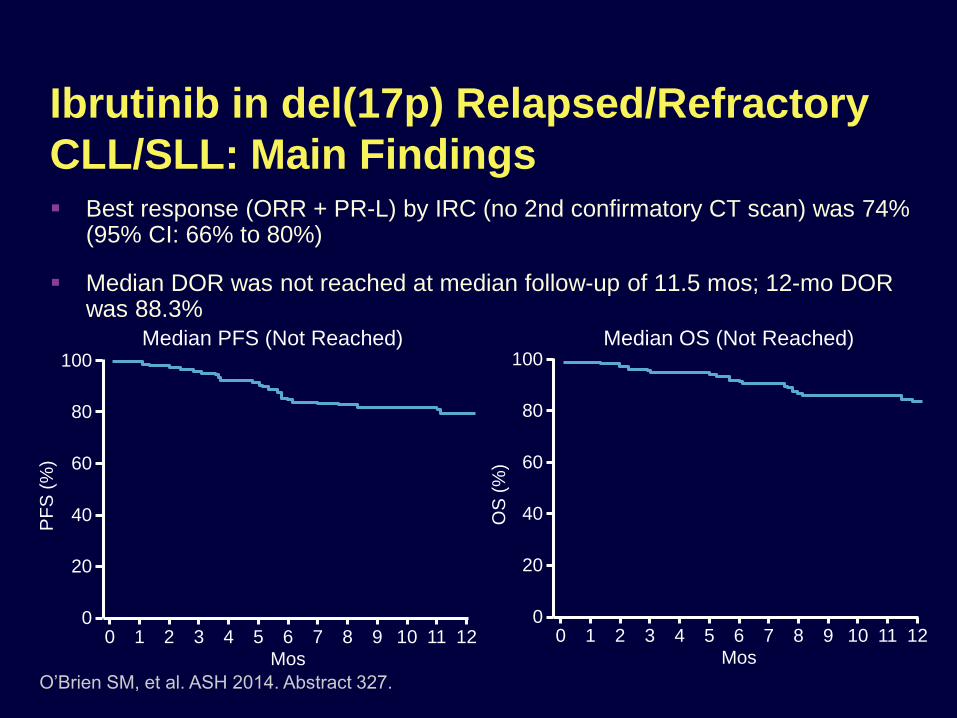
Ibrutinib in del(17p) Relapsed/Refractory
CLL/SLL: Main Findings Best response (ORR + PR-L) by IRC (no 2nd confirmatory CT scan) was 74%
(95% CI: 66% to 80%)
Median DOR was not reached at median follow-up of 11.5 mos; 12-mo DOR was 88.3%
O’Brien SM, et al. ASH 2014. Abstract 327.
Median PFS (Not Reached) Median OS (Not Reached)100
80
60
40
20
00 121 2 3 4 5 6 7 8 9 10 11
Mos
PF
S (
%)
100
80
60
40
20
00 121 2 3 4 5 6 7 8 9 10 11
Mos
OS
(%
)

Ibrutinib in del(17p) Relapsed/Refractory
CLL/SLL: Conclusions
Ibrutinib showed efficacy with favorable risk–benefit profile in pts with del(17p) CLL/SLL
12-mo PFS: 79%, consistent with previous study of 26-mo PFS (75%)
PFS outcomes in this relapsed/refractory setting favorable compared with previous results for frontline FCR regimen or alemtuzumab in del(17p) CLL (median PFS: 11 mos)
Safety profile consistent with known profile for ibrutinib
O’Brien SM, et al. ASH 2014. Abstract 327. Byrd JC, et al. N Engl J Med. 2013;369:32-42.
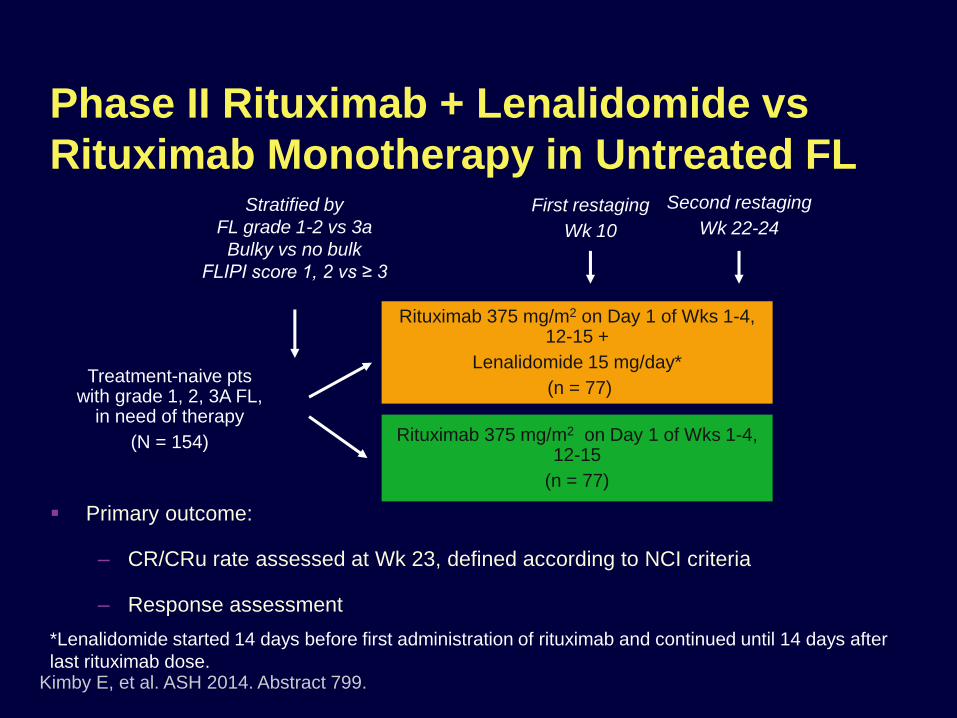
Primary outcome:
– CR/CRu rate assessed at Wk 23, defined according to NCI criteria
– Response assessment
Treatment-naive pts with grade 1, 2, 3A FL,
in need of therapy
(N = 154)
Rituximab 375 mg/m2 on Day 1 of Wks 1-4, 12-15 +
Lenalidomide 15 mg/day*
(n = 77)
Rituximab 375 mg/m2 on Day 1 of Wks 1-4, 12-15
(n = 77)
*Lenalidomide started 14 days before first administration of rituximab and continued until 14 days after
last rituximab dose.
Stratified by
FL grade 1-2 vs 3a
Bulky vs no bulk
FLIPI score 1, 2 vs ≥ 3
First restaging
Wk 10
Second restaging
Wk 22-24
Kimby E, et al. ASH 2014. Abstract 799.
Phase II Rituximab + Lenalidomide vs
Rituximab Monotherapy in Untreated FL
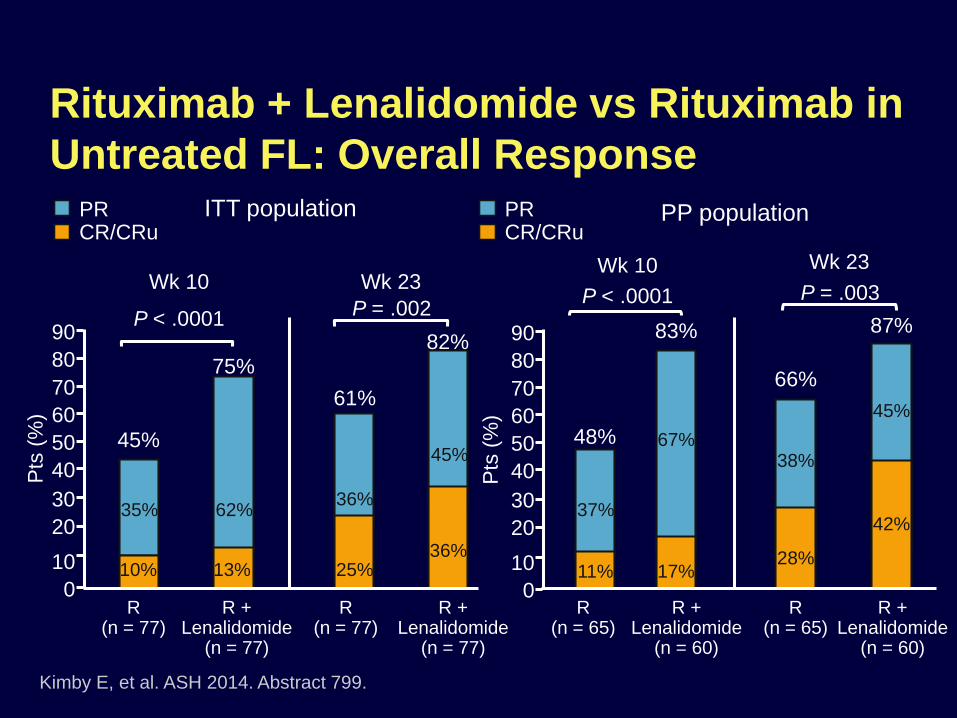
Rituximab + Lenalidomide vs Rituximab in
Untreated FL: Overall Response
Kimby E, et al. ASH 2014. Abstract 799.
ITT population PP population
90
80
70
60
50
40
30
20
10
010%
35%
45%
13%
62%
75%
25%
36%
36%
45%
61%
82%
R(n = 77)
R + Lenalidomide
(n = 77)
R + Lenalidomide
(n = 77)
R(n = 77)
Wk 10 Wk 23
P < .0001P = .002
PRCR/CRu
Pts
(%
)
90
80
70
60
50
40
30
20
10
0
Pts
(%
)
11%
37%
48%
17%
67%
28%
38%
45%
42%
83%
66%
87%
R(n = 65)
R + Lenalidomide
(n = 60)
R + Lenalidomide
(n = 60)
R(n = 65)
Wk 10 Wk 23
P < .0001 P = .003
PRCR/CRu

Rituximab + Lenalidomide vs Rituximab
Monotherapy in Untreated FL: Conclusions
Addition of rituximab to lenalidomide associated with significantly more CRs vs rituximab alone in untreated FL (36% vs 25%, respectively)
Comparison with existing single-arm studies confounded by differences in pt characteristics and treatment schedules
Neutropenia was the most common grade 3/4 AE with rituximab + lenalidomide; more grade 3/4 AEs seen with combination
– Continuous dosing may contribute to lenalidomide toxicity
According to investigators, further follow-up needed to determine if better response translates to improvement in PFS, OS, and time to next treatment
Kimby E, et al. ASH 2014. Abstract 799.
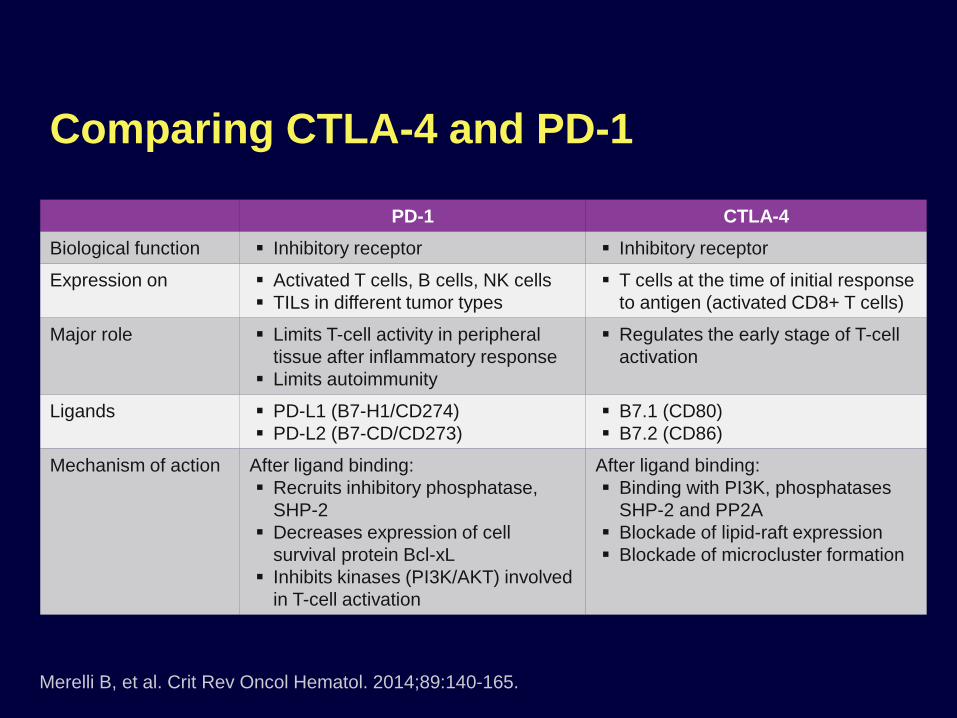
Comparing CTLA-4 and PD-1
PD-1 CTLA-4
Biological function Inhibitory receptor Inhibitory receptor
Expression on Activated T cells, B cells, NK cells
TILs in different tumor types
T cells at the time of initial response
to antigen (activated CD8+ T cells)
Major role Limits T-cell activity in peripheral
tissue after inflammatory response
Limits autoimmunity
Regulates the early stage of T-cell
activation
Ligands PD-L1 (B7-H1/CD274)
PD-L2 (B7-CD/CD273)
B7.1 (CD80)
B7.2 (CD86)
Mechanism of action After ligand binding:
Recruits inhibitory phosphatase,
SHP-2
Decreases expression of cell
survival protein Bcl-xL
Inhibits kinases (PI3K/AKT) involved
in T-cell activation
After ligand binding:
Binding with PI3K, phosphatases
SHP-2 and PP2A
Blockade of lipid-raft expression
Blockade of microcluster formation
Merelli B, et al. Crit Rev Oncol Hematol. 2014;89:140-165.

PD-L2–mediated
inhibition of TH2 T cellsStromal PD-L1
modulation of T cells
Reprinted from Clinical Cancer Research. 2013;19(5):1021-1034. Sznol M, et al. Antagonist antibodies to PD-1 and B7-H1
(PD-L1) in the treatment of advanced human cancer. With permission from AACR.
Blockade of PD-1 Binding to PD-L1 (B7-
H1) and PD-L2 (B7-DC) Revives T Cells
PD-L1 expression on tumor cells is induced by γ-interferon
In other words, activated T cells that could kill tumors are specifically disabled by those tumors
PD-1
PD-L1
PD-L2
T-cell receptor
MHC-1
CD28
Shp-2
B7.1
IFN-γ–mediated
upregulation of
tumor PD-L1PD-L1/PD-1–mediated
inhibition of tumor cell killing
Priming and
activation of
T cells
Immune cell
modulation of T cells
Tumor cell
IFN-γR
IFN-γ
Tumor-associated
fibroblast M2
macrophage
Treg
cell
Th2
T cell
Other NFκB P13K
CD8+ cytoxic
T lymphocyte
T-cell polarization
TGF-β
IL-4/13
Can you generate
tumor-killing T cells?
Dendritic
cell
Antigen priming
Can the T cells
get to the tumor?
T-cell trafficking
Can the T cells
see the tumor?
Peptide-MHC
expression
Can the T cells
be turned off?
Inhibitory cytokines
Can the T cells
be turned off?
PD-L1 expression
on tumor cells
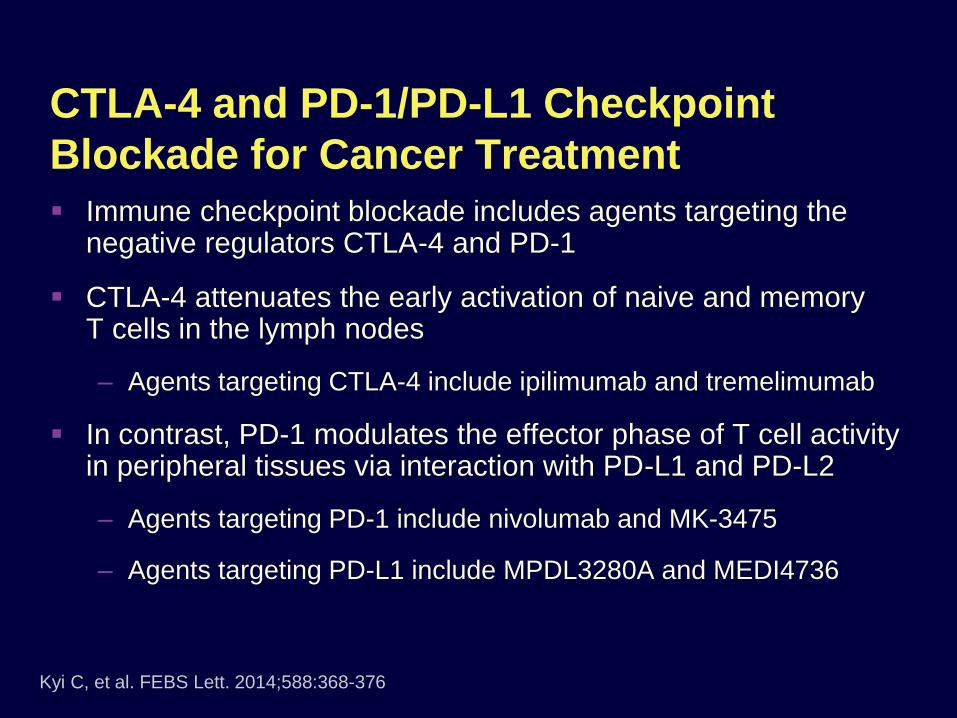
CTLA-4 and PD-1/PD-L1 Checkpoint
Blockade for Cancer Treatment
Immune checkpoint blockade includes agents targeting the negative regulators CTLA-4 and PD-1
CTLA-4 attenuates the early activation of naive and memory T cells in the lymph nodes
– Agents targeting CTLA-4 include ipilimumab and tremelimumab
In contrast, PD-1 modulates the effector phase of T cell activity in peripheral tissues via interaction with PD-L1 and PD-L2
– Agents targeting PD-1 include nivolumab and MK-3475
– Agents targeting PD-L1 include MPDL3280A and MEDI4736
Kyi C, et al. FEBS Lett. 2014;588:368-376
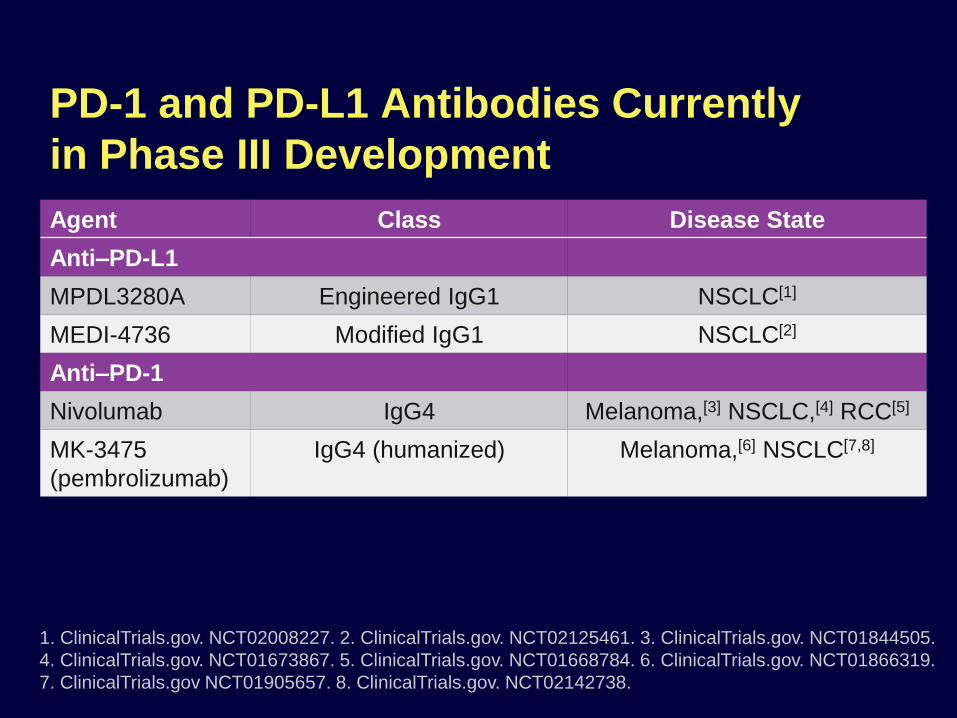
PD-1 and PD-L1 Antibodies Currently
in Phase III Development
Agent Class Disease State
Anti–PD-L1
MPDL3280A Engineered IgG1 NSCLC[1]
MEDI-4736 Modified IgG1 NSCLC[2]
Anti–PD-1
Nivolumab IgG4 Melanoma,[3] NSCLC,[4] RCC[5]
MK-3475
(pembrolizumab)
IgG4 (humanized) Melanoma,[6] NSCLC[7,8]
1. ClinicalTrials.gov. NCT02008227. 2. ClinicalTrials.gov. NCT02125461. 3. ClinicalTrials.gov. NCT01844505.
4. ClinicalTrials.gov. NCT01673867. 5. ClinicalTrials.gov. NCT01668784. 6. ClinicalTrials.gov. NCT01866319.
7. ClinicalTrials.gov NCT01905657. 8. ClinicalTrials.gov. NCT02142738.