Embed Size (px)
Citation preview
1www.qiagen.comA systematic guideline for developing the best real-time PCR primers
A systematic guideline for developing the best real-time PCR primersLessons learned from designing assays for more than 14,000 genes
Scientific article
Abstract: Primer design is the most important factor affecting the quality of SYBR® Green real-time PCR analyses. Although they seem to generate acceptable results at first, many homemade or “do-it-yourself” primers often come up short in their specificity, PCR amplification efficiency, reproducibility, and sensitivity. This paper aims to summarize the important principles that we have learned after designing real-time RT-PCR assays for over 14,000 genes. Our conclusion is that the primer design algorithm and the buffer conditions must work together to provide the best results. Here, we outline the steps that we see as being crucial in designing and verifying real-time RT-PCR assays. Moreover, the solutions to potential problems in primer design are described.
Introduction
Quantitative or real-time RT-PCR has become routine in many of
today’s research laboratories to monitor relative changes in gene
expression under different experimental conditions. However,
many researchers design their own real-time PCR primers without
complete knowledge about the important aspects affecting good
primer design. As a result, gene expression results obtained
by PCR are often unknowingly compromised. For the real-time
RT-PCR technique to give consistent and reliable results, the
assays must meet specific performance requirements to address
typical technical concerns, such as:
1. High sensitivity
How many copies can I detect?
2. Single-amplicon specificity
Am I measuring the right gene?
3. High degrees of accuracy and reliability
Is this the real fold change?
4. Wide linear dynamic ranges
Can I simultaneously detect genes expressed at levels that
vary by up to 10,000-fold?
5. Reproducibility
Will my assay work each time? How close are my
replicates?
The time and resources necessary to design and verify SYBR
Green real-time PCR assays that pass all of these performance
requirements is often underestimated. Simple experiments drawn
up on paper to measure a few genes can quickly turn into
frustration as the first assay results in primer dimers, off-target
amplification, or suboptimal amplification curves with poor
efficiencies.
Each failed real-time PCR assay means time and resources
wasted. When it comes to real-time PCR primer design, however,
there is no need to reinvent the wheel.
George Quellhorst and Sam Rulli
QIAGEN, 6951 Executive Way, Frederick, Maryland 21703, USA
Contents
Design algorithm ............................................... 2
Specificity ......................................................... 2
Accuracy and reliability ...................................... 3
Sensitivity .......................................................... 4
Dynamic range .................................................. 4
Reproducibility ................................................... 5
Summary .......................................................... 6
Appendix .......................................................... 7
References ........................................................ 8
2 www.qiagen.com QIAGEN
This white paper summarizes our knowledge about high-quality
real-time PCR primer design from our collective experience of
designing real-time PCR assays for more than 14,000 genes. It
highlights the steps needed to design and verify fully optimized
real-time RT-PCR assays for gene expression analysis. It also
outlines specific experiments that can be performed to test each
performance parameter.
Design algorithm
The primer design algorithm is key to generating successful
primers. Each design must meet several important thermodynamic
and sequence criteria (Table 1). In order to avoid missing any
gene expression, the primers must detect every alternative
transcript and splicing variant of the queried gene. To do so,
all known entries in the public databases should be found and
aligned to reveal a common gene-specific region for primer
design. If GC content, primer length, and primer melting
temperature range are controlled, each assay can use a standard
set of PCR cycling conditions. Uniform cycling conditions, in turn,
allow researchers to scale up from a single assay to multiple
assays on an entire 96- or even 384-well plate. Through a
comparison of the primer sequences with the single nucleotide
polymorphism (SNP) database, sequences containing known
SNP locations can be eliminated so that any individual source
of total RNA may be analyzed with the same assay. A BLAST
analysis further insures that the chosen primer sequences are
sufficiently different from the rest of the transcriptome in the
species of interest. Often, a BLAST analysis against the E. coli
genome is also warranted because many Taq polymerases
are contaminated with DNA from the organism used to over-
express and purify the enzyme. Finally, stability at the 3’-end of
the primers controls the start position for the DNA polymerase,
further enhancing specificity.
Amplicon length 50–210 bp
Primer length 19–23 nucleotides
GC content 35–65%
Tm 60–68ºC
3’-end stability Composition of last 3 base pairs
Complementarities Avoid primer self- or cross-annealing stretches greater than 4 bp
Specificity BLAST versus entire mRNA RefSeq database
SNP database Primer sequences do no include known SNP
Table 1. The design algorithm for the RT2 qPCR Assays utilizes more than ten thermodynamic and sequence alignment criteria.
Any algorithm’s primer design must also be experimentally
verified for high performance with wet-bench quality control
protocols, starting with two major success criteria. First, a melt
curve analysis must verify that a single gene-specific product is
produced. Following the melt curve, an agarose gel can also
be run to further verify a single product of the predicted size,
based on the amplicon design, without primer dimers or off-target
amplifications. Second, the amplification efficiency must be
greater than 90 percent for accurate and reliable results. If a real-
time RT-PCR assay does not meet all of the above requirements,
then the quality control fails, and the assay must be redesigned.
Specificity
All real-time PCR assays must generate a single band of the
correct size for the results to accurately represent the expression
of the queried gene. Secondary products confound the analysis.
Detecting other genes at the same time as the gene of interest
returns a weighted sum of their relative expression levels.
Amplification of primer dimers or other secondary products
causes artificially high and/or false positive signals. The assay
could report the presence of product when there is none, or a
greater amount of product than is really there.
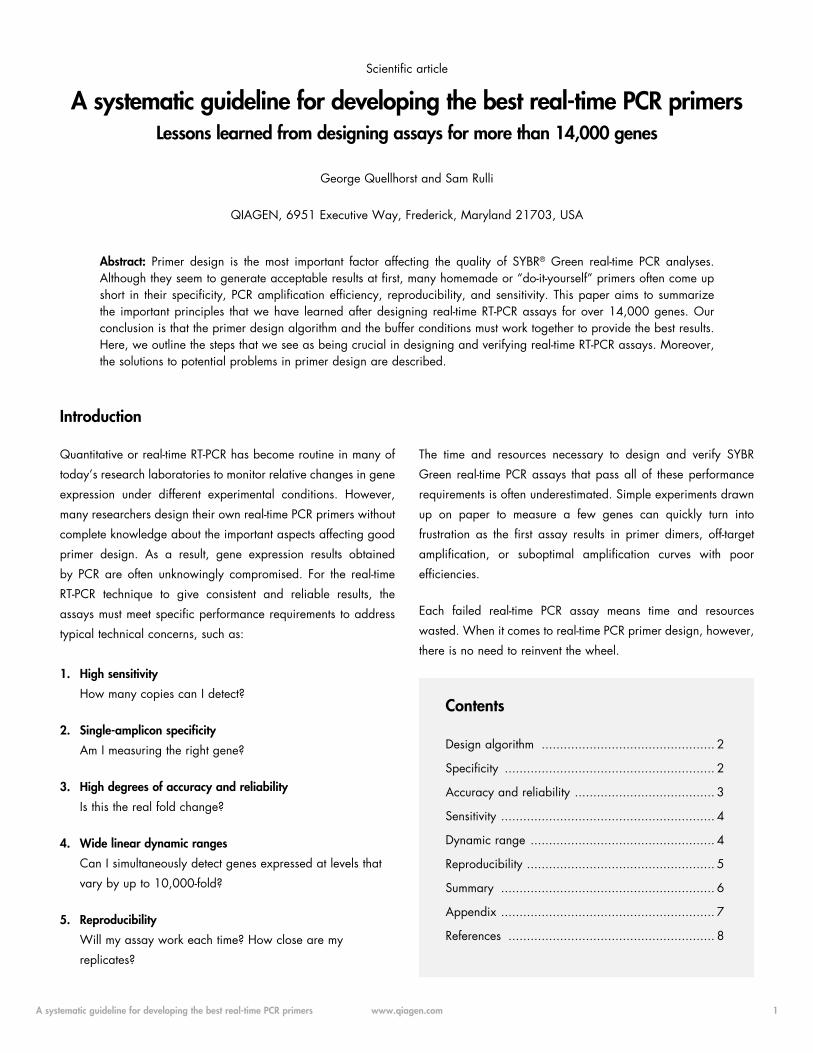
How can you tell if your real-time PCR assays are specific
enough? If you are using SYBR Green detection, just routinely
run the default melting program on your instrument immediately
after the completion of the cycling program. Use your instrument
software to generate the dissociation curve (the first derivative of
the melt curve). A single peak indicates a single melting event,
and therefore a single product. If SYBR Green detection is not
used, this analysis is not possible. Instead (or to be completely
rigorous with SYBR Green detection), characterize a portion of
the reaction by agarose gel electrophoresis. Not only should you
see a single band, but that band should be of the correct size
based on your primer design and amplicon size. See Figure 1
for representative results.
3www.qiagen.comA systematic guideline for developing the best real-time PCR primers
406080
100
200
60 70 80 90
507090
110
30
-1060 70 80 90
10
507090
110
30
-1060 70 80 90
10
507090
110
30
-1060 70 80 90
10
507090
110
30
-1060 70 80 90
10
507090
110
30
-1060 70 80 90
10
507090
110
30
-1060 70 80 90
10
130
507090
110
30
-1060 70 80 90
10
130
ASi
gnal
[ -d
( RFU
)/dT
]Signal dissociation curves
Tm [°C]
BMP1 BMP2
BMP3 BMP4
BMP5 BMP6
BMP7 BMP15
88.6 89.78
84.3590.88
82.2883.87
87.2
86.17
Agarose gel
BMP1 BMP2 BMP3 BMP4 BMP5 BMP6 BMP7 BMP15
0.5
0.4
0.3
0.2
0.1
0.0
-0.1
40 50 60 70 9080 99
BSignal dissociation curves
Sign
al [
−d( R
FU )/
dT ]
CXCR1CXCR2
CXCL2CXCL3
CXCR1 CXCR2 CXCL2 CXCL3
Agarose gel
Tm [°C]
Figure 1. RT2 Profiler PCR Arrays & RT2 qPCR Assays amplify a single gene- specific product in every reaction. Human XpressRef Universal Total RNA was characterized on both the Human TGFb/BMP Signaling Pathway A and the Human Common Cytokines B RT2 Profiler PCR Arrays, followed by dissociation (melt) curve and gel electrophoretic analyses. Each RT2 qPCR Assay specifically detects an individual gene, in particular for the displayed BMP and cytokine genes, whose specific assays tend to be notoriously difficult to design.
Accuracy and reliability
The most common way to analyze real-time RT-PCR data is
the ∆∆CT method. Its mathematics assumes that each real-time
PCR assay has 100 percent amplification efficiency; that is,
that the amount of template product doubles with every cycle.
With increasing deviation from this ideal, the error in the fold
difference or fold change calculation increases exponentially.
Only with consistently high amplification efficiencies can all
real-time RT-PCR assays accurately analyze multiple genes at the
same time using the ∆∆CT method.
Real-time PCR amplification efficiency determination methods
1. From calibration curve slope as determined by:
F Fit-point method
F Second derivative maximum for the 4 parametric logistical model
2. From single amplification plots using algorithms like:
F Mid-value point regression — also known as data analysis for real-time PCR or DART-PCR1
F Window-of linearity algorithm or LinREG PCR2
F Noise-resistant iterative nonlinear regression or Real-Time PCR Miner3
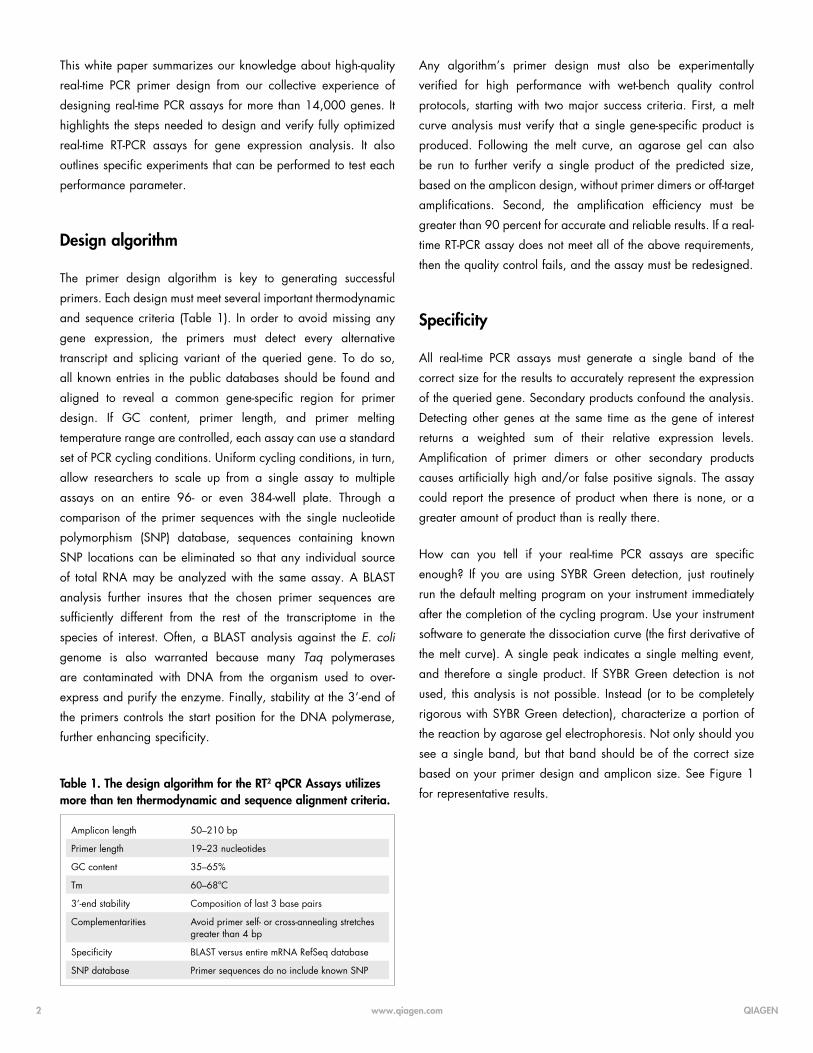
How can you tell if you are achieving amplification efficiencies
that are high enough in all of your assays? There are various
methods of determining amplification efficiency as summarized
in the bullets above. The most rigorous and classical method
examines the slope of a calibration curve, much like those used
to assess dynamic range as described later. An assay with 100
percent efficiency yields a −3.33 calibration curve slope. Newer
methods use algorithms to analyze the amplification curve shapes.
All of these methods act as effective and accurate surrogates for
the calibration curve method. By whichever method you choose,
the amplification efficiencies of all of your assays should average
around 100 percent with a relatively narrow standard deviation
about that mean. For example, see Figure 2.
4 www.qiagen.com QIAGEN
120
80
60
40
20
0
100
Am
plifi
catio
n ef
ficie
ncy
(%)
Gene
Figure 2. RT2 Profiler PCR Arrays and RT2 qPCR Assays yield the most accurate results. A representative set of assays for 4,000 genes used in the RT2 PCR Arrays demonstrate their average amplification efficiency of 99 percent and their 95 percent confidence interval about the mean from 90 to 110 percent. Consistently high amplification efficiencies enable PCR Arrays to accurately analyze multiple genes simultaneously using the ∆∆CT method.
Sensitivity
Beyond the minimal technical requirements for optimal real-time
RT-PCR assays, research is beginning to require the detection
of more genes with less RNA, as well as increasingly rarer and
rarer transcripts, either from genes expressed at very low levels
or genes only expressed in a small fraction of a biological
sample. Minimizing the amount of sample used in the experiment
is also extremely important, as samples may be very precious,
or you may want the flexibility to perform multiple experiments.
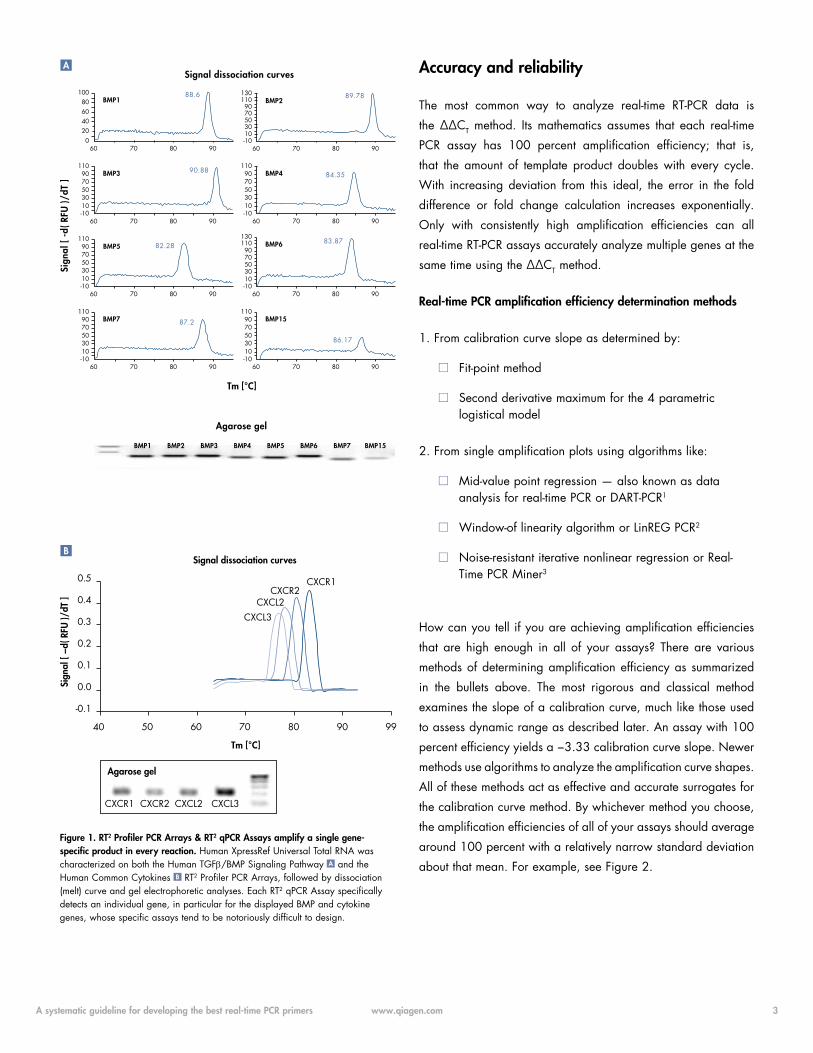
How can you tell whether your assays are sensitive enough?
To rigorously test real-time PCR assay sensitivity, screen a panel
of genes in a biological sample where you know that they are
expressed at very low levels. For example, look for inflammatory
cytokine expression in RNA from uninduced cells, such as the
experiment shown in Figure 3. See how many of those genes can
be detected with the amounts of total RNA that you typically get
from the numbers of cells or amounts of tissues that you work with.
Posi
tive
calls
(%)
100
80
60
40
20
0
1000 500 100 50 25
Human In�ammatory Cytokines & Receptors RT2 Pro�ler PCR Array
Input RNA (ng)
Figure 3. RT2 Profiler PCR Arrays and RT2 qPCR Primer Assays have the sensitivity to see more genes, like uninduced cytokines, with less RNA. Different amounts of Human XpressRef Universal Total RNA (pooled from more than 20 different human cell lines) were characterized using Human Inflammatory Cytokines & Receptors RT2 Profiler PCR Arrays. The percentage of detectable genes (those yielding threshold cycle values less than 35) was calculated and plotted against each RNA amount. As little as 25 ng total RNA yields greater than 80 percent positive calls — even for cytokine genes in uninduced cells.
Dynamic range
Sensitivity may also be judged by how many copies of cDNA can
be detected. When analyzing the expression of multiple genes at
once in the same cycling run, some genes may be expressed at
very low copy numbers while other may be expressed at much
higher copy numbers. Real-time PCR assays, in general, have the
unique potential capability of detecting transcripts down to one
individual copy and up to several orders of magnitude more.
Researchers have come to expect or even assume that real-time
PCR assays indeed detect a wide variety of transcripts expressed
at very different levels.
However, how can you tell if your assays actually have a
dynamic range that is wide enough? Generate a calibration
curve like you may have done determine amplification efficiency.
Start with an artificial template of known concentration — for
example, the purified product of a reaction from the same
assay or a pool of genomic DNA. Perform five- or ten-fold serial
dilutions of that nucleic acid, and use each dilution as template
for different reactions assaying the same gene or set of genes.
5www.qiagen.comA systematic guideline for developing the best real-time PCR primers
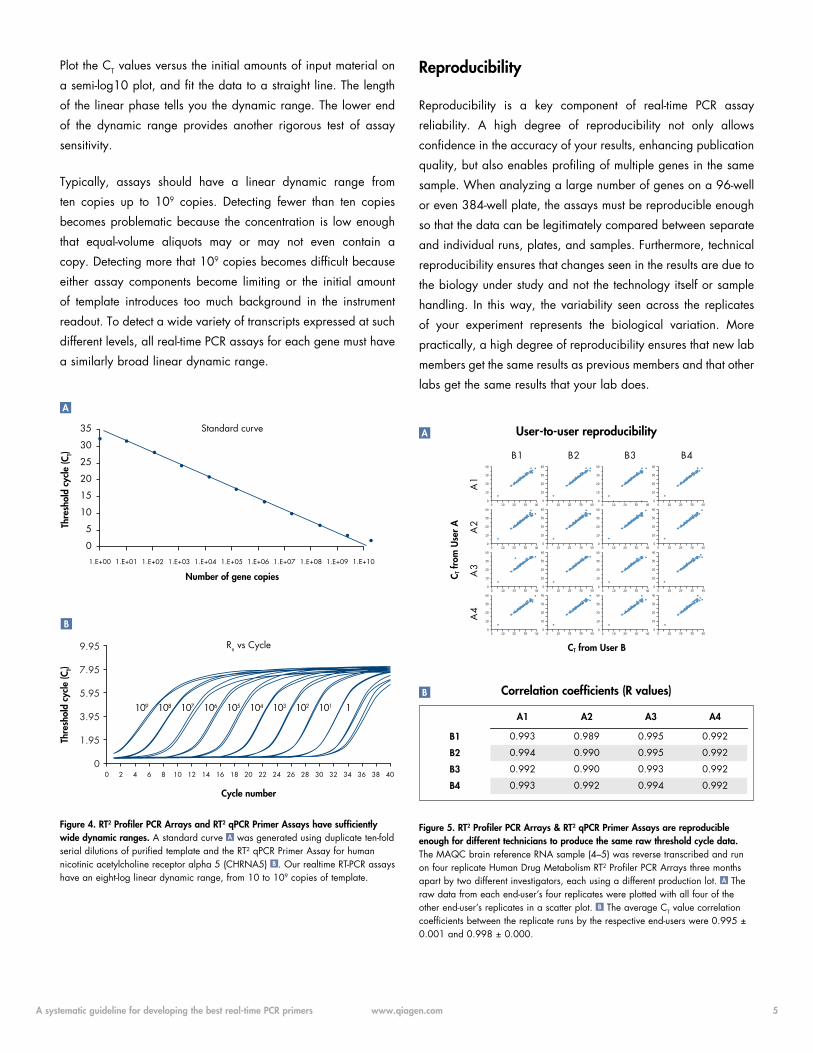
Plot the CT values versus the initial amounts of input material on
a semi-log10 plot, and fit the data to a straight line. The length
of the linear phase tells you the dynamic range. The lower end
of the dynamic range provides another rigorous test of assay
sensitivity.
Typically, assays should have a linear dynamic range from
ten copies up to 109 copies. Detecting fewer than ten copies
becomes problematic because the concentration is low enough
that equal-volume aliquots may or may not even contain a
copy. Detecting more that 109 copies becomes difficult because
either assay components become limiting or the initial amount
of template introduces too much background in the instrument
readout. To detect a wide variety of transcripts expressed at such
different levels, all real-time PCR assays for each gene must have
a similarly broad linear dynamic range.
1.E+01 1.E+02 1.E+03 1.E+04 1.E+05 1.E+08 1.E+09 1.E+10
35
1.E+071.E+061.E+00
30
25
20
15
10
5
0
Standard curve
Number of gene copies
Thre
shol
d cy
cle
(CT)
A
20
7.95
5.95
3.95
1.95
0
Cycle number
Thre
shol
d cy
cle
(CT)
9.95
4 6 8 10 12 14 16 18 20 22 24 26 28 30 32 34 36 38 40
109 108 107 106 105 104 103 102 101 1
Rn vs Cycle
B
Figure 4. RT2 Profiler PCR Arrays and RT2 qPCR Primer Assays have sufficiently wide dynamic ranges. A standard curve A was generated using duplicate ten-fold serial dilutions of purified template and the RT2 qPCR Primer Assay for human nicotinic acetylcholine receptor alpha 5 (CHRNA5) B . Our realtime RT-PCR assays have an eight-log linear dynamic range, from 10 to 109 copies of template.
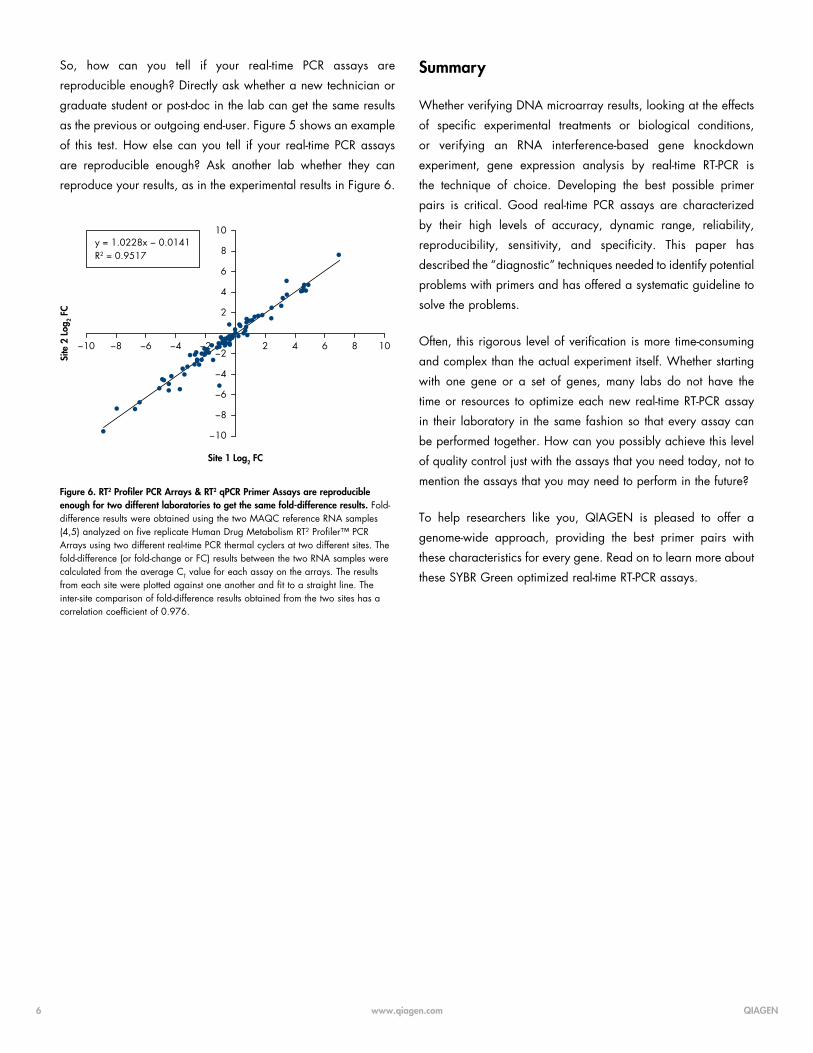
Reproducibility
Reproducibility is a key component of real-time PCR assay
reliability. A high degree of reproducibility not only allows
confidence in the accuracy of your results, enhancing publication
quality, but also enables profiling of multiple genes in the same
sample. When analyzing a large number of genes on a 96-well
or even 384-well plate, the assays must be reproducible enough
so that the data can be legitimately compared between separate
and individual runs, plates, and samples. Furthermore, technical
reproducibility ensures that changes seen in the results are due to
the biology under study and not the technology itself or sample
handling. In this way, the variability seen across the replicates
of your experiment represents the biological variation. More
practically, a high degree of reproducibility ensures that new lab
members get the same results as previous members and that other
labs get the same results that your lab does.
CT from User B
C T fr
om U
ser
AB1 B4B3B2
A1
A4
A3
A2
User-to-user reproducibility
A1 A2 A3 A4
0.993 0.989 0.995 0.992
0.994 0.990 0.995 0.992
0.992 0.990 0.993 0.992
0.993 0.992 0.994 0.992
B1
B2
B3
B4
Correlation coefficients (R values)
A
B
Figure 5. RT2 Profiler PCR Arrays & RT2 qPCR Primer Assays are reproducible enough for different technicians to produce the same raw threshold cycle data. The MAQC brain reference RNA sample (4–5) was reverse transcribed and run on four replicate Human Drug Metabolism RT2 Profiler PCR Arrays three months apart by two different investigators, each using a different production lot. A The raw data from each end-user’s four replicates were plotted with all four of the other end-user’s replicates in a scatter plot. B The average CT value correlation coefficients between the replicate runs by the respective end-users were 0.995 ± 0.001 and 0.998 ± 0.000.
6 www.qiagen.com QIAGEN
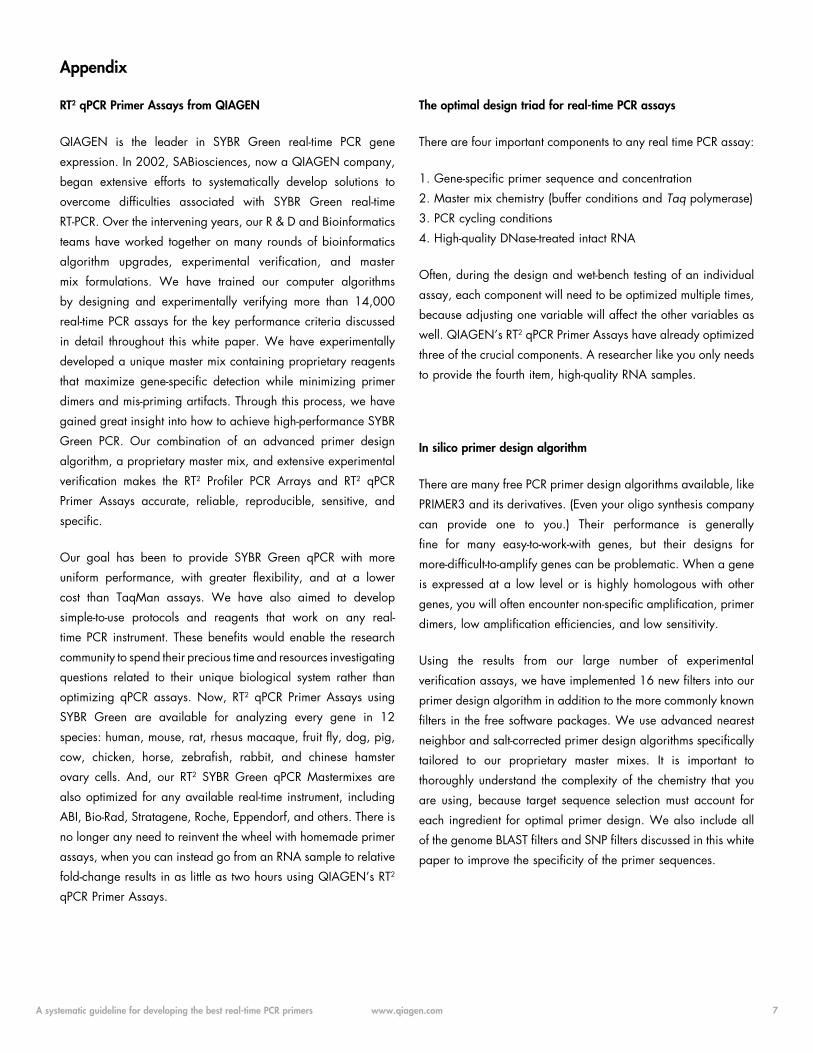
So, how can you tell if your real-time PCR assays are
reproducible enough? Directly ask whether a new technician or
graduate student or post-doc in the lab can get the same results
as the previous or outgoing end-user. Figure 5 shows an example
of this test. How else can you tell if your real-time PCR assays
are reproducible enough? Ask another lab whether they can
reproduce your results, as in the experimental results in Figure 6.
10
8
6
4
2
−2
−4
−6
−8
−10
−10 −8 −6 −4 −2 2 4 6 8 10
Site 1 Log2 FC
Site
2 L
og2 F
C
y = 1.0228x − 0.0141R2 = 0.9517
Figure 6. RT2 Profiler PCR Arrays & RT2 qPCR Primer Assays are reproducible enough for two different laboratories to get the same fold-difference results. Fold-difference results were obtained using the two MAQC reference RNA samples (4,5) analyzed on five replicate Human Drug Metabolism RT2 Profiler™ PCR Arrays using two different real-time PCR thermal cyclers at two different sites. The fold-difference (or fold-change or FC) results between the two RNA samples were calculated from the average CT value for each assay on the arrays. The results from each site were plotted against one another and fit to a straight line. The inter-site comparison of fold-difference results obtained from the two sites has a correlation coefficient of 0.976.
Summary
Whether verifying DNA microarray results, looking at the effects
of specific experimental treatments or biological conditions,
or verifying an RNA interference-based gene knockdown
experiment, gene expression analysis by real-time RT-PCR is
the technique of choice. Developing the best possible primer
pairs is critical. Good real-time PCR assays are characterized
by their high levels of accuracy, dynamic range, reliability,
reproducibility, sensitivity, and specificity. This paper has
described the “diagnostic” techniques needed to identify potential
problems with primers and has offered a systematic guideline to
solve the problems.
Often, this rigorous level of verification is more time-consuming
and complex than the actual experiment itself. Whether starting
with one gene or a set of genes, many labs do not have the
time or resources to optimize each new real-time RT-PCR assay
in their laboratory in the same fashion so that every assay can
be performed together. How can you possibly achieve this level
of quality control just with the assays that you need today, not to
mention the assays that you may need to perform in the future?
To help researchers like you, QIAGEN is pleased to offer a
genome-wide approach, providing the best primer pairs with
these characteristics for every gene. Read on to learn more about
these SYBR Green optimized real-time RT-PCR assays.
7www.qiagen.comA systematic guideline for developing the best real-time PCR primers
Appendix
RT2 qPCR Primer Assays from QIAGEN
QIAGEN is the leader in SYBR Green real-time PCR gene
expression. In 2002, SABiosciences, now a QIAGEN company,
began extensive efforts to systematically develop solutions to
overcome difficulties associated with SYBR Green real-time
RT-PCR. Over the intervening years, our R & D and Bioinformatics
teams have worked together on many rounds of bioinformatics
algorithm upgrades, experimental verification, and master
mix formulations. We have trained our computer algorithms
by designing and experimentally verifying more than 14,000
real-time PCR assays for the key performance criteria discussed
in detail throughout this white paper. We have experimentally
developed a unique master mix containing proprietary reagents
that maximize gene-specific detection while minimizing primer
dimers and mis-priming artifacts. Through this process, we have
gained great insight into how to achieve high-performance SYBR
Green PCR. Our combination of an advanced primer design
algorithm, a proprietary master mix, and extensive experimental
verification makes the RT2 Profiler PCR Arrays and RT2 qPCR
Primer Assays accurate, reliable, reproducible, sensitive, and
specific.
Our goal has been to provide SYBR Green qPCR with more
uniform performance, with greater flexibility, and at a lower
cost than TaqMan assays. We have also aimed to develop
simple-to-use protocols and reagents that work on any real-
time PCR instrument. These benefits would enable the research
community to spend their precious time and resources investigating
questions related to their unique biological system rather than
optimizing qPCR assays. Now, RT2 qPCR Primer Assays using
SYBR Green are available for analyzing every gene in 12
species: human, mouse, rat, rhesus macaque, fruit fly, dog, pig,
cow, chicken, horse, zebrafish, rabbit, and chinese hamster
ovary cells. And, our RT2 SYBR Green qPCR Mastermixes are
also optimized for any available real-time instrument, including
ABI, Bio-Rad, Stratagene, Roche, Eppendorf, and others. There is
no longer any need to reinvent the wheel with homemade primer
assays, when you can instead go from an RNA sample to relative
fold-change results in as little as two hours using QIAGEN’s RT2
qPCR Primer Assays.
The optimal design triad for real-time PCR assays
There are four important components to any real time PCR assay:
1. Gene-specific primer sequence and concentration
2. Master mix chemistry (buffer conditions and Taq polymerase)
3. PCR cycling conditions
4. High-quality DNase-treated intact RNA
Often, during the design and wet-bench testing of an individual
assay, each component will need to be optimized multiple times,
because adjusting one variable will affect the other variables as
well. QIAGEN’s RT2 qPCR Primer Assays have already optimized
three of the crucial components. A researcher like you only needs
to provide the fourth item, high-quality RNA samples.
In silico primer design algorithm
There are many free PCR primer design algorithms available, like
PRIMER3 and its derivatives. (Even your oligo synthesis company
can provide one to you.) Their performance is generally
fine for many easy-to-work-with genes, but their designs for
more-difficult-to-amplify genes can be problematic. When a gene
is expressed at a low level or is highly homologous with other
genes, you will often encounter non-specific amplification, primer
dimers, low amplification efficiencies, and low sensitivity.
Using the results from our large number of experimental
verification assays, we have implemented 16 new filters into our
primer design algorithm in addition to the more commonly known
filters in the free software packages. We use advanced nearest
neighbor and salt-corrected primer design algorithms specifically
tailored to our proprietary master mixes. It is important to
thoroughly understand the complexity of the chemistry that you
are using, because target sequence selection must account for
each ingredient for optimal primer design. We also include all
of the genome BLAST filters and SNP filters discussed in this white
paper to improve the specificity of the primer sequences.
8 www.qiagen.com QIAGEN
Experimental wet-bench verification
Once the primers are designed, they are passed from the
bioinformatics group to the production group for wet-bench
quality control and verification to guarantee high-performance
in our customers’ hands. QIAGEN experimentally verifies every
primer pair before it is shipped. Each RT2 qPCR Primer Assay is
certified to generate a single melting curve peak and single gel
electrophoresis band with high amplification efficiency. If a RT2
qPCR Primer Assay does not meet all of the above requirements,
then it fails quality control and is sent back to our bioinformatics
scientists for re-design.
Optimized master mix formulation
Master mix formulation also plays a very important role in SYBR
Green real-time PCR. The major challenge in designing a master
mix is nonspecific amplification, such as primer dimers and other
secondary products, which compromise the specificity of the
signal. A good primer design algorithm can significantly reduce
this problem. In addition to primer design, a tightly controlled
hot-start Taq enzyme and several chemical additives can also
significantly minimize or eliminate non-specific amplification
during SYBR Green qPCR. Through our verification of assays for
over 14,000 genes, we have also optimized the formulation of
our RT2 SYBR Green qPCR Mastermixes to achieve this level of
performance.
References
1. Peirson, S.N., Butler, J.N., and Foster, R.G. (2003) Experimental validation of novel and conventional approaches to quantitative realtime PCR data analysis. Nuc. Acids Res. 31, e73.
2. Ramakers, C., Ruijter, J.M., Deprez, R.H.L., and Moorman, A.F.M. (2003) Assumption-free analysis of quantitative real-time polymerase chain reaction (PCR) data. Neurosci. Lett. 339, 62.
3. Zhao, S. and Fernald, R.D. (2005) Comprehensive algorithm for quantitative real-time polymerase chain reaction. J. Comput. Biol. 12, 1047.
4. Shi, L. et al. (2006) The MicroArray Quality Control (MAQC) project shows inter- and intra-platform reproducibility of gene expression measurements. Nat. Biotech. 24, 1151.
5. Canales, R.D. et al. (2006) Evaluation of DNA microarray results with quantitative gene expression platforms. Nat. Biotech. 24, 1115.
Trademarks: QIAGEN® (QIAGEN Group); ABI®, ROX®, StepOnePlus® (Applera Corporation); Chromo4®, MyiQ®, Opticon®, iCycler®, iQ5® (Bio-Rad Laboratories); Mastercycler® (Eppendorf, Inc.); SYBR® (Life Technologies); LightCycler®, TaqMan® (Roche Molecular Systems); MX3005P®, Mx3000P®, Mx4000® (Agilent)
1073958 09/2012 © 2012 QIAGEN, all rights reserved
Ordering Information
Product Contents Cat. no.
RT2 Profiler PCR Arrays Pathway, disease, or custom* panels of gene assays 330231
RT2 SYBR Green qPCR Mastermixes Reagents for real-time PCR reactions (available with ROX, fluorescein, or no internal reference dye)
Varies
RT2 First Strand Kit (12) Reagents for cDNA synthesis reactions for 12 samples 330401
RNeasy Mini Kit (50)** Columns, plasticware, and reagents for 50 preps 74104
RNase-free DNase Set (50) Reagents for 50 preps 79254
Compatible with real-time PCR instruments from the following manufacturers:
QIAGEN®, Agilent/Stratagene®, Applied Biosystems®, Bio-Rad®, Eppendorf®, Fluidigm®, Roche®, TaKaRa®
** For cell samples. For other sample types, please visit QIAGEN.com
* For custom arrays, please visit www.sabiosciences.com/custompcrplate.php
Australia n 1-800-243-800Austria n 0800-281011Belgium n 0800-79612Brazil n 0800-557779Canada n 800-572-9613China n 800-988-0325Denmark n 80-885945Finland n 0800-914416
France n 01-60-920-930Germany n 02103-29-12000Hong Kong n 800 933 965India n 1-800-102-4114Ireland n 1800 555 049Italy n 800-787980Japan n 03-6890-7300Korea (South) n 080-000-7145
Luxembourg n 8002 2076Mexico n 01-800-7742-436The Netherlands n 0800-0229592Norway n 800-18859Singapore n 1800-742-4368Spain n 91-630-7050Sweden n 020-790282Switzerland n 055-254-22-11
Taiwan n 0080-665-1947UK n 01293-422-911USA n 800-426-8157
www.SABiosciences.comwww.qiagen.com
RT2 Profiler PCR Arrays are intended for molecular biology applications. These products are not intended for the diagnosis, prevention,
or treatment of a disease.