Embed Size (px)
Citation preview
269
The relationshipbetween labour
share andunemployment:
the role ofwage-settinginstitutions
Pekka Sauramo
PALKANSAAJIEN TUTKIMUSLAITOS • TYÖPAPEREITA
LABOUR INSTITUTE FOR ECONOMIC RESEARCH • DISCUSSION PAPERS
269The relationship between labour share and unemployment: the role of wage-setting institutions*
Pekka Sauramo**
* This study has been funded by the Finnish Employees’ Foundation.
**Labour Institute for Economic Research, Pitkänsillanranta 3A, FI-00530 Helsinki, Finland. Fax:+358-9-25357332. Tel.: +358-9-25357330. E-mail: [email protected]
TYÖPAPEREITA 269
DISCUSSION PAPERS 269
Julkaisija:Palkansaajien tutkimuslaitosPitkänsillanranta 3 A, 00530 Helsinkiwww.labour.fi
Helsinki 2011
ISBN 978–952–209–095–9ISSN 1795–1801
1
TIIVISTELMÄ
Raportissa tarkastellaan funktionaalisen tulonjaon ja työttömyyden välistä riippuvuutta keskeisissä
OECD-maissa. Erityishuomion saa kysymys, onko riippuvuus muuttunut tavalla, joka voidaan
tulkita ammattiyhdistysliikkeen neuvotteluvoiman laskuksi. Tämän lisäksi tarkastellaan, ovatko
palkkaneuvotteluinstituutiot, erityisesti palkkaneuvottelujen koordinaation laajuus, vaikuttaneet
riippuvuuden luonteeseen. Ekonometrinen analyysi perustuu teoriakehikkoon, jossa palkkakäyrä on
keskeinen analyysiväline. Tutkimuksessa hyödynnetään 20 OECD-maata käsittävää paneeliaineis-
toa ja ekonometrista välineistöä, joka sopii epästationaaristen paneelien analysoimiseen.
Tulosten mukaan useimmissa OECD-maissa havaittua palkkojen osuuden laskua ei voida selittää
työttömyyden nousulla. On erittäin todennäköistä, että lasku on ainakin osittain seurausta heiken-
tyneestä ay-liikkeen neuvotteluvoimasta. Annetulla työttömyysasteen tasolla palkkojen osuus on
nykyään alhaisempi kuin aiemmin.
Asiasanat: Palkkojen osuus, työttömyys, palkkakäyrä, neuvottelukoordinaatio, neuvotteluvoima
ABSTRACT
The paper is concerned with the relationship between labour share and unemployment in the major
OECD countries. Special emphasis is put on examining whether the relationship has altered in a
manner which can be interpreted as an indication of the weakened bargaining power of labour. The
econometric analysis is based on the use of the theoretical framework which employs the notion of
the wage curve as a central analytical tool. The investigation utilises cross-country panel data for
twenty OECD countries over the period from 1972 to 2008 and statistical methods suitable for the
examination of non-stationary panels.
According to the results, the decline in the labour share, which is apparent in most major OECD
countries, is highly likely due, at least partly, to the weakened bargaining power of labour. With a
given level of unemployment, the labour share is nowadays lower than before.
Key words: Labour share, Unemployment, Wage curve, Bargaining coordination, Bargaining
power
JEL classification: E24, E25, J52
2
1. INTRODUCTION
Labour shares have been in decline in most developed countries for a rather long period of time.
Even though no common downward trend has been found in the series, the similar pattern of the
developments has most probably been one reason for the rise in the number of studies in which
developments in the labour share have been analysed within a comparative setting.
It has not come as a surprise that the effects of globalisation and the factors related to production
technology have been regarded in these studies as major potential causes of a similar pattern. For
example, reports by the European Commission (2007), the IMF (2007), the OECD (2007) and the
ILO (2008A, 2008B, 2010) contain comparative analyses in which the importance of these factors
is examined. However, it is not obvious which are potentially the most important transmission
channels through which globalisation and/or factors related to production technology are assumed
to operate.
Varying interpretations have been provided, depending on the theoretical frameworks which various
studies have utilised. Not even the use of frameworks that are based on mainstream
macroeconomics allows one to outline a consensus interpretation about the importance of these two
factors, which may also be associated with each other. According to reports by the European
Commission (2007) and the IMF (2007), globalisation has reduced the labour share, but its
influence has been small. The largest contribution to the fall in the labour share derives from skill-
based technological change.
The results in which the role of technological change is highlighted have typically been based on
those standard neoclassical models which utilise the assumption about profit maximizing firms,
and, accordingly, demand for labour curves (see, for example, Bentolila and Saint-Paul, 2003;
Arpaia et al. , 2009). In some econometric studies the theoretical foundations have been relatively
loose, but within the major alternative frameworks the determination of the labour share is normally
modelled as a part of wage determination.
These frameworks allow for the analysis of one potentially important consequence of globalisation.
Because globalisation makes capital more mobile and accelerates the integration of labour markets
globally, it puts pressure on labour and may weaken the bargaining power of trade unions in
developed countries. The weakening of bargaining power may have been an important cause of the
fall in the labour share. This factor has been emphasised in a number of studies (Choi 2001;
3
Harrison, 2002; ILO 2008B; Jayadev, 2009; Onaran, 2009; Stockhammer, 2009). It is, however, not
easy to quantify the effect, nor is it straightforward to specify the transmission channel through
which it operates.
One transmission channel may operate through unemployment. There is a long tradition of thought,
which goes right back to Marx, according to which the reserve army of the unemployed holds down
workers’ wage claims. This idea has been central in many schools of thought including both
mainstream and heterodox theories.
The integration of the global labour market may have maintained, or even increased, unemployment
in developed countries, and especially in Europe, providing pressure on labour. On the other hand,
the owners of the more mobile capital may have strengthened their bargaining power, with a given
rate of unemployment, because they have the outside option, i. e. the threat to move capital abroad,
at their disposal.
Even though the relationship between the labour share and unemployment has not been completely
ignored in comparative studies, it deserves further analysis, because the role of unemployment as a
factor influencing the labour share has remained vague. For example, Jayadev (2007) analysed the
relationship between the labour share and capital account openness, using data for high, middle and
low income countries, and found evidence of a negative correlation between the degree of openness
and the labour share among the high and middle income countries. Because of the lack of data on
unemployment for low and middle income countries he was not able to control the role of
unemployment in every case. For high income (OECD) countries it was possible, however.
Unemployment was an important explanatory variable. Its use as a control variable decreased the
importance of the variable for capital account openness (Jayadev, 2007, Table 6).
In this paper the relationship between the labour share and unemployment in the major OECD
countries is the main subject of interest. Special emphasis is put on examining whether the
relationship between the labour share and unemployment has changed in a manner which can be
interpreted as a consequence of the weakened bargaining power of labour. The nature of the
relationship between the labour share and unemployment may be different in various OECD
countries, reflecting differences in wage-setting institutions. For example, the adjustment of the
labour share to shocks in unemployment may be different in countries with different degrees of
bargaining coordination. The presence of differences of this kind is also studied.
4
Recently, this kind of investigation has not gained much attention. However, the OECD (2004)
analyses the importance of wage-setting institutions on some wage outcomes, for example, on the
labour share, and concludes that the degree of wage coordination has not affected the labour share
in the major OECD countries. One aim of this study is to contribute to analyses of this kind.
The econometric analysis will be based on the use of cross-country data over a time period
consisting of almost forty years. In recent years the use of methods for non-stationary panels has
gained popularity in the examination of this kind of data. These methods are utilised extensively in
this paper. Panel unit root tests, cointegration tests and estimators suitable for utilising non-
stationary panels in the estimation of dynamic equations are employed in the investigation of the
relationship between the labour share and unemployment. So far, these methods have not been
widely used in the comparative analyses of labour shares, even though the presence of time trend in
the series depicting developments of the labour share in individual country data may result in
spurious regressions when variables including trends are used as explanatory variables.
The paper is organised as follows. First, some major alternative theoretical approaches which have
been utilised in the examination of the determinants of the labour share are introduced. Then, some
descriptive evidence of the developments of labour shares and unemployment is presented. The
main results are presented in the fourth section. In the fifth section they are used in the discussion
about the relevance of the framework utilised in the examination. The final section concludes.
2. THE LABOUR SHARE AND UNEMPLOYMENT: THEORY
The most convenient way of analysing the relationship between the labour share and unemployment
is to utilise an analytical framework within which the determination of the functional distribution of
income is a part of (real) wage determination. Within the class of such frameworks those
frameworks which describe wage determination as a part of the conflict between trade unions and
employers are the most appealing. Those frameworks include both mainstream and heterodox
theories. Some authors have characterised the conflict as the “battle of mark-ups” (Blanchard, 1986;
Burda and Wyplosz, 2001).
Nowadays, theories, especially the mainstream ones, typically utilise models which are based on
game theory. Within one important class of models the outcome of the negotiations between a
representative union and a representative employer is typically represented by a curve which
represents a wage claim as a function of unemployment (or employment) and some other factors
5
like the tax wedge and the replacement ratio. Various authors have given the curve various names.
Here it is called the wage curve.
The conflict theory which utilises wage curves has played a very important role in the analysis of
unemployment in Europe, and it has been used extensively when the estimates of the NAIRU have
been estimated. Layard et al. (1991) was one of the main sources of inspiration for those studies
(see also, for example, Stockhammer and Klär, 2011). However, it can also be utilised in the
examination of the functional distribution of income.
Even though the wage claim is normally expressed as a real wage claim, some reasonable
assumptions allow one to express the overall outcome of the negotiations as a claim concerning the
labour share - see, in particular, Rowthorn (1999B) (for other examples, see Broer et al. 2000;
Draper and Huizinga, 2001; Nymoen and Rødseth, 2003). Formally, the wage curve can be
expressed as
(1) WL/PY = f(U,Z),
where WL/PY denotes the labour share, U unemployment and vector Z other factors affecting the
labour share.
The higher the level of unemployment is, the weaker is the trade unions’ bargaining position and
the smaller is the labour share. It must be remembered, however, that the bargaining position is not
the same as the bargaining power. Negotiation models include a distinct parameter for bargaining
power. That parameter acts as a shift parameter. When, for example, the trade unions’ bargaining
power weakens, the wage curve shifts downwards. Thus, with a given rate of unemployment, the
weakening of the trade unions’ bargaining power lowers the labour share.
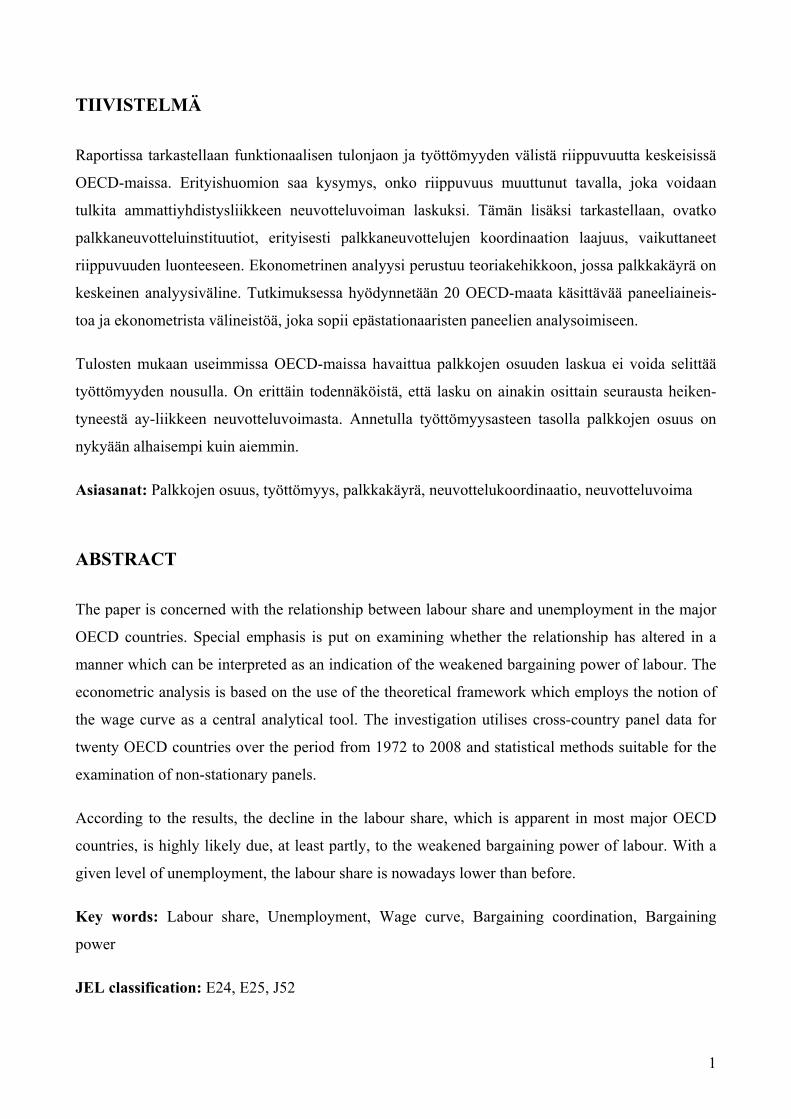
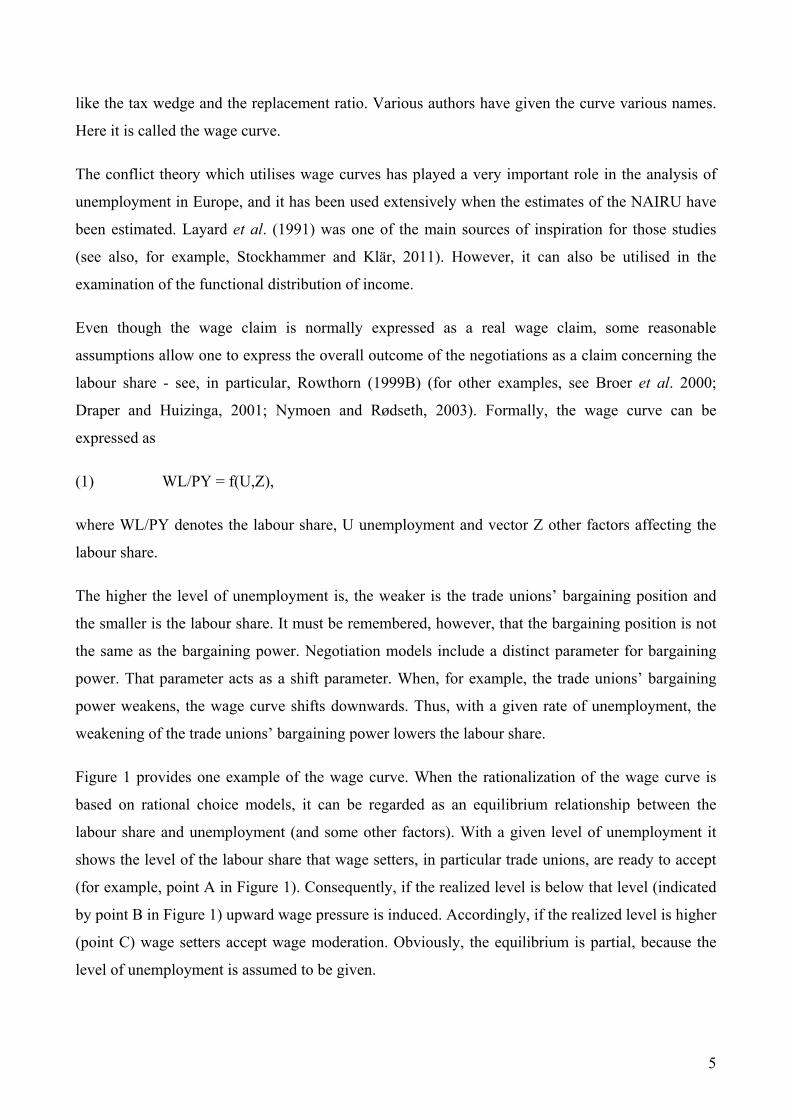
Figure 1 provides one example of the wage curve. When the rationalization of the wage curve is
based on rational choice models, it can be regarded as an equilibrium relationship between the
labour share and unemployment (and some other factors). With a given level of unemployment it
shows the level of the labour share that wage setters, in particular trade unions, are ready to accept
(for example, point A in Figure 1). Consequently, if the realized level is below that level (indicated
by point B in Figure 1) upward wage pressure is induced. Accordingly, if the realized level is higher
(point C) wage setters accept wage moderation. Obviously, the equilibrium is partial, because the
level of unemployment is assumed to be given.
6
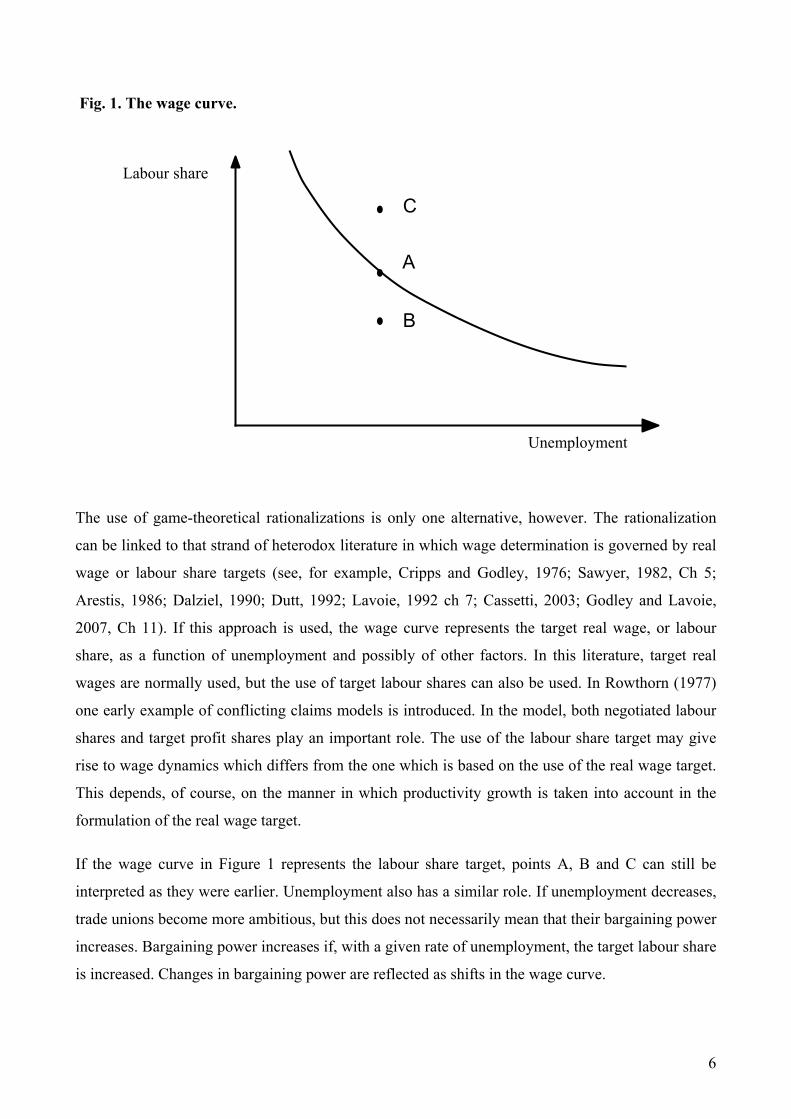
Fig. 1. The wage curve.
The use of game-theoretical rationalizations is only one alternative, however. The rationalization
can be linked to that strand of heterodox literature in which wage determination is governed by real
wage or labour share targets (see, for example, Cripps and Godley, 1976; Sawyer, 1982, Ch 5;
Arestis, 1986; Dalziel, 1990; Dutt, 1992; Lavoie, 1992 ch 7; Cassetti, 2003; Godley and Lavoie,
2007, Ch 11). If this approach is used, the wage curve represents the target real wage, or labour
share, as a function of unemployment and possibly of other factors. In this literature, target real
wages are normally used, but the use of target labour shares can also be used. In Rowthorn (1977)
one early example of conflicting claims models is introduced. In the model, both negotiated labour
shares and target profit shares play an important role. The use of the labour share target may give
rise to wage dynamics which differs from the one which is based on the use of the real wage target.
This depends, of course, on the manner in which productivity growth is taken into account in the
formulation of the real wage target.
If the wage curve in Figure 1 represents the labour share target, points A, B and C can still be
interpreted as they were earlier. Unemployment also has a similar role. If unemployment decreases,
trade unions become more ambitious, but this does not necessarily mean that their bargaining power
increases. Bargaining power increases if, with a given rate of unemployment, the target labour share
is increased. Changes in bargaining power are reflected as shifts in the wage curve.
Unemployment
Labour share
B
A
C
7
If the wage curve is given one of the two interpretations above, it has a special role in the empirical
time series analysis of wage and labour share determination. It works as an error-correction
mechanism in empirical dynamic wage equations.
To give an example, assume that the wage curves are of the form
(2) ln(WL/PQ)* = α - βln(U), α, β>0,
where ln(WL/PQ)* is the log of the target labour share and U is the unemployment rate. Because
the unemployment rate is the only explanatory variable, the curve is as simple as possible.
One example of a dynamic equation in which equation (2) acts as an error-correction term is as
follows.
(3) ∆ln(WL/PQ)t = -γ∆ln(U)t-1 -λ(ln(WL/PQ) - ln(WL/PQ)*)t-1,
= -γ∆ln(U)t-1 –λ(ln(WL/PQ) - α + βln(U))t-1, γ, λ>0,
i.e., in addition to the error-correction term the equations may include lagged changes in the
unemployment rate as explanatory variables. Sargan (1964) is an early example of the use of such
models. Parameter λ describes the speed of adjustment towards the wage curve.
If the empirical analysis of labour shares is based on the utilisation of theoretical frameworks in
which the determination of the labour share is a part of the determination of wages, the estimation
of wage curves suggests itself. If only wage curves are estimated, only a part of the wage-price
dynamics represented by conflicting claims models is modelled. Nevertheless, it allows one to pay
special attention to the role of wage-setting institutions as a potentially important factor that affects
the functional distribution of income.
3. THE LABOUR SHARE AND UNEMPLOYMENT: DESCRIPTIVE
EVIDENCE
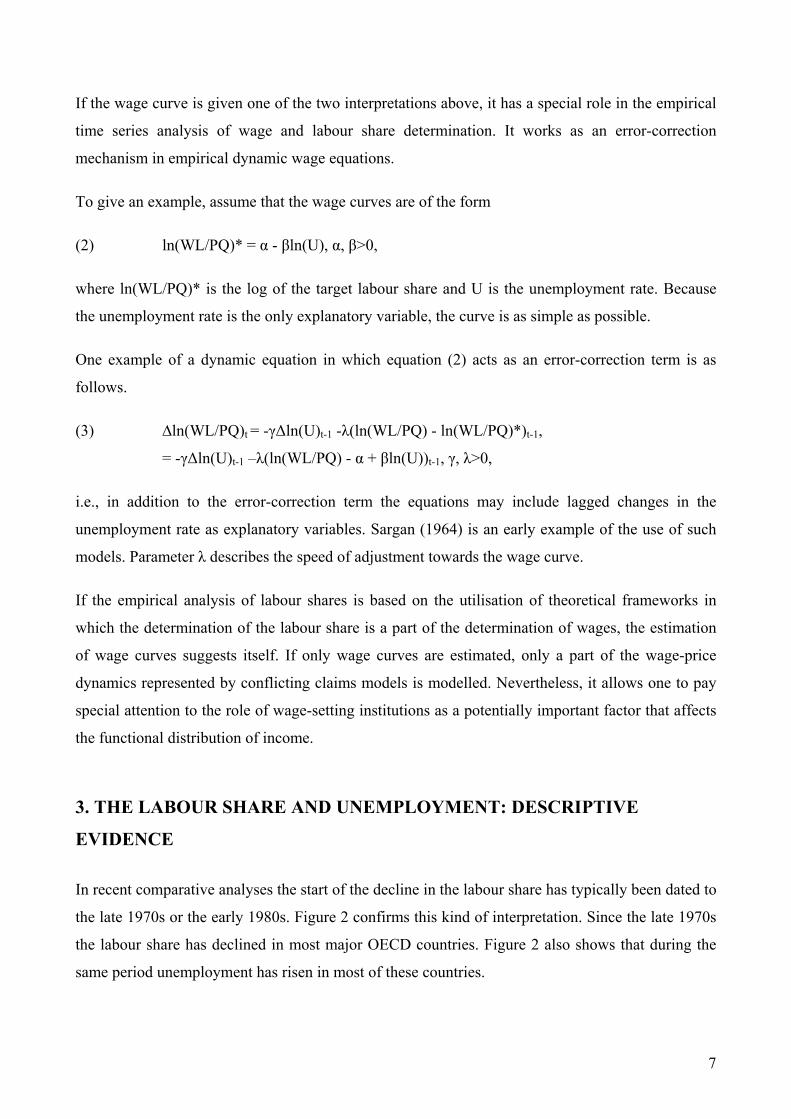
In recent comparative analyses the start of the decline in the labour share has typically been dated to
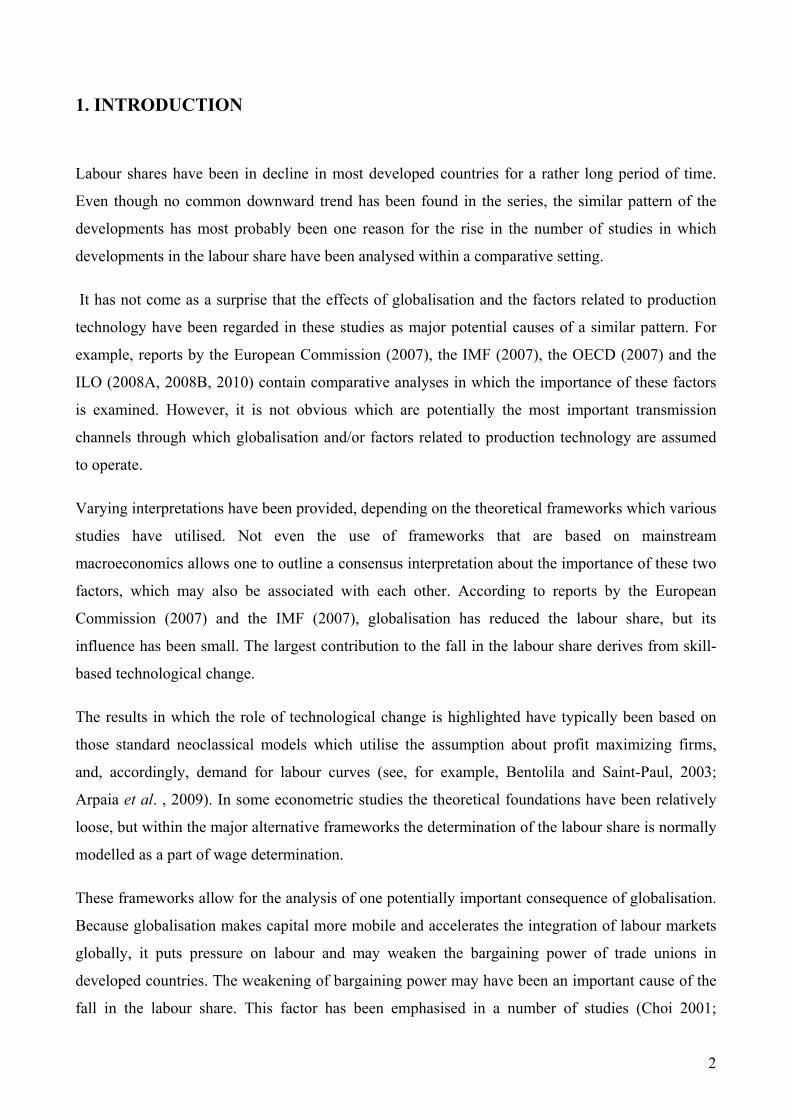
the late 1970s or the early 1980s. Figure 2 confirms this kind of interpretation. Since the late 1970s
the labour share has declined in most major OECD countries. Figure 2 also shows that during the
same period unemployment has risen in most of these countries.
8
Fig. 2. The labour share and unemployment in twenty OECD countries 1972-2008.
Note: The labour share is denoted by WS and the unemployment rate by U. (The scales for WS and U are indicated by the left and right axes, respectively.) The labour share is defined as the share of compensation of employees in GDP at current market prices. The period from 1972 till 2008 is the longest period for which data on the labour share is available for all countries.
Source: AMECO database of the European Commission.
45 50 55 60
0
4
8
12
75 80 85 90 95 00 05
Australia
48
52
56
60
0
2
4
6
75 80 85 90 95 00 05
Austria
48
50
52
54
56
0 4 8 12
75 80 85 90 95 00 05
Belgium
50
52
54
564
6
8
1012
14
75 80 85 90 95 00 05
Canada
50
52
54
56
58
0.0
2.5
5.0
7.5
10.0
75 80 85 90 95 00 05
Denmark
44 48 52 56 60
0
5
10 15 20
75 80 85 90 95 00 05
Finland
50
52
54
56
58
0
4
8
12
75 80 85 90 95 00 05
France
48
52
56
60
0 4 8 12
75 80 85 90 95 00 05
Germany
24
28
32
36
0
4
8
12
16
75 80 85 90 95 00 05
Greece
35
40
45
50
55
0
5
10
15
20
75 80 85 90 95 00 05
Ireland
36 40 44 48 52
4
6
8
10 12
75 80 85 90 95 00 05
Italy
44
48
52
56
0
2
4
6
75 80 85 90 95 00 05
Japan
48
52
56
60
0 4 8 12
75 80 85 90 95 00 05
Netherlands
40
45
50
55
0
2
4
6
8
75 80 85 90 95 00 05
Norway
40
45
50
55
600
4
8
12
75 80 85 90 95 00 05
New Zealand
45 50 55 60 65
0
4
8
12
75 80 85 90 95 00 05
Portugal
44
46
48
50
52
54
0
5
10
15
20
75 80 85 90 95 00 05
Spain
52
56
60
64
68
0.0 2.5 5.0 7.5 10.0
75 80 85 90 95 00 05
Sweden
50
55
60
650
4
8
12
75 80 85 90 95 00 05
United Kingdom
56
57
58
59
60
2
4
6
8
10
75 80 85 90 95 00 05
WS U
United States
9
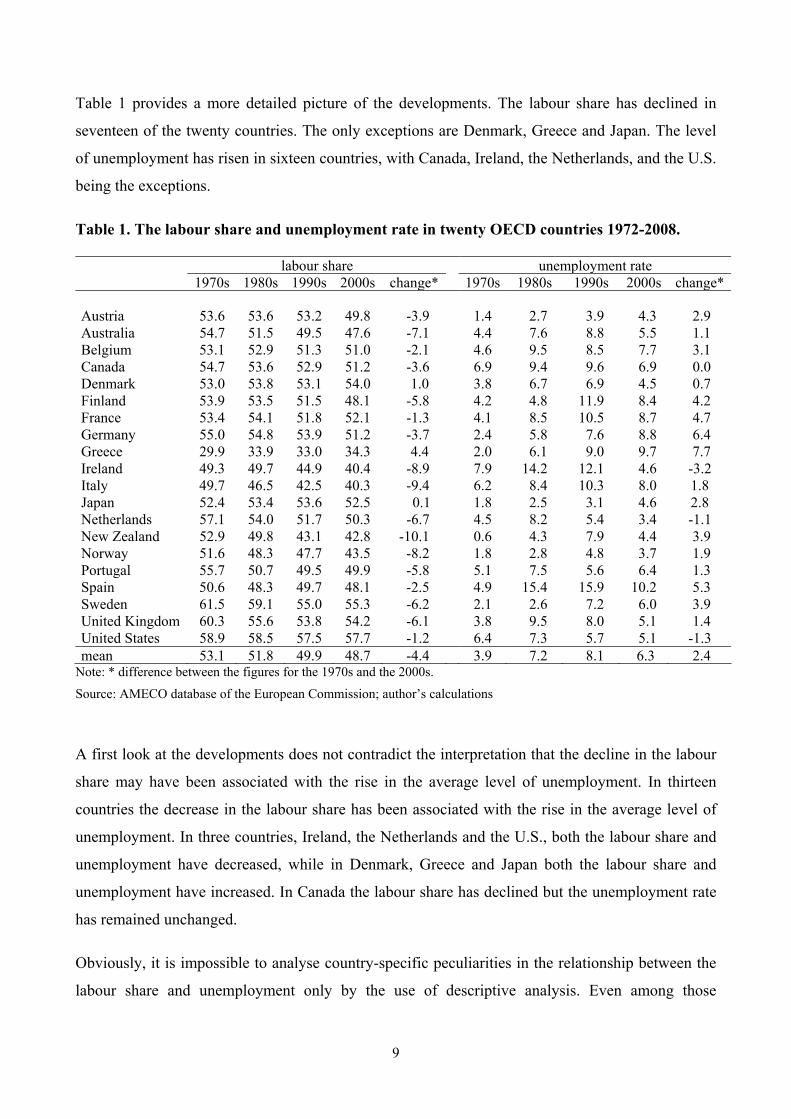
Table 1 provides a more detailed picture of the developments. The labour share has declined in
seventeen of the twenty countries. The only exceptions are Denmark, Greece and Japan. The level
of unemployment has risen in sixteen countries, with Canada, Ireland, the Netherlands, and the U.S.
being the exceptions.
Table 1. The labour share and unemployment rate in twenty OECD countries 1972-2008. labour share unemployment rate 1970s 1980s 1990s 2000s change* 1970s 1980s 1990s 2000s change* Austria 53.6 53.6 53.2 49.8 -3.9 1.4 2.7 3.9 4.3 2.9 Australia 54.7 51.5 49.5 47.6 -7.1 4.4 7.6 8.8 5.5 1.1 Belgium 53.1 52.9 51.3 51.0 -2.1 4.6 9.5 8.5 7.7 3.1 Canada 54.7 53.6 52.9 51.2 -3.6 6.9 9.4 9.6 6.9 0.0 Denmark 53.0 53.8 53.1 54.0 1.0 3.8 6.7 6.9 4.5 0.7 Finland 53.9 53.5 51.5 48.1 -5.8 4.2 4.8 11.9 8.4 4.2 France 53.4 54.1 51.8 52.1 -1.3 4.1 8.5 10.5 8.7 4.7 Germany 55.0 54.8 53.9 51.2 -3.7 2.4 5.8 7.6 8.8 6.4 Greece 29.9 33.9 33.0 34.3 4.4 2.0 6.1 9.0 9.7 7.7 Ireland 49.3 49.7 44.9 40.4 -8.9 7.9 14.2 12.1 4.6 -3.2 Italy 49.7 46.5 42.5 40.3 -9.4 6.2 8.4 10.3 8.0 1.8 Japan 52.4 53.4 53.6 52.5 0.1 1.8 2.5 3.1 4.6 2.8 Netherlands 57.1 54.0 51.7 50.3 -6.7 4.5 8.2 5.4 3.4 -1.1 New Zealand 52.9 49.8 43.1 42.8 -10.1 0.6 4.3 7.9 4.4 3.9 Norway 51.6 48.3 47.7 43.5 -8.2 1.8 2.8 4.8 3.7 1.9 Portugal 55.7 50.7 49.5 49.9 -5.8 5.1 7.5 5.6 6.4 1.3 Spain 50.6 48.3 49.7 48.1 -2.5 4.9 15.4 15.9 10.2 5.3 Sweden 61.5 59.1 55.0 55.3 -6.2 2.1 2.6 7.2 6.0 3.9 United Kingdom 60.3 55.6 53.8 54.2 -6.1 3.8 9.5 8.0 5.1 1.4 United States 58.9 58.5 57.5 57.7 -1.2 6.4 7.3 5.7 5.1 -1.3 mean 53.1 51.8 49.9 48.7 -4.4 3.9 7.2 8.1 6.3 2.4
Note: * difference between the figures for the 1970s and the 2000s.
Source: AMECO database of the European Commission; author’s calculations
A first look at the developments does not contradict the interpretation that the decline in the labour
share may have been associated with the rise in the average level of unemployment. In thirteen
countries the decrease in the labour share has been associated with the rise in the average level of
unemployment. In three countries, Ireland, the Netherlands and the U.S., both the labour share and
unemployment have decreased, while in Denmark, Greece and Japan both the labour share and
unemployment have increased. In Canada the labour share has declined but the unemployment rate
has remained unchanged.
Obviously, it is impossible to analyse country-specific peculiarities in the relationship between the
labour share and unemployment only by the use of descriptive analysis. Even among those
10
countries in which the decline in the labour share has been associated with the rise in
unemployment, the nature of the relationship may differ.
One source of differences may be differing wage-setting institutions. One characteristic of the
wage-setting institutions that is important is bargaining coordination. It may be true that the
determination of the functional distribution of income is different in countries in which pay
negotiations are less coordinated. In particular, the relationship between the labour share and
unemployment may be different. In countries with a high degree of bargaining coordination,
changes in the average level of unemployment may be reflected more directly, and more rapidly, in
pay negotiations than in countries where negotiations are less coordinated. This question was
analysed, for example, in the OECD (2004) without any clear answer, however. The patterns of
developments in Figure 2 motivate further analysis of this question.
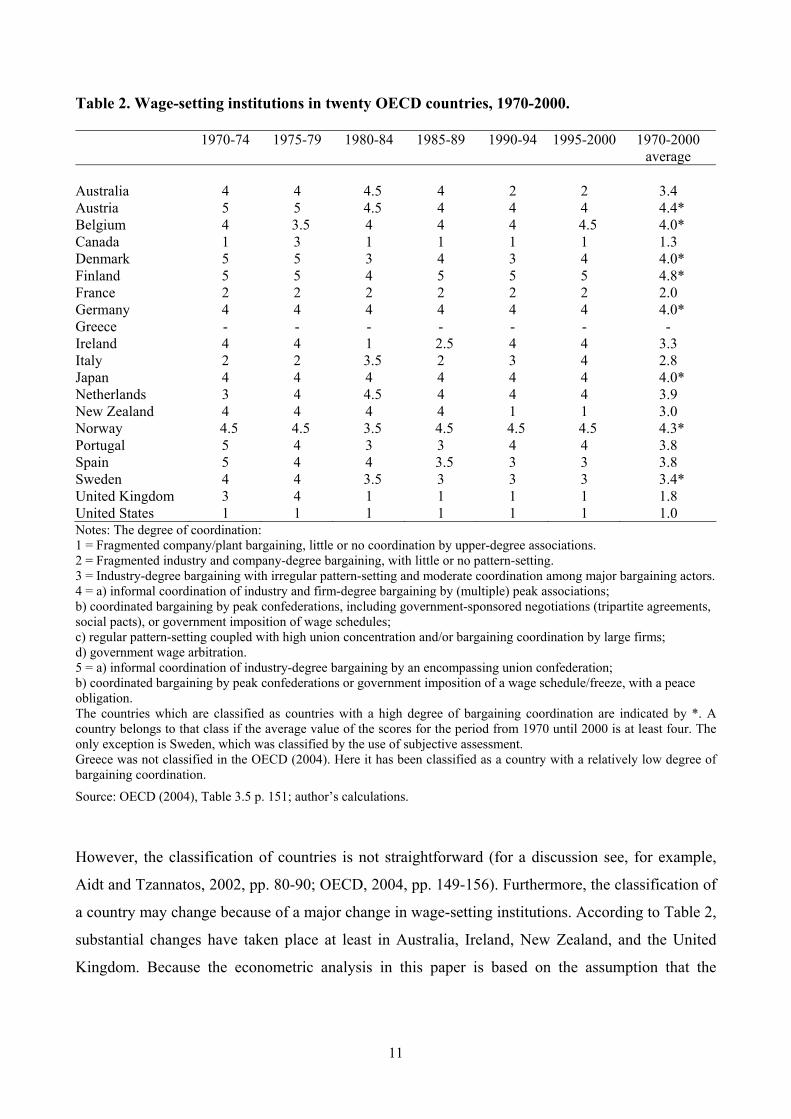
In this paper the classification used by the OECD (2004) has been utilised in classifying the
countries according to the degree of bargaining coordination. The twenty OECD countries can be
divided roughly into two groups. The first one consists of countries where the degree of bargaining
coordination is high and the second one where it is not so high. All Anglo-Saxon countries belong
to the second group. The classification is illustrated by Table 2.
11
Table 2. Wage-setting institutions in twenty OECD countries, 1970-2000. 1970-74 1975-79 1980-84 1985-89 1990-94 1995-2000 1970-2000
average Australia 4 4 4.5 4 2 2 3.4 Austria 5 5 4.5 4 4 4 4.4* Belgium 4 3.5 4 4 4 4.5 4.0* Canada 1 3 1 1 1 1 1.3 Denmark 5 5 3 4 3 4 4.0* Finland 5 5 4 5 5 5 4.8* France 2 2 2 2 2 2 2.0 Germany 4 4 4 4 4 4 4.0* Greece - - - - - - - Ireland 4 4 1 2.5 4 4 3.3 Italy 2 2 3.5 2 3 4 2.8 Japan 4 4 4 4 4 4 4.0* Netherlands 3 4 4.5 4 4 4 3.9 New Zealand 4 4 4 4 1 1 3.0 Norway 4.5 4.5 3.5 4.5 4.5 4.5 4.3* Portugal 5 4 3 3 4 4 3.8 Spain 5 4 4 3.5 3 3 3.8 Sweden 4 4 3.5 3 3 3 3.4* United Kingdom 3 4 1 1 1 1 1.8 United States 1 1 1 1 1 1 1.0 Notes: The degree of coordination: 1 = Fragmented company/plant bargaining, little or no coordination by upper-degree associations. 2 = Fragmented industry and company-degree bargaining, with little or no pattern-setting. 3 = Industry-degree bargaining with irregular pattern-setting and moderate coordination among major bargaining actors. 4 = a) informal coordination of industry and firm-degree bargaining by (multiple) peak associations; b) coordinated bargaining by peak confederations, including government-sponsored negotiations (tripartite agreements, social pacts), or government imposition of wage schedules; c) regular pattern-setting coupled with high union concentration and/or bargaining coordination by large firms; d) government wage arbitration. 5 = a) informal coordination of industry-degree bargaining by an encompassing union confederation; b) coordinated bargaining by peak confederations or government imposition of a wage schedule/freeze, with a peace obligation. The countries which are classified as countries with a high degree of bargaining coordination are indicated by *. A country belongs to that class if the average value of the scores for the period from 1970 until 2000 is at least four. The only exception is Sweden, which was classified by the use of subjective assessment. Greece was not classified in the OECD (2004). Here it has been classified as a country with a relatively low degree of bargaining coordination.
Source: OECD (2004), Table 3.5 p. 151; author’s calculations.
However, the classification of countries is not straightforward (for a discussion see, for example,
Aidt and Tzannatos, 2002, pp. 80-90; OECD, 2004, pp. 149-156). Furthermore, the classification of
a country may change because of a major change in wage-setting institutions. According to Table 2,
substantial changes have taken place at least in Australia, Ireland, New Zealand, and the United
Kingdom. Because the econometric analysis in this paper is based on the assumption that the
12
classification of the countries remains the same, these changes should be taken into account in the
interpretation of the results.
An obvious alternative for the use of a measure describing the degree of bargaining coordination
would have been a measure describing only the level of bargaining. The measure used in this paper
also takes into account informal bargaining coordination, which may influence the speed by which
wage-setters react to macroeconomic disturbances. For example, within the classification used in
this paper, Japan is a country with a high degree of bargaining coordination mostly because of a
high degree of informal bargaining coordination.
In what follows, the relationship between the labour share and unemployment is analysed by the
utilisation of the framework introduced in Section 2. One general aim of the analysis is to examine,
by the utilization of the data on twenty OECD countries, the goodness of the framework in the
examination of the relationship between the functional distribution of income and unemployment.
The main specific questions are as follows. Do wage curves exist in those countries? How well do
movements in unemployment explain movements in the labour share? Have wage curves shifted
downwards perhaps as a consequence of the weakened bargaining power of labour? Have the wage-
setting institutions affected the nature of the relationships between the labour share and
unemployment? Does the degree of bargaining coordination affect the relationship? In particular,
does the degree of bargaining coordination affect the speed by which the labour share adjusts after a
macroeconomic shock which has caused, for example, a rise in unemployment?
4. THE LABOUR SHARE AND UNEMPLOYMENT: ECONOMETRIC
ANALYSIS
When the estimation of wage curves is based on the above framework, a most important feature of
the wage curve can be seen: it represents an equilibrium relationship between the labour share and
unemployment. As illustrated earlier, this is in accordance with the use of wage curves as error-
correction mechanisms in empirical dynamic wage or labour share equations. But this means that
the wage curve also defines a cointegrating relation between the labour share and unemployment.
Consequently, the existence of wage curves can be analysed by examining whether the labour share
and unemployment are cointegrated. This is the manner in which the relationship between the
labour share and unemployment is studied in this paper. If investigation supports the conclusion that
13
the labour share and unemployment are cointegrated, movements in the labour share are associated
with movements in unemployment.
In this paper the relationship between the labour share and unemployment is analysed by the
construction of a panel data set from the data on individual countries and by the utilisation of
econometric methods which are suitable for the analysis of such data. One reason for the rise in the
popularity of this approach is obvious. Statistical properties of tests which are used in the analysis
of the time series data on individual countries may be worse than those of the tests which are
utilised in the analysis of country panel data. Unit root and cointegration tests are examples of such
tests. Therefore, the conclusions which are based on the use of panel data should, in principle, be
more reliable.
An additional reason for the use of country panel data in this study is the desire to analyse whether
different wage-setting institutions result in differences in the relationship between the labour share
and unemployment. This question can be analysed by grouping the countries according to the wage-
setting institutions. For example, in countries where pay negotiations are coordinated, the
relationship between the labour share and unemployment may be different from the relationship
prevailing in those countries where negotiations are less coordinated.
Obviously, the analytical framework introduced earlier is best suited for the description of wage or
labour share determination within the institutional setting in which the degree of bargaining
coordination is at least relatively high. For example, in countries where wages are set by centrally
negotiated incomes policy agreements it is easier for the trade union movement to set aggregative
labour share targets than in countries were the degree of coordination is relatively low. In addition,
they can more easily adjust their wage claims according to the changes in the general level of
economic activity.
The interpretation of the wage curve as a cointegrating relation, and the use of country panel data,
specifies the nature of the analysis which follows. First, a necessary condition for the existence of a
cointegrating relation between the labour share and unemployment is that the variables are non-
stationary first-order integrated I(1) variables, i.e. their first differences are stationary. Therefore the
unit root properties of the variables are first examined. Because the examination is based on the use
of panel data, these are examined by the utilisation of panel unit root tests. If they are plausible,
panel cointegration tests are conducted thereafter.
14
When these tests are conducted, three groups of countries are separated: the whole panel of twenty
countries, the countries where the degree of bargaining coordination is high, and the countries
where the degree of coordination is relatively low. The classification of the countries is based on the
classification presented by Table 2. Moreover, the robustness of the results is examined by changing
the classification of some countries.
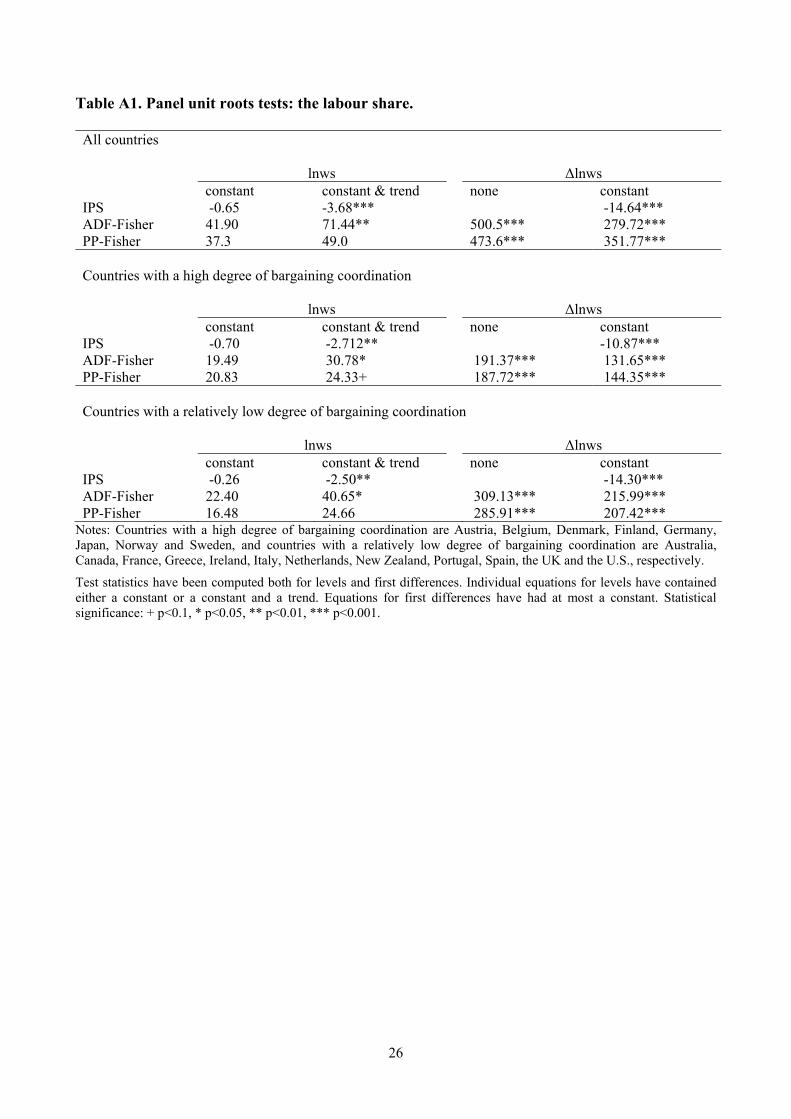
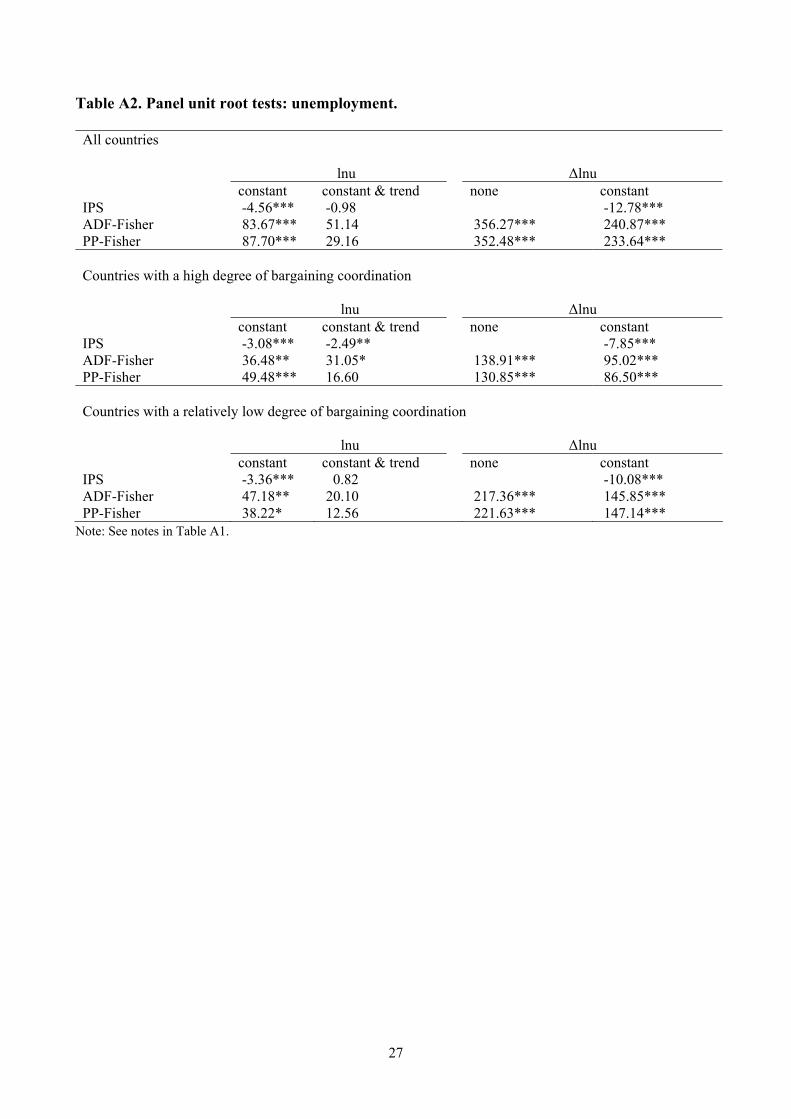
The results for the panel unit root tests are reported in Appendix in Tables A1 and A2, respectively.
The results for the labour share are relatively easy to interpret. According to most tests, the labour
share is a trend stationary I(1) variable. The results for unemployment are harder to interpret.
According to them, at least some panels are stationary even though the test statistics for the
differenced series do not indicate the presence of over-differencing.
Even though these results do not provide unambiguous evidence about the existence of unit roots in
both variables in all countries, they motivate testing cointegration. Four tests are used in testing
cointegration. Three of them have been developed by Pedroni (1999). They are extensions of the
Engle-Granger two-step residual-based cointegration tests. The fourth one is a Fisher-type test
which is based on individual Johansen trace tests for cointegration (see Maddala and Wu, 1999). All
these tests are based on the assumption that country-specific cointegrating relations may differ from
each other.
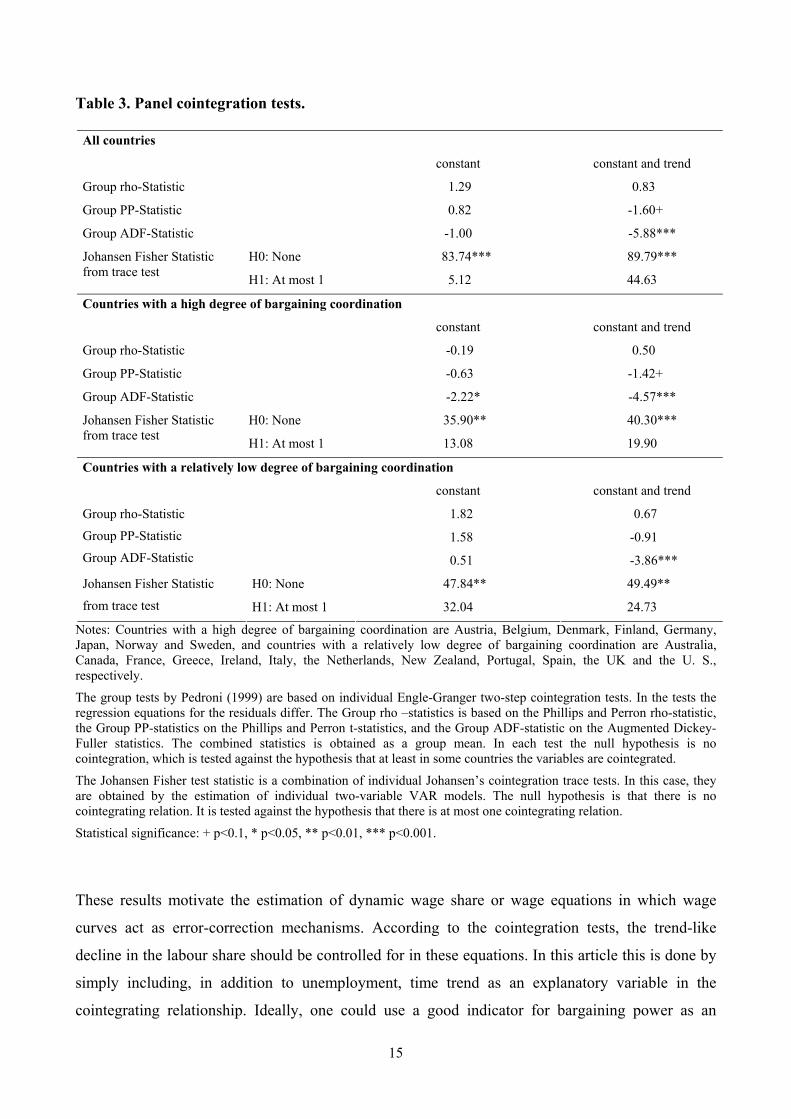
Table 3 reports the results for the panel cointegration tests. If the cointegrating relationship is
assumed to contain a constant (but not a trend), the Fisher test based on the Johansen trace test
supports the hypothesis that the labour share and unemployment are cointegrated, while the Group
rho and Group PP tests do not. The group ADF test supports the hypothesis in the group of
countries with a high degree of bargaining coordination. If the cointegrating relationship is assumed
to contain both a constant and a trend, the hypothesis about the existence of the cointegrating
relationship is supported by the majority of the tests. This result is in accordance with the earlier
result that the labour share can be regarded as a trend stationary I(1) variable. Even though
unemployment can explain movements in the labour share it cannot completely explain the
downward trend which is apparent in the labour share series in many countries. In addition, there is
some more evidence about the existence of the cointegrating relation in the group of countries with
a high degree of bargaining coordination.
15
Table 3. Panel cointegration tests.
All countries
constant constant and trend
Group rho-Statistic 1.29 0.83
Group PP-Statistic 0.82 -1.60+
Group ADF-Statistic -1.00 -5.88***
H0: None 83.74*** 89.79*** Johansen Fisher Statistic from trace test H1: At most 1 5.12 44.63
Countries with a high degree of bargaining coordination
constant constant and trend
Group rho-Statistic -0.19 0.50
Group PP-Statistic -0.63 -1.42+
Group ADF-Statistic -2.22* -4.57***
H0: None 35.90** 40.30*** Johansen Fisher Statistic from trace test H1: At most 1 13.08 19.90
Countries with a relatively low degree of bargaining coordination
constant constant and trend
1.82 0.67
1.58 -0.91
Group rho-Statistic
Group PP-Statistic
Group ADF-Statistic 0.51 -3.86***
H0: None 47.84** 49.49** Johansen Fisher Statistic
from trace test H1: At most 1 32.04 24.73
Notes: Countries with a high degree of bargaining coordination are Austria, Belgium, Denmark, Finland, Germany, Japan, Norway and Sweden, and countries with a relatively low degree of bargaining coordination are Australia, Canada, France, Greece, Ireland, Italy, the Netherlands, New Zealand, Portugal, Spain, the UK and the U. S., respectively.
The group tests by Pedroni (1999) are based on individual Engle-Granger two-step cointegration tests. In the tests the regression equations for the residuals differ. The Group rho –statistics is based on the Phillips and Perron rho-statistic, the Group PP-statistics on the Phillips and Perron t-statistics, and the Group ADF-statistic on the Augmented Dickey-Fuller statistics. The combined statistics is obtained as a group mean. In each test the null hypothesis is no cointegration, which is tested against the hypothesis that at least in some countries the variables are cointegrated.
The Johansen Fisher test statistic is a combination of individual Johansen’s cointegration trace tests. In this case, they are obtained by the estimation of individual two-variable VAR models. The null hypothesis is that there is no cointegrating relation. It is tested against the hypothesis that there is at most one cointegrating relation.
Statistical significance: + p<0.1, * p<0.05, ** p<0.01, *** p<0.001.
These results motivate the estimation of dynamic wage share or wage equations in which wage
curves act as error-correction mechanisms. According to the cointegration tests, the trend-like
decline in the labour share should be controlled for in these equations. In this article this is done by
simply including, in addition to unemployment, time trend as an explanatory variable in the
cointegrating relationship. Ideally, one could use a good indicator for bargaining power as an
16
explanatory variable, but good indicators are not available. Flanagan (1999, p. 1172) has remarked
that union coverage, for example, does not capture bargaining power.
The use of time trend makes the interpretation of the possible causes of the decline difficult, or
impossible. However, it allows one to answer the important question as to whether the labour share
has declined after changes in unemployment have been controlled for. This is one of the basic
questions when the framework utilising the wage curve is used. Furthermore, even though the use
of time trend only allows speculation about the causes of the decline, it enables one to analyse
whether the decline has been different in countries with differing wage-setting institutions.
The basic form of the dynamic equation to be estimated is as follows.
(4) ∆ln(WL/PQ)it = αi - θi ∆ln(U)i,t-1 - λi(ln(WL/PQ) - βiln(U) - γiln(Trend))i,t-1,
αi, βi, γi, θi, λi>0.
Here αi, θi, λi are country-specific short-run parameters, whereas βi and γi are the slope parameters of
the wage curve which defines the long-run equilibrium relationship. When panel data is utilised in
the estimation, various estimators can be utilised. Differing assumptions about the heterogeneity or
homogeneity of the relevant parameters lead to differing estimators.
At the one extreme are dynamic fixed effects (DFE) estimators for which only intercepts αi are
allowed to be different across countries. At the other extreme, separate equations are estimated for
each country and the unweighted means of these regressions coefficients are computed. These are
called Mean-Groups (MG) estimates (Pesaran and Smith, 1995). The pooled Mean Groups (PMG)
estimator (Pesaran et al., 1999) is an intermediate estimator. It allows for short-run parameters (here
αi, θi, λi) to differ across countries (i.e. it allows for short-run cross-country heterogeneity), but
constrains the long-run parameters (here βi and γi) to be homogenous. In what follows, results from
the use of these three types of estimators are presented.
17
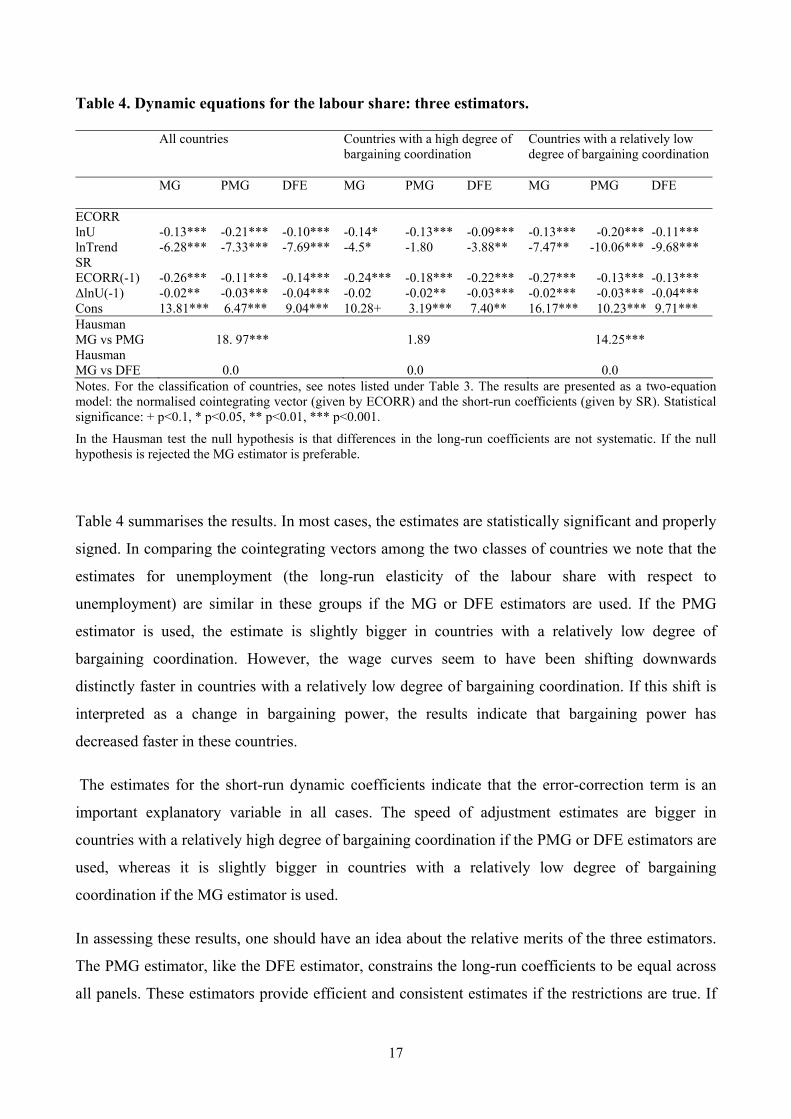
Table 4. Dynamic equations for the labour share: three estimators. All countries Countries with a high degree of
bargaining coordination Countries with a relatively low degree of bargaining coordination
MG PMG DFE MG PMG DFE MG PMG DFE ECORR lnU -0.13*** -0.21*** -0.10*** -0.14* -0.13*** -0.09*** -0.13*** -0.20*** -0.11*** lnTrend -6.28*** -7.33*** -7.69*** -4.5* -1.80 -3.88** -7.47** -10.06*** -9.68*** SR ECORR(-1) -0.26*** -0.11*** -0.14*** -0.24*** -0.18*** -0.22*** -0.27*** -0.13*** -0.13*** ∆lnU(-1) -0.02** -0.03*** -0.04*** -0.02 -0.02** -0.03*** -0.02*** -0.03*** -0.04*** Cons 13.81*** 6.47*** 9.04*** 10.28+ 3.19*** 7.40** 16.17*** 10.23*** 9.71*** Hausman MG vs PMG
18. 97***
1.89
14.25***
Hausman MG vs DFE
0.0
0.0
0.0
Notes. For the classification of countries, see notes listed under Table 3. The results are presented as a two-equation model: the normalised cointegrating vector (given by ECORR) and the short-run coefficients (given by SR). Statistical significance: + p<0.1, * p<0.05, ** p<0.01, *** p<0.001.
In the Hausman test the null hypothesis is that differences in the long-run coefficients are not systematic. If the null hypothesis is rejected the MG estimator is preferable.
Table 4 summarises the results. In most cases, the estimates are statistically significant and properly
signed. In comparing the cointegrating vectors among the two classes of countries we note that the
estimates for unemployment (the long-run elasticity of the labour share with respect to
unemployment) are similar in these groups if the MG or DFE estimators are used. If the PMG
estimator is used, the estimate is slightly bigger in countries with a relatively low degree of
bargaining coordination. However, the wage curves seem to have been shifting downwards
distinctly faster in countries with a relatively low degree of bargaining coordination. If this shift is
interpreted as a change in bargaining power, the results indicate that bargaining power has
decreased faster in these countries.
The estimates for the short-run dynamic coefficients indicate that the error-correction term is an
important explanatory variable in all cases. The speed of adjustment estimates are bigger in
countries with a relatively high degree of bargaining coordination if the PMG or DFE estimators are
used, whereas it is slightly bigger in countries with a relatively low degree of bargaining
coordination if the MG estimator is used.
In assessing these results, one should have an idea about the relative merits of the three estimators.
The PMG estimator, like the DFE estimator, constrains the long-run coefficients to be equal across
all panels. These estimators provide efficient and consistent estimates if the restrictions are true. If
18
the true model is heterogeneous, the PMG and DFE estimates are inconsistent. However, the MG
estimates are consistent in either case. The heterogeneity of the true model can be tested by the
well-known Hausman test. The Hausman test statistics in Table 4 test whether the always consistent
MG estimator is preferable to PMG or DFE estimators. The results indicate that when the total
sample is used, the MG estimator is preferable to the PMG estimator because there are systematic
differences in country-specific long-run coefficients. However, the estimates obtained by the use of
the DFE and MG estimators do not differ systematically. Therefore results obtained by using the
DFE estimator are preferable, because it provides efficient estimates.
For countries with a relatively high degree of bargaining coordination, the estimates obtained by
using the PMG estimator do not differ systematically from the estimates obtained by the use of the
MG estimator. Therefore, the PMG estimator is preferable to the MG estimator. On the other hand,
the DFE estimator is also preferable to the MG one. Therefore the results obtained by the use of the
two efficient and consistent estimators are preferable to the results obtained by using the MG
estimator. For countries with a relatively low degree of bargaining coordination, the results are
identical to the results regarding the whole sample. The DFE estimator is preferable.
Overall, the use of this kind of preference order confirms the above conclusions regarding the long-
run coefficients. The slope coefficients for unemployment are similar in both classes of countries
with the magnitudes of the slopes being about 0.1. Interestingly, Blanchflower and Oswald (1994)
called this number an empirical law of economics. As regards the long-run coefficients, the second
main finding was that wage curves have shifted downward faster in countries with a relatively low
degree of bargaining coordination.
If the results provided by the use of the DFE estimator are also used in the characterisation of the
short run-coefficients, the main conclusion is that the speed of adjustment of the labour share to
deviations from the long run is somewhat faster in countries with a relatively high degree of
bargaining coordination. This supports the view that in coordinated wage negotiations the state of
the whole economy can be taken into account better than in negotiations which are less coordinated.
However, it seems that the results from the econometric analysis are not robust to some changes in
the classification of the countries to the two groups. If the classification is changed so that some of
the countries classified as countries with a relatively low degree of bargaining coordination are
reclassified as being countries with a relatively high degree of bargaining coordination, the above
19
results regarding the speed of adjustment may change.1 It should be remembered that the
classification of some countries may have changed during the time period under consideration.
Therefore, strong conclusions regarding the relative importance of wage-setting institutions as the
determinants of the labour share cannot be drawn on the basis of the econometric analysis.
5. WAGE CURVE OR PHILLIPS CURVE?
This study has been based on the assumption that for both countries with a relatively high degree of
bargaining coordination and countries with a relatively low degree of bargaining coordination the
use of the framework which utilises the wage curve as the central analytical tool is expedient. Even
though the results of the unit root and cointegration tests were not fully unambiguous, they did not
give compelling reasons not to utilise the framework. The results reported in Table 4 also support
the use of the framework. The error-correction term is an important explanatory variable in every
regression equation.
Anyhow, as the unit root tests showed, unemployment may be a stationary variable, at least in the
case of some countries. For those countries the use of the Phillips curve instead of the wage curve
may be preferable. In this study the rough division of twenty OECD countries into two groups did
not classify the countries into those for which the wage curve is preferable and into those for which
the Phillips curve is preferable. In principle, one could expect that when bargaining is completely
uncoordinated or decentralised, the whole macroeconomic situation of the economy (depicted, for
example, by points A, B and C in Figure 1) does not affect wage dynamics, but the tightness of the
labour market does. In that case, the Phillips curve would be preferable.2 According to the results of
this study, the adjustment of the labour share to deviations from the wage curve was slower in
countries with a relatively low degree of bargaining coordination but, still, the wage curve acted as
an error-correction mechanism.
In this paper, two country groups and not individual countries have been the object of the
investigation. Yet there are some comparative studies which are useful in the interpretation of the
1 The results from the robustness checks are available upon request. 2 It is therefore not surprising that in countries where bargaining over wages has traditionally been decentralised the estimation of Phillips curves has been the dominant way of modelling wage dynamics. The U.S may be the best example. According to Blanchard and Katz (1999), for example, the Phillips curve is supported by macrodata in the U.S. while dynamic wage equations containing error-correction mechanisms are supported in Europe. They regard the greater role of trade unions in Europe as a major cause of the difference (for a discussion, see also Montuenga-Gómez and Parreño, 2005).
20
results obtained in this study and which are based on the estimation of individual country wage
equations. In the OECD (1997) wage equations for twenty-one OECD countries were estimated (in
addition to the countries in this article Switzerland was included). For seven countries (Canada, the
U.S., Australia, Greece, Ireland, Portugal, and Switzerland) Phillips curve specifications were
reported. Six of these countries also belong to the group of countries which in this article were
classified as countries with a relatively low degree of bargaining coordination. For the rest, the
specifications included error-correction terms, but they were not defined by a wage curve but by a
labour share target represented by a constant.
In Drèze and Bean (1990, Table 1.4, pp. 24-25) wage equations for eleven European countries and
the United States were estimated. With the exception of France, they embody wage curves as error-
correction terms. That kind of wage equation was also estimated for the U.S., but Drèze and Bean
add that in contrast to the U. S., wage formation in Europe is dominated by trade unions which are
concerned about distributional fairness. In a number of studies the difference between Europe and
the U.S. is highlighted even though, for example, the originators of the wage curve, Blanchflower
and Oswald (1994, 2005), maintain that the wage curve is also valid in the U.S. The data they use is
not, however, aggregative time series data but regional data (for a survey of wage curve studies, see
Nijkamp and Poot, 2005).
Overall, even though there is evidence that in countries with a relatively low degree of bargaining
coordination wage inflation is best represented by Phillips curves, and in countries with a relatively
high degree of bargaining coordination inflation is best represented by dynamic equations in which
the wage curve defines the error correction mechanism, that evidence is not yet overwhelming.
Furthermore, finding strong evidence for such conclusions by the use of cross-country panel data
may be very difficult. The reliability of the statistical tests requires that the number of countries
should be large, and wage-setting institutions in various countries should remain relatively stable
over time in order to make the classification of countries possible. Drastic changes make statistical
analysis difficult.
6. CONCLUSIONS
The report by the OECD (OECD, 2004) summarised its main findings regarding the relationship
between the labour share and unemployment as follows (2004, p. 129; italics in the report). ‘The
evolution of aggregate wages suggests a trend towards wage moderation in the majority of OECD
21
member countries since the end of the 1970s, as reflected in a deceleration of nominal wage
inflation and declines in the wage share of total income generated in the business sector. However,
it is unclear whether there has been a correspondingly broad trend towards reduced upward pressure
on the level of real wages relative to productivity, at an unchanged rate of unemployment, which
theoretical arguments identify as the most relevant measure of wage restraint.’
According to the results presented in this paper, it is clear that there has been a trend-like decline in
the labour share in most major OECD countries at an unchanged rate of unemployment. With a
given level of unemployment, the labour share is nowadays lower than before. The interpretation of
this kind of decline is not straightforward, but it is highly likely due, at least partly, to the weakened
bargaining power of labour. Furthermore, in comparison to countries with a relatively high degree
of bargaining coordination, the decline seems to have been more pronounced in countries with a
relatively low degree of bargaining coordination. It is logical to think that, in countries with a high
degree of bargaining coordination, labour is more powerful than in countries with a relatively low
degree of bargaining coordination. The results support the interpretation that, even though labour
has also lost its bargaining power in countries with a relatively strong trade union movement,
weakening has not been so drastic as in countries where labour has traditionally been relatively
weak.
The results also indicate that, in countries with a relatively high degree of pay negotiation
coordination, the speed of adjustment of the labour share (and real wages) to macroeconomic
disturbances which affect the functional distribution of income and unemployment is faster than in
countries with a relatively low degree of bargaining coordination. When wage negotiations are
coordinated, the situation of the whole economy can be taken into account better than in less
coordinated negotiations. Yet, even in countries with a relative low degree of bargaining
coordination the state of the whole economy can be taken into account.
However, the conclusions regarding behavioural differences in the two country groups are not
robust to some changes in the classification of the countries into the two groups. If the classification
is changed, the results may also change. It should be remembered that it is not straightforward to
classify a country as being permanently a country with a relatively high or low degree of bargaining
coordination. When wage-setting institutions change, the classification may change. This aspect
was not taken into account in the econometric analysis conducted in this study.
22
Even though some of the results of this study were not very affirmative, they suggest that, also in
theoretical analyses, it may be useful to differentiate models according to wage-setting institutions.
This applies to both mainstream and heterodox traditions. The target real wage or labour share
models are likely to be best suited for the description of wage and labour share determination within
the institutional setting which is based on a relatively high degree of bargaining coordination, while
models embodying Phillips curves may be better in the description of wage and labour share
dynamics in countries with a relatively low degree of negotiation coordination. In this paper this
hypothesis could not be verified or falsified, and it is therefore one area in need of further
investigation.
In the 1970s Francis Cripps (Cripps, 1977) summarised his critique of the Phillips curve as follows
(1977, p. 110): ‘The institutional evidence and supporting econometric studies are by now sufficient
to demonstrate that the Phillips curve, whether in its original or in its new form, and the associated
postulate that money wages are determined by atomistic competition in the labour market, are
incomplete and misleading in modern conditions.’ The institutional and econometric evidence
Cripps was referring to was about the UK. The evidence which has accumulated over thirty years
supports a more nuanced modern interpretation.
BIBLIOGRAPHY
Aidt, T. and Tzannatos, Z. 2002. Unions and Collective Bargaining, The World Bank, Washington,
D.C.
Arestis, P. 1986. Wages and prices in the UK: the Post Keynesian view, Journal of Post Keynesian
Economics, vol. 8, no.3, 339-358.
Arpaia, A., Pérez, E. and Pichelman, K. 2009. ‘Understanding Labour Income Share Dynamics in
Europe’, European Economy, Economic Papers 379, European Commission, Brussels.
Baltagi, B. D. Econometric Analysis of Panel Data, fourth edition, Chichester, John Wiley & Sons.
Bentolila, S. and Saint-Paul, G. 2003. Explaining movements in the labour share, Contributions to
Macroeconomics, vol. 3, no. 11, Article 9, 1-31.
Blanchard, O. 1986. The wage-price spiral, Quarterly Journal of Economics, vol. 101, no.3, 543-
565.
Blanchard, O. and Katz, L. F. 1999. Wage dynamics: reconciling theory and evidence, American
Economic Review, vol. 89, no. 2, 69-74.
23
Blanchflower, D. G. and A. J. Oswald 1994. The Wage Curve, Cambridge, Massachusetts, MIT
Press.
Blanchflower, D. G. and A. J. Oswald 2005. ‘The Wage Curve Reloaded’, NBER Working Paper
No. 11338.
Broer, D. P., Draper, D. A. G. and Huizinga, F. H. 2000. The equilibrium rate of unemployment in
the Netherlands, De Economist, vol. 148, no. 3, 345-371.
Burda, M. and Wyplosz, C. 2001. Macroeconomics: A European Text, Oxford, Oxford University
Press.
Cassetti, M. 2003. Bargaining power, effective demand and technical progress: a Kaleckian model
of growth, Cambridge Journal of Economics, vol. 27, no. 3, 449-464.
Choi, I. 2001. Unit root tests for panel data, Journal of International Money and Finance, vol. 20
no. 2, 249-272.
Choi, M. 2001. ‘Threat Effect of Foreign Direct Investment on Labor Union Wage Premium’, PERI
Working Paper Series 27, Massachusetts Amherst.
Cripps, F. 1977. The money supply, wages and inflation, Cambridge Journal of Economics, vol. 1,
no. 1, 101-112.
Cripps, F. and Godley, W. 1976. A formal analysis of the Cambridge Economic Policy Group
Model, Economica, vol. 43, no. 172, 335-348.
Dalziel, P. C. 1990. Market power, inflation, and incomes policies, Journal of Post Keynesian
Economics, vol. 12, no. 3, 424-538.
Draper, N. and Huizinga, F. 2000. ELIS: Equilibrium Labour Income Share, De Economist, vol.
148, no. 5, 671 – 684.
Dreze, J. and Bean, C. R. (eds.) 1990. Europe’s Unemployment Problem, Cambridge,
Massachusetts, The MIT Press.
Dutt, A. K. 1992. Conflict inflation, distribution, cyclical accumulation and crises, European
Journal of Political Economy, vol. 8, 579-597.
European Commission 2007. Employment in Europe 2007, European Commission, Brussels.
Flanagan, R. J. 1999. Macroeconomic performance and collective bargaining: an international
perspective, Journal of Economic Literature, Vol. XXXVII, no. 3, 1150-1175.
Godley, W. and Lavoie, M. 2007. Monetary Economics: An integrated Approach to Credit, Money,
Income, Production and Wealth, New York, Palgrave Macmillan.
24
Harrison, A. E. 2002. ‘Has Globalisation Eroded Labor’s Share?’ Some Cross-Country Evidence,
mimeo, University of California Berkeley.
Im, K. S., Pesaran, M. H. and Shin, Y. 2003. Testing for unit roots in heterogeneous panels, Journal
of Econometrics, vol. 115, no. 1, 53-74.
ILO 2008A. Global Wage Report 2008/09, ILO, Geneva.
ILO 2008B. World of Work Report 2008. ILO, Geneva.
ILO 2010. Global Wage Report 2010/11, ILO, Geneva.
IMF 2007. World Economic Outlook, IMF, Washington, DC.
Jayadev, A. 2007. Capital account openness and the labour share of income, Cambridge Journal of
Economics, vol. 31, no. 3, 423-443.
Lavoie, M. 1992. Foundations of Post-Keynesian Economic Analysis, Edward Elgar, Aldershot.
Layard, R., Nickell, S. J. and Jackman, R. 1991. Unemployment: Macroeconomic Performance and
the Labour Market, Oxford, Oxford University Press.
Maddala, G. S. and Wu, S. 1999. A comparative study of unit root tests with panel data and a new
simple test, Oxford Bulletin of Economics and Statistics, vol. 61, 631-652.
Montuenga-Gómez, V. M. and Parreño, J. M. 2005. Reconciling the wage curve and the Phillips
curve, Journal of Economic Surveys, vol. 19, no.5, 735-765.
Nijkamp, P. and J. Poot (2005), The last word on the wage curve. Journal of Economic Surveys,
vol. 19, no.3, 421-450.
Nymoen, R. and Rødseth, A. 2003. Explaining unemployment: some lessons from Nordic wage
formation, Labour Economics, vol. 10, no. 1, 1-29.
OECD 1997. OECD Employment Outlook, OECD, Paris.
OECD 2004. OECD Employment Outlook, OECD, Paris.
OECD 2007. OECD Employment Outlook, OECD, Paris.
Onaran, Ö. 2009. Wage share, globalization and crisis: the case of the manufacturing industry in
Korea, Mexico and Turkey, International Review of Applied Economics, vol. 23, no. 2, 112-134.
Pedroni, P. 1999. Critical values for cointegration tests in heterogeneous panels with multiple
regressors, Oxford Bulletin of Economics and Statistics, vol. 61, 653-670.
Rowthorn, R. E. 1977. Conflict, inflation and money. Cambridge Journal of Economics, vol. 1, no.
3, 215-239.
25
Rowthorn, R. E. 1999A. Unemployment, wage bargaining and capital-labour substitution,
Cambridge Journal of Economics, vol. 23, no. 3, 413-423.
Rowthorn, R. E. 1999B. ‘Unemployment, Capital-Labor Substitution, and Economic Growth’, IMF
Working Paper 43, Washington, DC.
Sargan, J. D. 1964. Wages and prices in the United Kingdom: a study in econometric methodology,
in Hart, P.E., Mills, G. and Whitaker, J.K. (eds), Econometric Analysis for National Economic
Planning, London, Butterworths.
Sawyer, M. C. 1982. Macroeconomics in Question: The Keynesian-Monetarist Orthodoxies and the
Kaleckian Alternative, Brighton, Wheatsheaf Books Ltd.
Stockhammer, E. 2009. ‘Determinants of Functional Income Distribution in OECD Countries’,
IMK Studies 5/2009. Düsseldorf.
Stockhammer, E. and Klär, E. 2011. Capital accumulation, labour market institutions and
unemployment in the medium run, Cambridge Journal of Economics, vol. 35, no. 2, 437-457.
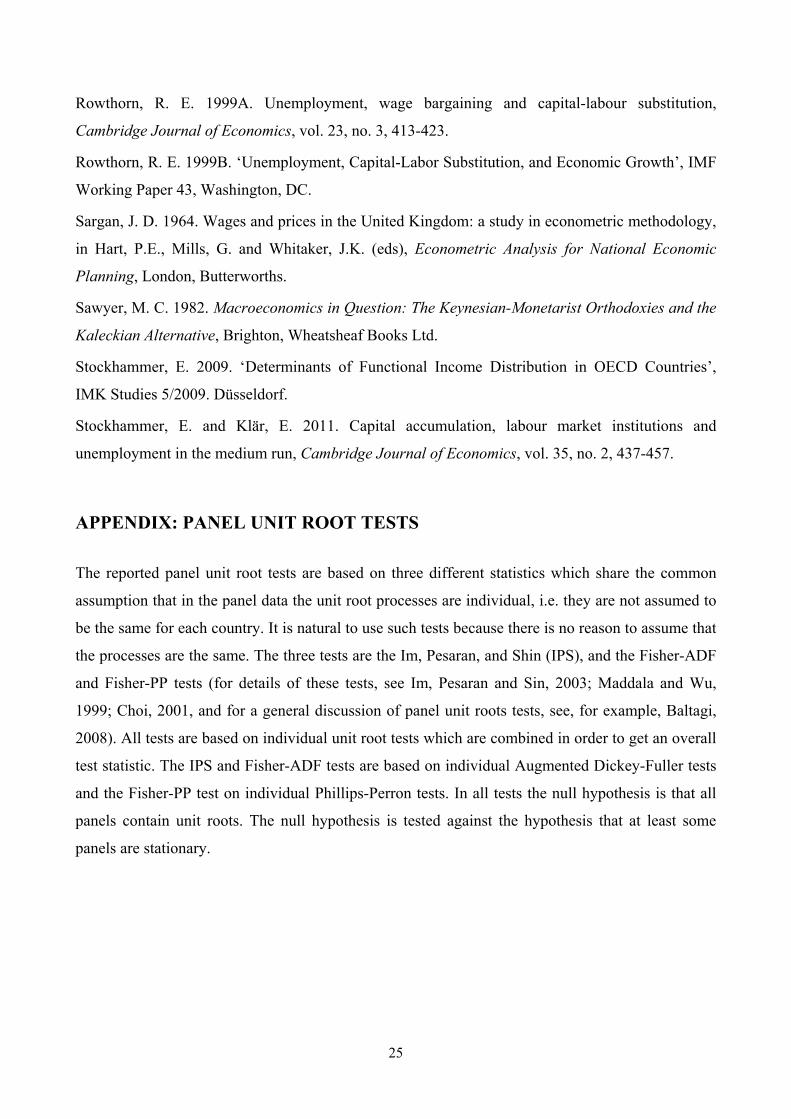
APPENDIX: PANEL UNIT ROOT TESTS
The reported panel unit root tests are based on three different statistics which share the common
assumption that in the panel data the unit root processes are individual, i.e. they are not assumed to
be the same for each country. It is natural to use such tests because there is no reason to assume that
the processes are the same. The three tests are the Im, Pesaran, and Shin (IPS), and the Fisher-ADF
and Fisher-PP tests (for details of these tests, see Im, Pesaran and Sin, 2003; Maddala and Wu,
1999; Choi, 2001, and for a general discussion of panel unit roots tests, see, for example, Baltagi,
2008). All tests are based on individual unit root tests which are combined in order to get an overall
test statistic. The IPS and Fisher-ADF tests are based on individual Augmented Dickey-Fuller tests
and the Fisher-PP test on individual Phillips-Perron tests. In all tests the null hypothesis is that all
panels contain unit roots. The null hypothesis is tested against the hypothesis that at least some
panels are stationary.
26
Table A1. Panel unit roots tests: the labour share. All countries lnws ∆lnws constant constant & trend none constant IPS -0.65 -3.68*** -14.64*** ADF-Fisher 41.90 71.44** 500.5*** 279.72*** PP-Fisher 37.3 49.0 473.6*** 351.77*** Countries with a high degree of bargaining coordination lnws ∆lnws constant constant & trend none constant IPS -0.70 -2.712** -10.87*** ADF-Fisher 19.49 30.78* 191.37*** 131.65*** PP-Fisher 20.83 24.33+ 187.72*** 144.35*** Countries with a relatively low degree of bargaining coordination lnws ∆lnws constant constant & trend none constant IPS -0.26 -2.50** -14.30*** ADF-Fisher 22.40 40.65* 309.13*** 215.99*** PP-Fisher 16.48 24.66 285.91*** 207.42***
Notes: Countries with a high degree of bargaining coordination are Austria, Belgium, Denmark, Finland, Germany, Japan, Norway and Sweden, and countries with a relatively low degree of bargaining coordination are Australia, Canada, France, Greece, Ireland, Italy, Netherlands, New Zealand, Portugal, Spain, the UK and the U.S., respectively.
Test statistics have been computed both for levels and first differences. Individual equations for levels have contained either a constant or a constant and a trend. Equations for first differences have had at most a constant. Statistical significance: + p<0.1, * p<0.05, ** p<0.01, *** p<0.001.
27
Table A2. Panel unit root tests: unemployment. All countries lnu ∆lnu constant constant & trend none constant IPS -4.56*** -0.98 -12.78*** ADF-Fisher 83.67*** 51.14 356.27*** 240.87*** PP-Fisher 87.70*** 29.16 352.48*** 233.64*** Countries with a high degree of bargaining coordination lnu ∆lnu constant constant & trend none constant IPS -3.08*** -2.49** -7.85*** ADF-Fisher 36.48** 31.05* 138.91*** 95.02*** PP-Fisher 49.48*** 16.60 130.85*** 86.50*** Countries with a relatively low degree of bargaining coordination lnu ∆lnu constant constant & trend none constant IPS -3.36*** 0.82 -10.08*** ADF-Fisher 47.18** 20.10 217.36*** 145.85*** PP-Fisher 38.22* 12.56 221.63*** 147.14***
Note: See notes in Table A1.