Embed Size (px)
Citation preview
Department of Transportation and Communications
The Development of Public Transportation Strategic Plan for Metro Cebu
28 October 2011
Prepared by:
DESIGN SCIENCE INC. BT & T Center, # 20 E. Rodriquez Jr. Ave.,
Libis, Quezon City In association with
RENARDET S.A. CONSULTING ENGINEERS
Rm. 2315 City land 10 Tower 1
H.V. de La Costa St. corner Ayala Ave., Makati City
Volume 1: EXECUTIVE SUMMARY
FINAL REPORT
Department of Transportation and Communications
Final Report
The Development of Public Transportation Strategic Plan for Metro Cebu
Volume 1: EXECUTIVE SUMMARY 28 October 2011 Prepared by: DESIGN SCIENCE INC. BT & T Center, # 20 E. Rodriquez Jr. Ave., Libis, Quezon City In association with RENARDET S.A. CONSULTING ENGINEERS Rm. 2315 City land 10 Tower 1 H.V. de La Costa St. corner Ayala Ave., Makati City
Prepared for: The Department of Transportation and Communications The Columbia Tower, Ortigas Avenue, Brgy. Wack-Wack, Mandaluyong City Trunkline: (632) 727-7960 2011 © Copyright DOTC

i
Table of Contents No. Page No.
1.0 INTRODUCTION 1 2.0 STUDY METHODOLOGY 2 3.0 EXISTING PUBLIC TRANSPORT SITUATION IN THE STUDY AREA 3 3.1 Public Transport Surveys (PT) 3 3.2 Current PT Operating Characteristics 4 4.0 MEDIUM TO HIGH CAPACITY TRANSIT SYSTEM 6 5.0 SELECTION OF TRANSIT CORRIDORS 11 6.0 BACKBONE TRANSIT LINE EVALUATION 14 7.0 METRO CEBU PUBLIC TRANSPORT STRATEGIC PLAN 15 8.0 PRE-FEASIBILITY STUDY OF TOP TWO PROJECTS 18 8.1 BRT Line 18 8.2 Express Bus Services 22 9.0 FINANCING SCHEME 25 9.1 Introduction 25 9.2 Alternative Financing Schemes 25 9.3 Rationale 25 9.4 Legal Basis 26 10.0 ENVIRONMENTAL CONSIDERATIONS 27 10.1 Environmental Concern 27 10.2 Description of Project 27 10.3 Environmental Management and Monitoring Plan 27 10.4 Preliminary Environmental Analysis 34 11.0 INSTITUTIONAL FRAMEWORK 37 11.1 Institutional Framework 37 12.0 SKETCH PLANNING MANUAL 39 13.0 CAPACITY BUILDING PROGRAM 40

ii
List of Tables No. Page No.
6.1 Evaluation Criteria for Selecting the Best Transit Backbone Scenario 14 7.1 Metro Cebu Public Transportation Strategic Plan 16 8.1 Economic Analysis Result of the Proposed BRT Line 21 8.2.1 Economic Feasibility Analysis Result: Express Bus Services 24 8.2.2 Financial Feasibility Analysis Result: Express Bus Services 24 10.1 Environmental Management and the Environmental Monitoring Plan 28
List of Figures No. Page No.
2.1 Flow Chart of Methodology 2 4.1 Passenger Volume along Major Public Transport Corridors 7 4.2 Metro Cebu Public Transport Desire Lines 8 4.3 Alternative Medium to High Capacity Transit Corridors 10 5.1 Daily Boarding Passengers 11 5.2 Passengers per Hour per Direction at Maximum Load Point 12 5.3 Buses per Peak Hour per Direction at Maximum Load Point 12 5.4 Medium to High Capacity Transit Line Scenarios 13 8.1 Alignments of Backbone Transit Lines 19 8.2 Study Team’s Conceptual Plan of a BRT Station 20 8.3 Trans-Milenio Bus Station, Bogota, Colombia 20 8.2-1 Typical Bus Stops 23 8.4 Sample BRT Control System 21 8.2-1 Typical Bus Stops 22

iii
Acronyms
ASC - Area Survey Coordinators ASGRs - Annual Average Growth Rates BAS - Boarding and Alighting Survey CA - Category Analysis CBD - Cebu Business District CLUP - Comprehensive Land Use Plan CPA - Cebu Port Authority CPDO - City Planning and Development Officer DOTC - Department of Transportation and Communications GAD - Gender and Development HIS - Household Interview Survey HIS-OC - HIS Overall Coordinator HOV - High Occupancy Vehicle LGU - Local Government Unit LOS - Level of Service LOV - Low Occupancy Vehicle LPO - Local Planning Officers MCA - Multi-Criteria Analysis MCIAA - Mactan Cebu International Airport Authority MCLUTS - Metro Cebu Land Use and Transportation Study (MCLUTS) MPDO - Municipal Planning and Development Officer NBT - North Bus Terminal NCT - North Consolidated Terminal O&M - Operation and Maintenance OD - Origin Destination PPHPD - Per Peak Hour Per Direction PPP - Public-Private Partnership PT - Public Transport PUB - Public Utility Bus PUJ - Public Utility Jeepney QOL - Quality of Life ROW - Right-of-Way SBT - South Bus Terminal SRP - South Reclamation Project TEA - Transport Expenditure Assumption TOR - Terms of Reference
MAIN REPORT
Volume 1: Executive Summary 1
Study on the Development of a Public Transportation Strategic Plan for Metro Cebu Final Report
1.0 Introduction
This study was undertaken by this Consultant for the Department of Transportation and Communications (DOTC). Its main objective is to prepare a public transportation strategic plan for Metro Cebu. Specific objectives are as follows: • Identify the traffic corridors where promotion and development of public transportation
would effectively relieve the increasing traffic congestion and air pollution; • Establish and provide short, medium and long term directions and strategies for the
development and promotion of public transportation; • Develop a shopping list or portfolio of potential investment programs and projects for
the short, medium and long term planning horizons; • Identify high priority projects that may be undertaken DOTC and other agencies and
interested stakeholders; • Identify and select high priority programs and projects and establish their viability for
immediate implementation; and • Develop sketch planning methodology and tools for use of DOTC in updating the public
transportation plan in the future as may be needed. Public transportation is a subsystem of the overall transportation system. It refers to carrier services that transport people and goods for a fee. In this study, focus has been made on public transport services for passengers. Since public transport services are patronized by majority of travelers, their improvement will have a big impact on the improvement of the overall transport system. This study area, per agreement with the DOTC, is composed of the following cities and municipalities:
Cebu City
Mandaue City
Lapulapu City
Cordova
Talisay City
Consolacion
Liloan
Compostela
Danao City
Minglanilla
Naga
San Fernando
Carcar City

Volume 1: Executive Summary 2
Study on the Development of a Public Transportation Strategic Plan for Metro Cebu Final Report
2.0 Study Methodology The methodology used in the study followed the standard transport planning process as shown in Figure 2.1 below.
Figure 2.1: Flow Chart of Methodology
Volume 1: Executive Summary 3
Study on the Development of a Public Transportation Strategic Plan for Metro Cebu Final Report
3.0 Existing Public Transport Situation in the Study Area
3.1 Public Transport Surveys (PT)
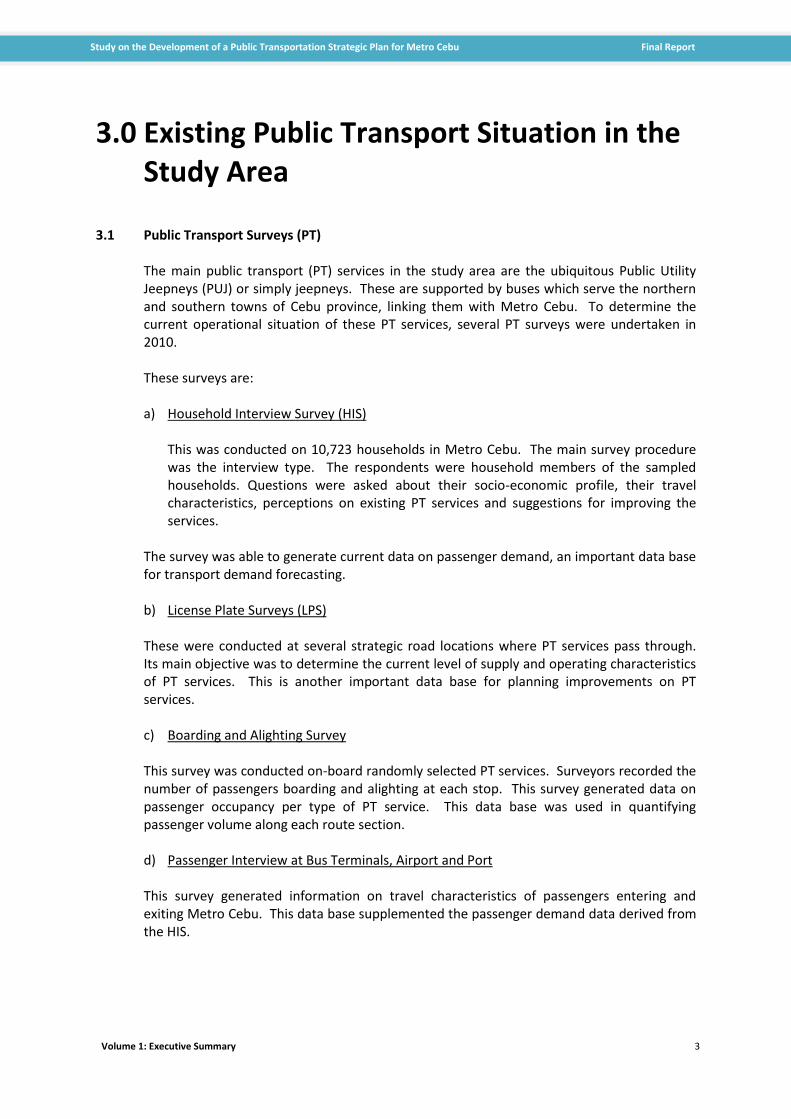
The main public transport (PT) services in the study area are the ubiquitous Public Utility Jeepneys (PUJ) or simply jeepneys. These are supported by buses which serve the northern and southern towns of Cebu province, linking them with Metro Cebu. To determine the current operational situation of these PT services, several PT surveys were undertaken in 2010. These surveys are: a) Household Interview Survey (HIS) This was conducted on 10,723 households in Metro Cebu. The main survey procedure
was the interview type. The respondents were household members of the sampled households. Questions were asked about their socio-economic profile, their travel characteristics, perceptions on existing PT services and suggestions for improving the services.
The survey was able to generate current data on passenger demand, an important data base for transport demand forecasting. b) License Plate Surveys (LPS) These were conducted at several strategic road locations where PT services pass through. Its main objective was to determine the current level of supply and operating characteristics of PT services. This is another important data base for planning improvements on PT services. c) Boarding and Alighting Survey This survey was conducted on-board randomly selected PT services. Surveyors recorded the number of passengers boarding and alighting at each stop. This survey generated data on passenger occupancy per type of PT service. This data base was used in quantifying passenger volume along each route section. d) Passenger Interview at Bus Terminals, Airport and Port This survey generated information on travel characteristics of passengers entering and exiting Metro Cebu. This data base supplemented the passenger demand data derived from the HIS.

Volume 1: Executive Summary 4
Study on the Development of a Public Transportation Strategic Plan for Metro Cebu Final Report
e) Roadside Traffic Count This survey was undertaken at selected locations along Metro Cebu’s main roads. The data were used in calibrating the transport demand model, which was used as a traffic forecasting tool. f) PT Drivers’ Interview Public utility drivers were interviewed at major PT terminals. The purpose of the survey was to gather basic information on PT operating characteristics. g) Travel Time Survey The survey measured actual travel time along main PT corridors. Data were used to estimate travel speeds of current PT services. h) Road Inventory Survey This survey determined the basic physical structure of roads where PT services operate, particularly road width and number of lanes.
3.2 Current PT Operating Characteristics
Current PT services serving Metro Cebu can be categorized as follows:
a) PUJ services within Cebu City b) PUJ services between Cebu City and neighboring cities c) PUJ services within Mactan Island d) PUJ services between Cebu City and the rest of Metro Cebu e) Bus services between Cebu City and some Metro Cebu cities f) Bus services between Metro Cebu and the rest of Cebu province g) VHire services between Metro Cebu and the rest of Cebu province Of the above routes, PUJs dominate with a total of 147 routes with about 9,400 units operating in any given day. Out of 147 routes, 126 are operating within what can be called as the core urban area of Metro Cebu which is composed of the cities of Cebu, Mandaue, Lapulapu, and Talisay. The rest are operating between this core urban area and the rest of Metro Cebu. PUJ route alignments are in accordance with route descriptions prescribed by CITOM. In terms of service areas these routes generally cover the main roads linking outer areas with Cebu City’s downtown area and the main urban roads with high urban activities. In terms of level of supply, many routes have an oversupply of operating units as indicated by low load factors and low number of round trips. Average travel speed of PUJs within the core urban area is 16 kph. Several routes are duplicating other routes. They usually sport different route codes but they have practically the same route coverage. There are also routes which sport one code number but they have different route coverage.
Volume 1: Executive Summary 5
Study on the Development of a Public Transportation Strategic Plan for Metro Cebu Final Report
PUJ routes have varying body types and sizes with seating capacities ranging from 10 to 20 or above. Vehicles with smaller bodies are not comfortable to passengers. Most of the vehicles are diesel-fed, with a high air pollution level. There are four (4) bus routes between south Metro Cebu (i.e Carcar, Naga, San Fernando, Minglanilla) and Cebu City. PUB as well as VHire services link Cebu City with the rest of Cebu Province.
Volume 1: Executive Summary 6
Study on the Development of a Public Transportation Strategic Plan for Metro Cebu Final Report
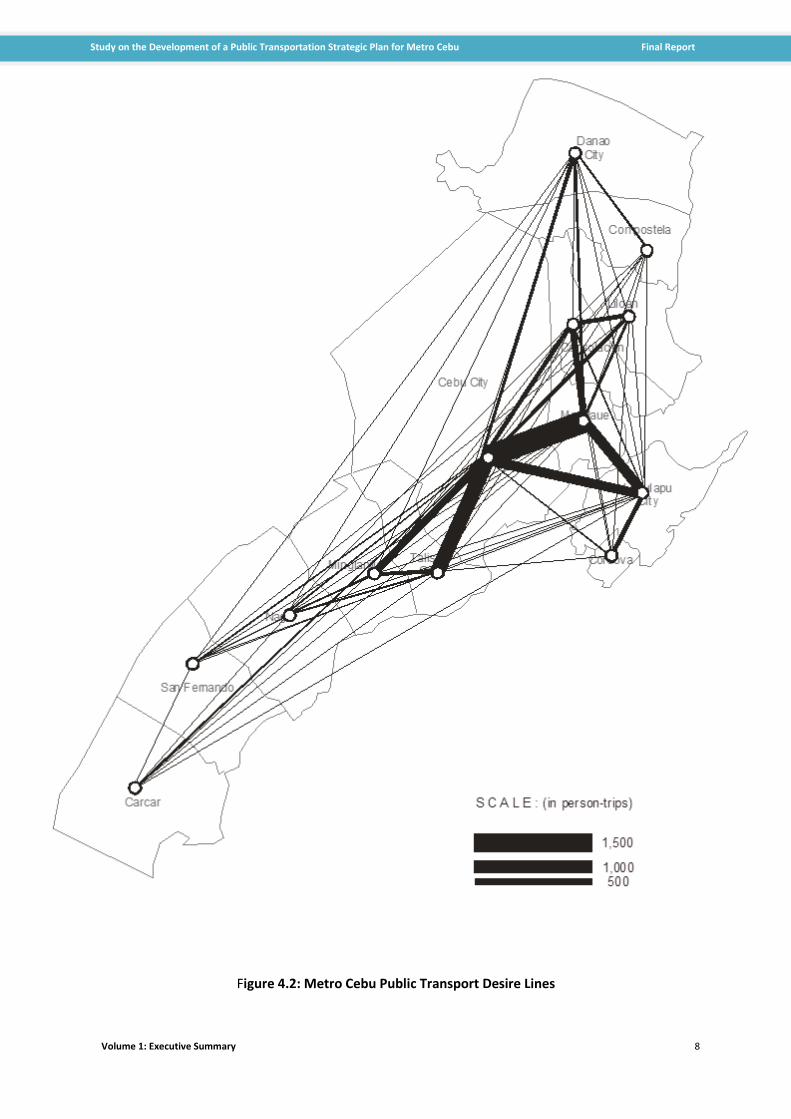
4 Medium to High Capacity Transit System A PT strategic plan shall consist of a hierarchy of services, with each type of service serving an area and the corresponding passenger demand. The backbone of the PT system shall be served by a transit line with medium to high capacity level. A bus is an example of a medium capacity transit while a railway service or bus on exclusive right of way are examples of a high capacity transit service. In urban areas, it is important to identify this backbone where other modes, usually low capacity modes, connect. Possible roads where backbone transit lines will operate were indentified based on: (a) passenger volume, (b) connecting major urban activity centers, (c) road capacity, (d) proposed major land use development, (e) arterial function to serve long distance travel, )f) concept plan for a demonstration high capacity system. In addition to these, passenger OD patterns were also considered. See Figure 4.1 for passenger volume data along major roads and Figure 4.2 for the passenger OD desire lines.

Volume 1: Executive Summary 7
Study on the Development of a Public Transportation Strategic Plan for Metro Cebu Final Report
Figure 4.1: Passenger Volume along Major Public Transport Corridors
60,000
30,0001,500
S C A L E : (ave. daily pax volume)
Volume 1: Executive Summary 8
Study on the Development of a Public Transportation Strategic Plan for Metro Cebu Final Report
Figure 4.2: Metro Cebu Public Transport Desire Lines
Volume 1: Executive Summary 9
Study on the Development of a Public Transportation Strategic Plan for Metro Cebu Final Report
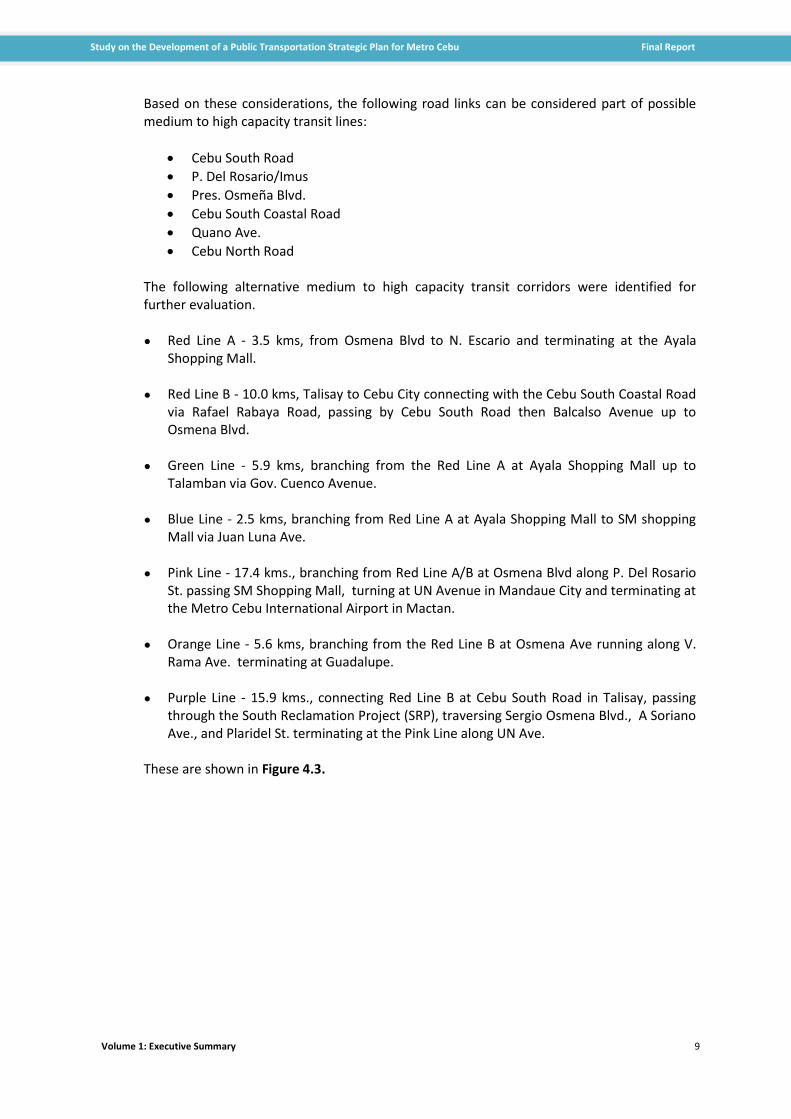
Based on these considerations, the following road links can be considered part of possible medium to high capacity transit lines:
Cebu South Road
P. Del Rosario/Imus
Pres. Osmeña Blvd.
Cebu South Coastal Road
Quano Ave.
Cebu North Road The following alternative medium to high capacity transit corridors were identified for further evaluation.
● Red Line A - 3.5 kms, from Osmena Blvd to N. Escario and terminating at the Ayala
Shopping Mall. ● Red Line B - 10.0 kms, Talisay to Cebu City connecting with the Cebu South Coastal Road
via Rafael Rabaya Road, passing by Cebu South Road then Balcalso Avenue up to Osmena Blvd.
● Green Line - 5.9 kms, branching from the Red Line A at Ayala Shopping Mall up to
Talamban via Gov. Cuenco Avenue. ● Blue Line - 2.5 kms, branching from Red Line A at Ayala Shopping Mall to SM shopping
Mall via Juan Luna Ave. ● Pink Line - 17.4 kms., branching from Red Line A/B at Osmena Blvd along P. Del Rosario
St. passing SM Shopping Mall, turning at UN Avenue in Mandaue City and terminating at the Metro Cebu International Airport in Mactan.
● Orange Line - 5.6 kms, branching from the Red Line B at Osmena Ave running along V.
Rama Ave. terminating at Guadalupe. ● Purple Line - 15.9 kms., connecting Red Line B at Cebu South Road in Talisay, passing
through the South Reclamation Project (SRP), traversing Sergio Osmena Blvd., A Soriano Ave., and Plaridel St. terminating at the Pink Line along UN Ave.
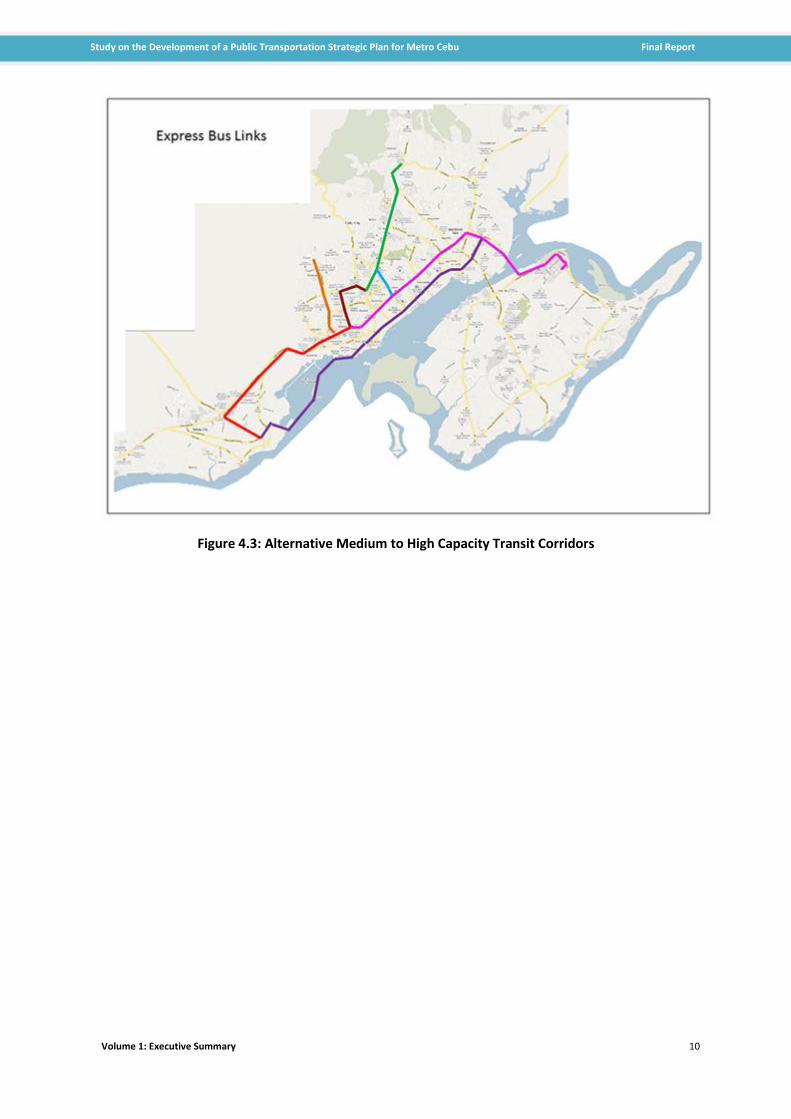
These are shown in Figure 4.3.
Volume 1: Executive Summary 10
Study on the Development of a Public Transportation Strategic Plan for Metro Cebu Final Report
Figure 4.3: Alternative Medium to High Capacity Transit Corridors

Volume 1: Executive Summary 11
Study on the Development of a Public Transportation Strategic Plan for Metro Cebu Final Report
5 Selection of Transit Corridors The alternative medium to high capacity transit corridors were subjected to a selection process which initially considered the forecast of future passenger volume ridership. The forecasting process used a transport demand model, called the JICA STRADA software, a computer based urban transport planning tool. In calibrating the model for transport demand forecasting purposes, data from the following surveys were used:
Household Interview Survey
Passenger Interview Survey
Passenger Occupancy and Vehicle Counts
Public Transport Route Surveys
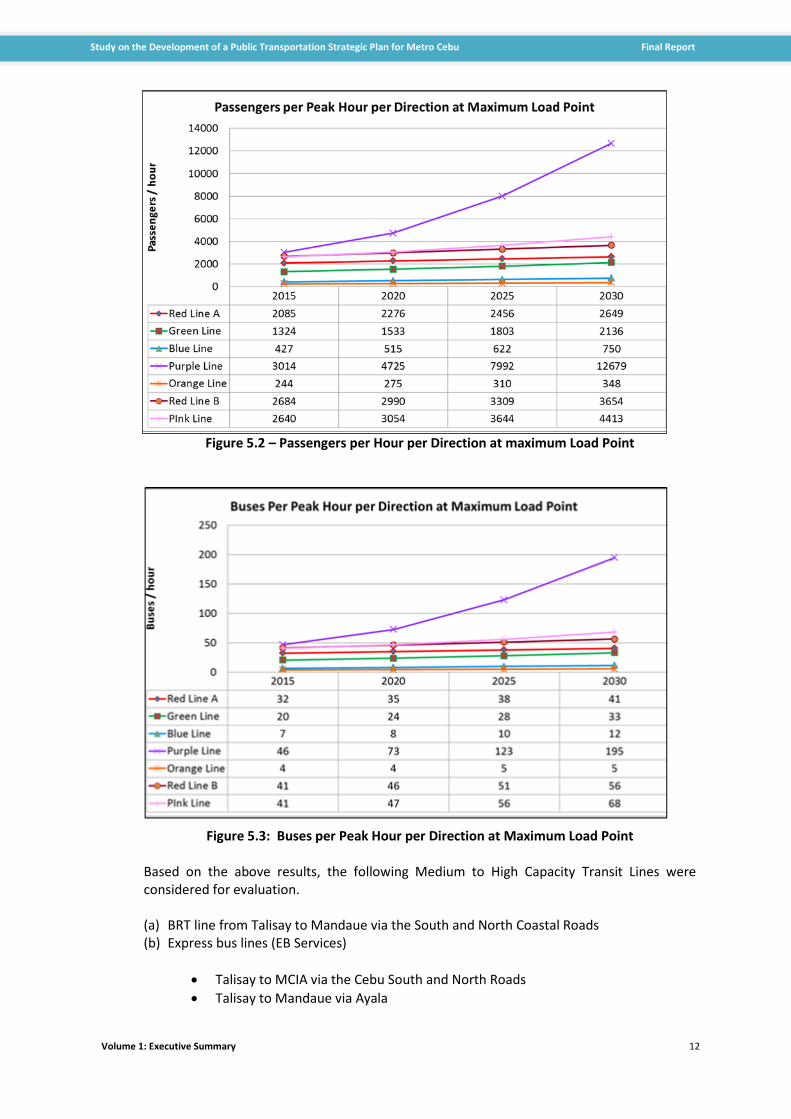
Travel Time Surveys After the model was calibrated, passenger demand forecasts were made using the calibrated model. The results are shown in Figures 5.1 to 5.3.
Figure 5.1 – Daily Boarding Passengers
Volume 1: Executive Summary 12
Study on the Development of a Public Transportation Strategic Plan for Metro Cebu Final Report
Figure 5.2 – Passengers per Hour per Direction at maximum Load Point
Figure 5.3: Buses per Peak Hour per Direction at Maximum Load Point Based on the above results, the following Medium to High Capacity Transit Lines were considered for evaluation. (a) BRT line from Talisay to Mandaue via the South and North Coastal Roads (b) Express bus lines (EB Services)
Talisay to MCIA via the Cebu South and North Roads
Talisay to Mandaue via Ayala
Volume 1: Executive Summary 13
Study on the Development of a Public Transportation Strategic Plan for Metro Cebu Final Report
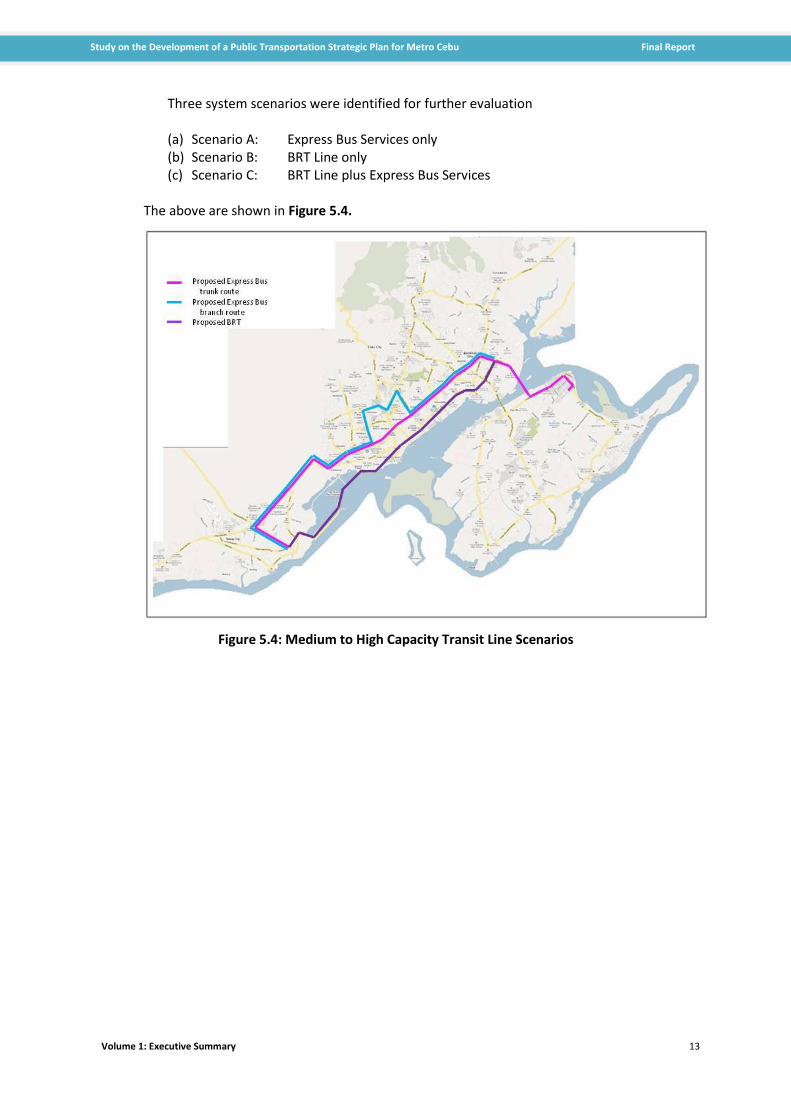
Three system scenarios were identified for further evaluation (a) Scenario A: Express Bus Services only (b) Scenario B: BRT Line only (c) Scenario C: BRT Line plus Express Bus Services
The above are shown in Figure 5.4.
Figure 5.4: Medium to High Capacity Transit Line Scenarios
Volume 1: Executive Summary 14
Study on the Development of a Public Transportation Strategic Plan for Metro Cebu Final Report
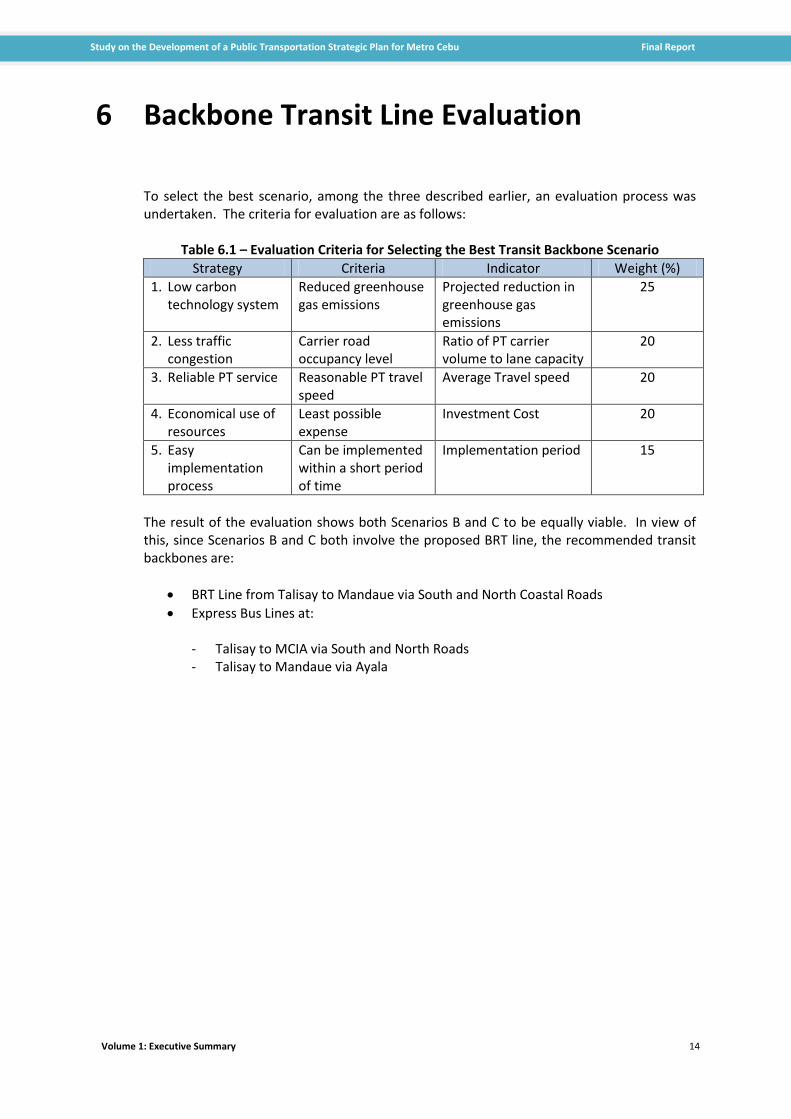
6 Backbone Transit Line Evaluation To select the best scenario, among the three described earlier, an evaluation process was undertaken. The criteria for evaluation are as follows:
Table 6.1 – Evaluation Criteria for Selecting the Best Transit Backbone Scenario
Strategy Criteria Indicator Weight (%)
1. Low carbon technology system
Reduced greenhouse gas emissions
Projected reduction in greenhouse gas emissions
25
2. Less traffic congestion
Carrier road occupancy level
Ratio of PT carrier volume to lane capacity
20
3. Reliable PT service Reasonable PT travel speed
Average Travel speed 20
4. Economical use of resources
Least possible expense
Investment Cost 20
5. Easy implementation process
Can be implemented within a short period of time
Implementation period 15
The result of the evaluation shows both Scenarios B and C to be equally viable. In view of this, since Scenarios B and C both involve the proposed BRT line, the recommended transit backbones are:
BRT Line from Talisay to Mandaue via South and North Coastal Roads
Express Bus Lines at:
- Talisay to MCIA via South and North Roads - Talisay to Mandaue via Ayala
Volume 1: Executive Summary 15
Study on the Development of a Public Transportation Strategic Plan for Metro Cebu Final Report
7 Metro Cebu Public Transport Strategic Plan This study recommends a strategic plan which include the following components: (a) High Capacity Transit: BRT Line from Talisay to Mandaue via South and North Coastal
Roads
(b) Medium Capacity Transit:
Talisay to MCIA via South and North Roads
Talisay to Mandaue via Ayala
(c) Low Capacity Transit
Improvement of PUJ Services
The plan is shown in Table 7.1.

Volume 1: Executive Summary 16
Study on the Development of a Public Transportation Strategic Plan for Metro Cebu Final Report
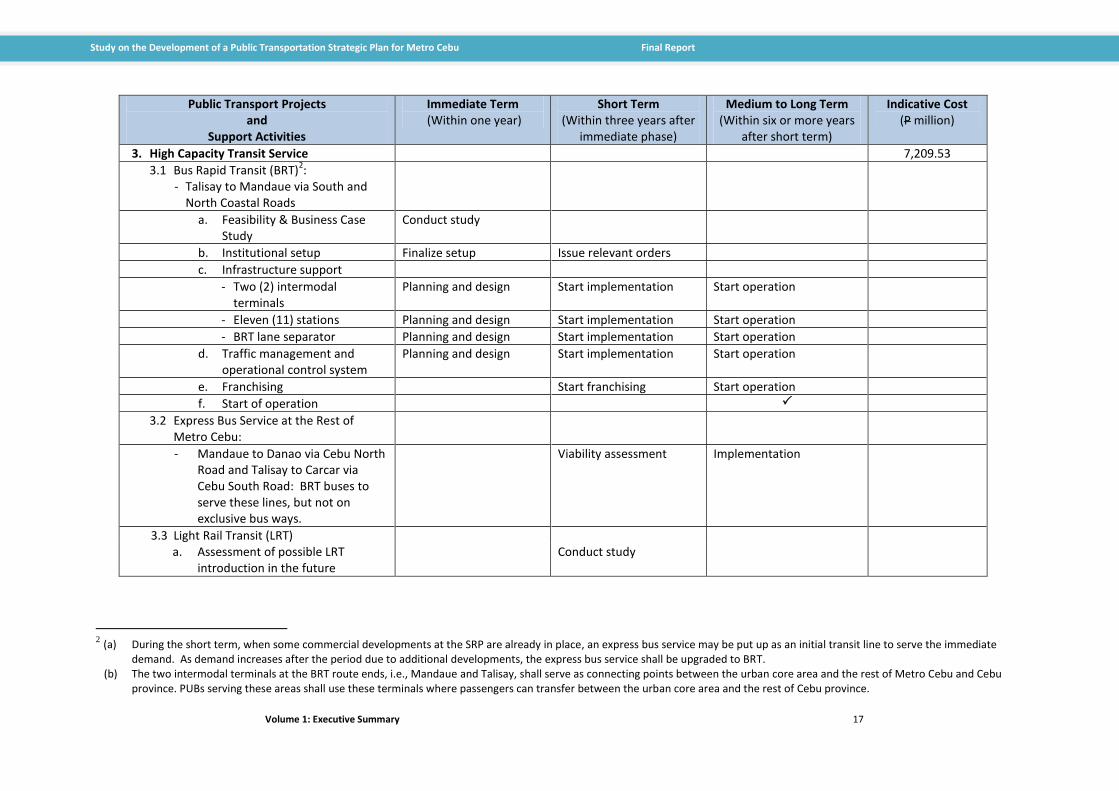
Table 7.1: Metro Cebu Public Transportation Strategic Plan
Public Transport Projects and
Support Activities
Immediate Term (Within one year)
Short Term (Within three years
after immediate phase)
Medium to Long Term (Within six or more
years after short term)
Indicative Cost (P million)
1. PUJ Services Improvement -
a. Update route plan, e.g. merging of duplicating routes, level of supply updating, etc.
b. Route coding system improvement Implementation
c. Vehicle standards setting Planning & design Needs DOTC Guidelines
d. Adaptation of DOTC guidelines on mode and types of service
e. Dwell time control
f. Improvement of stop facilities Conduct Study Implementation
g. Conversion to E-Jeepney Conduct Study Financing Scheme Start Implementation
2. Express Bus Services in Two Lines 1 2,527.38
a) Talisay to MCIA via Cebu South & North Roads and Talisay to Mandaue via Ayala
- Operating Guidelines - Franchising - Provision of bus stop facilities
Preparation of guidelines Start franchising Planning and design
Finalized guidelines Continue franchising/ start implementation Start implementation
1 Along any of the recommended express bus lines a BRT service may be put up. The capacity of the service shall be in accordance with the demand.
Volume 1: Executive Summary 17
Study on the Development of a Public Transportation Strategic Plan for Metro Cebu Final Report
Public Transport Projects and
Support Activities
Immediate Term (Within one year)
Short Term (Within three years after
immediate phase)
Medium to Long Term (Within six or more years
after short term)
Indicative Cost (P million)
3. High Capacity Transit Service 7,209.53
3.1 Bus Rapid Transit (BRT)2:
- Talisay to Mandaue via South and North Coastal Roads
a. Feasibility & Business Case Study
Conduct study
b. Institutional setup Finalize setup Issue relevant orders
c. Infrastructure support
- Two (2) intermodal terminals
Planning and design Start implementation Start operation
- Eleven (11) stations Planning and design Start implementation Start operation
- BRT lane separator Planning and design Start implementation Start operation
d. Traffic management and operational control system
Planning and design Start implementation Start operation
e. Franchising Start franchising Start operation
f. Start of operation
3.2 Express Bus Service at the Rest of Metro Cebu:
- Mandaue to Danao via Cebu North Road and Talisay to Carcar via Cebu South Road: BRT buses to serve these lines, but not on exclusive bus ways.
Viability assessment Implementation
3.3 Light Rail Transit (LRT) a. Assessment of possible LRT
introduction in the future Conduct study
2 (a) During the short term, when some commercial developments at the SRP are already in place, an express bus service may be put up as an initial transit line to serve the immediate
demand. As demand increases after the period due to additional developments, the express bus service shall be upgraded to BRT. (b) The two intermodal terminals at the BRT route ends, i.e., Mandaue and Talisay, shall serve as connecting points between the urban core area and the rest of Metro Cebu and Cebu
province. PUBs serving these areas shall use these terminals where passengers can transfer between the urban core area and the rest of Cebu province.

Volume 1: Executive Summary 18
Study on the Development of a Public Transportation Strategic Plan for Metro Cebu Final Report
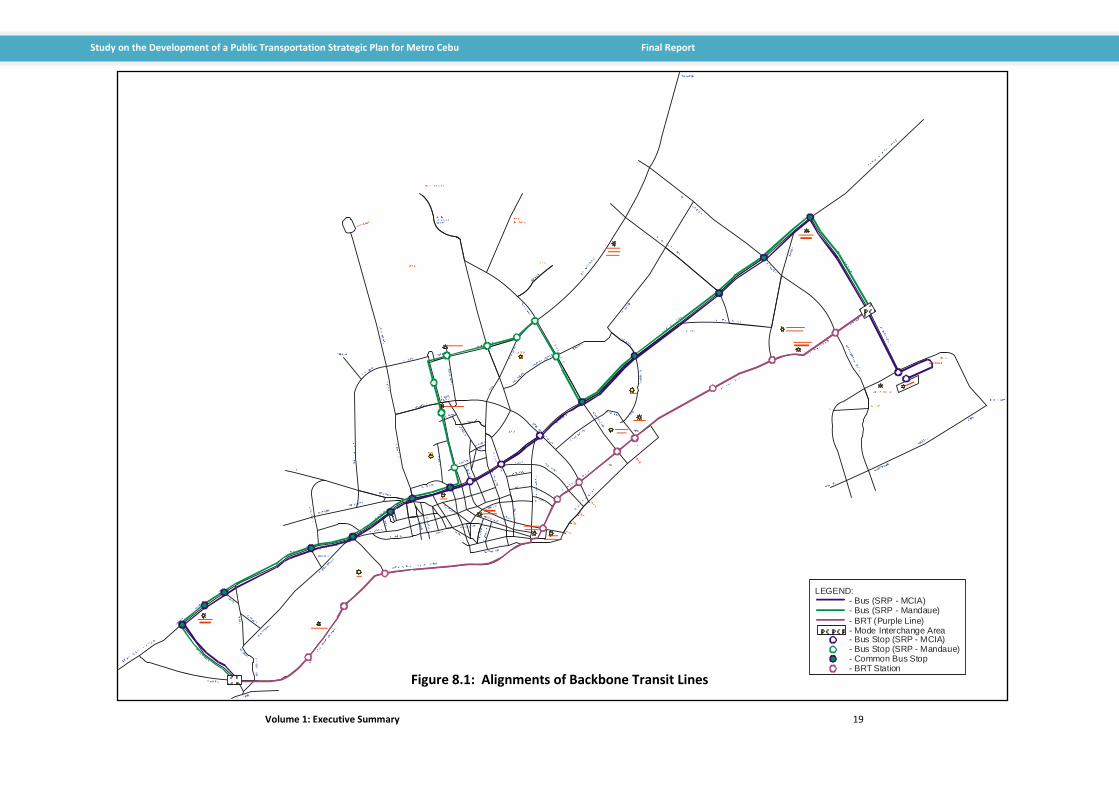
8 Pre-Feasibility Study of Top Two Projects The alignments of the backbone transit lines are shown in Figure 8.1.
8.1 BRT Line
The proposed BRT Line between Talisay and Mandaue via South and North Coastal Roads has the following projected passenger ridership.
Year Volume of Passenger Ridership (pax/day) 2015 117,699 2020 168,376 2025 261,218 2030 392,453
Based on the above demand, the required number of bus units, considering a route length of 15.9 km. an average passenger capacity of 90, a load factor of 0.8 and ten (10) round trips per bus per day, are as follows:
Year Ave. No. of Units Operating/Day
Fleet Size Procurement Cost13 (P, million)
2015 44 55 851.4
2020 64 80 483.75
2025 112 140 1,354.5
2030 176 220 2,064.0
Assumption: P15.48 million per bus
3 Assumed Unit Cost is P15.48M/bus
Volume 1: Executive Summary 19
Study on the Development of a Public Transportation Strategic Plan for Metro Cebu Final Report
Figure 8.1: Alignments of Backbone Transit Lines
LEGEND: - Bus (SRP - MCIA) - Bus (SRP - Mandaue)
- BRT (Purple Line) - Mode Interchange Area - Bus Stop (SRP - MCIA) - Bus Stop (SRP - Mandaue) - Common Bus Stop - BRT Station

Volume 1: Executive Summary 20
Study on the Development of a Public Transportation Strategic Plan for Metro Cebu Final Report
The infrastructure support for the BRT line is as follows:
Year Investment Cost (P, million)
Intermodal Terminals(Construction Cost): North and South Areas
255.94
Intermodal Terminal (Land Acquisition Cost) 800.00
Stations (11) 106.42
Bus Garage (Construction Cost) 173.34
Bus Garage (Land Acquisition Cost) 600.00
Control System 55.00
Traffic Management 55.00
Others 409.17
TOTAL 2,454.87
Figure 8.2: Study Team’s Conceptual Plan of a BRT Station
Source: Trans Milenio Website
Figure 8.3: Trans-Milenio Bus Station, Bogota, Colombia

Volume 1: Executive Summary 21
Study on the Development of a Public Transportation Strategic Plan for Metro Cebu Final Report
Source: Traffic Technology International
Figure 8.4: Sample BRT Control System
Operating and maintenance cost for both infrastructure and carriers is assumed to be 5% of investment cost and is increasing at the rate of 2% per year. Economic benefits are in terms of passenger travel time savings cost and vehicle operating cost savings. Time value is P25/pax-hour. Analysis period is from 2012 to 2035. The result of the economic feasibility analysis is summarized below:
Table 8.1: Economic Analysis Result of the Proposed BRT Line
From the above table, it can be concluded that the project is economically viable. Financial feasibility evaluation was based on revenues to be generated from fare collections and volume of ridership. The assumed fare amounts in P/pax are as follows:
Net Present Benefit-Cost Economic
Value (NPV) at Ratio (B/C) at Internal Rate of
12% Discount 12% Discount Return (EIRR)
Rate Rate (%)
( P Million )
Base 905.99 1.76 17
20% Increase in Capital
Cost
20% Increase in
Operating and Maintenance
Costs
20% Decrease in Benefit (277.09) 1.41 12
Combination of All
Scenarios
(1,278.97)
1.17
8
299.38 1.69 14
510.71 1.71 15
Scenario
Volume 1: Executive Summary 22
Study on the Development of a Public Transportation Strategic Plan for Metro Cebu Final Report
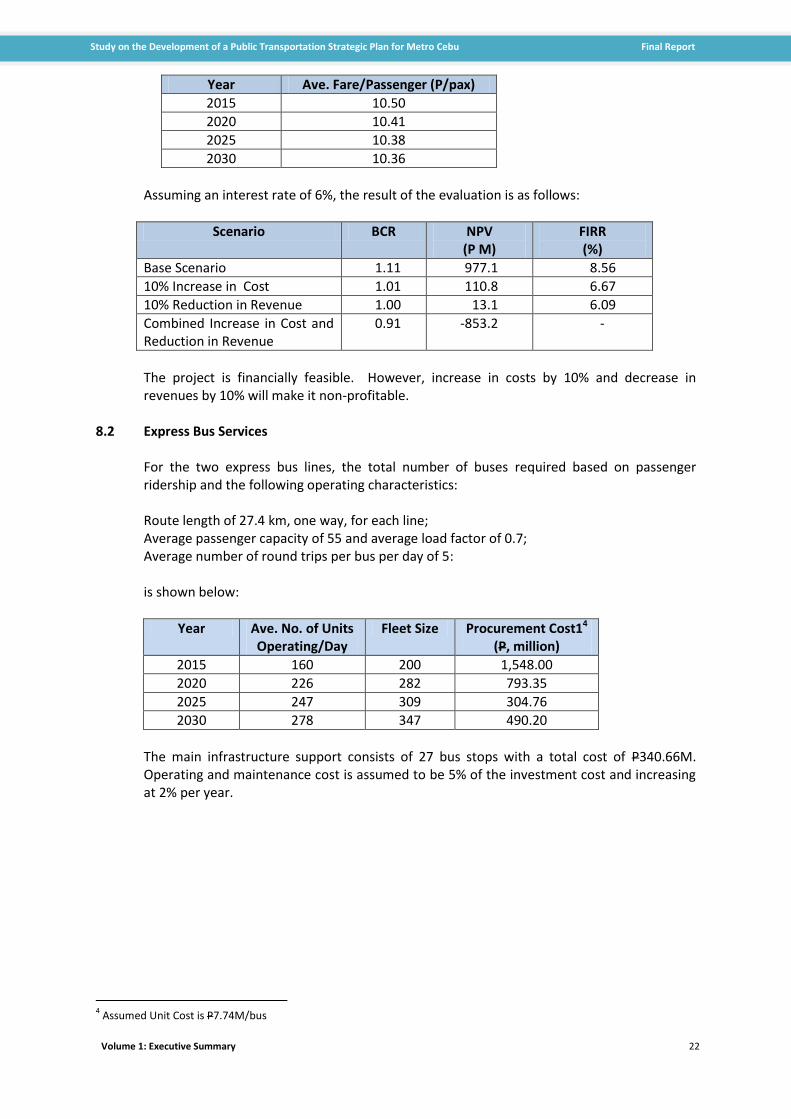
Year Ave. Fare/Passenger (P/pax)
2015 10.50
2020 10.41
2025 10.38
2030 10.36
Assuming an interest rate of 6%, the result of the evaluation is as follows:
Scenario BCR NPV (P M)
FIRR (%)
Base Scenario 1.11 977.1 8.56
10% Increase in Cost 1.01 110.8 6.67
10% Reduction in Revenue 1.00 13.1 6.09
Combined Increase in Cost and Reduction in Revenue
0.91 -853.2 -
The project is financially feasible. However, increase in costs by 10% and decrease in revenues by 10% will make it non-profitable.
8.2 Express Bus Services For the two express bus lines, the total number of buses required based on passenger ridership and the following operating characteristics: Route length of 27.4 km, one way, for each line; Average passenger capacity of 55 and average load factor of 0.7; Average number of round trips per bus per day of 5: is shown below:
Year Ave. No. of Units Operating/Day
Fleet Size Procurement Cost14 (P, million)
2015 160 200 1,548.00
2020 226 282 793.35
2025 247 309 304.76
2030 278 347 490.20
The main infrastructure support consists of 27 bus stops with a total cost of P340.66M. Operating and maintenance cost is assumed to be 5% of the investment cost and increasing at 2% per year.
4 Assumed Unit Cost is P7.74M/bus

Volume 1: Executive Summary 23
Study on the Development of a Public Transportation Strategic Plan for Metro Cebu Final Report
Photo taken from Bus stop along Ayala Avenue in front of Rustan’s
Photo taken from Bus stop along Ayala Avenue opposite Rustan’s
Figure 8.2-1: Typical Bus Stops
Volume 1: Executive Summary 24
Study on the Development of a Public Transportation Strategic Plan for Metro Cebu Final Report
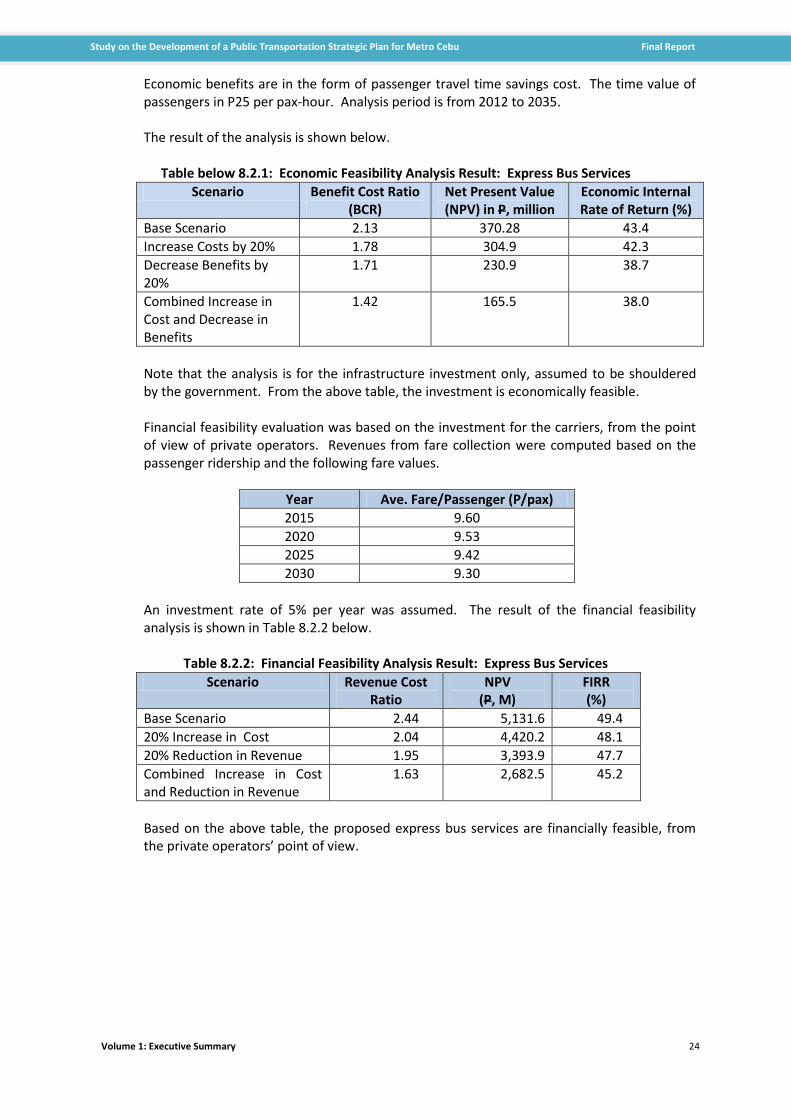
Economic benefits are in the form of passenger travel time savings cost. The time value of passengers in P25 per pax-hour. Analysis period is from 2012 to 2035. The result of the analysis is shown below.
Table below 8.2.1: Economic Feasibility Analysis Result: Express Bus Services
Scenario Benefit Cost Ratio (BCR)
Net Present Value (NPV) in P, million
Economic Internal Rate of Return (%)
Base Scenario 2.13 370.28 43.4
Increase Costs by 20% 1.78 304.9 42.3
Decrease Benefits by 20%
1.71 230.9 38.7
Combined Increase in Cost and Decrease in Benefits
1.42 165.5 38.0
Note that the analysis is for the infrastructure investment only, assumed to be shouldered by the government. From the above table, the investment is economically feasible. Financial feasibility evaluation was based on the investment for the carriers, from the point of view of private operators. Revenues from fare collection were computed based on the passenger ridership and the following fare values.
Year Ave. Fare/Passenger (P/pax)
2015 9.60
2020 9.53
2025 9.42
2030 9.30
An investment rate of 5% per year was assumed. The result of the financial feasibility
analysis is shown in Table 8.2.2 below.
Table 8.2.2: Financial Feasibility Analysis Result: Express Bus Services
Scenario Revenue Cost Ratio
NPV (P, M)
FIRR (%)
Base Scenario 2.44 5,131.6 49.4
20% Increase in Cost 2.04 4,420.2 48.1
20% Reduction in Revenue 1.95 3,393.9 47.7
Combined Increase in Cost and Reduction in Revenue
1.63 2,682.5 45.2
Based on the above table, the proposed express bus services are financially feasible, from the private operators’ point of view.
Volume 1: Executive Summary 25
Study on the Development of a Public Transportation Strategic Plan for Metro Cebu Final Report
9 Financing Scheme
9.1 Introduction The BRT – SRP project consists of the following components: 1. Design and construction of the BRT exclusive roadway including road signages 2. Design and procurement of BRT vehicles, its operation and maintenance 3. Design and construction of BRT passenger terminals along the SRP 4. Operation and maintenance of the physical facilities, roadway and stations 5. Signaling and ticketing systems 9.2 Alternative Financing Schemes 1. Total project cost financing by the Governments of Cebu City, Mandaue , Lapulapu and
Talisay City. 2. Total project cost financing by a duly prequalified and competent private sector
proponent chosen through public bidding 3. (a) LGU’s jointly undertake components 1, 3 and 4 through a joint project management
office (b) Private sector to design, procure, operate and maintain the buses including the
installation of a communications and ticketing system for the BRT system 9.3 Rationale: Alternative 1 • The total project cost is low and can be shared by the three local governments traversed
by the BRT • The project is for public use, service and convenience, three laudable objectives of the
LGU’s and of the project itself • The LGU’s will shall in the profits the project would generate Alternative 2 • The total project cost is low and can easily be handled by Cebu-based entrepreneurs • There are competent and capable Cebu-based constructors / and bus suppliers who are
willing to take the project • Full responsibility for the project is taken by a single focal entity – the project
concessionaire • The project concessionaire shall pay a pre-determined concession fee or shall be obliged
to expand and extend the BRT line over a pre-determined schedule
Volume 1: Executive Summary 26
Study on the Development of a Public Transportation Strategic Plan for Metro Cebu Final Report
Alternative 3 • The project cost is shared by both the LGUs and the project proponent concessionaire
under the Public – Private Partnership program of the present dispensation • Project risk is shared, and so are the profits or dividends amongst the partners • A flexible project implementation plan can be drawn whereby the public sector is
allowed to monitor and evaluate the performance of the private sector proponent based on given deliverables.
9.4 Legal Basis Alternative 1 – Local Government Code authorizing local governments to organize
themselves in order to undertake infrastructure projects that are of common interest to each of them.
Alternative 2 – When properly organized the LGUs can bid out the project under the BOT law
to allow the private sector to undertake the project Alternative 3 – Under the PPP approach the LGUs and the private sector can undertake the
project under a Joint Venture arrangement in order to maximize existing advantages. Here the LGUs will commit the use of the SRP and the private sector will supply the buses, and communications and ticketing systems. Beneficiary establishments along the SRP can joint the private proponent.

Volume 1: Executive Summary 27
Study on the Development of a Public Transportation Strategic Plan for Metro Cebu Final Report
10 Environmental Considerations
10.1 Environmental Concern
Undoubtedly, the environmental quality of the project site will be affected from project
activities during each phase of project development (pre-construction, construction and operational phases). Environmental management measures are imperative to mitigate, if not totally eliminate the adverse impacts to the environment as well as to the project affected persons.
This section contains the recommended Environmental Management Plan (EMP)/
Environmental Monitoring Plan (EMoP). The EMP describes the impacts, the appropriate mitigation and enhancement measures, and institutional mechanisms for implementing the proposed measures. The EMoP describes the parameters of the affected condition to be monitored, the location, frequency, and responsible parties.
10.2 Description of Project The project involves the development of public transportation strategic plan for Metro Cebu,
in the province of Cebu. More specifically, the EMP/EMoP applies to the identified BRT route in this study.
10.3 Environmental Management and Monitoring Plan The environmental management plan and environmental monitoring program for the
project was designed to determine the extent of variations and changes in the levels of pollutants in the environment and other parameters and indicators considering the implementation or operation of the project. The EMP and EMoP were based on the internationally accepted environmental management and conservation practices, the existing environmental laws and regulations of the Government of the Philippines (GoP).
Table 10.1 presents the Summary Matrix for Environmental Management and the
Environmental Monitoring Plan for the project.

Volume 1: Executive Summary 28
Study on the Development of a Public Transportation Strategic Plan for Metro Cebu Final Report
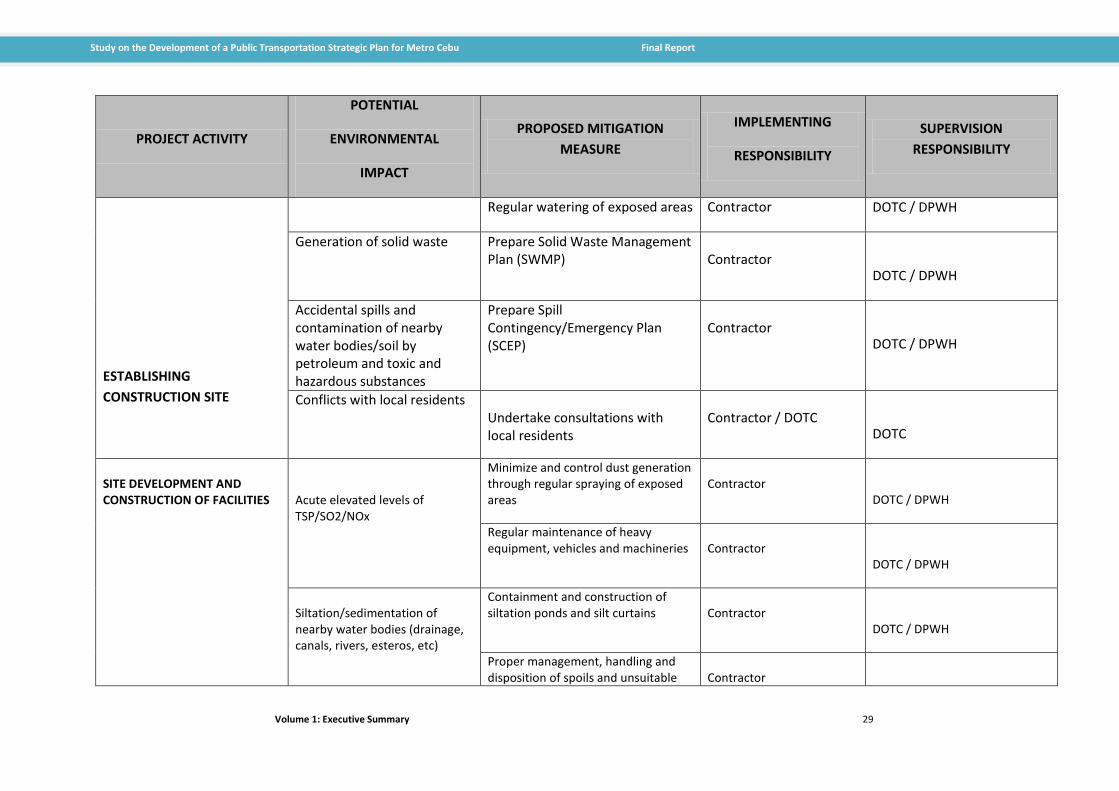
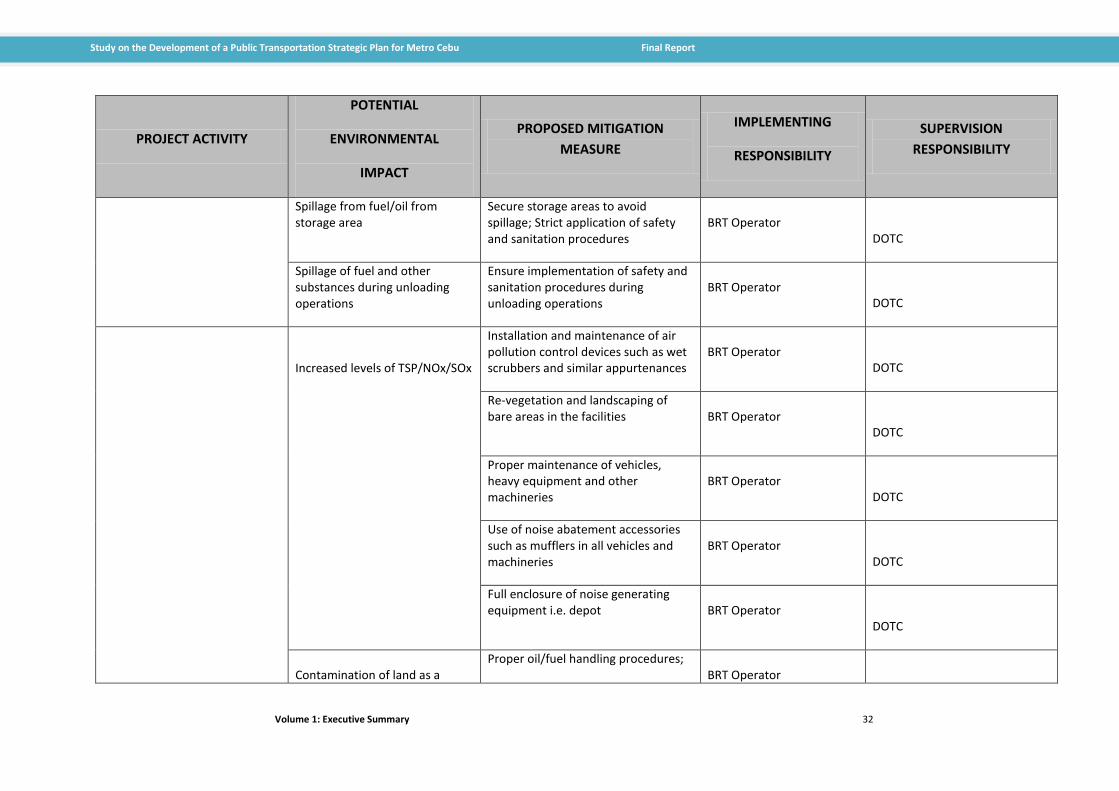
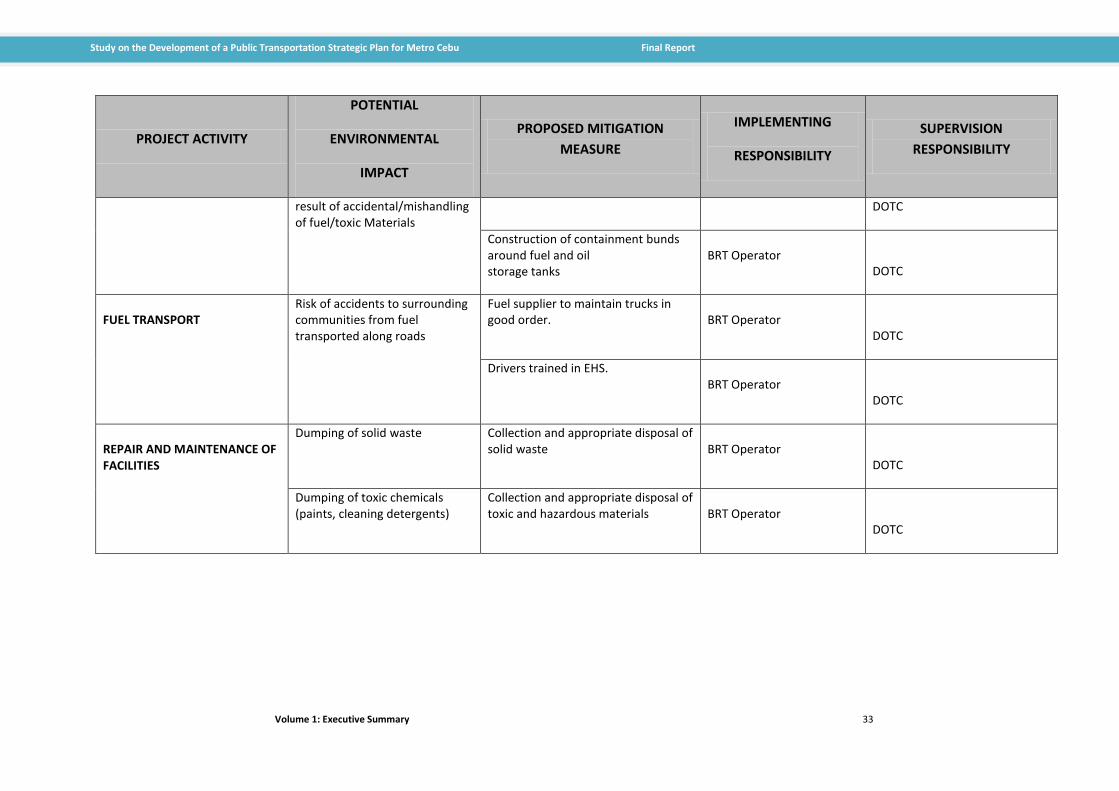
Table 10.1: Environmental Management and the Environmental Monitoring Plan
PROJECT ACTIVITY
POTENTIAL
ENVIRONMENTAL
IMPACT
PROPOSED MITIGATION
MEASURE
IMPLEMENTING
RESPONSIBILITY
SUPERVISION
RESPONSIBILITY
PRE-CONSTRUCTION PHASE
LAND ACQUISITION Loss of land Just and fair compensation to landowners.
DOTC
DOTC
PLANNING SITE ACTIVITIES
Health hazards and risks to workers and residents of nearby communities
Prepare Occupational Health and Safety Plan
Contractor
DOTC
Social conflicts with local residents
Undertake consultations with local residents prior to mobilization
DOTC
DOTC
Priority employment for local workers
Contractor
DOTC
Establishment of grievance/complaints desk at site offices
DOTC
DOTC
CONSTRUCTION PHASE
Generation of dust from clearing and grubbing
Minimize clearing to required area only
Contractor DOTC / DPWH
Volume 1: Executive Summary 29
Study on the Development of a Public Transportation Strategic Plan for Metro Cebu Final Report
PROJECT ACTIVITY
POTENTIAL
ENVIRONMENTAL
IMPACT
PROPOSED MITIGATION
MEASURE
IMPLEMENTING
RESPONSIBILITY
SUPERVISION
RESPONSIBILITY
ESTABLISHING
CONSTRUCTION SITE
Regular watering of exposed areas Contractor DOTC / DPWH
Generation of solid waste
Prepare Solid Waste Management Plan (SWMP)
Contractor
DOTC / DPWH
Accidental spills and contamination of nearby water bodies/soil by petroleum and toxic and hazardous substances
Prepare Spill Contingency/Emergency Plan (SCEP)
Contractor
DOTC / DPWH
Conflicts with local residents Undertake consultations with local residents
Contractor / DOTC
DOTC
SITE DEVELOPMENT AND CONSTRUCTION OF FACILITIES
Acute elevated levels of TSP/SO2/NOx
Minimize and control dust generation through regular spraying of exposed areas
Contractor
DOTC / DPWH
Regular maintenance of heavy equipment, vehicles and machineries
Contractor
DOTC / DPWH
Siltation/sedimentation of nearby water bodies (drainage, canals, rivers, esteros, etc)
Containment and construction of siltation ponds and silt curtains
Contractor
DOTC / DPWH
Proper management, handling and disposition of spoils and unsuitable
Contractor

Volume 1: Executive Summary 30
Study on the Development of a Public Transportation Strategic Plan for Metro Cebu Final Report
PROJECT ACTIVITY
POTENTIAL
ENVIRONMENTAL
IMPACT
PROPOSED MITIGATION
MEASURE
IMPLEMENTING
RESPONSIBILITY
SUPERVISION
RESPONSIBILITY
materials DOTC / DPWH
Contamination of nearby water bodies
Installation of oil and grease traps in drainage systems from workshops, vehicle and plant washing facilities and service and fuelling areas
Contractor
DOTC / DPWH
Construction of bund walls of adequate capacity around fuel, oil and solvent storage tanks
Contractor
DOTC / DPWH
Proper handling and storage of petroleum products and toxic and hazardous substances treatment facilities
Contractor
DOTC / DPWH
Installation of sanitation facilities in camps and site offices
Contractor
DOTC / DPWH
Acute elevated levels of noise
Operation of heavy equipment and other appurtenant facilities will be limited during daytime – 0800-1700. Should operation beyond these hours is required, proper notification shall be given the concerned local government officials
Contractor
DOTC / DPWH
Regular maintenance of heavy equipment and machineries
Contractor
DOTC / DPWH

Volume 1: Executive Summary 31
Study on the Development of a Public Transportation Strategic Plan for Metro Cebu Final Report
PROJECT ACTIVITY
POTENTIAL
ENVIRONMENTAL
IMPACT
PROPOSED MITIGATION
MEASURE
IMPLEMENTING
RESPONSIBILITY
SUPERVISION
RESPONSIBILITY
Establishment of buffers between nearby settlement areas and work areas
Contractor
DOTC / DPWH
SITE DEVELOPMENT AND CONSTRUCTION OF FACILITIES
Loss of vegetative cover, plants, trees
Cutting of trees and clearing of vegetative cover to be undertaken only when necessary
Contractor
DOTC / DPWH
Relevant permits and clearances will be secured prior to cutting and clearing activities
Contractor
DOTC / DPWH
Loss of aesthetic values
Landscape development and restoration
Contractor
DOTC / DPWH
OPERATION PHASE
FACILITIES/SYSTEM OPERATION
Wastewater generation from facilities use and maintenance
Construction and maintenance of wastewater treatment facility
BRT Operator
DOTC
Water contamination from fuel/oil leaks and spillage
Proper safety and handling of fuel/oil storage areas and motor pool
BRT Operator
DOTC
Release of toxic and hazardous substances
Treatment of wastewater prior to release into the ambient
BRT Operator
DOTC
Volume 1: Executive Summary 32
Study on the Development of a Public Transportation Strategic Plan for Metro Cebu Final Report
PROJECT ACTIVITY
POTENTIAL
ENVIRONMENTAL
IMPACT
PROPOSED MITIGATION
MEASURE
IMPLEMENTING
RESPONSIBILITY
SUPERVISION
RESPONSIBILITY
Spillage from fuel/oil from storage area
Secure storage areas to avoid spillage; Strict application of safety and sanitation procedures
BRT Operator
DOTC
Spillage of fuel and other substances during unloading operations
Ensure implementation of safety and sanitation procedures during unloading operations
BRT Operator
DOTC
Increased levels of TSP/NOx/SOx
Installation and maintenance of air pollution control devices such as wet scrubbers and similar appurtenances
BRT Operator
DOTC
Re-vegetation and landscaping of bare areas in the facilities
BRT Operator
DOTC
Proper maintenance of vehicles, heavy equipment and other machineries
BRT Operator
DOTC
Use of noise abatement accessories such as mufflers in all vehicles and machineries
BRT Operator
DOTC
Full enclosure of noise generating equipment i.e. depot
BRT Operator
DOTC
Contamination of land as a
Proper oil/fuel handling procedures; BRT Operator
Volume 1: Executive Summary 33
Study on the Development of a Public Transportation Strategic Plan for Metro Cebu Final Report
PROJECT ACTIVITY
POTENTIAL
ENVIRONMENTAL
IMPACT
PROPOSED MITIGATION
MEASURE
IMPLEMENTING
RESPONSIBILITY
SUPERVISION
RESPONSIBILITY
result of accidental/mishandling of fuel/toxic Materials
DOTC
Construction of containment bunds around fuel and oil storage tanks
BRT Operator
DOTC
FUEL TRANSPORT
Risk of accidents to surrounding communities from fuel transported along roads
Fuel supplier to maintain trucks in good order.
BRT Operator
DOTC
Drivers trained in EHS. BRT Operator
DOTC
REPAIR AND MAINTENANCE OF FACILITIES
Dumping of solid waste
Collection and appropriate disposal of solid waste
BRT Operator
DOTC
Dumping of toxic chemicals (paints, cleaning detergents)
Collection and appropriate disposal of toxic and hazardous materials
BRT Operator
DOTC

Volume 1: Executive Summary 34
Study on the Development of a Public Transportation Strategic Plan for Metro Cebu Final Report
ENVIRONMENTAL PARAMETER INDICATOR PARAMETERS
MONITORING FREQUENCY PLANNED AREA OF MONITORING1
AIR QUALITY
Sulfur dioxide
Monthly During Construction Period (_ year)
Monthly During Operation Period (5
years)
DESIGNATED STATIONS
Nitrogen dioxide
Monthly During Construction Period (_ year)
Monthly During Operation Period (5 years)
Total Suspended Particulate
Monthly During Construction Period (_ year)
Monthly During Operation Period (5 years)
NOISE Noise
Monthly During Construction Period (_ year)
Monthly During Operation Period (5 years)
WATER QUALITY
Temperature pH Biological Oxygen Demand (BOD) Dissolved Oxygen (DO) Oil and Grease Total Coliform Count Total Suspended Sediments (TSS)
Monthly During Construction Period
DESIGNATED STATIONS

Volume 1: Executive Summary 35
Study on the Development of a Public Transportation Strategic Plan for Metro Cebu Final Report
The development of BRT project would result in the dislocation of people, or the alteration
of natural ecosystems and existing structures. Detailed studies, e.g., environmental impact study, socio-economic evaluation, among others, are required to anticipate and minimize the impact of the dislocation or alteration. An environmental impact study, simply defined, is a systematic consideration of the relationship between a project and the environment.
In accordance with the government policy of maintaining environmental soundness and
safety, and sustainable development, appropriate enhancement and mitigating measures shall be established and instituted to minimize, or if at all possible, eliminate the adverse impacts of the project to the environment and the community.
Specific measures, along with appropriate standard operational procedures, should be
implemented at the site in order to minimize the potential environmental impacts and nuisance of the proposed development.
The environmental quality of the project site might be affected from project activities during
each phase of project development (pre-construction, construction and operational phases), if environmental management measures are not properly followed.
To facilitate integration of safeguard considerations into the project preparation,
implementation, and monitoring process, a distinction has been made for the:
Design-Preconstruction Phase is the period before the actual construction starts. Certain safeguard requirements need to be complied with in order to allow the Contractor to implement the project.
Construction Phase, the period from the time that the “Notice to Proceed” is given to the Contractor until the issuance of the “Certificate of Completion”.
Operation and Maintenance Phase, the period starting with the issuing of the “Certificate of Completion” issued by the Owner (DOTC/DPWH) until the end of the lifetime of the project.
10.4 Preliminary Environmental Analysis One environmental impact of the proposed BRT and express bus lines is the reduction of
greenhouse gas emission along the involved corridors. This was quantified based on the estimated reduction in vehicle-kilometers of jeepney operation and the unit emission of 370 gm/veh-km. For the base year, 2010, the total veh-km of PUJs along the involved corridors is 272,765 veh-kms. Due to PT improvements, such as reduction of PUJ supply, conversion to electric jeepneys (staggered up to 2030) and introduction of clean-air express buses and the BRT, the vehicle-kilometers of diesel and gasoline fed jeepneys along the involved corridors are:
Year Veh-Kilometers (Gasoline/Diesel PUJs) 2015 95,468 2020 54,553 2025 27,276 2030 0
Based on the above, the corresponding greenhouse (GHG) gas emissions are:

Volume 1: Executive Summary 36
Study on the Development of a Public Transportation Strategic Plan for Metro Cebu Final Report
Year GHG Emission (tons/day) 2015 35.32 2020 20.18 2025 10.09 2030 0
On the other hand, BRT and Express buses which have a unit emission of 20 gms/veh-km will
have the following GHG emissions:
Year Veh-Km (BRT + Express Buses) GHG Emission (tons/day) 2015 68,792 1.38 2020 82,276 1.64 2025 103,294 2.07 2030 132,140 2.64
The total GHG emission (in tons/day) for PUJs, BRT and express buses are summarized
below:
Year PUJs BRT & Express Bus Total 2015 35.32 1.38 36.70 2020 20.18 1.64 21.82 2025 10.09 2.07 12.16 2030 0 2.64 2.64
Note that the current GHG emission (year 2010) of PUJs along the affected corridors is
100.92 tons/day.

Volume 1: Executive Summary 37
Study on the Development of a Public Transportation Strategic Plan for Metro Cebu Final Report
11 Institutional Framework
11.1 Institutional Concern
The BRT is a new mode of mass transit system in the Philippines, although this type of public
transport system has been successfully operating in Colombia and Indonesia. In fact, Jakarta
has established a network of BRT lines and still expanding. There is no doubt that Cebu
needs a mass transit system especially now that the city is fast developing into a
metropolitan hub as shown by the influx of businesses and investments although there is
not much room for expansion. The developable area is very limited as shown by the existing
land use map. That is why the city has been the locale for some major reclamation
developments, the most recent of which is the SRP. These reclamation developments
actually have planned well that the road networks have been designed to accommodate big
volumes of traffic, thus making them ideal for installation or construction of mass rapid
transit system.
The present study shows that the more popular rail rapid transit system (LRT or MRT) that
have been proposed in the past would not be viable in terms of ridership as shown by the
results of the transport models discussed in this report. The most likely mass transport
system is the BRT. The study, i.e., the model has identified the priority line to be the north-
south line, or the purple line shown in Figure 9.1-1. The pre-feasibility study shows that this
line is economically viable (Chapter 5).
To date, there is no existing institutional system yet in the Philippines that would fit the BRT
system of public transport. However, there are some possible options that could be
applicable to run and operate BRT, to wit:
• Option 1: Government owned corporation similar to PNR, attached to DOTC
• Option 2: Put up a Bus Rapid Transit Authority (BRTA) with following sub-options:
- Option 2A – fully government agency - Option 2B – government agency for regulatory and policy functions; privatize
operations, management and maintenance, similar to MWSS-Manila Water/Maynilad arrangement.
• Option 3: Fully private corporation – upon completion of the infrastructures, a private
company applies for franchise to run the BRT, just like any franchise given to buses or jeepneys. The form franchise may need additional requirements appropriate for a bus rapid transit system, such as branding and operations of the system, bus designs, capacity and special features convenience and safety of the riding public, qualifications of drivers, and others as may be applicable. A special franchise agreement may have to be.
• Option 4: Put up a public-private corporation (PPC) with shares of stocks owned by the
government and private stockholders, to wit: - Option 4A : government is majority stockholder

Volume 1: Executive Summary 38
Study on the Development of a Public Transportation Strategic Plan for Metro Cebu Final Report
- Option 4B : private majority stockholders Options 1 and 2 would most probably require congressional legislation which could be a long
and tedious process and may delay the construction and eventually the operation of the system. Further, Option 1 and option 2A have the potential of the government losing money aside from the fact that the investments in rolling stocks, and other ancillary equipment may pose a big burden to the budget of the government. The Philippines has a litany of sad experiences in running government owned corporation.
Options 3 and 4 would be the most practical, convenient and appropriate institutional set-up
for the BRT system. Option 3 appears to be the most advantageous to the government in terms of financial and management aspects. It is less complicated and would not require legislation. It simply needs the approval of the Securities and Exchange Commission (SEC) with clearance from the DOTC.
Option 4 will require special legislation but not as tedious and complicated as congressional
legislation. In fact, the PPC may need city ordinance passed by the City Council which will specify the participations of the government and the private sector, among which are the distribution of shares of stocks, the capitalization, the composition of board of directors and officers, etc. Under the Local Government Code of 1991 (R.A. 7160), the local governments are allowed or authorized to put up a corporation on its own or joint venture with the private sector. Section 3(f) “The participation of the private sector in local governance, particularly in the delivery of basic services, shall be encouraged . . .” The BRT could be one of the LGU economic enterprises incorporated as stock corporations; shares are open to public and private investors. The LGU could be the majority holder; or majority owned by private sector. The City can exercise the authority and power of LGU as a corporation under sections 15 and 22 of the Local Government Code. Section 15 states – “Every local government unit . . . is a body politic and corporate endowed with powers . . . as a corporate entity representing the inhabitants of its territory.” And in Section 22(a) every local government unit, as a corporation, shall have the following powers . . . “To acquire and convey real or personal property ; to enter into contracts, and to exercise such other powers granted to corporations . . .”
There are a number of LGUs (municipalities, cities, provinces) that have put up a corporation
or business entities to better deliver basic services, such as Bohol and Cavite provinces, Quezon City, etc.
All told, however, all the options mentioned above will have to be studied in detail as part of
the feasibility study for the proposed BRT system.
Volume 1: Executive Summary 39
Study on the Development of a Public Transportation Strategic Plan for Metro Cebu Final Report
12 Sketch Planning Manual
Part of the Terms of Reference (TOR) of the study is the preparation of a Sketch Planning Manual which will be used by DOTC transport planners in their future planning undertakings. Sketch planning is a tool in doing transport planning in a quick manner where there are constraints on data availability and where results are needed within a short period of time. It will not give detailed results but it will provide general strategic plans to address a given area.
The sketch planning methodology follows the standard transport planning process.
However, the approach will only consider major transport corridors in the study area where transport-related problems are more pronounced, with big significance on the overall transport system in the area. Data sources are limited to secondary data which can be obtained immediately and from some data collection activities such as traffic counts which can be undertaken right away. The planning procedure is enhanced with the use of computer softwares applied to data processing, analysis and graphical representation such as GIS and transport demand models which are used in demand analysis and forecasting.
The study team has produced the manual and has conducted a training program on the
subject to DOTC planning staff.
Volume 1: Executive Summary 40
Study on the Development of a Public Transportation Strategic Plan for Metro Cebu Final Report
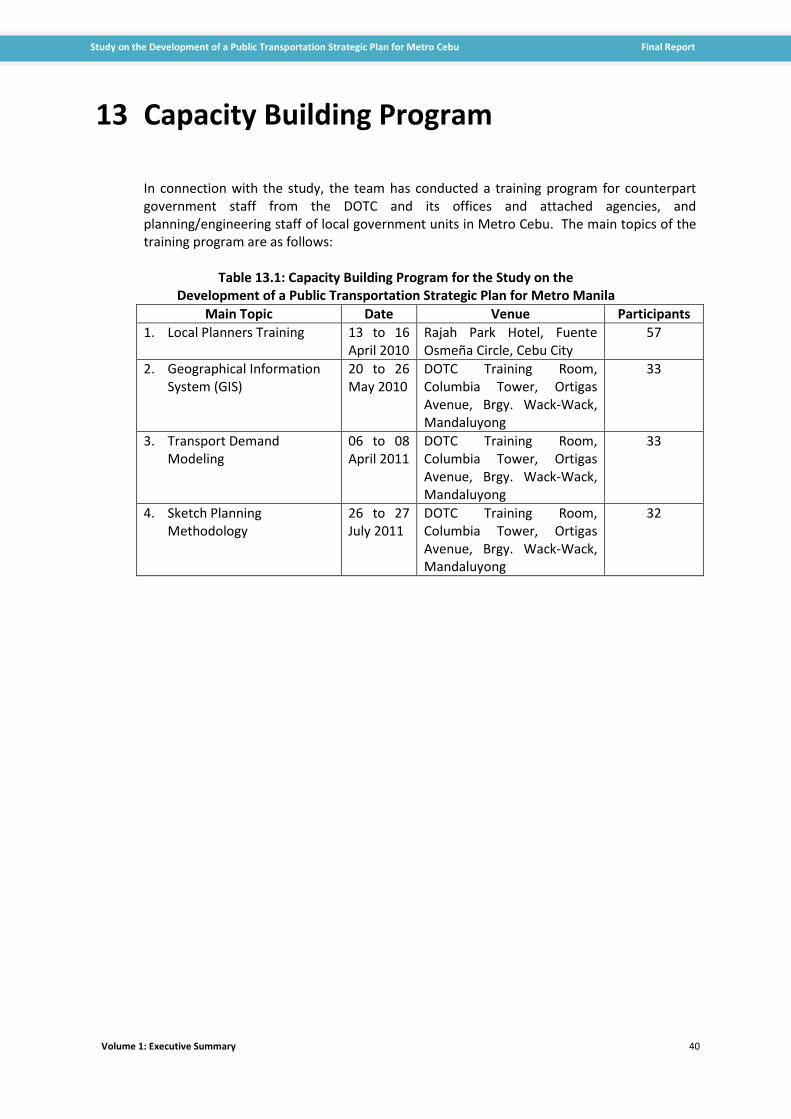
13 Capacity Building Program
In connection with the study, the team has conducted a training program for counterpart government staff from the DOTC and its offices and attached agencies, and planning/engineering staff of local government units in Metro Cebu. The main topics of the training program are as follows:
Table 13.1: Capacity Building Program for the Study on the
Development of a Public Transportation Strategic Plan for Metro Manila
Main Topic Date Venue Participants
1. Local Planners Training 13 to 16 April 2010
Rajah Park Hotel, Fuente Osmeña Circle, Cebu City
57
2. Geographical Information System (GIS)
20 to 26 May 2010
DOTC Training Room, Columbia Tower, Ortigas Avenue, Brgy. Wack-Wack, Mandaluyong
33
3. Transport Demand Modeling
06 to 08 April 2011
DOTC Training Room, Columbia Tower, Ortigas Avenue, Brgy. Wack-Wack, Mandaluyong
33
4. Sketch Planning Methodology
26 to 27 July 2011
DOTC Training Room, Columbia Tower, Ortigas Avenue, Brgy. Wack-Wack, Mandaluyong
32

Prepared by:
DESIGN SCIENCE INC. in association with RENARDET S.A. CONSULTING ENGINEERS BT & T Center, # 20 E. Rodriquez Jr. Ave., Rm. 2315 City land 10 Tower 1 Libis, Quezon City H.V. de La Costa St. corner Ayala Ave., Makati City
The Development of Public Transportation Strategic Plan for Metro Cebu