Embed Size (px)
Citation preview
Page 1
Smart Grid, Smart City
National Cost Benefit Assessment
27 November, 2014 – Smart Energy Forum
Newcastle Institute for Energy and Resources
Bob Bosler, Senior Consultant, Energeia
Ranelle Cliff, Senior Project Manager, Arup
© Energeia 2014. All Rights Reserved
Page 2
• Approach to Smart Grid, Smart City National Cost Benefit Assessment
• Outlook and technology optimisation results
• Strategic Context
• SGSC Report Conclusions and Recommendations
• Transitioning to a Smart Grid Future
• Developments since SGSC and implications
Overview
© Energeia 2014. All Rights Reserved
Page 3
Energeia
© Energeia 2014. All Rights Reserved
• Founded in 2009 in Sydney, now largest specialist consultancy in Australia
• 15 full-time experts based in Sydney, with network of distinguished experts
• We seek out transformative projects which, by their nature:
• Are technically high risk
• Have high strategic value
Confidential
Page 4
Smart Grid, Smart City
Page 5
National Cost Benefit Assessment
© Energeia 2014. All Rights Reserved
What is our independent, informed assessment of
the Business Case for the deployment of an
integrated Smart Grid in a national context?
Page 6
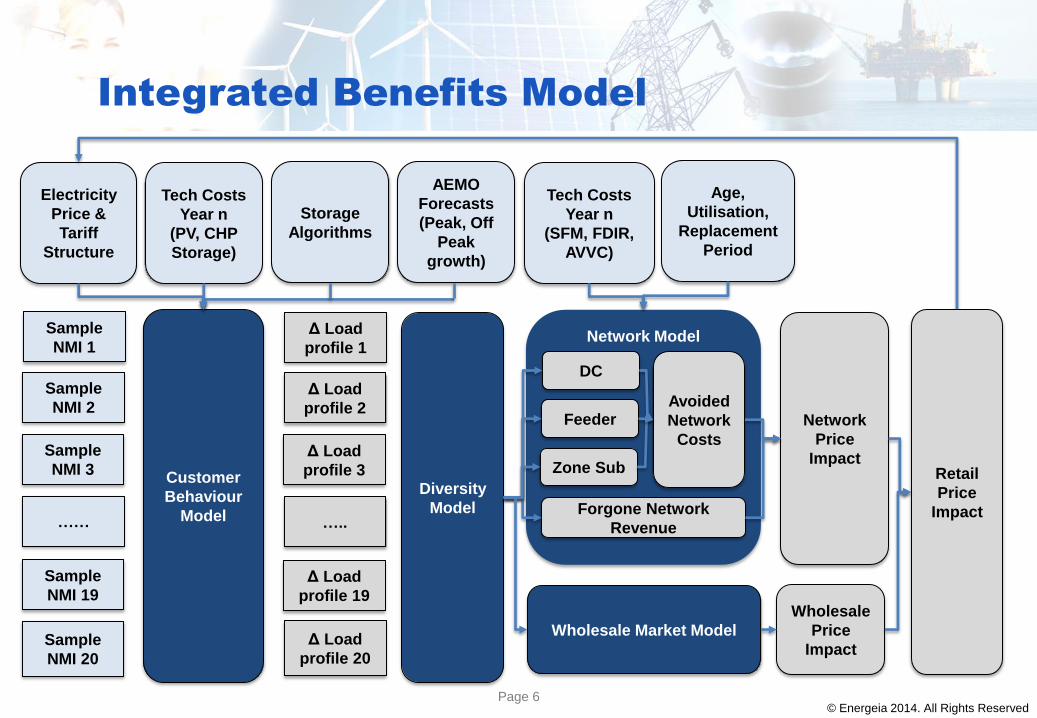
Integrated Benefits Model
© Energeia 2014. All Rights Reserved
Network Model
Customer
Behaviour
Model
Tech Costs
Year n
(PV, CHP
Storage)
DC
Network
Price
Impact
Electricity
Price &
Tariff
Structure
Sample
NMI 19
Sample
NMI 20
……
Sample
NMI 3
Sample
NMI 2
Sample
NMI 1
Δ Load
profile 19
Δ Load
profile 20
…..
Δ Load
profile 3
Δ Load
profile 2
Δ Load
profile 1
Diversity
Model Forgone Network
Revenue
Avoided
Network
Costs
Storage
Algorithms
Age,
Utilisation,
Replacement
Period
AEMO
Forecasts
(Peak, Off
Peak
growth)
Feeder
Zone Sub
Wholesale
Price
Impact
Retail
Price
Impact
Wholesale Market Model
Tech Costs
Year n
(SFM, FDIR,
AVVC)
Page 7
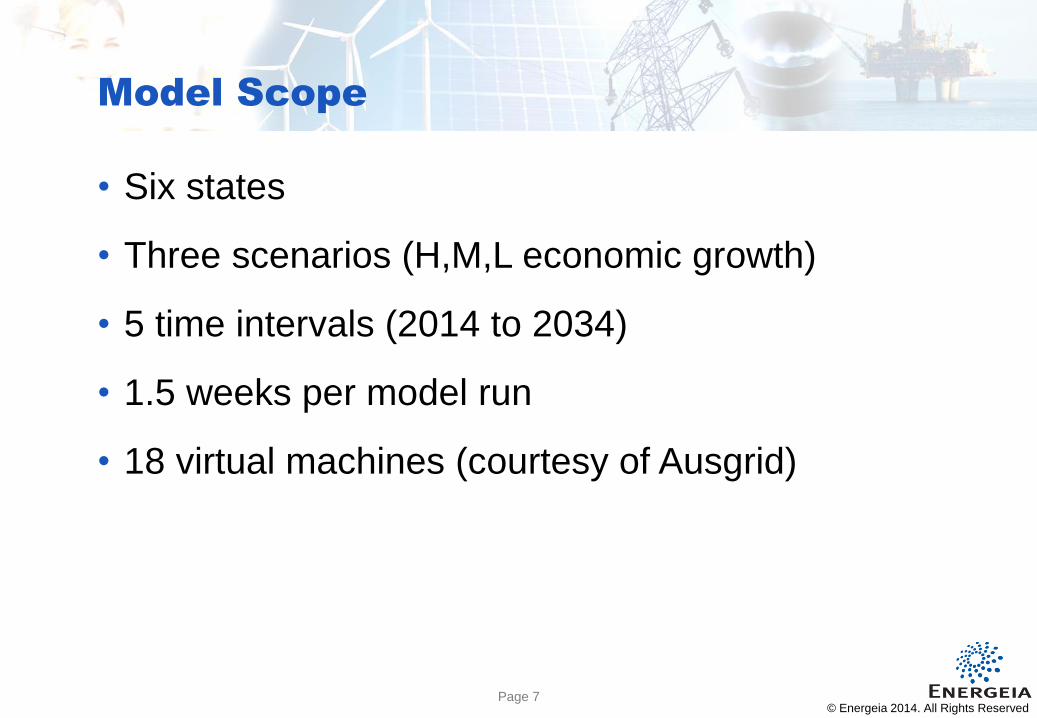
Model Scope
© Energeia 2014. All Rights Reserved
• Six states
• Three scenarios (H,M,L economic growth)
• 5 time intervals (2014 to 2034)
• 1.5 weeks per model run
• 18 virtual machines (courtesy of Ausgrid)
Page 8
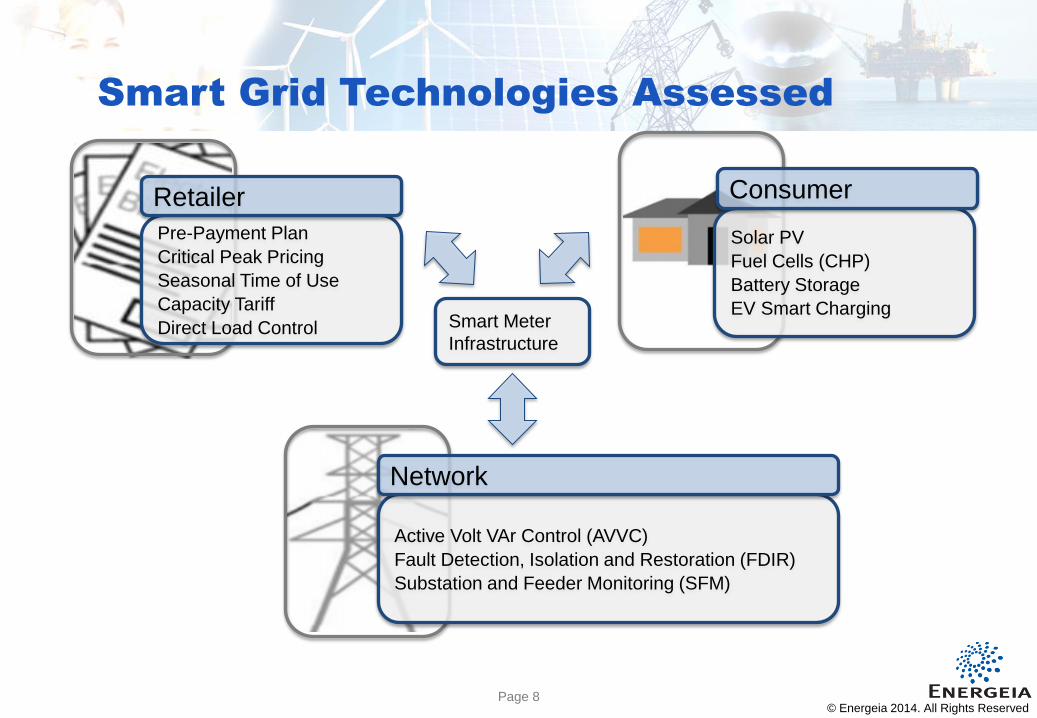
Smart Grid Technologies Assessed
© Energeia 2014. All Rights Reserved
Pre-Payment Plan
Critical Peak Pricing
Seasonal Time of Use
Capacity Tariff
Direct Load Control
Retailer
Solar PV
Fuel Cells (CHP)
Battery Storage
EV Smart Charging
Consumer
Active Volt VAr Control (AVVC)
Fault Detection, Isolation and Restoration (FDIR)
Substation and Feeder Monitoring (SFM)
Network
Smart Meter
Infrastructure
Page 9
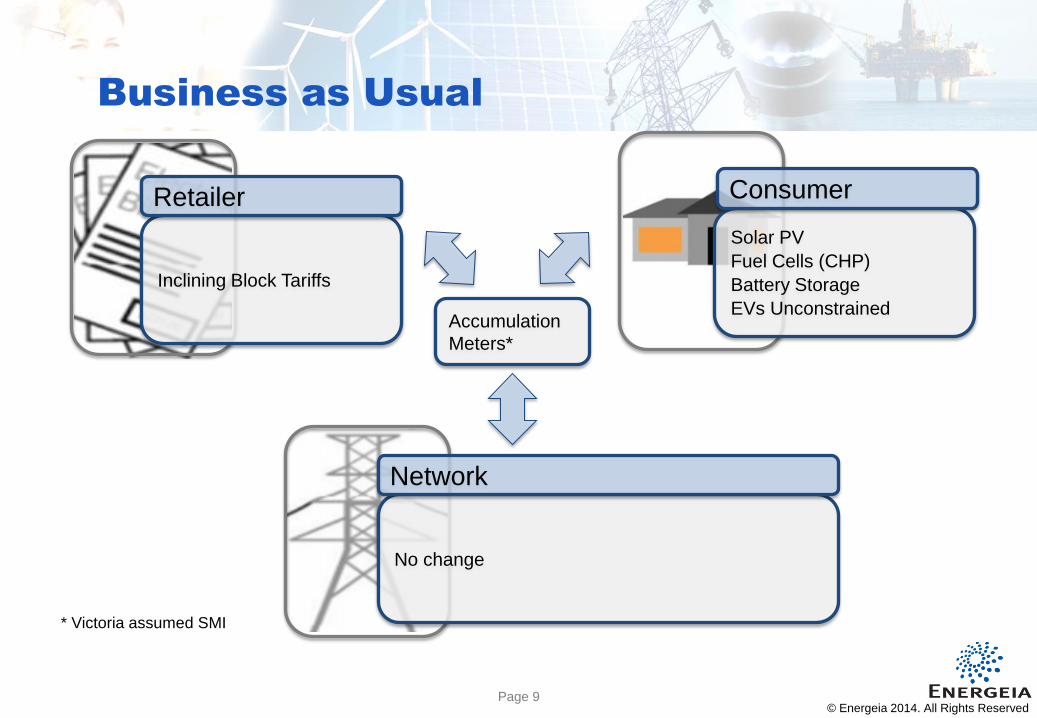
Business as Usual
© Energeia 2014. All Rights Reserved
Inclining Block Tariffs
Retailer
Solar PV
Fuel Cells (CHP)
Battery Storage
EVs Unconstrained
Consumer
No change
Network
Accumulation
Meters*
* Victoria assumed SMI
Page 10
Medium Scenario
Outlook

Page 11 11
252
15,745 855
3,635 796 354 (4,981)
(164) (1,334)(99) (2,514)
(333) (265)
15,235 27,183
0
5,000
10,000
15,000
20,000
25,000
30,000
SFM
FDIR
AV
VC
Dyn
amic
Tar
iffs
SMI
EV C
har
gin
g
DG
& D
S
SFM
FDIR
AV
VC
Dyn
amic
Tar
iffs
SMI
EV C
har
gin
g
DG
& D
S
SMI Enabled SMI Enabled
Benefits Costs Total
Pre
sen
t V
alu
e (
$M
20
14
Re
al)
National Cost Benefit Assessment
© Energeia 2014. All Rights Reserved
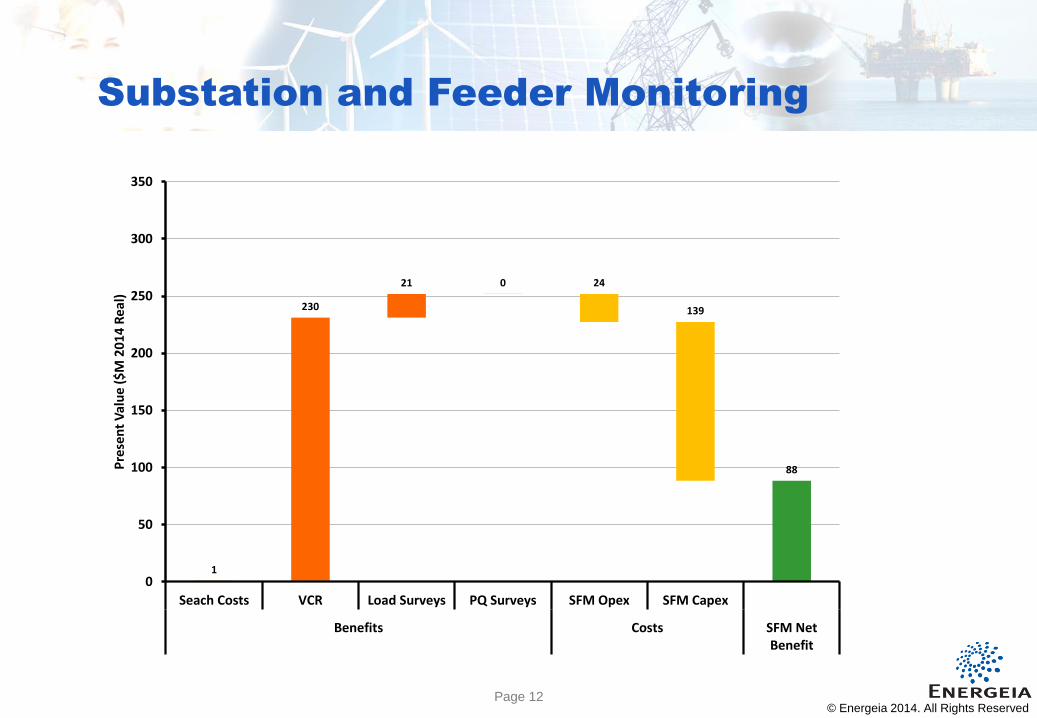
Page 12 12
1
230
21 0 24
139
88
0
50
100
150
200
250
300
350
Seach Costs VCR Load Surveys PQ Surveys SFM Opex SFM Capex
Benefits Costs SFM NetBenefit
Pre
sen
t V
alu
e (
$M
20
14
Re
al)
Substation and Feeder Monitoring
© Energeia 2014. All Rights Reserved
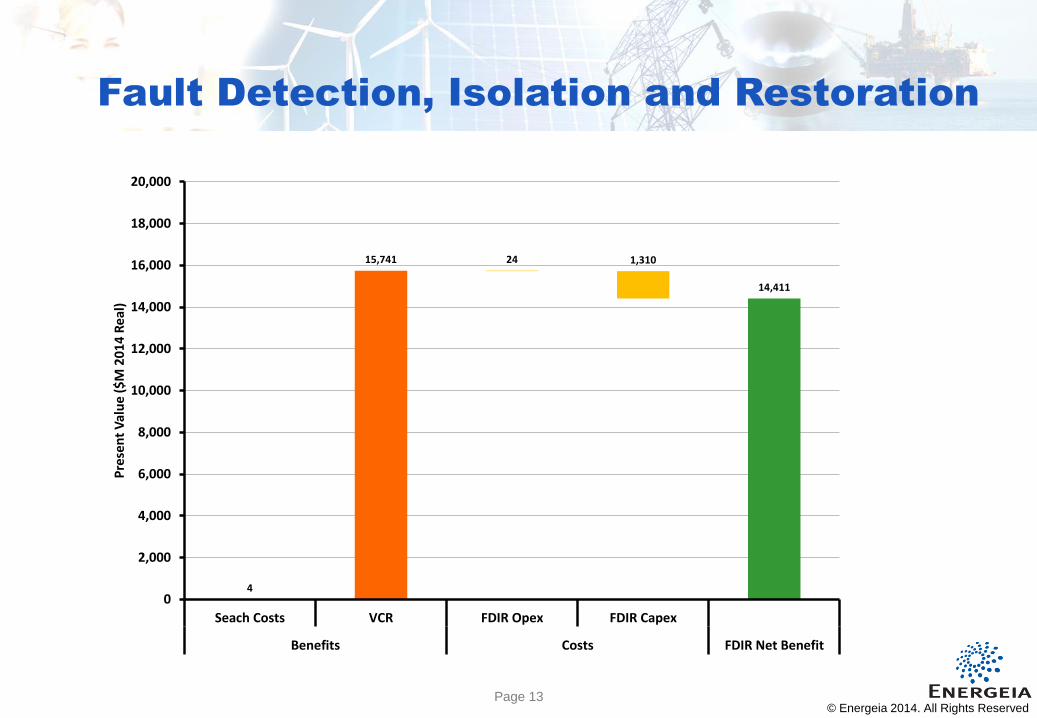
Page 13 13
4
15,741 24 1,310
14,411
0
2,000
4,000
6,000
8,000
10,000
12,000
14,000
16,000
18,000
20,000
Seach Costs VCR FDIR Opex FDIR Capex
Benefits Costs FDIR Net Benefit
Pre
sen
t V
alu
e (
$M
20
14
Re
al)
Fault Detection, Isolation and Restoration
© Energeia 2014. All Rights Reserved
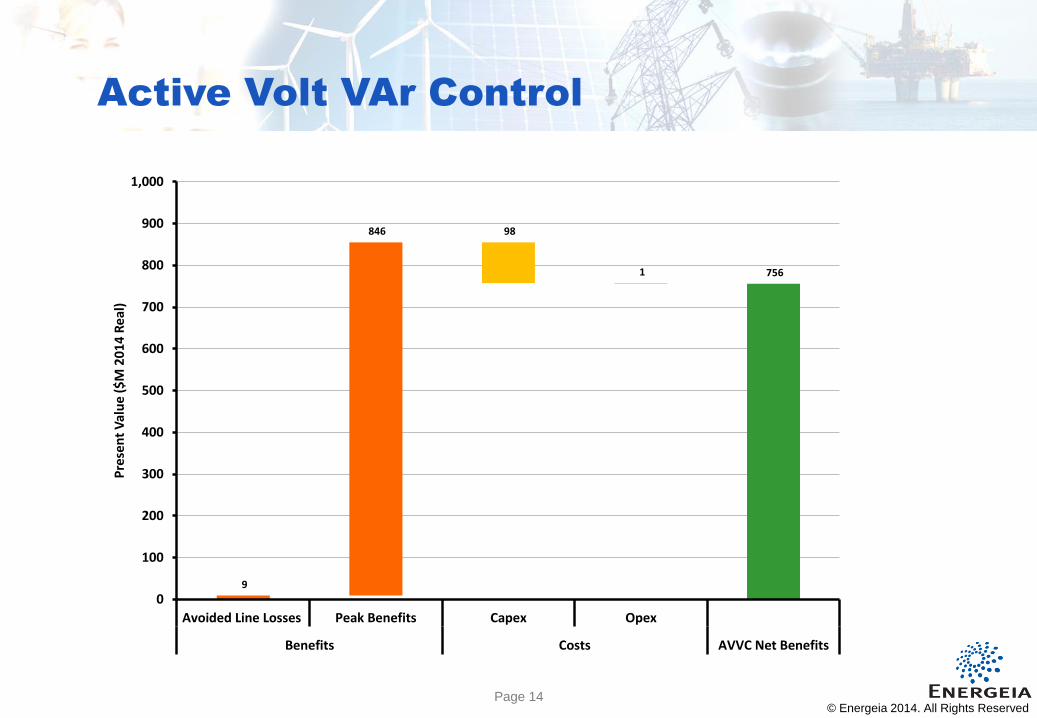
Page 14 14
9
846 98
1 756
0
100
200
300
400
500
600
700
800
900
1,000
Avoided Line Losses Peak Benefits Capex Opex
Benefits Costs AVVC Net Benefits
Pre
sen
t V
alu
e (
$M
20
14
Re
al)
Active Volt VAr Control
© Energeia 2014. All Rights Reserved
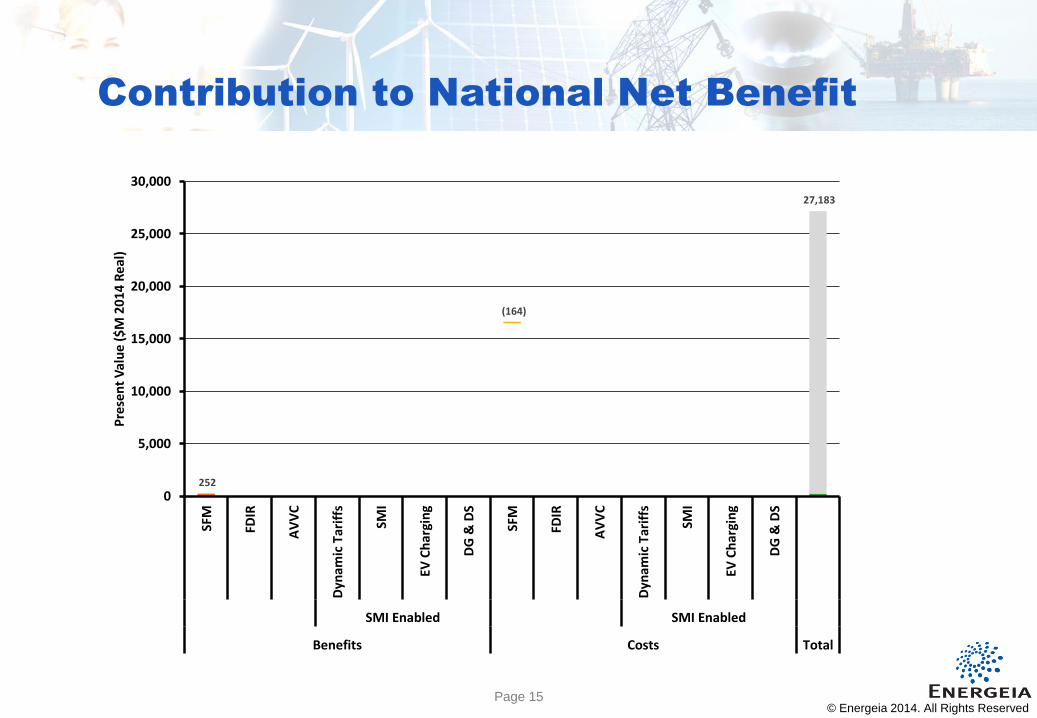
Page 15 15
252
(164)
27,183
0
5,000
10,000
15,000
20,000
25,000
30,000
SFM
FDIR
AV
VC
Dyn
amic
Tar
iffs
SMI
EV C
har
gin
g
DG
& D
S
SFM
FDIR
AV
VC
Dyn
amic
Tar
iffs
SMI
EV C
har
gin
g
DG
& D
S
SMI Enabled SMI Enabled
Benefits Costs Total
Pre
sen
t V
alu
e (
$M
20
14
Re
al)
Contribution to National Net Benefit
© Energeia 2014. All Rights Reserved

Page 16 16
252
15,745 (164) (1,334)
27,183
0
5,000
10,000
15,000
20,000
25,000
30,000
SFM
FDIR
AV
VC
Dyn
amic
Tar
iffs
SMI
EV C
har
gin
g
DG
& D
S
SFM
FDIR
AV
VC
Dyn
amic
Tar
iffs
SMI
EV C
har
gin
g
DG
& D
S
SMI Enabled SMI Enabled
Benefits Costs Total
Pre
sen
t V
alu
e (
$M
20
14
Re
al)
Contribution to National Net Benefit
© Energeia 2014. All Rights Reserved
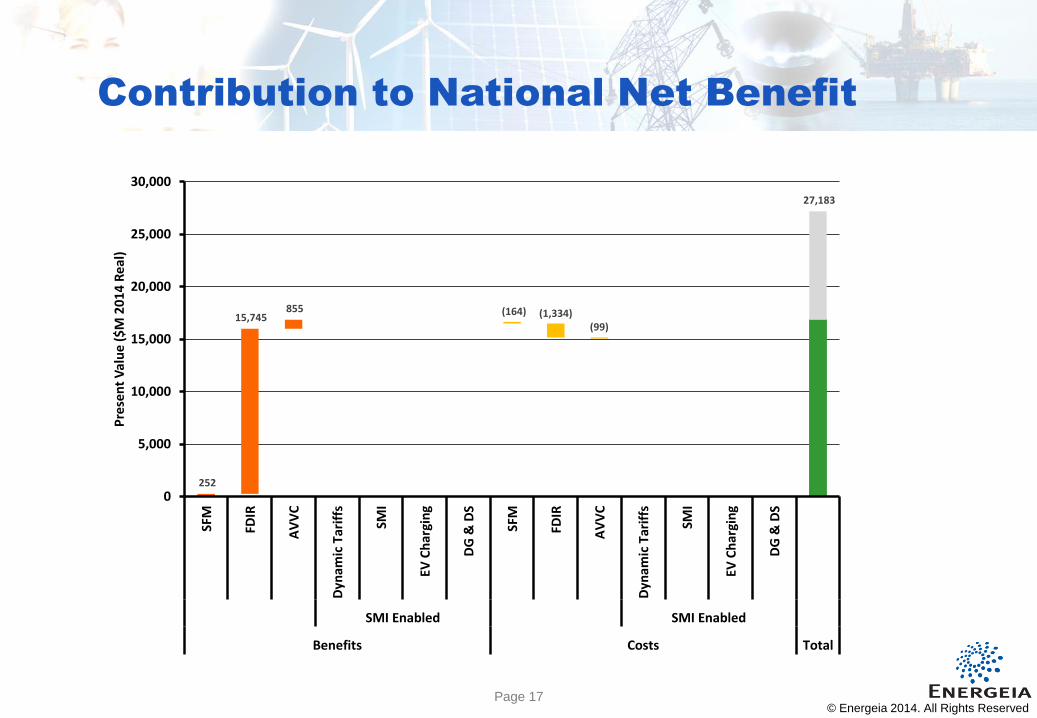
Page 17 17
252
15,745 855 (164) (1,334)
(99)
27,183
0
5,000
10,000
15,000
20,000
25,000
30,000
SFM
FDIR
AV
VC
Dyn
amic
Tar
iffs
SMI
EV C
har
gin
g
DG
& D
S
SFM
FDIR
AV
VC
Dyn
amic
Tar
iffs
SMI
EV C
har
gin
g
DG
& D
S
SMI Enabled SMI Enabled
Benefits Costs Total
Pre
sen
t V
alu
e (
$M
20
14
Re
al)
Contribution to National Net Benefit
© Energeia 2014. All Rights Reserved

Page 18 18
252
15,745 855
3,635
(164) (1,334)(99) (2,514)
27,183
0
5,000
10,000
15,000
20,000
25,000
30,000
SFM
FDIR
AV
VC
Dyn
amic
Tar
iffs
SMI
EV C
har
gin
g
DG
& D
S
SFM
FDIR
AV
VC
Dyn
amic
Tar
iffs
SMI
EV C
har
gin
g
DG
& D
S
SMI Enabled SMI Enabled
Benefits Costs Total
Pre
sen
t V
alu
e (
$M
20
14
Re
al)
Contribution to National Net Benefit
© Energeia 2014. All Rights Reserved
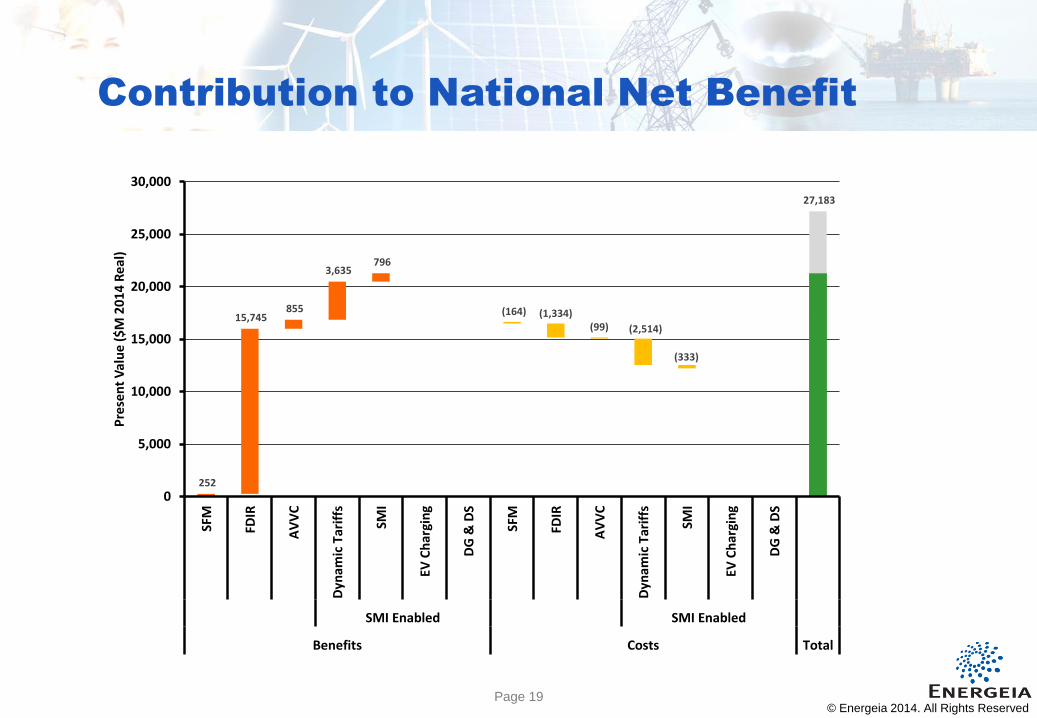
Page 19 19
252
15,745 855
3,635 796
(164) (1,334)(99) (2,514)
(333)
27,183
0
5,000
10,000
15,000
20,000
25,000
30,000
SFM
FDIR
AV
VC
Dyn
amic
Tar
iffs
SMI
EV C
har
gin
g
DG
& D
S
SFM
FDIR
AV
VC
Dyn
amic
Tar
iffs
SMI
EV C
har
gin
g
DG
& D
S
SMI Enabled SMI Enabled
Benefits Costs Total
Pre
sen
t V
alu
e (
$M
20
14
Re
al)
Contribution to National Net Benefit
© Energeia 2014. All Rights Reserved
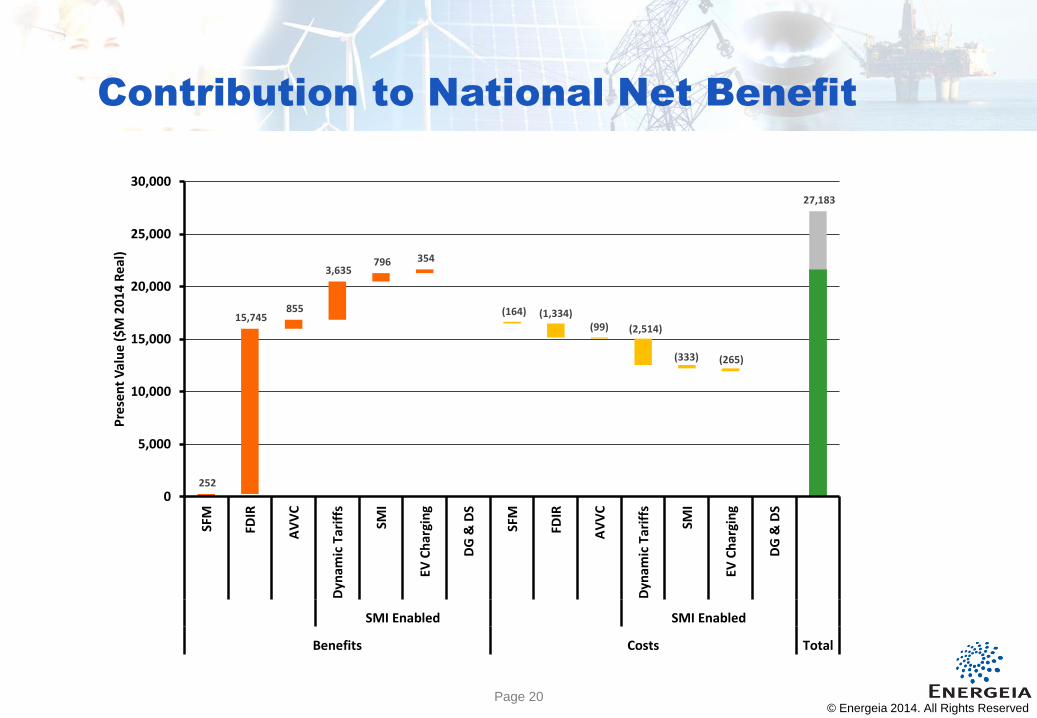
Page 20 20
252
15,745 855
3,635 796 354
(164) (1,334)(99) (2,514)
(333) (265)
27,183
0
5,000
10,000
15,000
20,000
25,000
30,000
SFM
FDIR
AV
VC
Dyn
amic
Tar
iffs
SMI
EV C
har
gin
g
DG
& D
S
SFM
FDIR
AV
VC
Dyn
amic
Tar
iffs
SMI
EV C
har
gin
g
DG
& D
S
SMI Enabled SMI Enabled
Benefits Costs Total
Pre
sen
t V
alu
e (
$M
20
14
Re
al)
Contribution to National Net Benefit
© Energeia 2014. All Rights Reserved
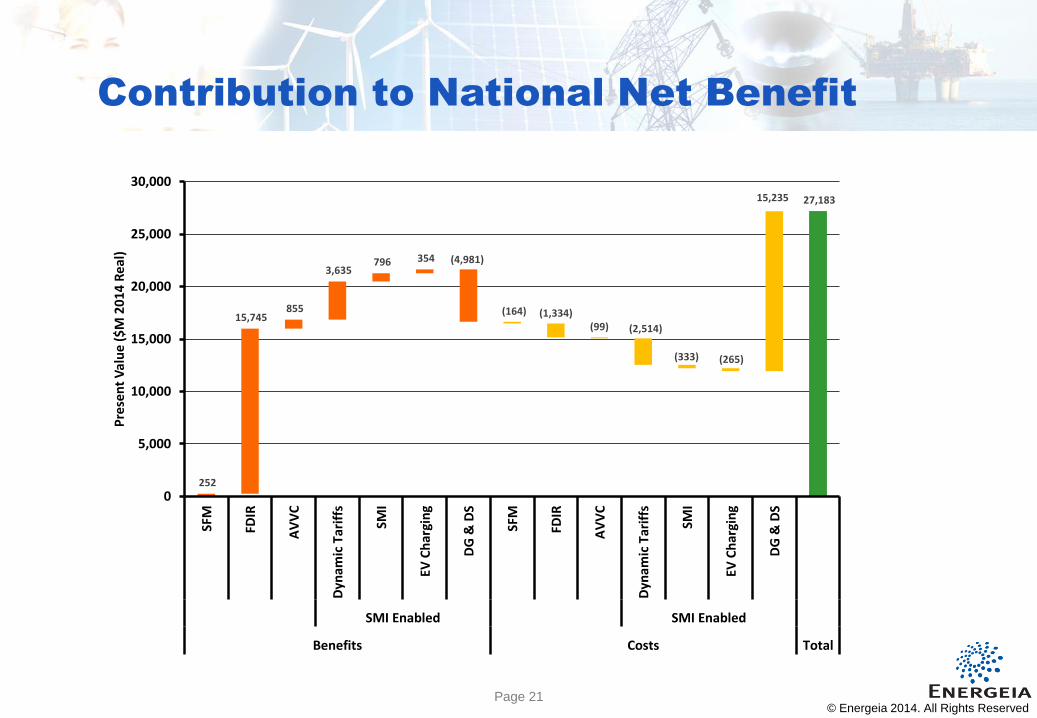
Page 21 21
252
15,745 855
3,635 796 354 (4,981)
(164) (1,334)(99) (2,514)
(333) (265)
15,235 27,183
0
5,000
10,000
15,000
20,000
25,000
30,000
SFM
FDIR
AV
VC
Dyn
amic
Tar
iffs
SMI
EV C
har
gin
g
DG
& D
S
SFM
FDIR
AV
VC
Dyn
amic
Tar
iffs
SMI
EV C
har
gin
g
DG
& D
S
SMI Enabled SMI Enabled
Benefits Costs Total
Pre
sen
t V
alu
e (
$M
20
14
Re
al)
Contribution to National Net Benefit
© Energeia 2014. All Rights Reserved
Page 22 22
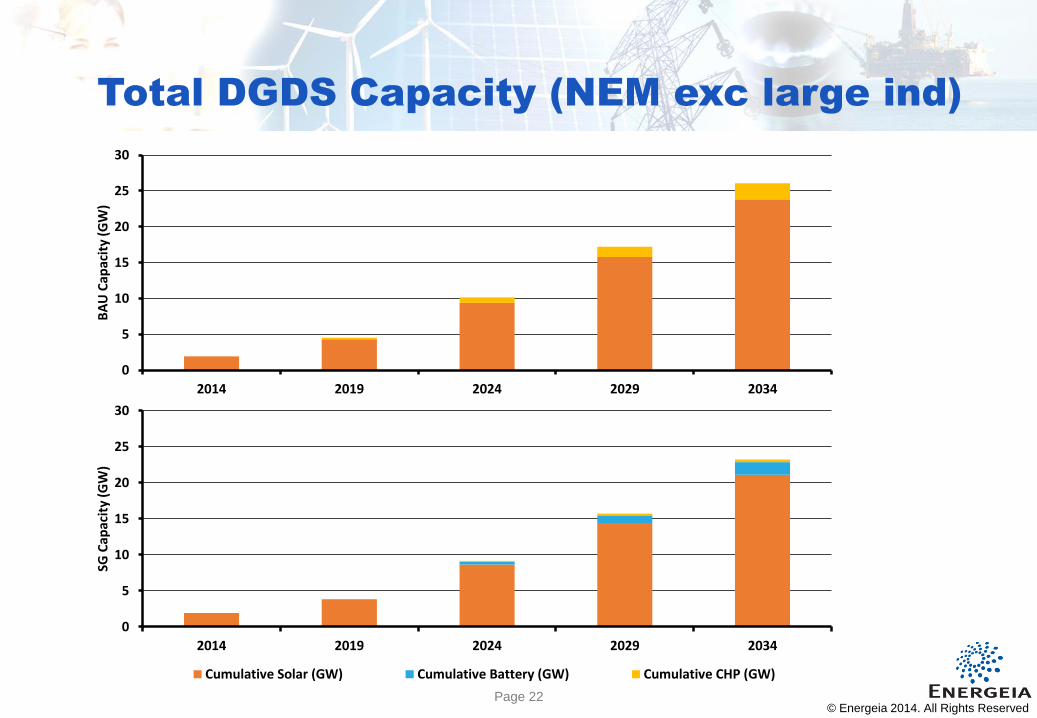
Total DGDS Capacity (NEM exc large ind)
© Energeia 2014. All Rights Reserved
0
5
10
15
20
25
30
2014 2019 2024 2029 2034
BA
U C
apac
ity
(GW
)
Cumulative Solar (GW) Cumulative Battery (GW) Cumulative CHP (GW)
0
5
10
15
20
25
30
2014 2019 2024 2029 2034
SG C
apac
ity
(GW
)
Cumulative Solar (GW) Cumulative Battery (GW) Cumulative CHP (GW)
Page 23 23
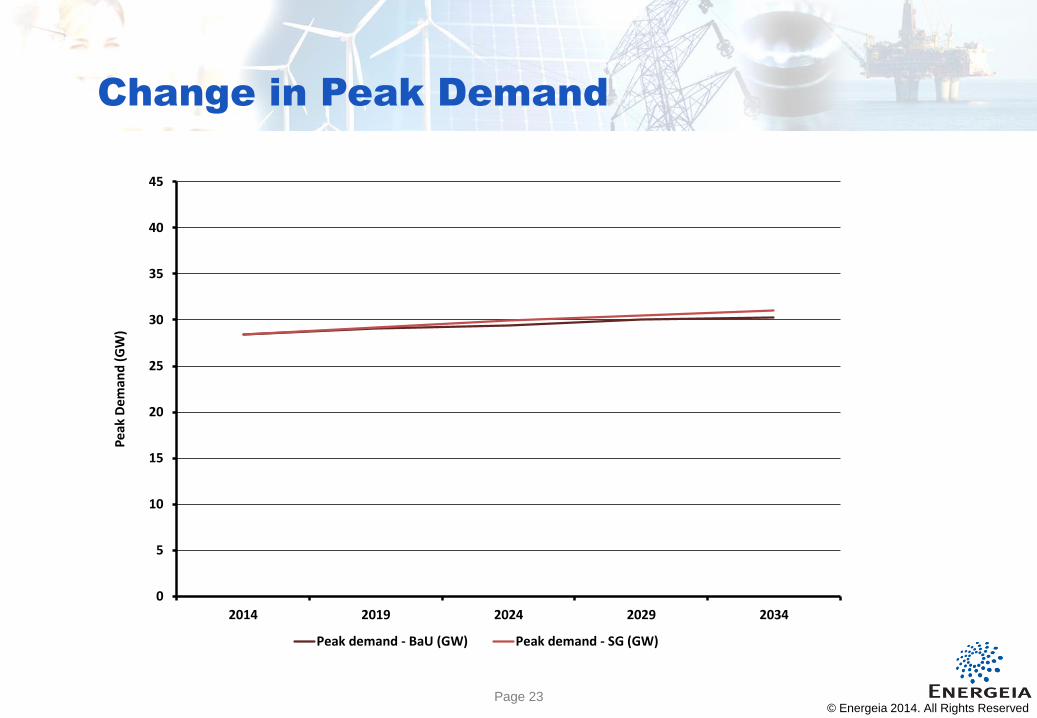
Change in Peak Demand
© Energeia 2014. All Rights Reserved
0
5
10
15
20
25
30
35
40
45
2014 2019 2024 2029 2034
Pe
ak D
em
and
(G
W)
Peak demand - BaU (GW) Peak demand - SG (GW)
Page 24 24
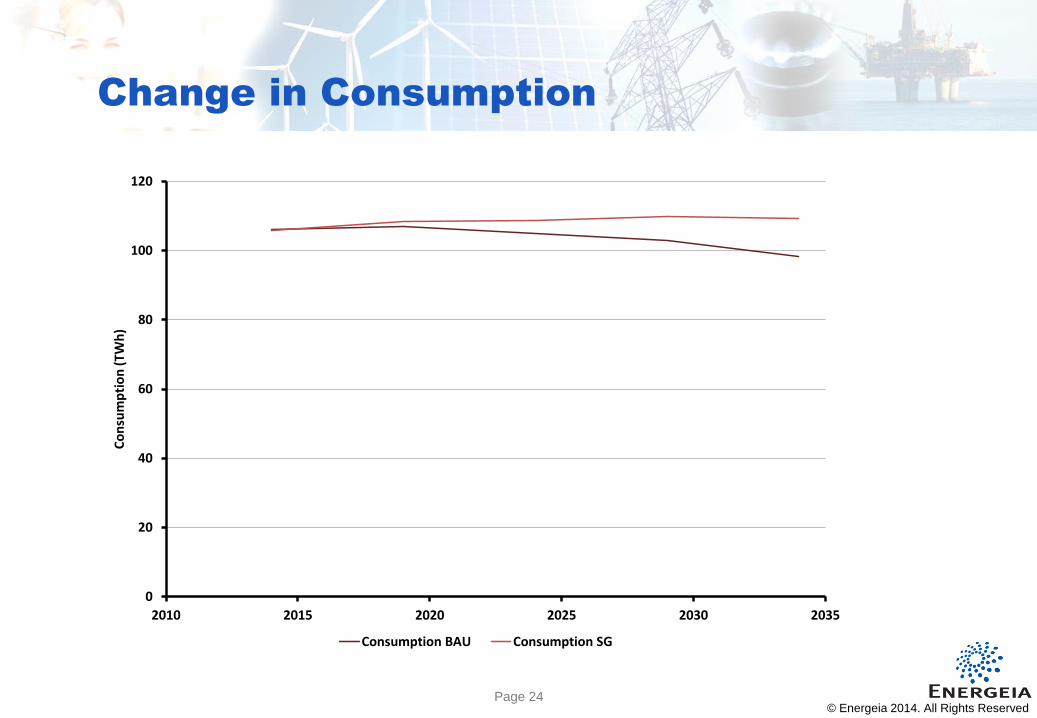
Change in Consumption
© Energeia 2014. All Rights Reserved
0
20
40
60
80
100
120
2010 2015 2020 2025 2030 2035
Co
nsu
mp
tio
n (
TWh
)
Consumption BAU Consumption SG
Page 25 25
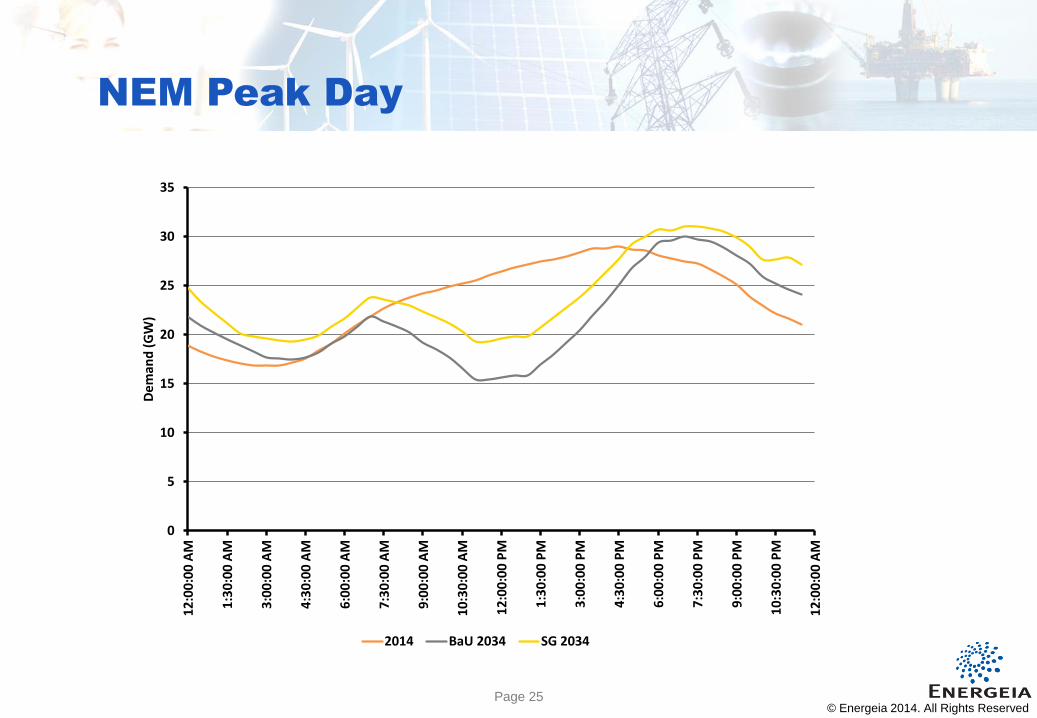
0
5
10
15
20
25
30
351
2:0
0:0
0 A
M
1:3
0:0
0 A
M
3:0
0:0
0 A
M
4:3
0:0
0 A
M
6:0
0:0
0 A
M
7:3
0:0
0 A
M
9:0
0:0
0 A
M
10
:30
:00
AM
12
:00
:00
PM
1:3
0:0
0 P
M
3:0
0:0
0 P
M
4:3
0:0
0 P
M
6:0
0:0
0 P
M
7:3
0:0
0 P
M
9:0
0:0
0 P
M
10
:30
:00
PM
12
:00
:00
AM
De
man
d (
GW
)
2014 BaU 2034 SG 2034
NEM Peak Day
© Energeia 2014. All Rights Reserved
Page 26 Page 26
Strategic context
Page 27 Page 27
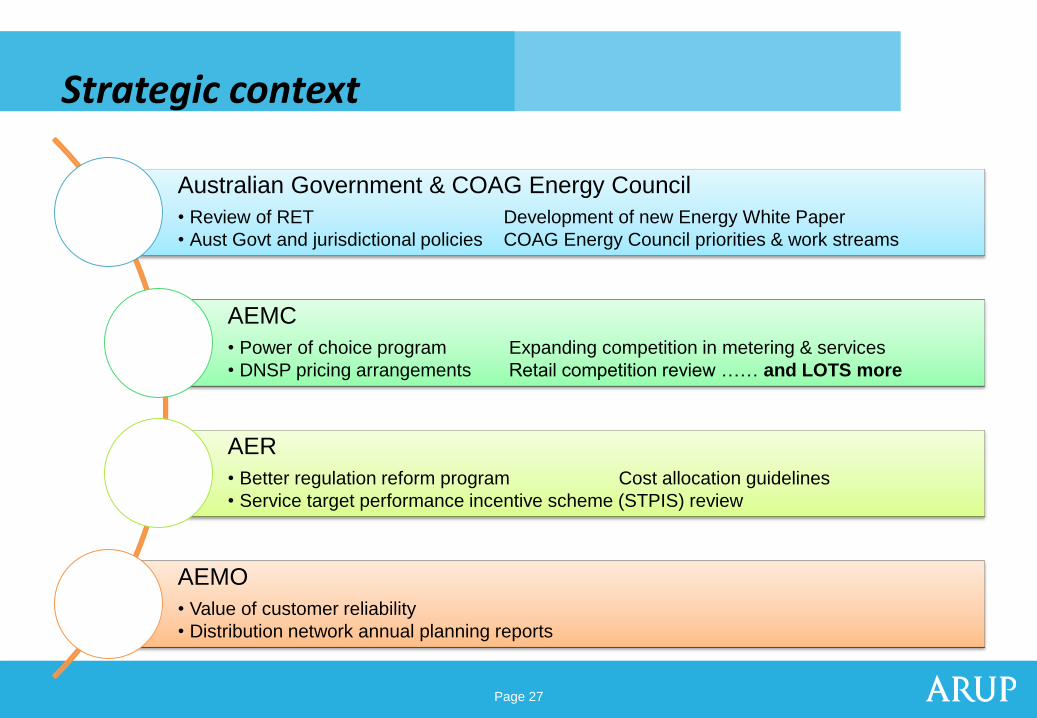
Strategic context
Australian Government & COAG Energy Council
• Review of RET Development of new Energy White Paper
• Aust Govt and jurisdictional policies COAG Energy Council priorities & work streams
AEMC
• Power of choice program Expanding competition in metering & services
• DNSP pricing arrangements Retail competition review …… and LOTS more
AER
• Better regulation reform program Cost allocation guidelines
• Service target performance incentive scheme (STPIS) review
AEMO
• Value of customer reliability
• Distribution network annual planning reports
Page 28 Page 28
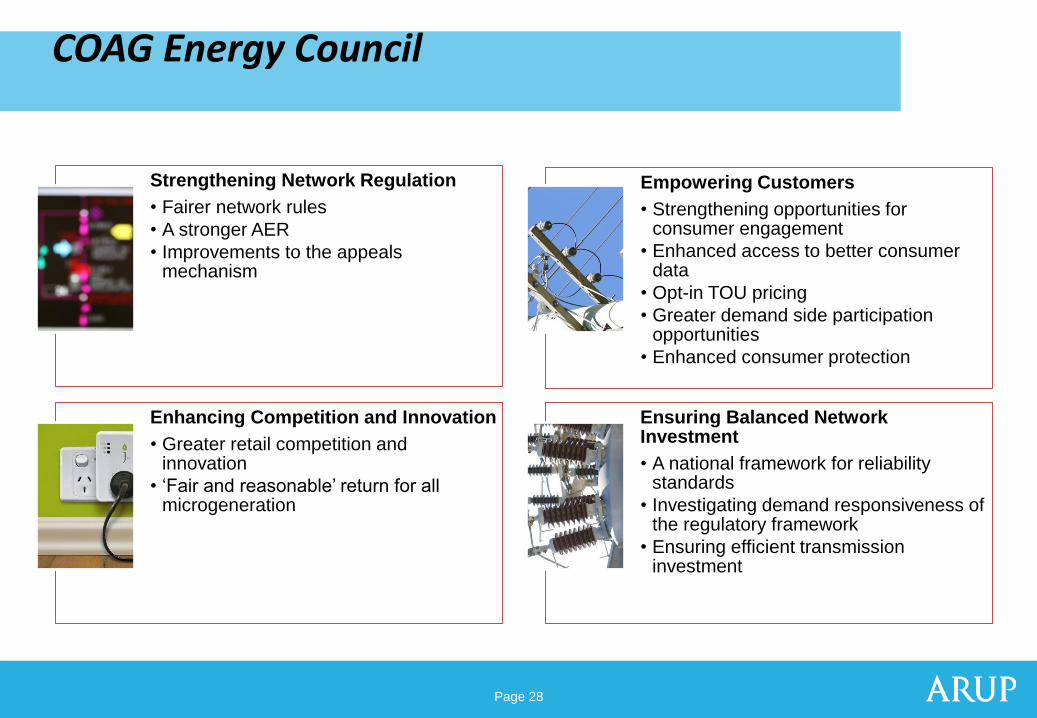
COAG Energy Council
Strengthening Network Regulation
• Fairer network rules
• A stronger AER
• Improvements to the appeals mechanism
Empowering Customers
• Strengthening opportunities for consumer engagement
• Enhanced access to better consumer data
• Opt-in TOU pricing
• Greater demand side participation opportunities
• Enhanced consumer protection
Enhancing Competition and Innovation
• Greater retail competition and innovation
• ‘Fair and reasonable’ return for all microgeneration
Ensuring Balanced Network Investment
• A national framework for reliability standards
• Investigating demand responsiveness of the regulatory framework
• Ensuring efficient transmission investment
Page 29 Page 29
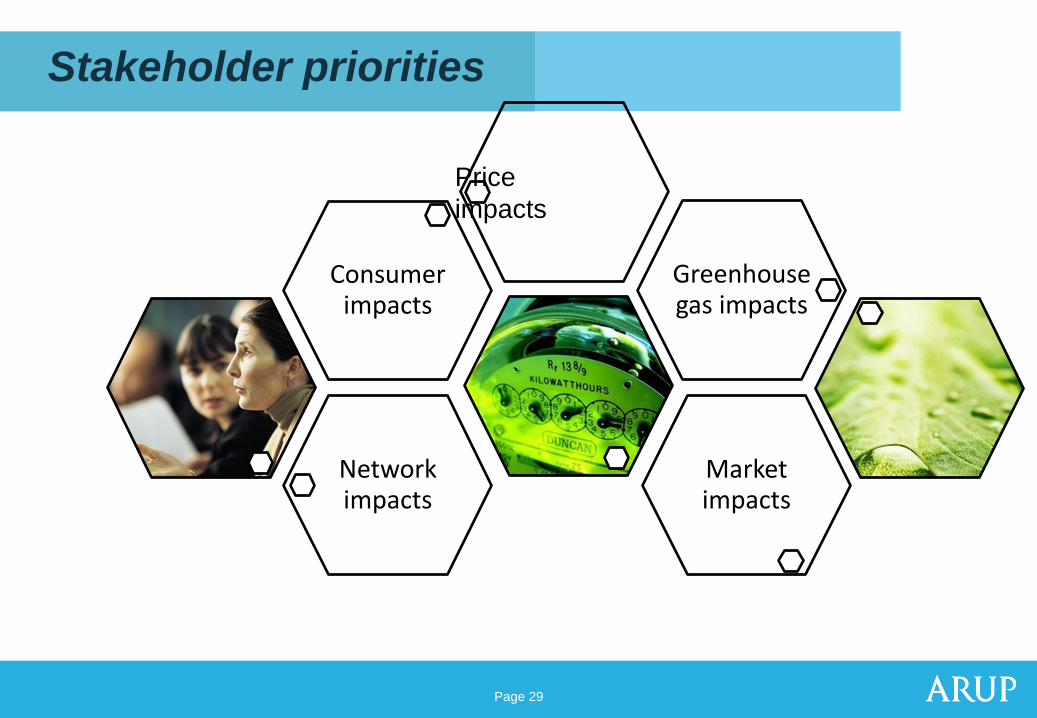
Stakeholder priorities
Network impacts
Market impacts
Consumer impacts
Greenhouse gas impacts
Price
impacts
Page 30 Page 30
Conclusions and
recommendations
Page 31 Page 31
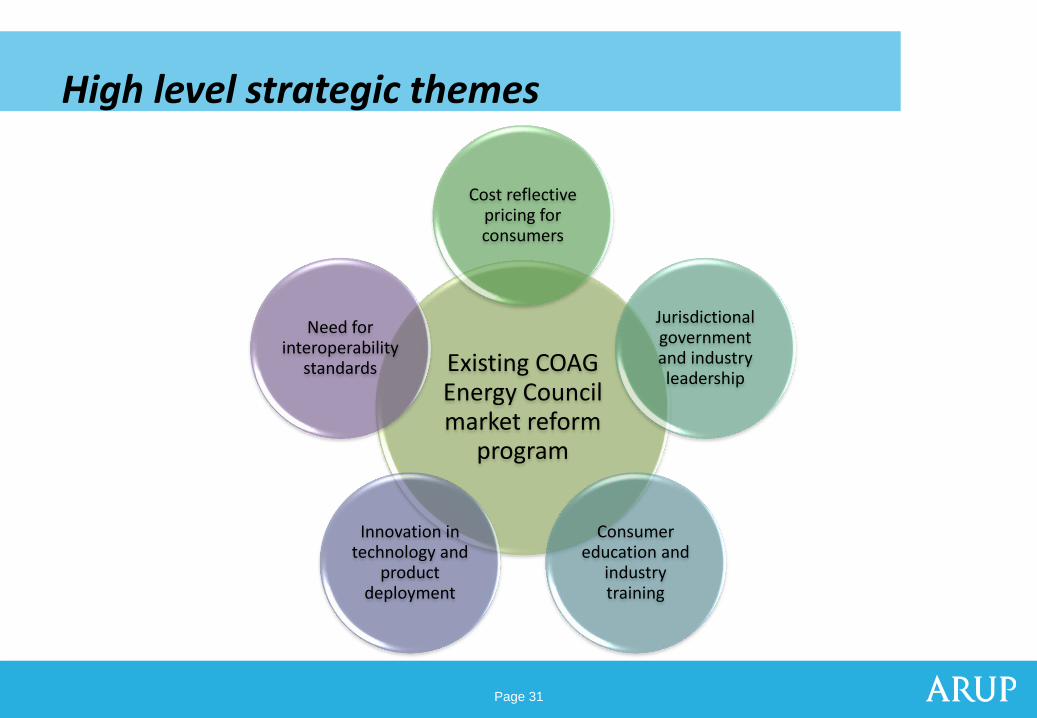
High level strategic themes
Existing COAG Energy Council market reform
program
Cost reflective pricing for consumers
Jurisdictional government and industry leadership
Consumer education and
industry training
Innovation in technology and
product deployment
Need for interoperability
standards
Page 32 Page 32
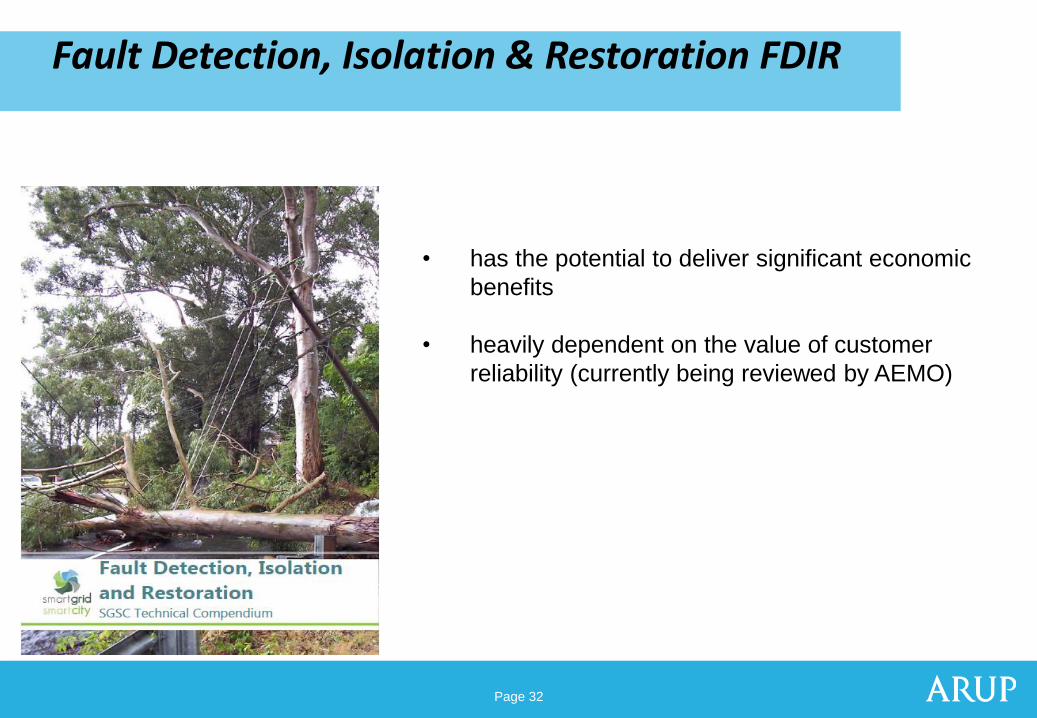
Fault Detection, Isolation & Restoration FDIR
• has the potential to deliver significant economic
benefits
• heavily dependent on the value of customer
reliability (currently being reviewed by AEMO)
Page 33 Page 33
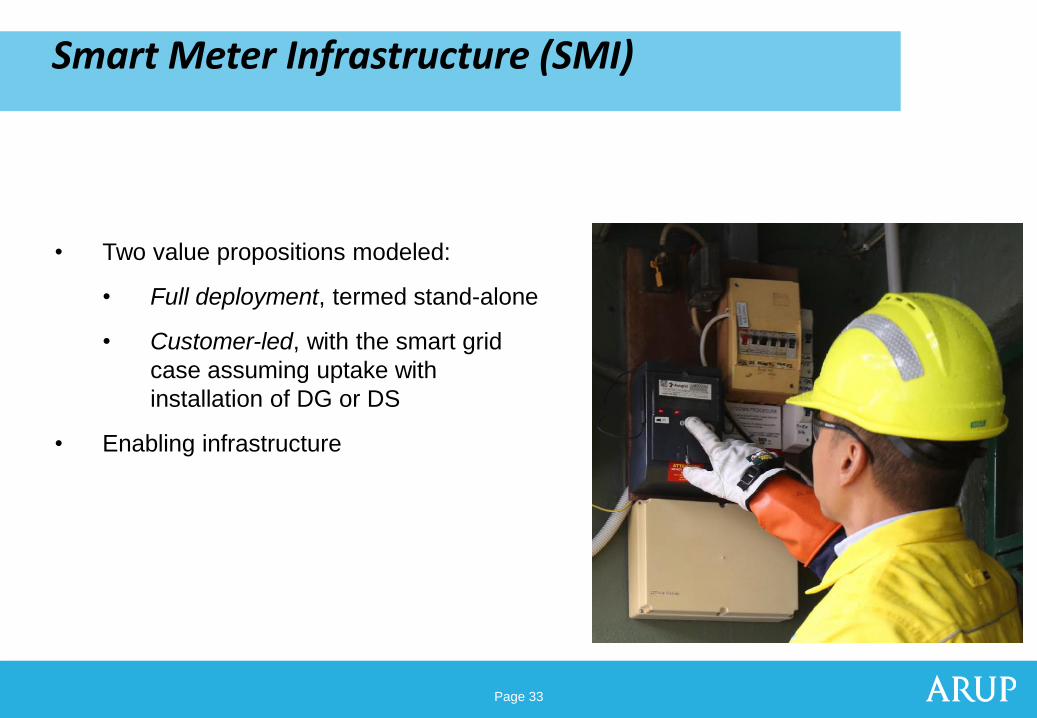
Smart Meter Infrastructure (SMI)
• Two value propositions modeled:
• Full deployment, termed stand-alone
• Customer-led, with the smart grid
case assuming uptake with
installation of DG or DS
• Enabling infrastructure
Page 34 Page 34
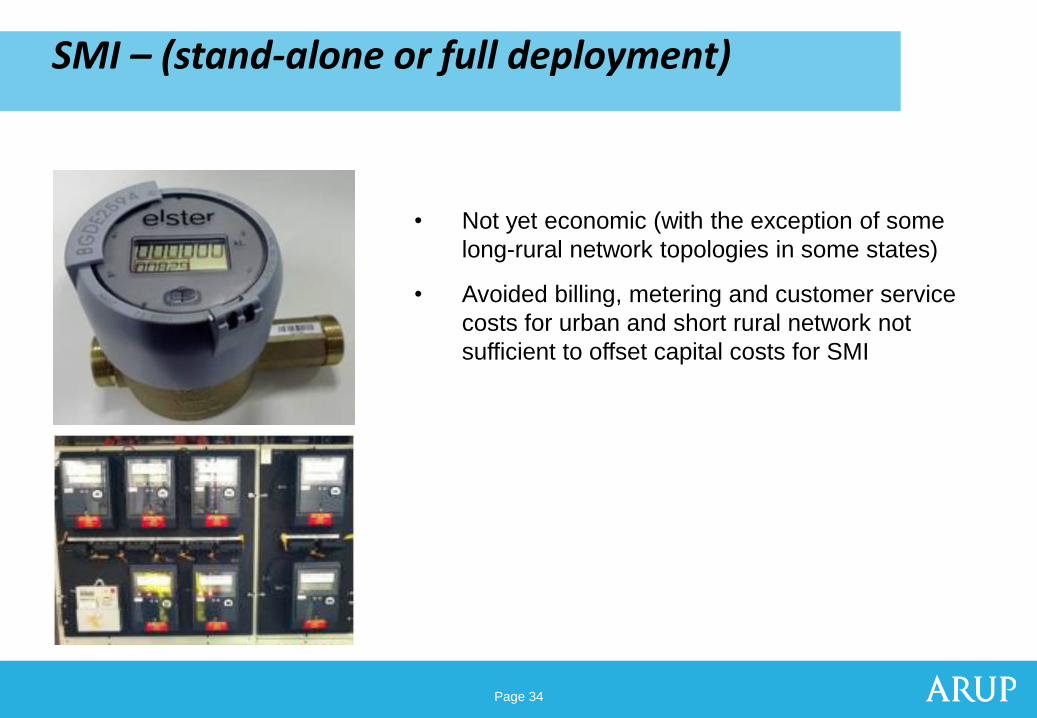
SMI – (stand-alone or full deployment)
• Not yet economic (with the exception of some
long-rural network topologies in some states)
• Avoided billing, metering and customer service
costs for urban and short rural network not
sufficient to offset capital costs for SMI
Page 35 Page 35
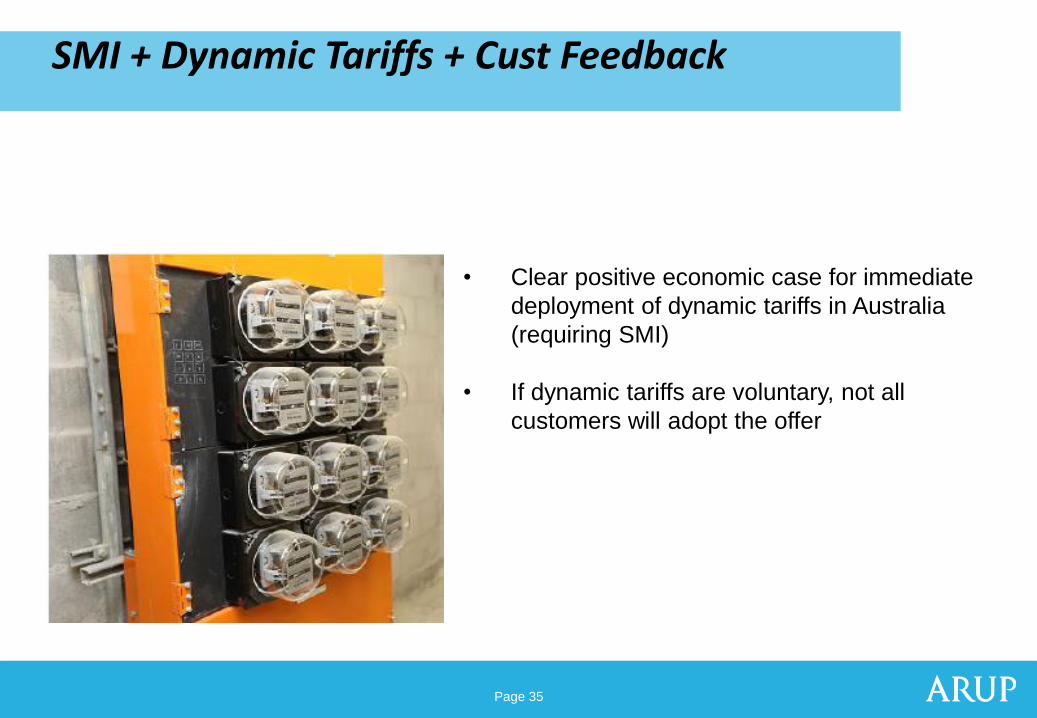
SMI + Dynamic Tariffs + Cust Feedback
• Clear positive economic case for immediate
deployment of dynamic tariffs in Australia
(requiring SMI)
• If dynamic tariffs are voluntary, not all
customers will adopt the offer
Page 36 Page 36
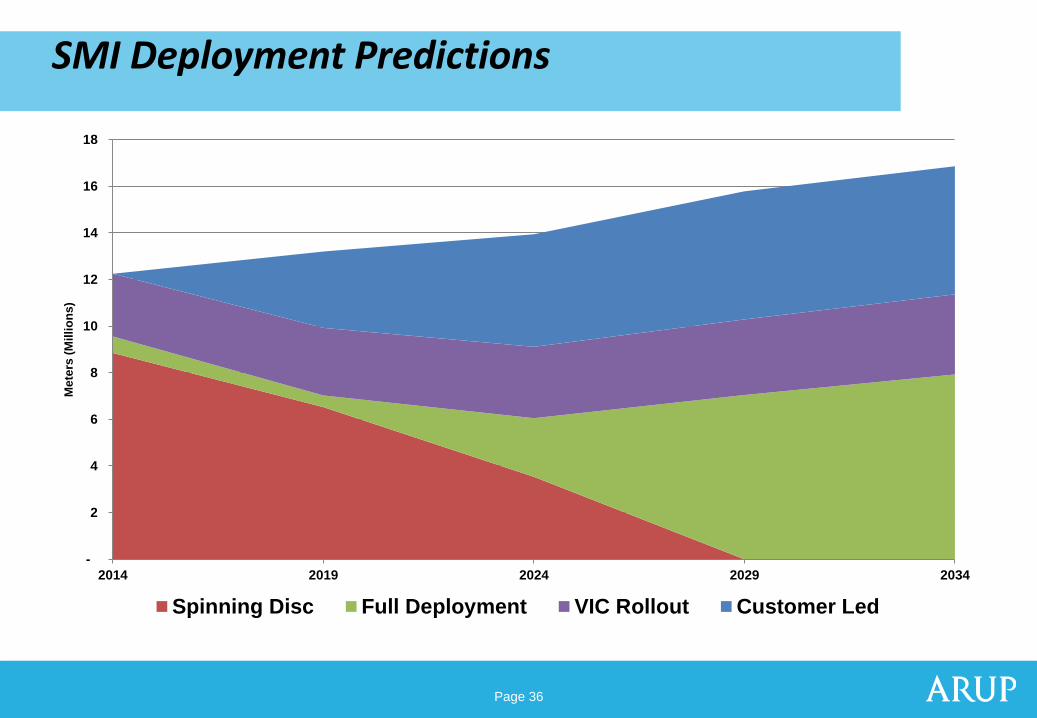
SMI Deployment Predictions
-
2
4
6
8
10
12
14
16
18
2014 2019 2024 2029 2034
Me
ters
(M
illi
on
s)
Spinning Disc Full Deployment VIC Rollout Customer Led
Page 37 Page 37
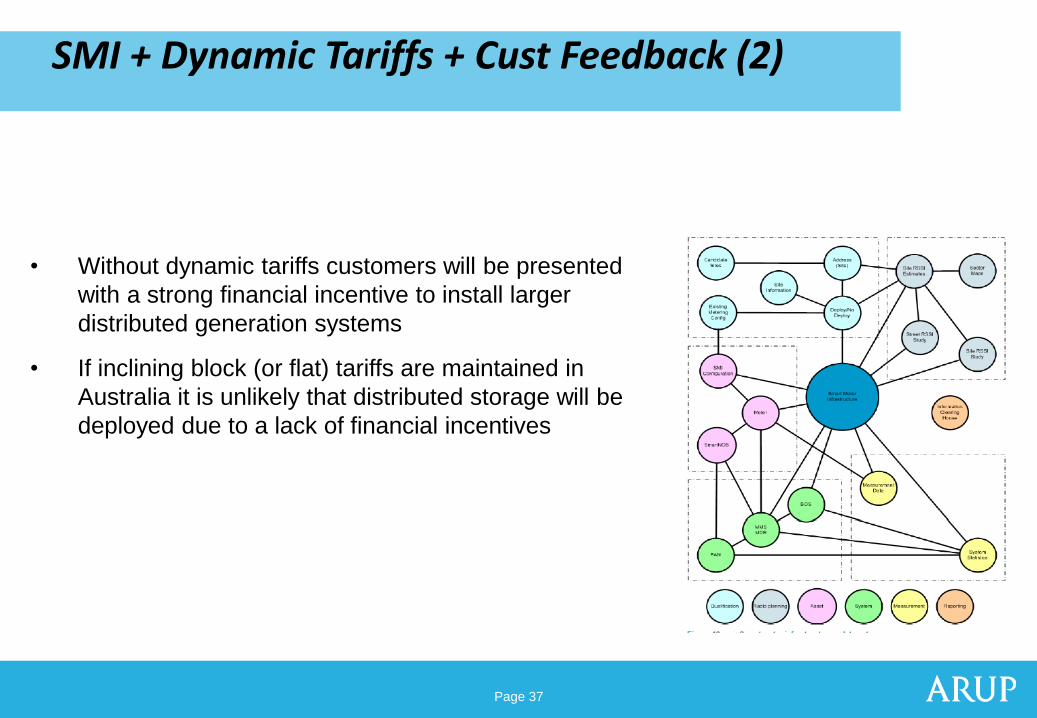
SMI + Dynamic Tariffs + Cust Feedback (2)
• Without dynamic tariffs customers will be presented
with a strong financial incentive to install larger
distributed generation systems
• If inclining block (or flat) tariffs are maintained in
Australia it is unlikely that distributed storage will be
deployed due to a lack of financial incentives
Page 38 Page 38
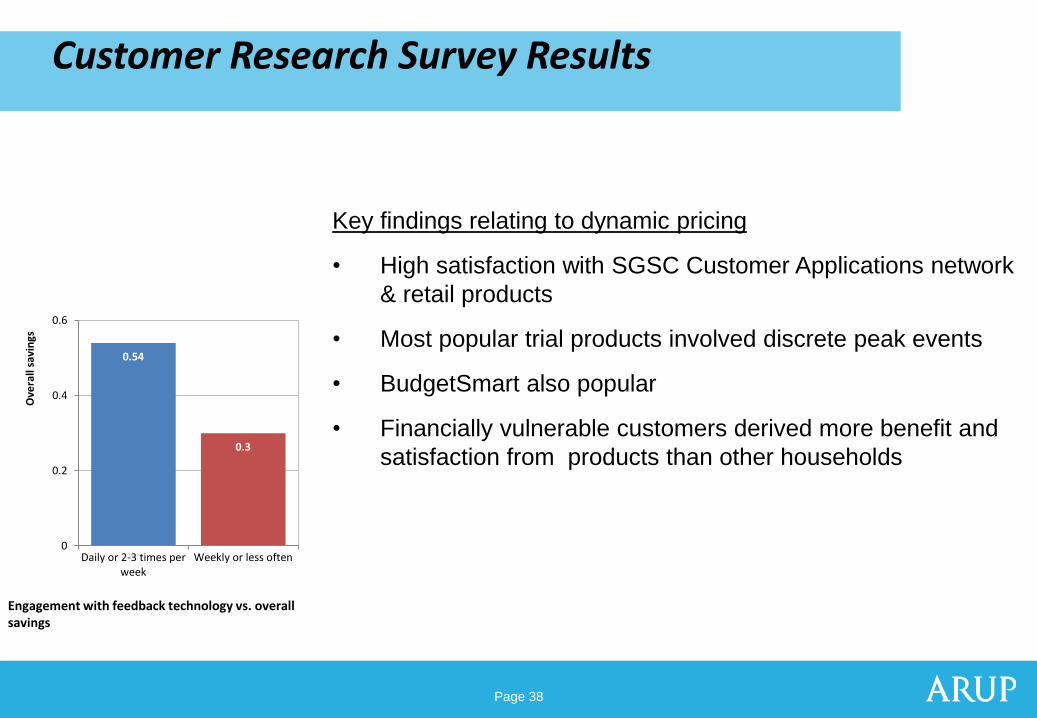
Customer Research Survey Results
Key findings relating to dynamic pricing
• High satisfaction with SGSC Customer Applications network
& retail products
• Most popular trial products involved discrete peak events
• BudgetSmart also popular
• Financially vulnerable customers derived more benefit and
satisfaction from products than other households
Engagement with feedback technology vs. overall savings
0.54
0.3
0
0.2
0.4
0.6
Daily or 2-3 times perweek
Weekly or less often
Ove
rall
savi
ngs
Page 39 Page 39
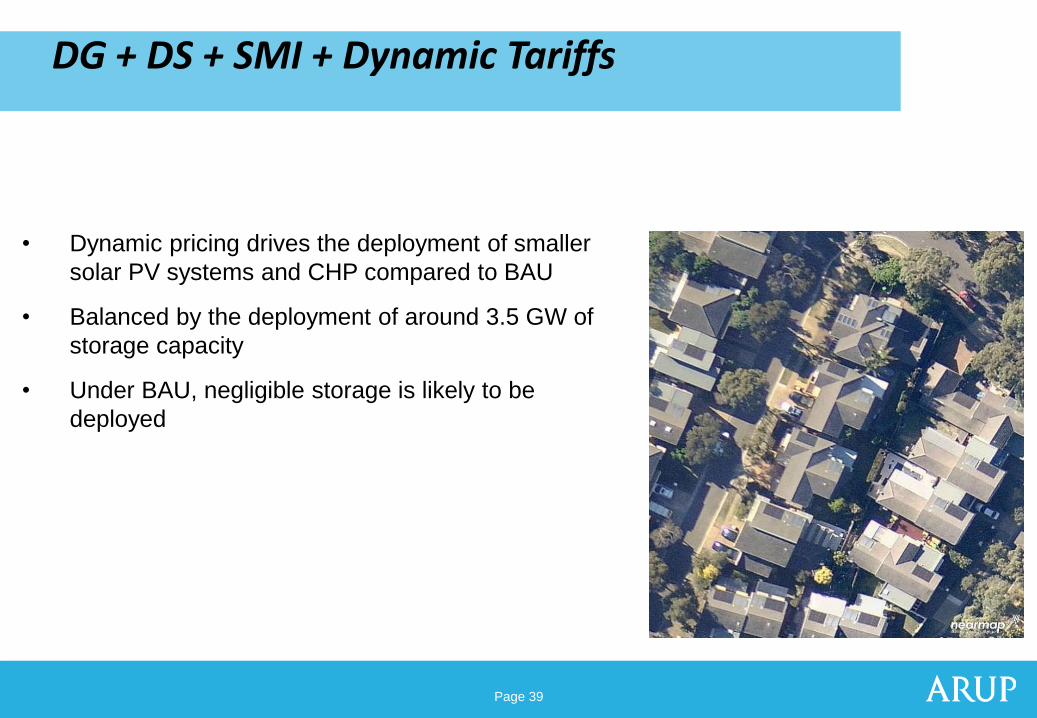
DG + DS + SMI + Dynamic Tariffs
• Dynamic pricing drives the deployment of smaller
solar PV systems and CHP compared to BAU
• Balanced by the deployment of around 3.5 GW of
storage capacity
• Under BAU, negligible storage is likely to be
deployed
Page 40 Page 40
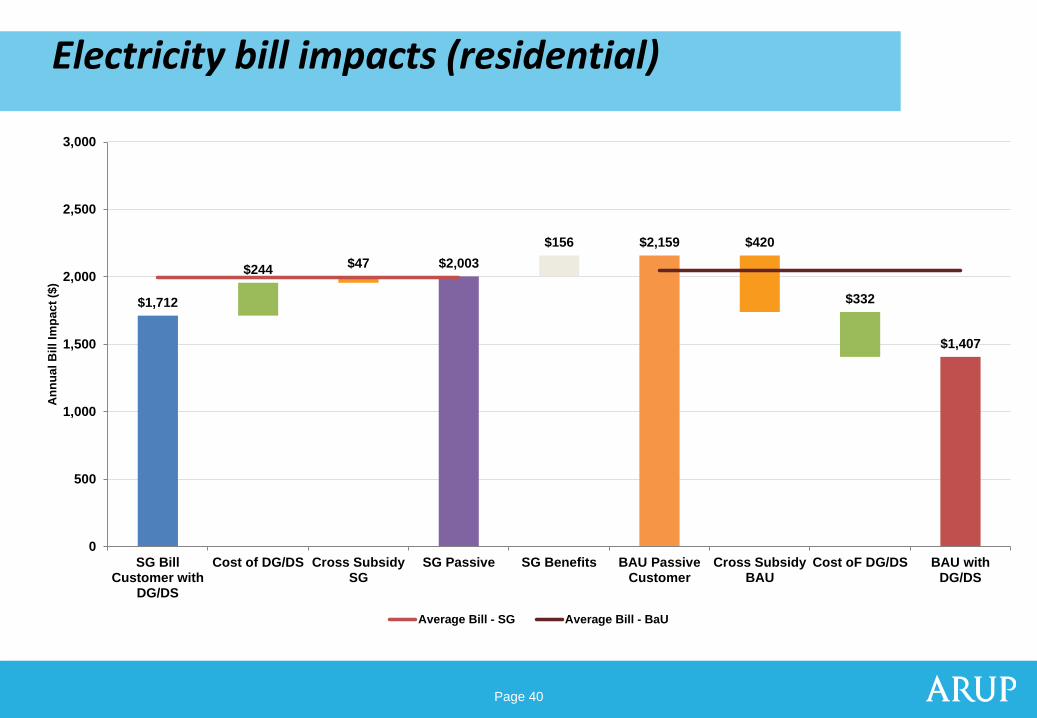
Electricity bill impacts (residential)
$1,712
$244 $47 $2,003
$156 $2,159 $420
$332
$1,407
0
500
1,000
1,500
2,000
2,500
3,000
SG BillCustomer with
DG/DS
Cost of DG/DS Cross SubsidySG
SG Passive SG Benefits BAU PassiveCustomer
Cross SubsidyBAU
Cost oF DG/DS BAU withDG/DS
An
nu
al
Bil
l Im
pa
ct
($)
Average Bill - SG Average Bill - BaU
Page 41 Page 41
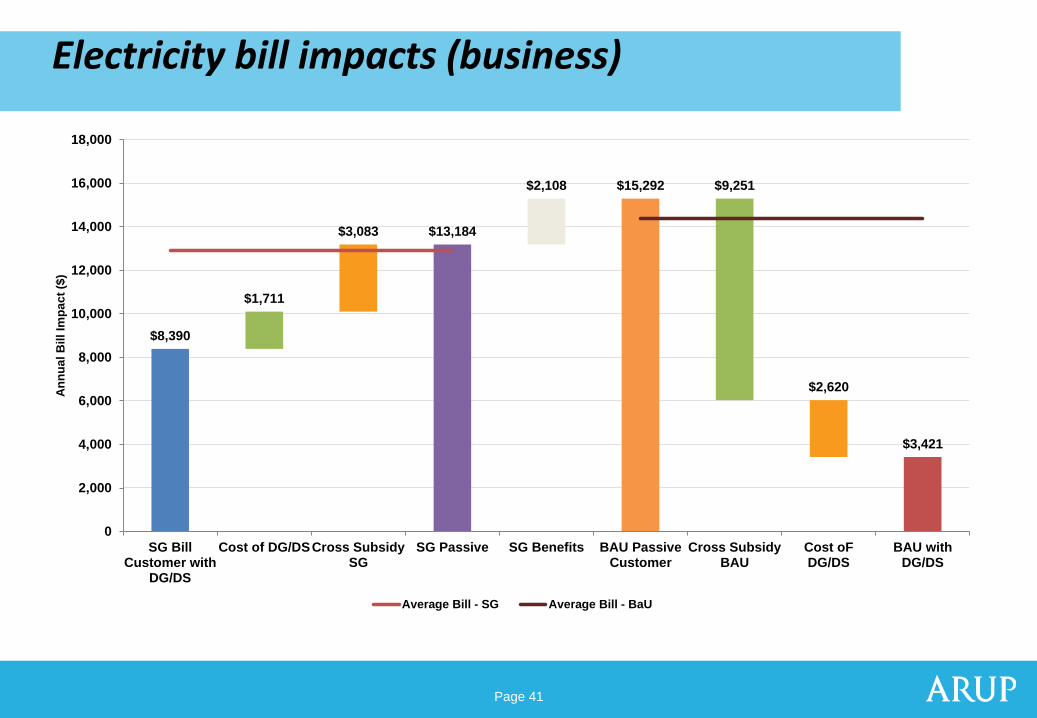
Electricity bill impacts (business)
$8,390
$1,711
$3,083 $13,184
$2,108 $15,292 $9,251
$2,620
$3,421
0
2,000
4,000
6,000
8,000
10,000
12,000
14,000
16,000
18,000
SG BillCustomer with
DG/DS
Cost of DG/DSCross SubsidySG
SG Passive SG Benefits BAU PassiveCustomer
Cross SubsidyBAU
Cost oFDG/DS
BAU withDG/DS
An
nu
al
Bil
l Im
pa
ct
($)
Average Bill - SG Average Bill - BaU
Page 42 Page 42
Transitioning to a smart grid future
Page 43 Page 43
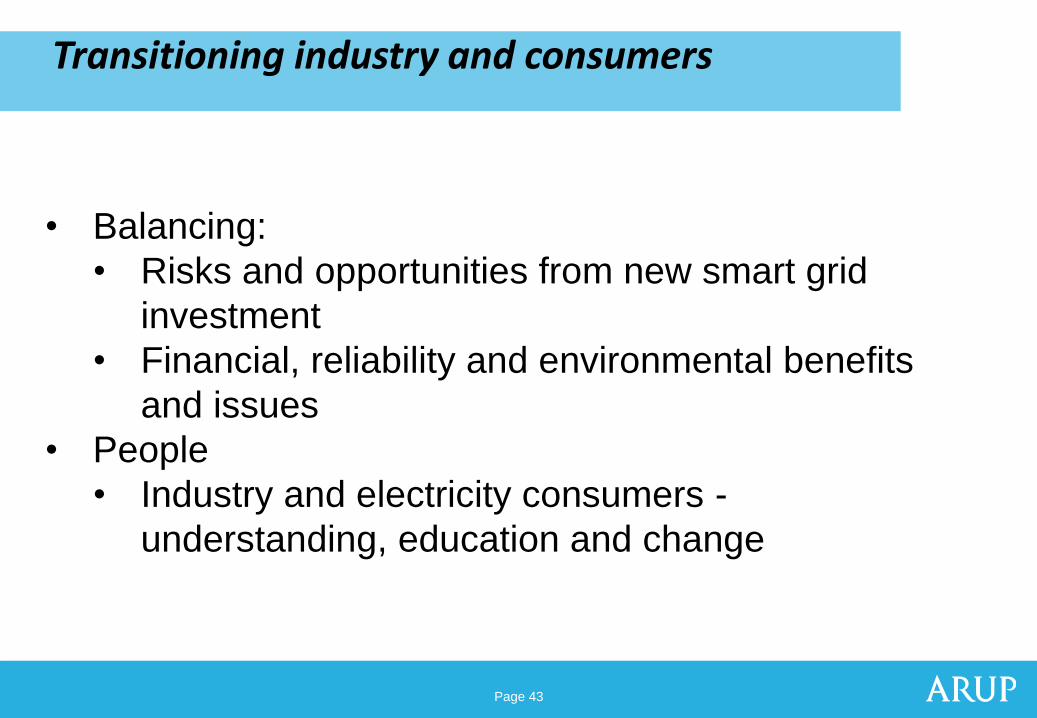
Transitioning industry and consumers
• Balancing:
• Risks and opportunities from new smart grid
investment
• Financial, reliability and environmental benefits
and issues
• People
• Industry and electricity consumers -
understanding, education and change
Page 44 Page 44
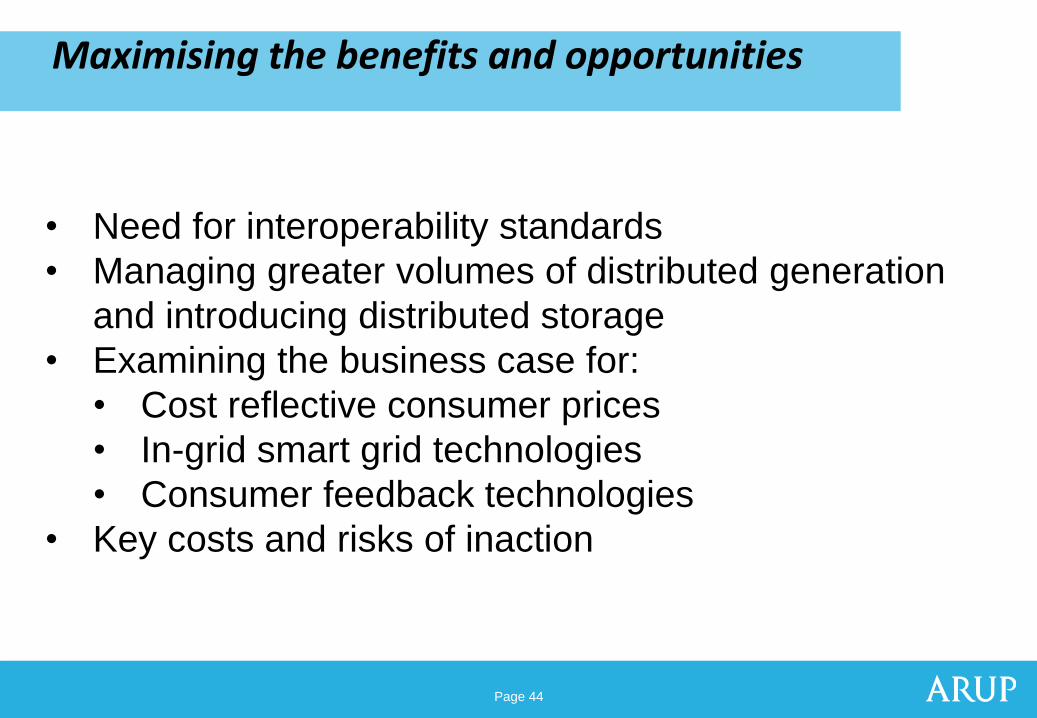
Maximising the benefits and opportunities
• Need for interoperability standards
• Managing greater volumes of distributed generation
and introducing distributed storage
• Examining the business case for:
• Cost reflective consumer prices
• In-grid smart grid technologies
• Consumer feedback technologies
• Key costs and risks of inaction
Page 45
Post SGSC Developments
Page 46
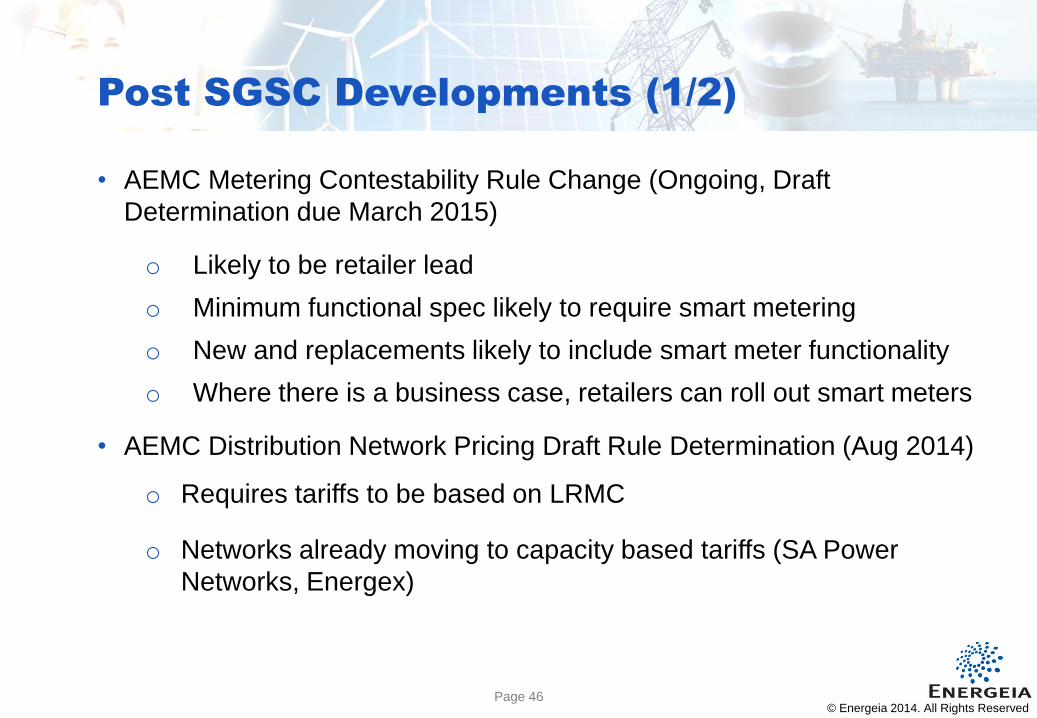
Post SGSC Developments (1/2)
© Energeia 2014. All Rights Reserved
• AEMC Metering Contestability Rule Change (Ongoing, Draft
Determination due March 2015)
o Likely to be retailer lead
o Minimum functional spec likely to require smart metering
o New and replacements likely to include smart meter functionality
o Where there is a business case, retailers can roll out smart meters
• AEMC Distribution Network Pricing Draft Rule Determination (Aug 2014)
o Requires tariffs to be based on LRMC
o Networks already moving to capacity based tariffs (SA Power
Networks, Energex)
Page 47
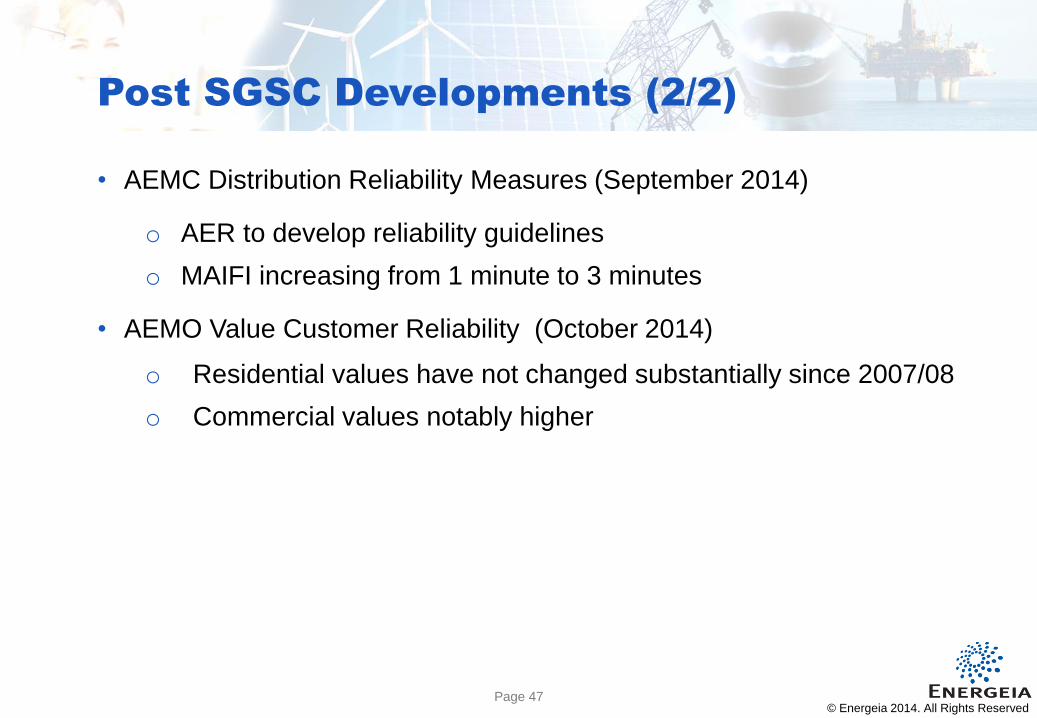
Post SGSC Developments (2/2)
© Energeia 2014. All Rights Reserved
• AEMC Distribution Reliability Measures (September 2014)
o AER to develop reliability guidelines
o MAIFI increasing from 1 minute to 3 minutes
• AEMO Value Customer Reliability (October 2014)
o Residential values have not changed substantially since 2007/08
o Commercial values notably higher
Page 48
Thank You
Arup Energeia
Level 10
201 Kent Street
Sydney NSW 2000
Level 23 Gold Fields House
1 Alfred Street
Sydney NSW 2000
P +612 9320 9647
W www.arup.com
P +612 8097 0070
W www.energeia.com.au


![Smart Grid Laboratories Inventory 2016 - Europa · for the identification of Smart Grid Projects of Common Interest (PCI) [4], and the Cost Benefit Analysis of Smart Grid Projects](https://img.pdfslide.us/doc/110x75/5f87de09559f9076a1599691/smart-grid-laboratories-inventory-2016-europa-for-the-identification-of-smart.jpg)
![[Smart Grid Market Research] Smart Grid Index: November 2012 - Zpryme Smart Grid Insights](https://img.pdfslide.us/doc/110x75/541402018d7f728a698b47a5/smart-grid-market-research-smart-grid-index-november-2012-zpryme-smart-grid-insights.jpg)

![[Smart Grid Market Research] India: Smart Grid Legacy, Zpryme Smart Grid Insights, September 2011](https://img.pdfslide.us/doc/110x75/541402518d7f7294698b47d4/smart-grid-market-research-india-smart-grid-legacy-zpryme-smart-grid-insights-september-2011.jpg)


![[Smart Grid Market Research] Brazil: The Smart Grid Network, Zpryme Smart Grid Insights, October 2011](https://img.pdfslide.us/doc/110x75/577d20871a28ab4e1e931ff6/smart-grid-market-research-brazil-the-smart-grid-network-zpryme-smart-grid.jpg)