Embed Size (px)
Citation preview
CCAFS- ICRISATScaling up climate smart agriculture in
Telangana state
Shalander Kumar, K DakshinaMurthy, Murali Gumma, S Nedumaran, Anthony Whitbread, ICRISAT
Arun Khatri, CCAFS
Partners from EPTRI, PJTSAU, ANGRAUDept. of Agriculture/others, Telangana
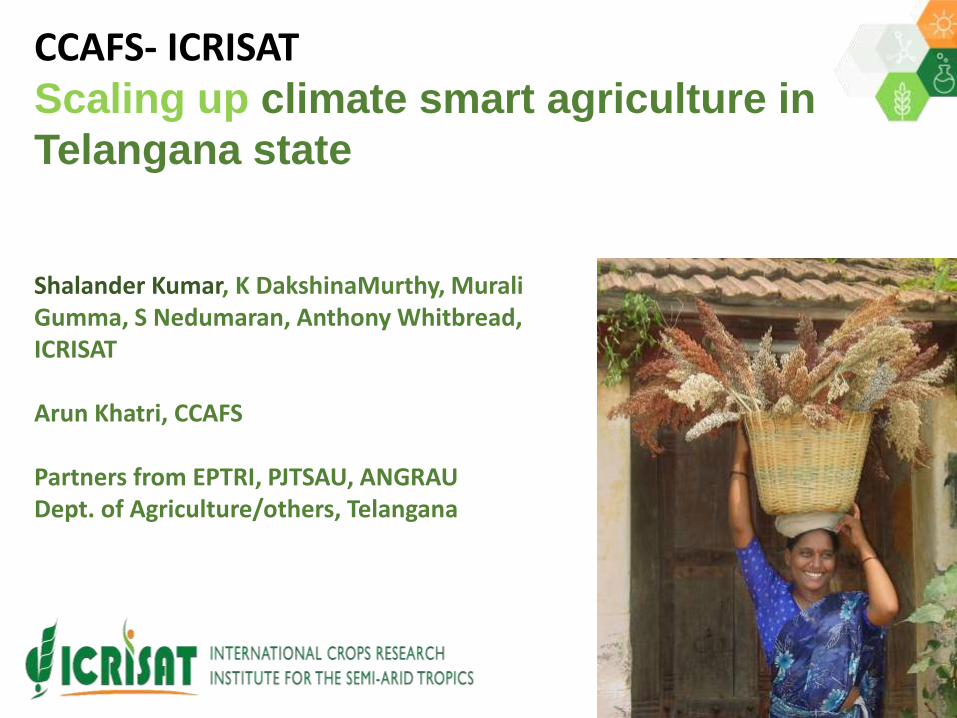
Major hindrances/constraints in scaling up climate smart
agriculture in Telangana state
Lack of information on climatic stresses/hot spots at disaggregate (mandal level)
• Which area to target for what CSAPs and priority Lack of awareness and integration of stakeholders perspective in
identifying CSA practices for different sub-regions• No mechanism to integrate stakeholders perspective in prioritization
of CSAPs SAPs impacts consider incremental yields but not income, market,
even soil types Lack of information on region/district wise & CSA practice specific
potential benefits and investment requirements• High instability in incremental returns across years e.i good / drought
years (esp. NRM based CSA options) Poor access to farm machinery and reliable climate information (SCF) Hindrances due to compartmentalization/ lack of convergence among
deptts Severe gaps in capacities of farmers, extension staff, bankers as well
as input dealers on CSA
Poor Targeting, lack of capacity at different levels& low adoption of CSAPs
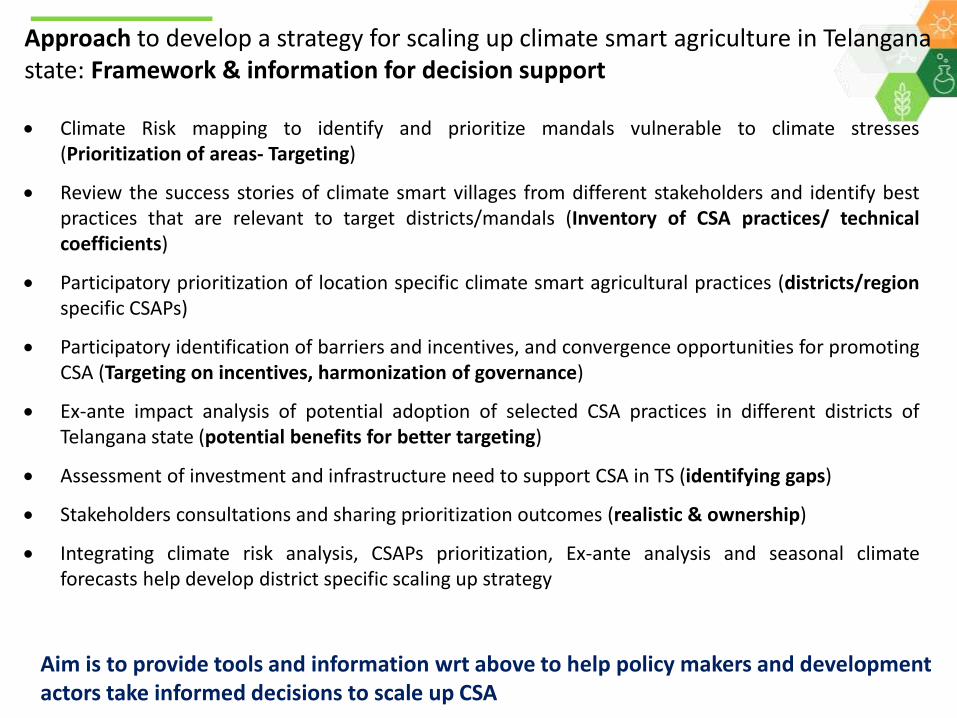
Climate Risk mapping to identify and prioritize mandals vulnerable to climate stresses(Prioritization of areas- Targeting)
Review the success stories of climate smart villages from different stakeholders and identify bestpractices that are relevant to target districts/mandals (Inventory of CSA practices/ technicalcoefficients)
Participatory prioritization of location specific climate smart agricultural practices (districts/regionspecific CSAPs)
Participatory identification of barriers and incentives, and convergence opportunities for promotingCSA (Targeting on incentives, harmonization of governance)
Ex-ante impact analysis of potential adoption of selected CSA practices in different districts ofTelangana state (potential benefits for better targeting)
Assessment of investment and infrastructure need to support CSA in TS (identifying gaps)
Stakeholders consultations and sharing prioritization outcomes (realistic & ownership)
Integrating climate risk analysis, CSAPs prioritization, Ex-ante analysis and seasonal climateforecasts help develop district specific scaling up strategy
Approach to develop a strategy for scaling up climate smart agriculture in Telanganastate: Framework & information for decision support
Aim is to provide tools and information wrt above to help policy makers and development actors take informed decisions to scale up CSA
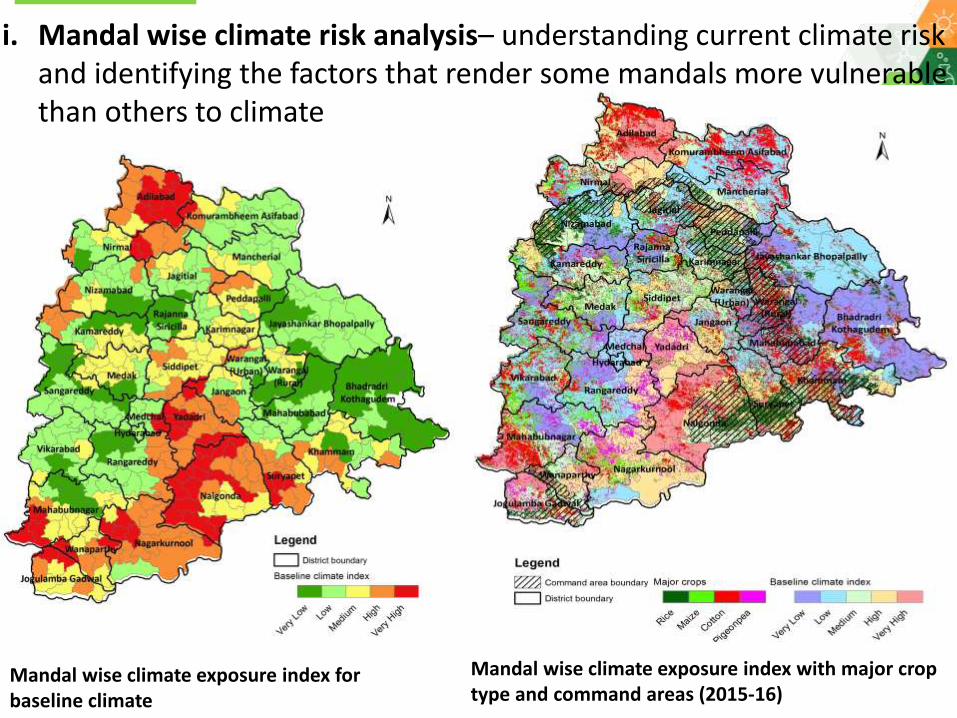
i. Mandal wise climate risk analysis– understanding current climate risk and identifying the factors that render some mandals more vulnerable than others to climate
Mandal wise climate exposure index for baseline climate
Mandal wise climate exposure index with major crop type and command areas (2015-16)
Climate risk analysis helps prioritizing and better targeting of different districts / Mandals to address different climate stresses
There are areas having high risk of droughts, have concentration of cotton and maize
Need for location specific diversification of cropping systems/cultivars/enhancing water access for most attractive crops in vulnerable areas
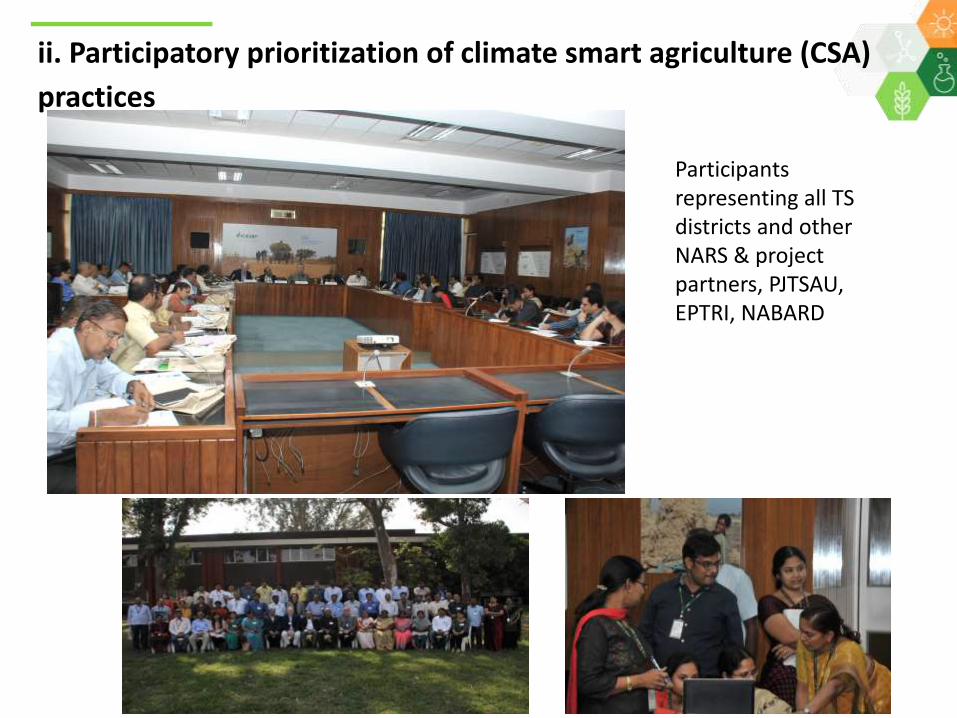
ii. Participatory prioritization of climate smart agriculture (CSA)
practices
Participants representing all TS districts and other NARS & project partners, PJTSAU, EPTRI, NABARD
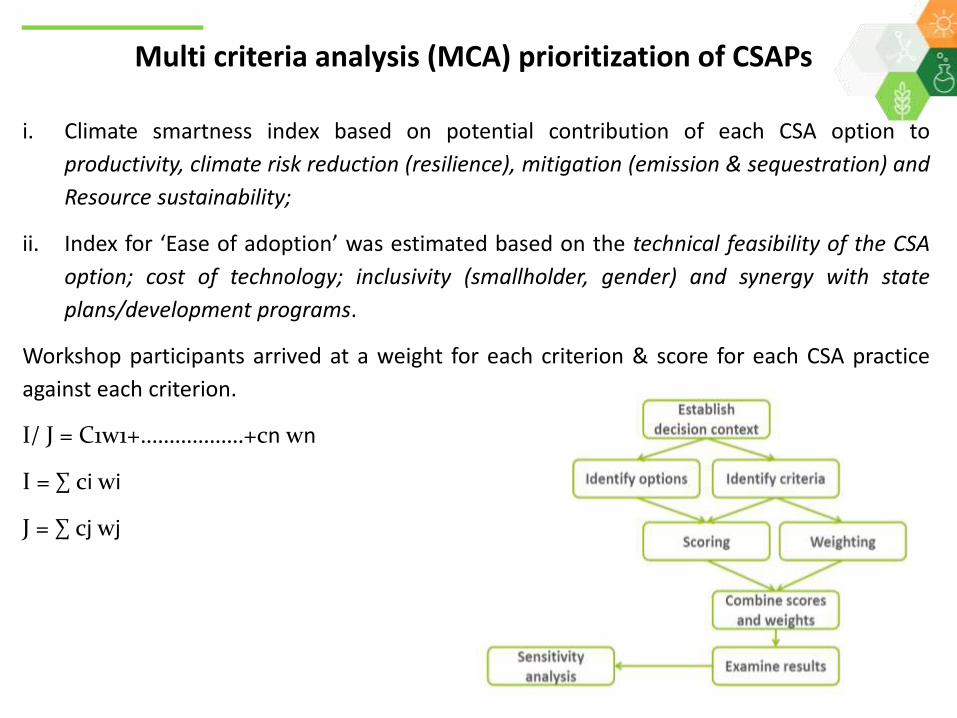
i. Climate smartness index based on potential contribution of each CSA option to
productivity, climate risk reduction (resilience), mitigation (emission & sequestration) and
Resource sustainability;
ii. Index for ‘Ease of adoption’ was estimated based on the technical feasibility of the CSA
option; cost of technology; inclusivity (smallholder, gender) and synergy with state
plans/development programs.
Workshop participants arrived at a weight for each criterion & score for each CSA practice
against each criterion.
I/ J = C1w1+………………+cn wn
I = ∑ ci wi
J = ∑ cj wj
Multi criteria analysis (MCA) prioritization of CSAPs
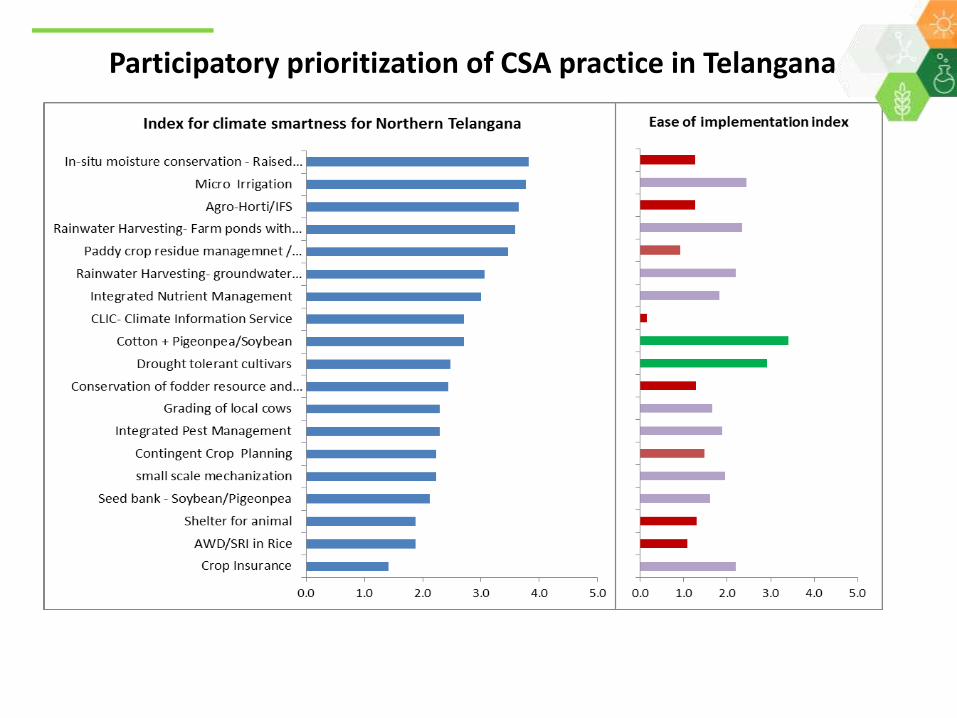
Participatory prioritization of CSA practice in Telangana
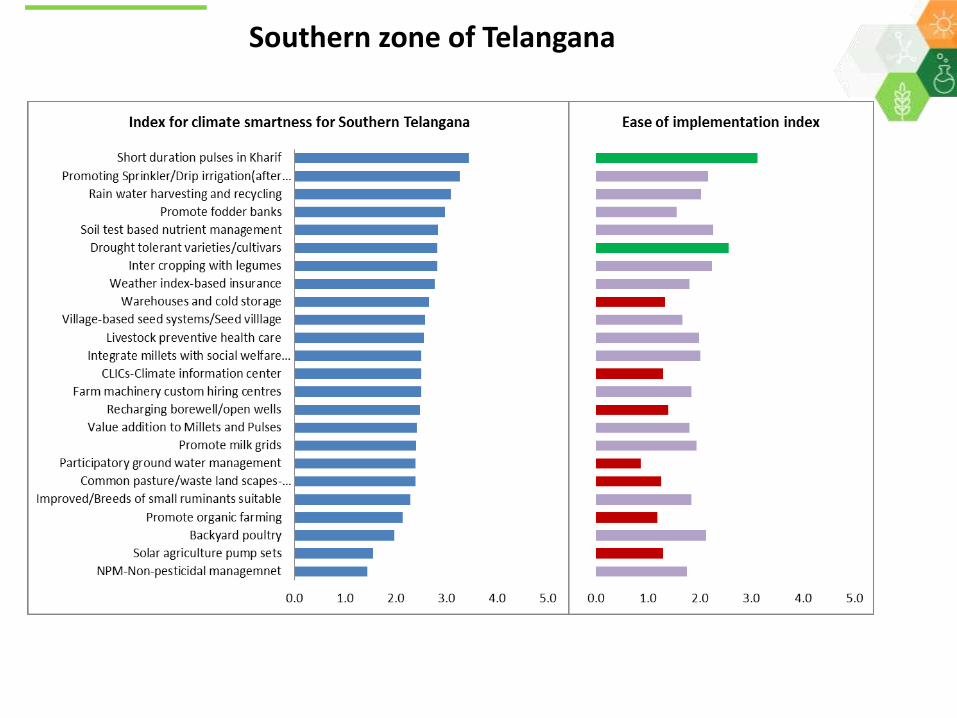
Southern zone of Telangana
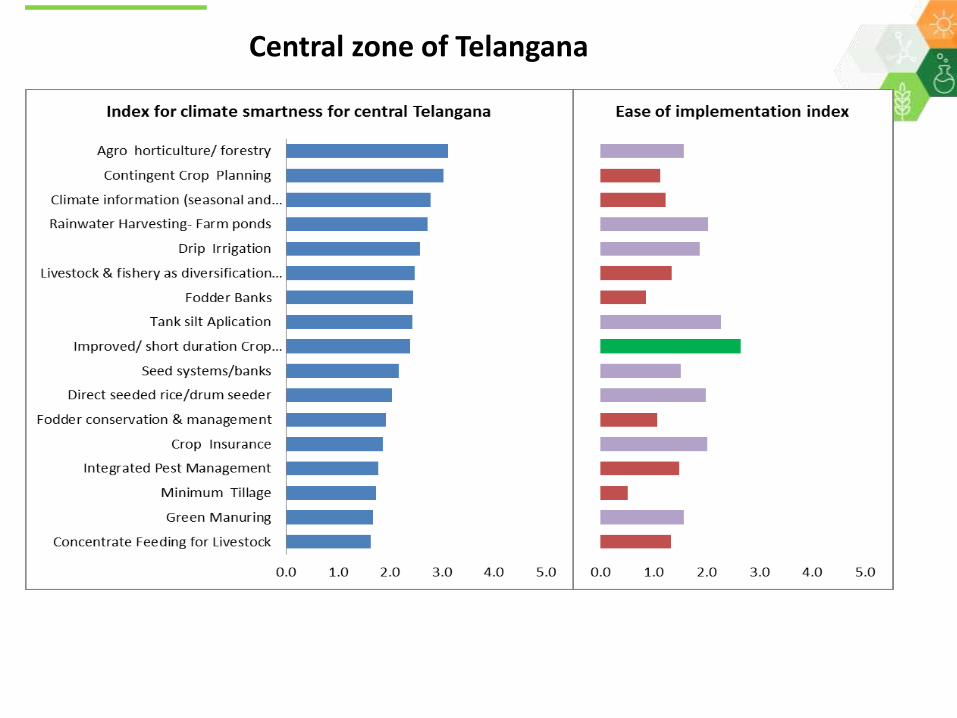
Central zone of Telangana
0 1 2 3 4 5
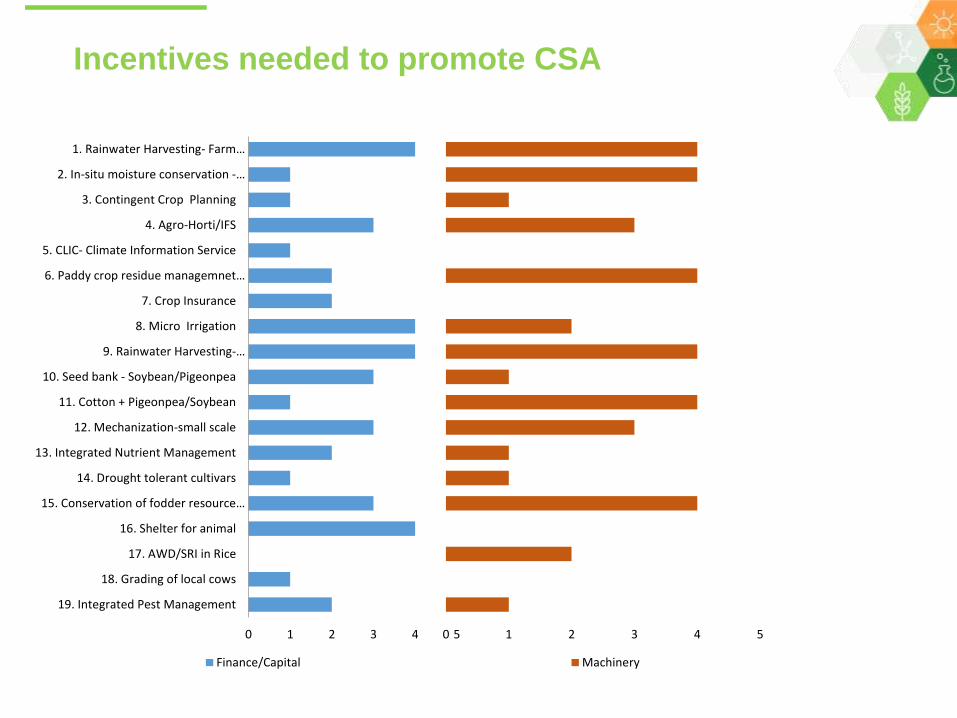
19. Integrated Pest Management
18. Grading of local cows
17. AWD/SRI in Rice
16. Shelter for animal
15. Conservation of fodder resource…
14. Drought tolerant cultivars
13. Integrated Nutrient Management
12. Mechanization-small scale
11. Cotton + Pigeonpea/Soybean
10. Seed bank - Soybean/Pigeonpea
9. Rainwater Harvesting-…
8. Micro Irrigation
7. Crop Insurance
6. Paddy crop residue managemnet…
5. CLIC- Climate Information Service
4. Agro-Horti/IFS
3. Contingent Crop Planning
2. In-situ moisture conservation -…
1. Rainwater Harvesting- Farm…
Finance/Capital
0 1 2 3 4 5
Machinery
Incentives needed to promote CSA
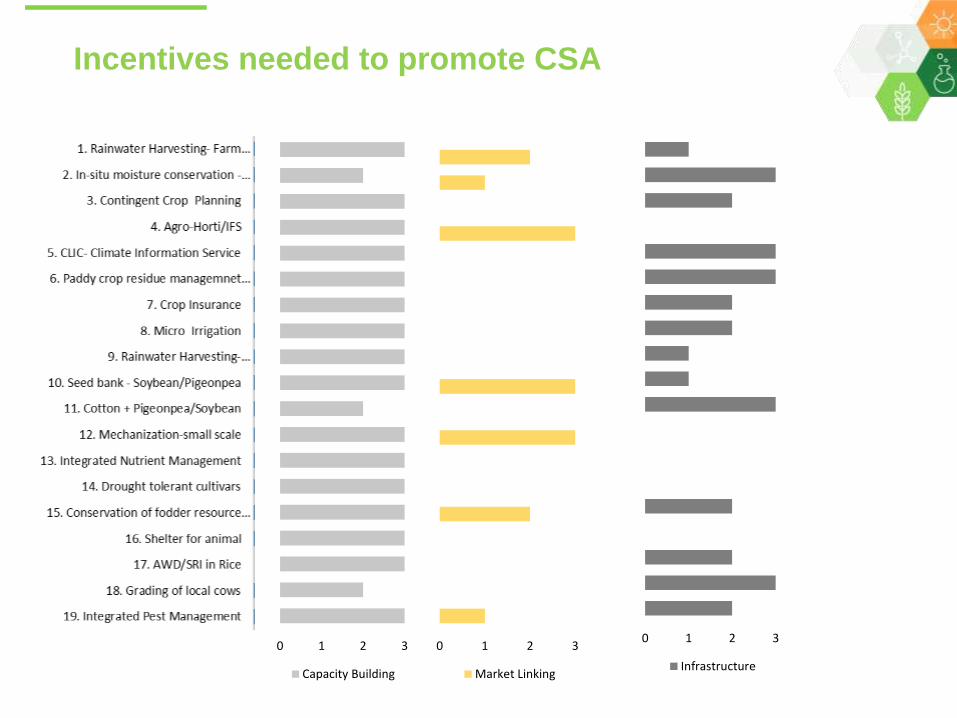
Incentives needed to promote CSA
0 1 2 3
Capacity Building
0 1 2 3
Market Linking
0 1 2 3
Infrastructure
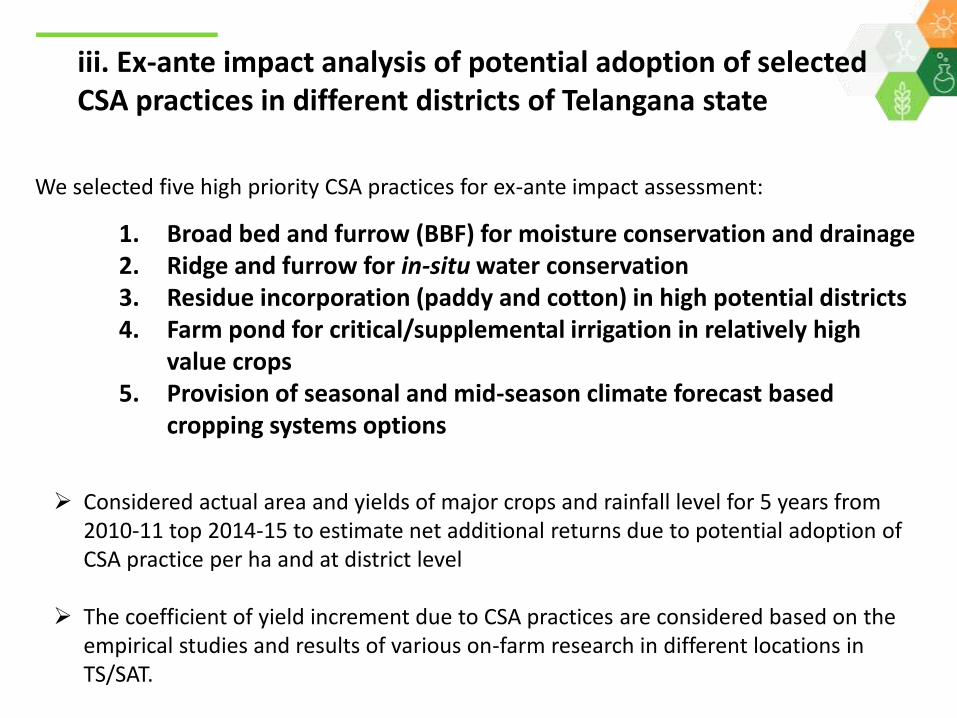
1. Broad bed and furrow (BBF) for moisture conservation and drainage2. Ridge and furrow for in-situ water conservation3. Residue incorporation (paddy and cotton) in high potential districts4. Farm pond for critical/supplemental irrigation in relatively high
value crops5. Provision of seasonal and mid-season climate forecast based
cropping systems options
iii. Ex-ante impact analysis of potential adoption of selected CSA practices in different districts of Telangana state
Considered actual area and yields of major crops and rainfall level for 5 years from 2010-11 top 2014-15 to estimate net additional returns due to potential adoption of CSA practice per ha and at district level
The coefficient of yield increment due to CSA practices are considered based on the empirical studies and results of various on-farm research in different locations in TS/SAT.
We selected five high priority CSA practices for ex-ante impact assessment:
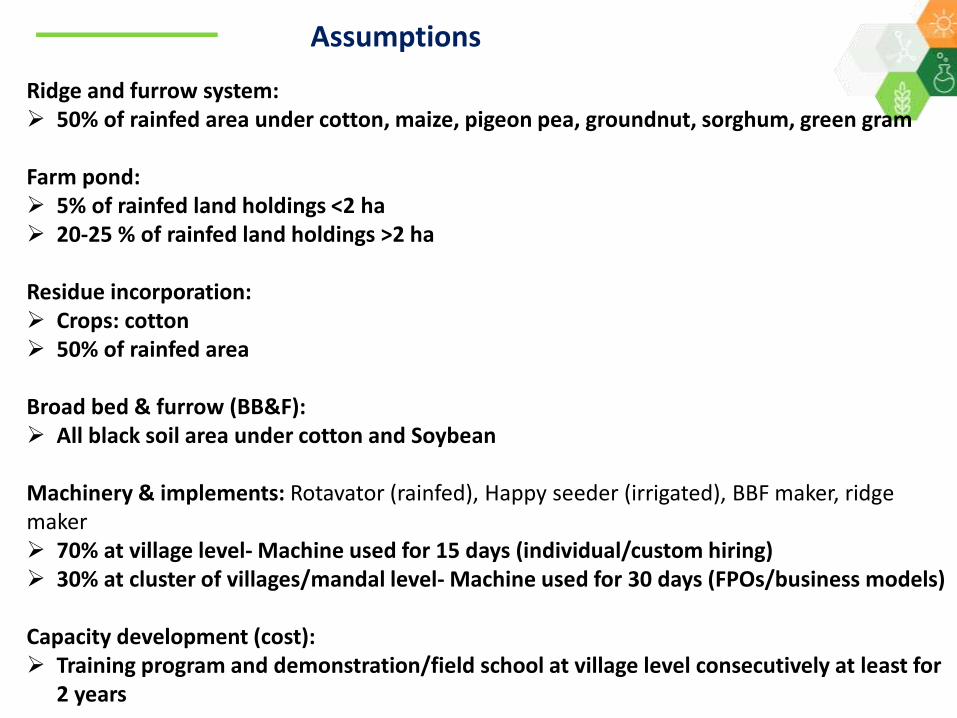
Assumptions
Ridge and furrow system: 50% of rainfed area under cotton, maize, pigeon pea, groundnut, sorghum, green gram
Farm pond: 5% of rainfed land holdings <2 ha 20-25 % of rainfed land holdings >2 ha
Residue incorporation: Crops: cotton 50% of rainfed area
Broad bed & furrow (BB&F): All black soil area under cotton and Soybean
Machinery & implements: Rotavator (rainfed), Happy seeder (irrigated), BBF maker, ridge maker 70% at village level- Machine used for 15 days (individual/custom hiring) 30% at cluster of villages/mandal level- Machine used for 30 days (FPOs/business models)
Capacity development (cost): Training program and demonstration/field school at village level consecutively at least for
2 years
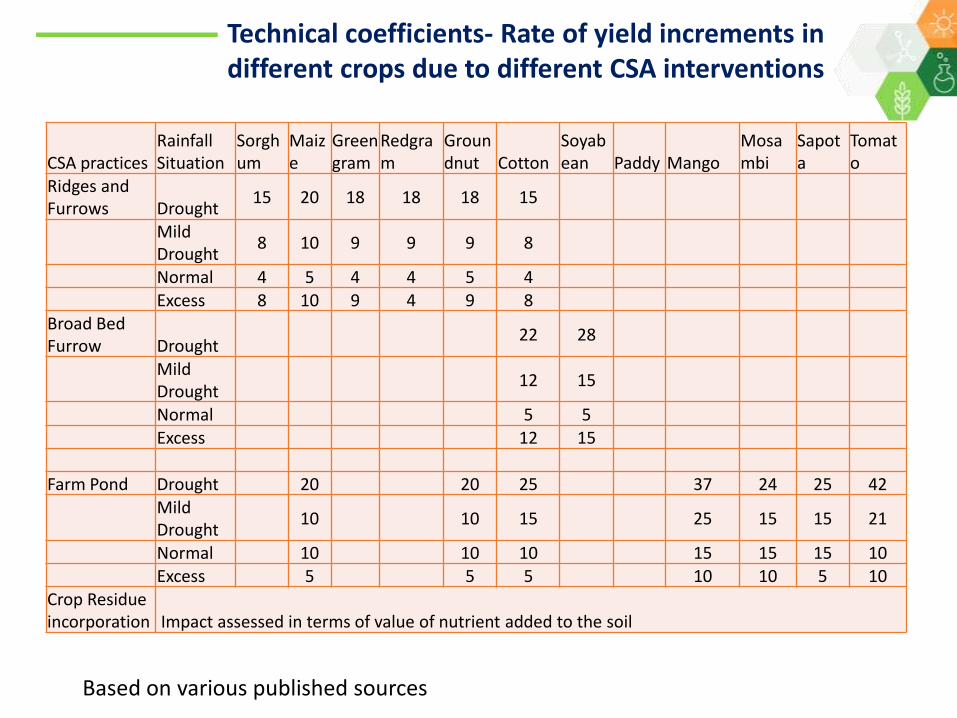
Technical coefficients- Rate of yield increments in different crops due to different CSA interventions
CSA practicesRainfall Situation
Sorghum
Maize
Greengram
Redgram
Groundnut Cotton
Soyabean Paddy Mango
Mosambi
Sapota
Tomato
Ridges and Furrows Drought
15 20 18 18 18 15
Mild Drought
8 10 9 9 9 8
Normal 4 5 4 4 5 4Excess 8 10 9 4 9 8
Broad Bed Furrow Drought
22 28
Mild Drought
12 15
Normal 5 5Excess 12 15
Farm Pond Drought 20 20 25 37 24 25 42Mild Drought
10 10 15 25 15 15 21
Normal 10 10 10 15 15 15 10Excess 5 5 5 10 10 5 10
Crop Residue incorporation Impact assessed in terms of value of nutrient added to the soil
Based on various published sources
16
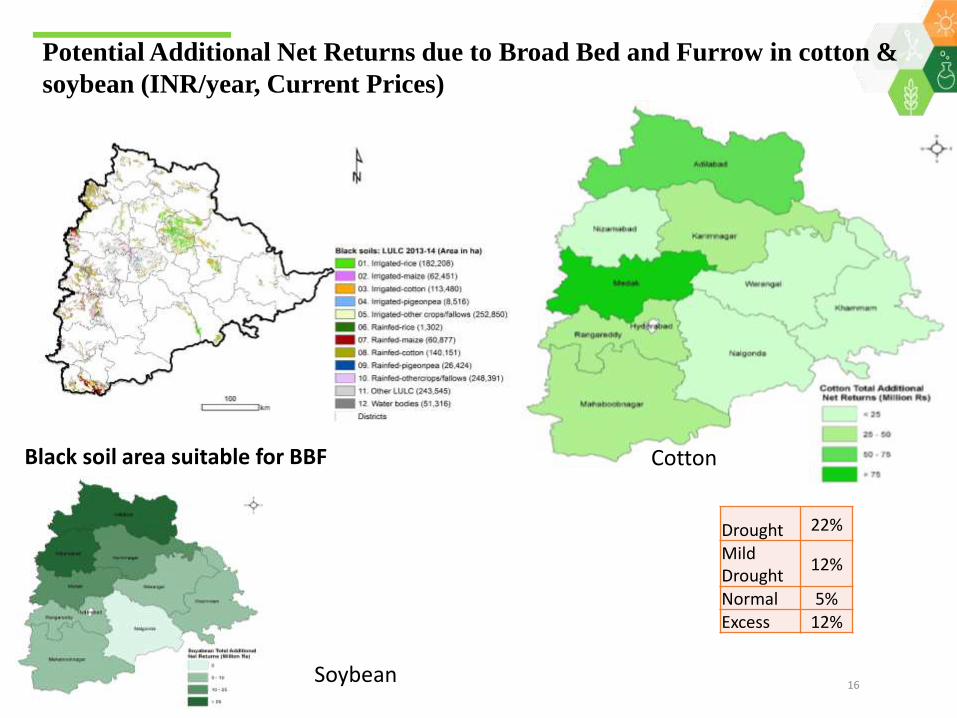
Potential Additional Net Returns due to Broad Bed and Furrow in cotton &
soybean (INR/year, Current Prices)
Black soil area suitable for BBF
Soybean
Cotton
Drought 22%
Mild Drought
12%
Normal 5%Excess 12%
AgMIP Sentinel
Sites
17
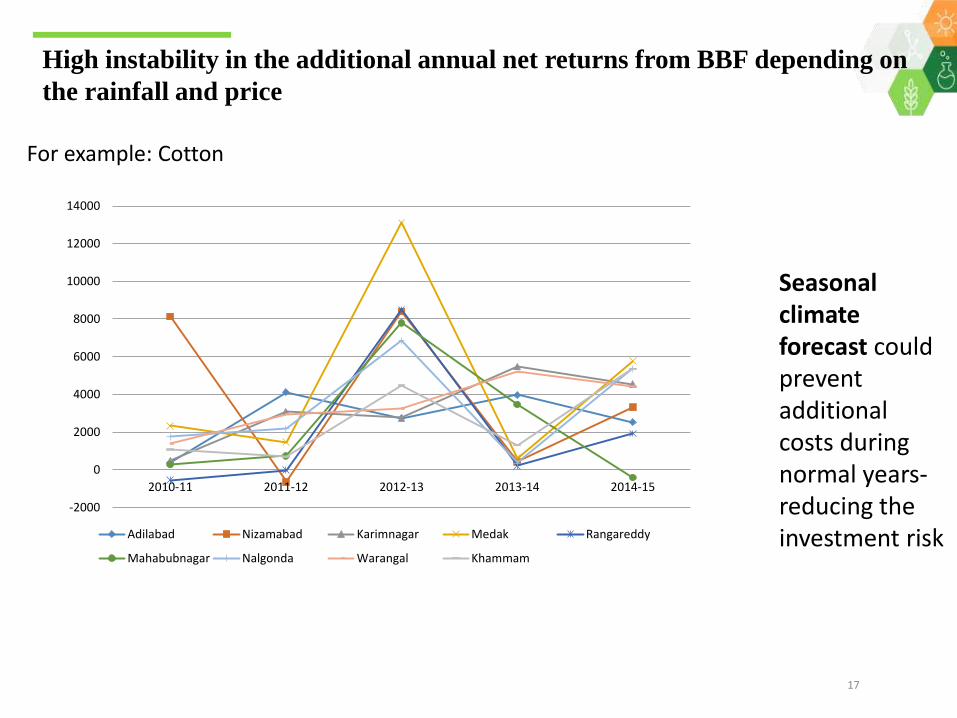
High instability in the additional annual net returns from BBF depending on
the rainfall and price
For example: Cotton
Seasonal climate forecast could prevent additional costs during normal years-reducing the investment risk
-2000
0
2000
4000
6000
8000
10000
12000
14000
2010-11 2011-12 2012-13 2013-14 2014-15
Adilabad Nizamabad Karimnagar Medak Rangareddy
Mahabubnagar Nalgonda Warangal Khammam
AgMIP Sentinel
Sites
18
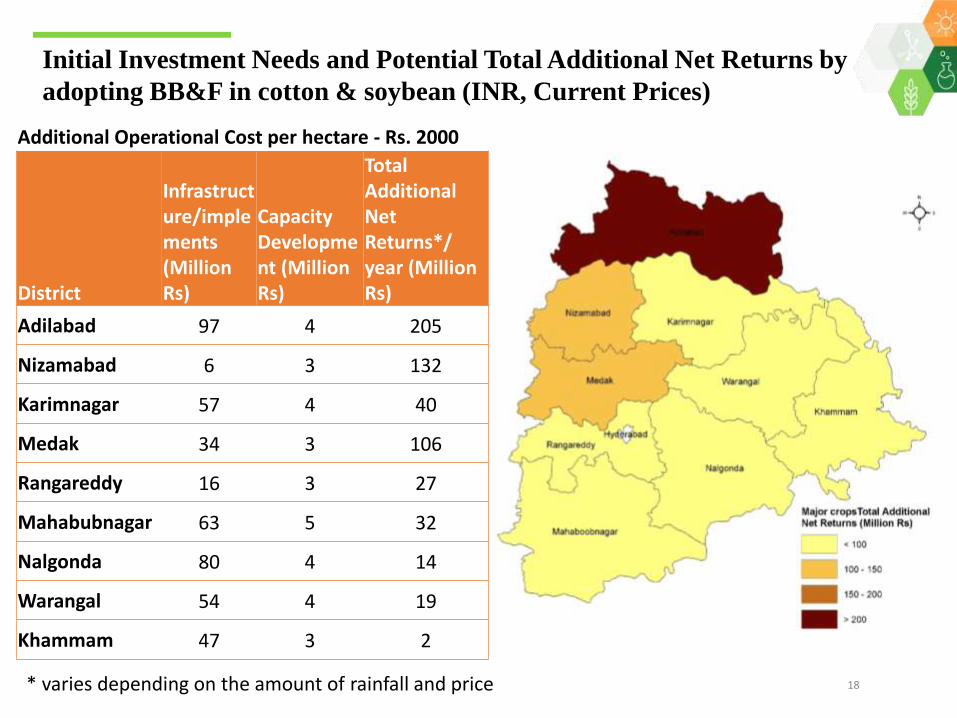
District
Infrastructure/implements(Million Rs)
Capacity Development (Million Rs)
Total Additional Net Returns*/ year (Million Rs)
Adilabad 97 4 205
Nizamabad 6 3 132
Karimnagar 57 4 40
Medak 34 3 106
Rangareddy 16 3 27
Mahabubnagar 63 5 32
Nalgonda 80 4 14
Warangal 54 4 19
Khammam 47 3 2
Initial Investment Needs and Potential Total Additional Net Returns by
adopting BB&F in cotton & soybean (INR, Current Prices)
Additional Operational Cost per hectare - Rs. 2000
* varies depending on the amount of rainfall and price
AgMIP Sentinel
Sites
19
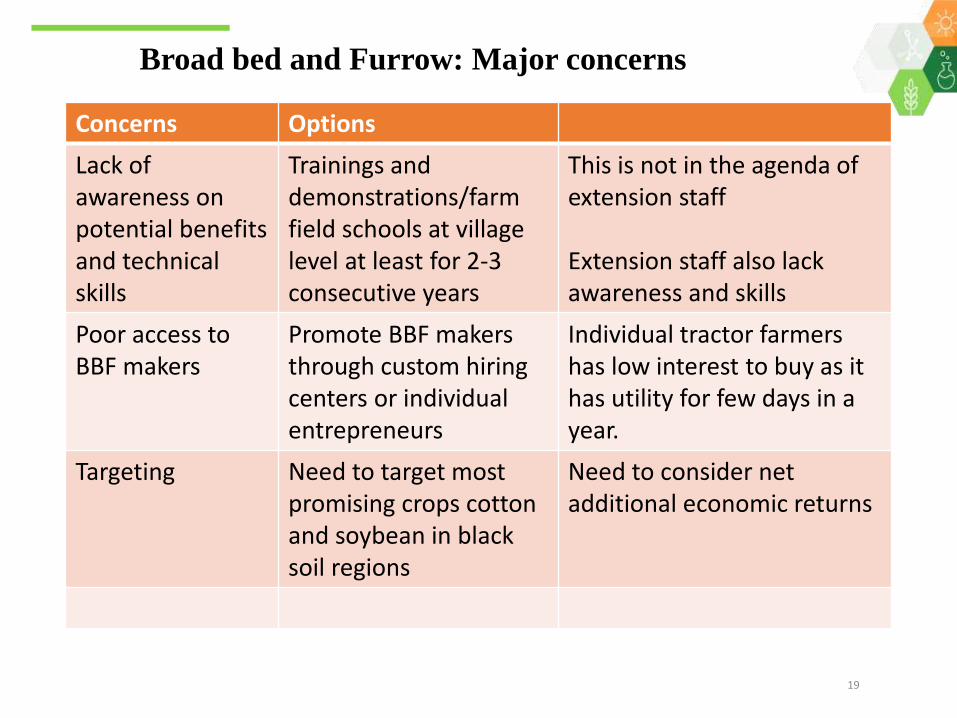
Broad bed and Furrow: Major concerns
Concerns Options
Lack of awareness on potential benefits and technical skills
Trainings anddemonstrations/farm field schools at village level at least for 2-3 consecutive years
This is not in the agenda of extension staff
Extension staff also lack awareness and skills
Poor access to BBF makers
Promote BBF makers through custom hiring centers or individual entrepreneurs
Individual tractor farmers has low interest to buy as it has utility for few days in a year.
Targeting Need to target most promising crops cotton and soybean in black soil regions
Need to consider net additional economic returns
AgMIP Sentinel
Sites
20
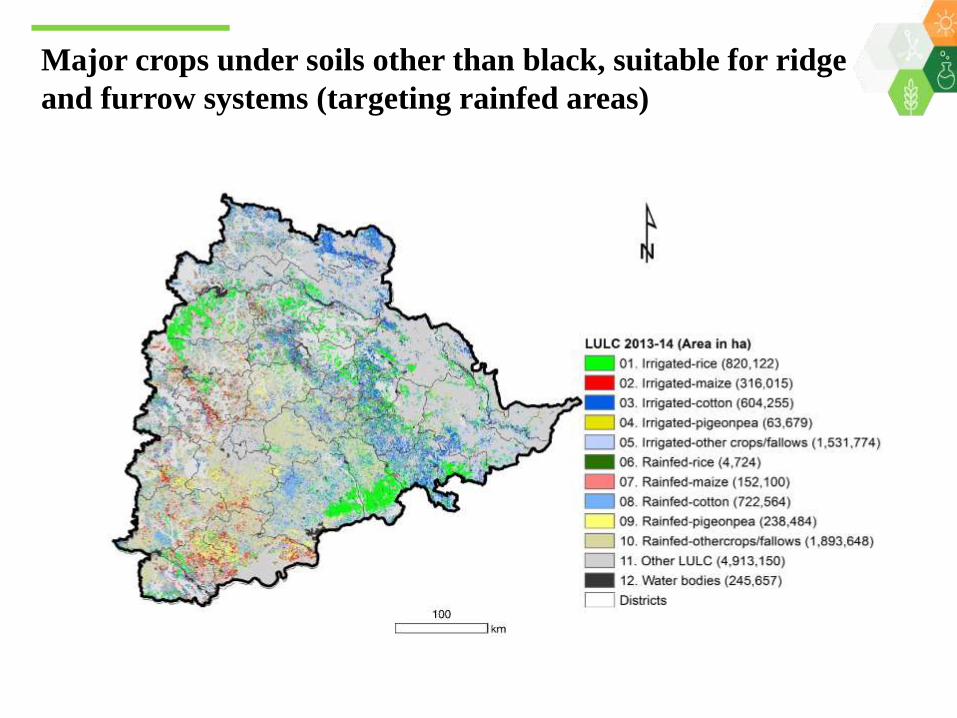
Major crops under soils other than black, suitable for ridge
and furrow systems (targeting rainfed areas)
AgMIP Sentinel
Sites
21
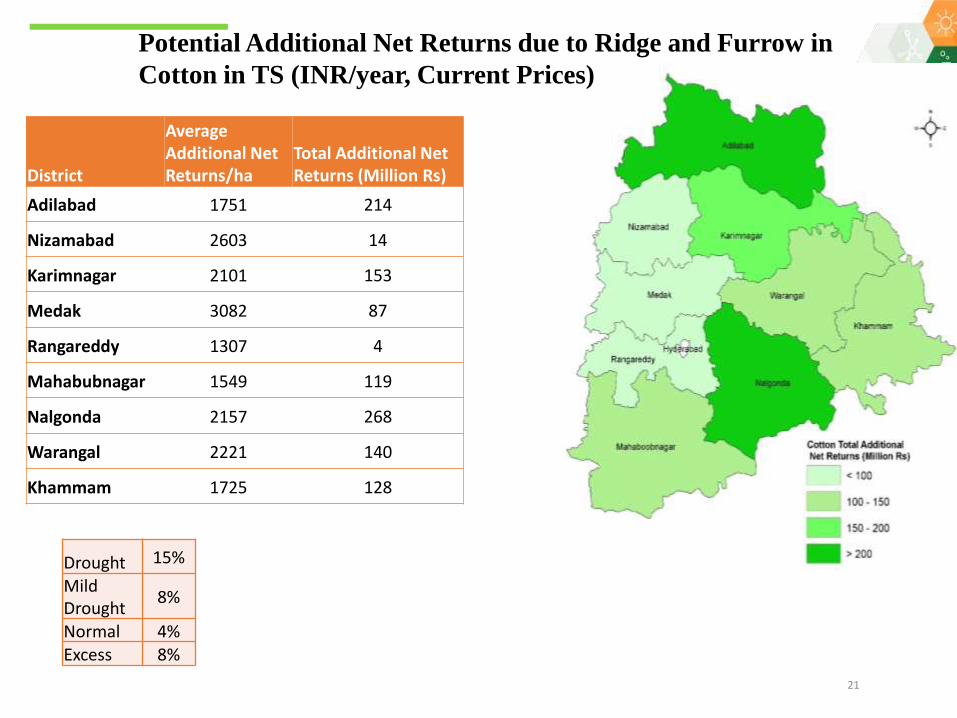
District
Average Additional Net Returns/ha
Total Additional Net Returns (Million Rs)
Adilabad 1751 214
Nizamabad 2603 14
Karimnagar 2101 153
Medak 3082 87
Rangareddy 1307 4
Mahabubnagar 1549 119
Nalgonda 2157 268
Warangal 2221 140
Khammam 1725 128
Potential Additional Net Returns due to Ridge and Furrow in
Cotton in TS (INR/year, Current Prices)
Drought 15%
Mild Drought
8%
Normal 4%Excess 8%
AgMIP Sentinel
Sites
22
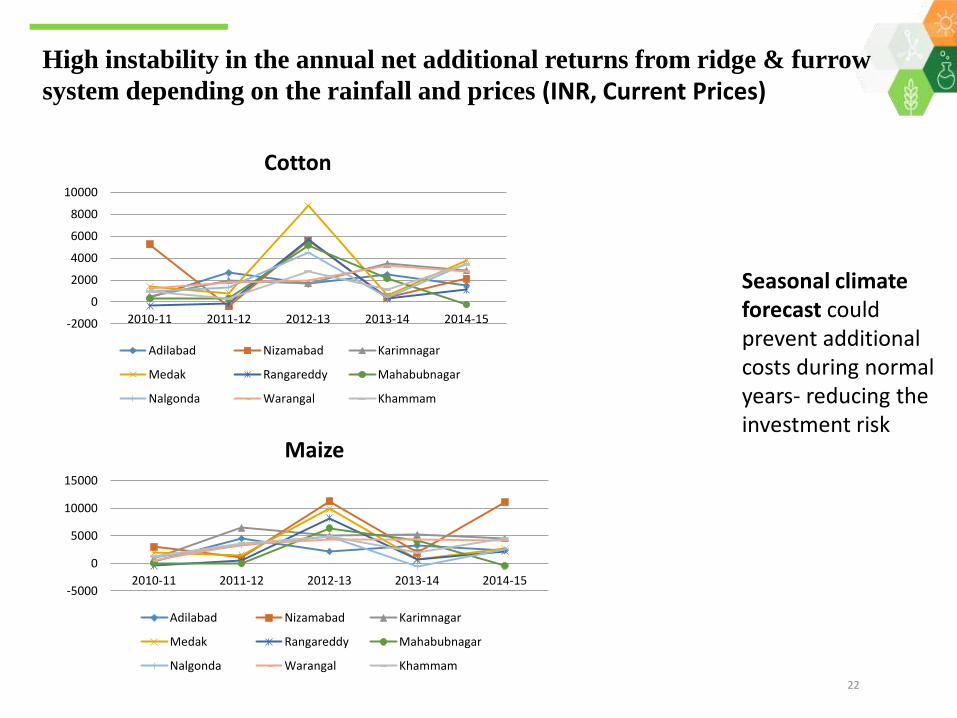
High instability in the annual net additional returns from ridge & furrow
system depending on the rainfall and prices (INR, Current Prices)
Seasonal climate forecast could prevent additional costs during normal years- reducing the investment risk
-2000
0
2000
4000
6000
8000
10000
2010-11 2011-12 2012-13 2013-14 2014-15
Cotton
Adilabad Nizamabad Karimnagar
Medak Rangareddy Mahabubnagar
Nalgonda Warangal Khammam
-5000
0
5000
10000
15000
2010-11 2011-12 2012-13 2013-14 2014-15
Maize
Adilabad Nizamabad Karimnagar
Medak Rangareddy Mahabubnagar
Nalgonda Warangal Khammam
23
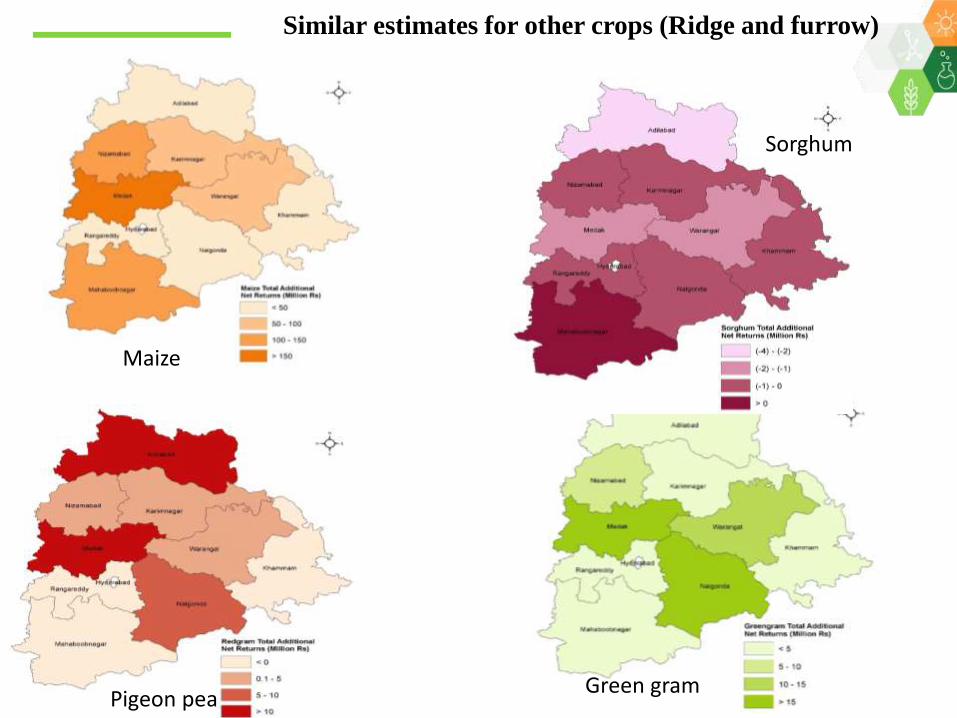
Similar estimates for other crops (Ridge and furrow)
Pigeon peaGreen gram
Sorghum
Maize
AgMIP Sentinel
Sites
24
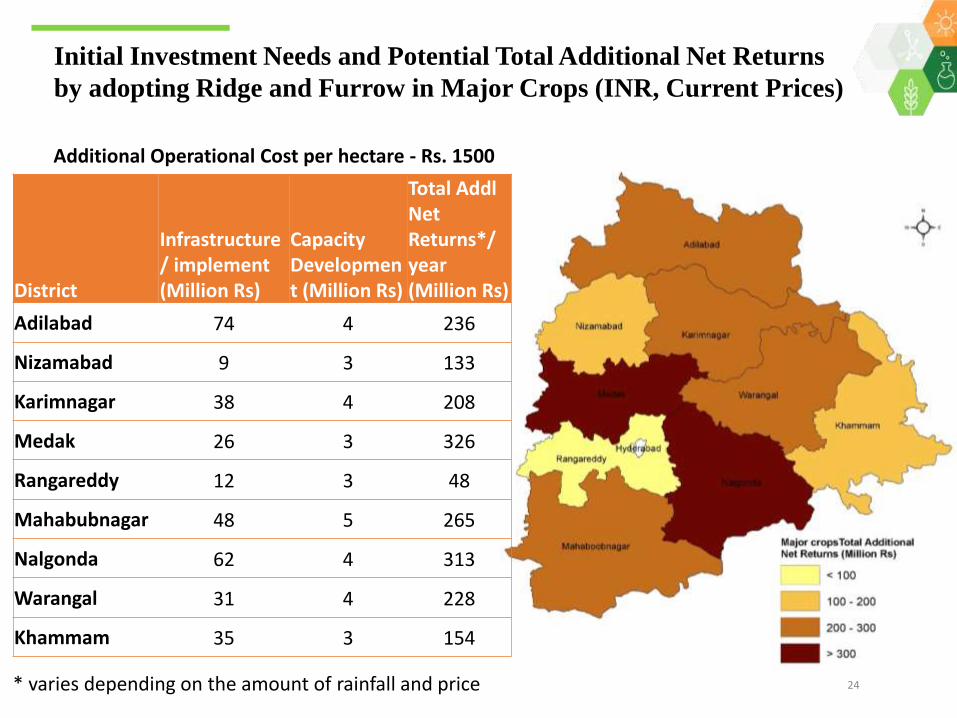
District
Infrastructure/ implement(Million Rs)
Capacity Development (Million Rs)
Total AddlNet Returns*/ year (Million Rs)
Adilabad 74 4 236
Nizamabad 9 3 133
Karimnagar 38 4 208
Medak 26 3 326
Rangareddy 12 3 48
Mahabubnagar 48 5 265
Nalgonda 62 4 313
Warangal 31 4 228
Khammam 35 3 154
Initial Investment Needs and Potential Total Additional Net Returns
by adopting Ridge and Furrow in Major Crops (INR, Current Prices)
Additional Operational Cost per hectare - Rs. 1500
* varies depending on the amount of rainfall and price
AgMIP Sentinel
Sites
25
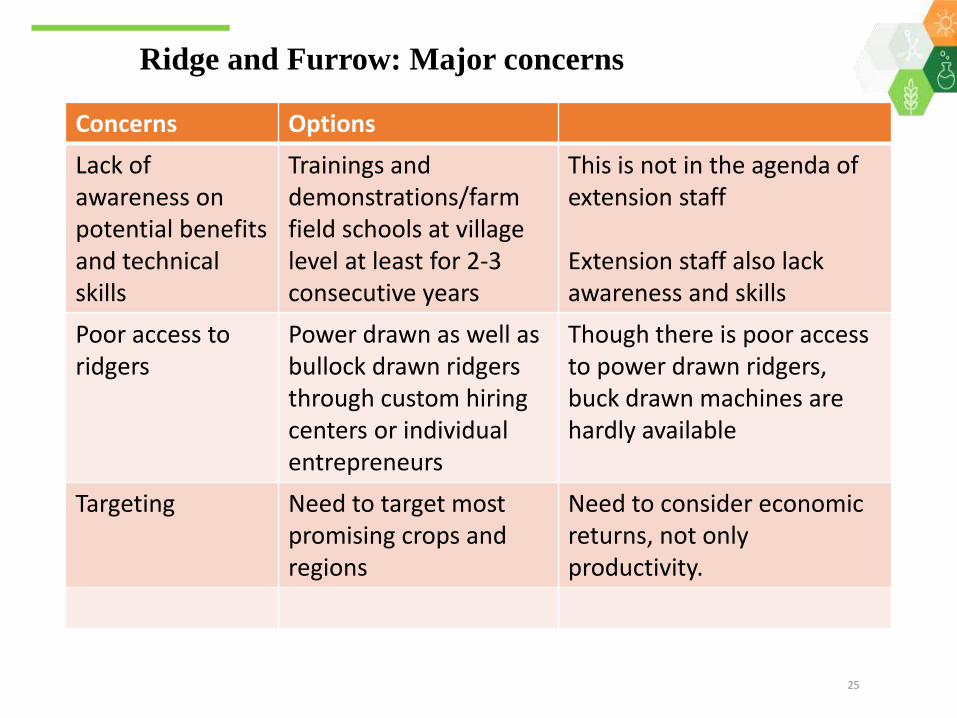
Ridge and Furrow: Major concerns
Concerns Options
Lack of awareness on potential benefits and technical skills
Trainings anddemonstrations/farm field schools at village level at least for 2-3 consecutive years
This is not in the agenda of extension staff
Extension staff also lack awareness and skills
Poor access to ridgers
Power drawn as well as bullock drawn ridgersthrough custom hiring centers or individual entrepreneurs
Though there is poor access to power drawn ridgers, buck drawn machines are hardly available
Targeting Need to target most promising crops and regions
Need to consider economic returns, not only productivity.
AgMIP Sentinel
Sites
26
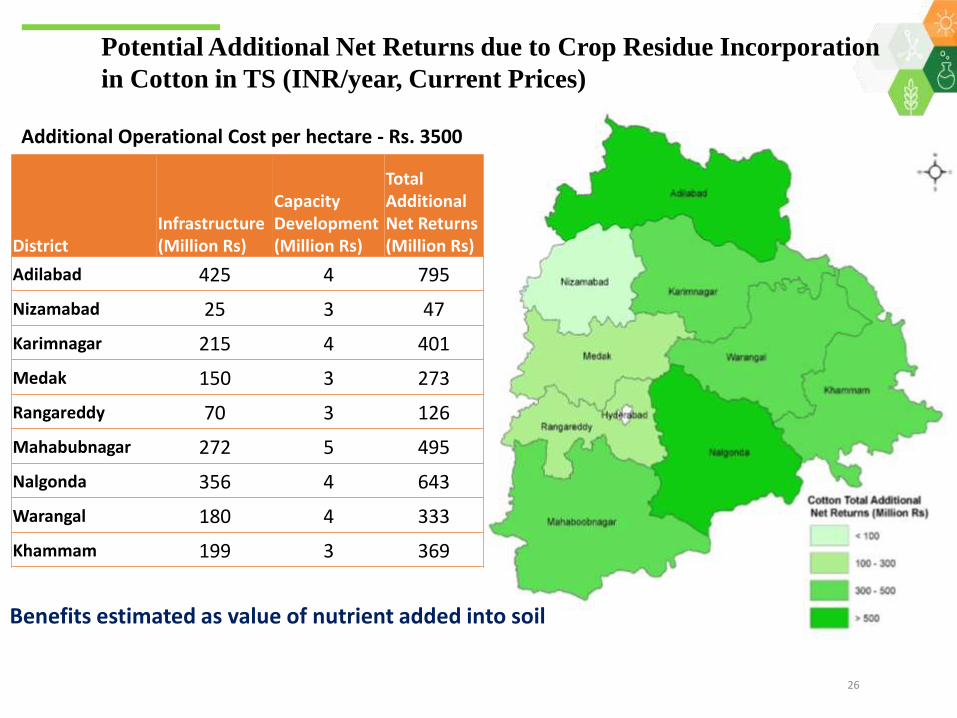
Potential Additional Net Returns due to Crop Residue Incorporation
in Cotton in TS (INR/year, Current Prices)
Additional Operational Cost per hectare - Rs. 3500
Benefits estimated as value of nutrient added into soil
DistrictInfrastructure(Million Rs)
Capacity Development (Million Rs)
Total Additional Net Returns (Million Rs)
Adilabad 425 4 795
Nizamabad 25 3 47
Karimnagar 215 4 401
Medak 150 3 273
Rangareddy 70 3 126
Mahabubnagar 272 5 495
Nalgonda 356 4 643
Warangal 180 4 333
Khammam 199 3 369
AgMIP Sentinel
Sites
27
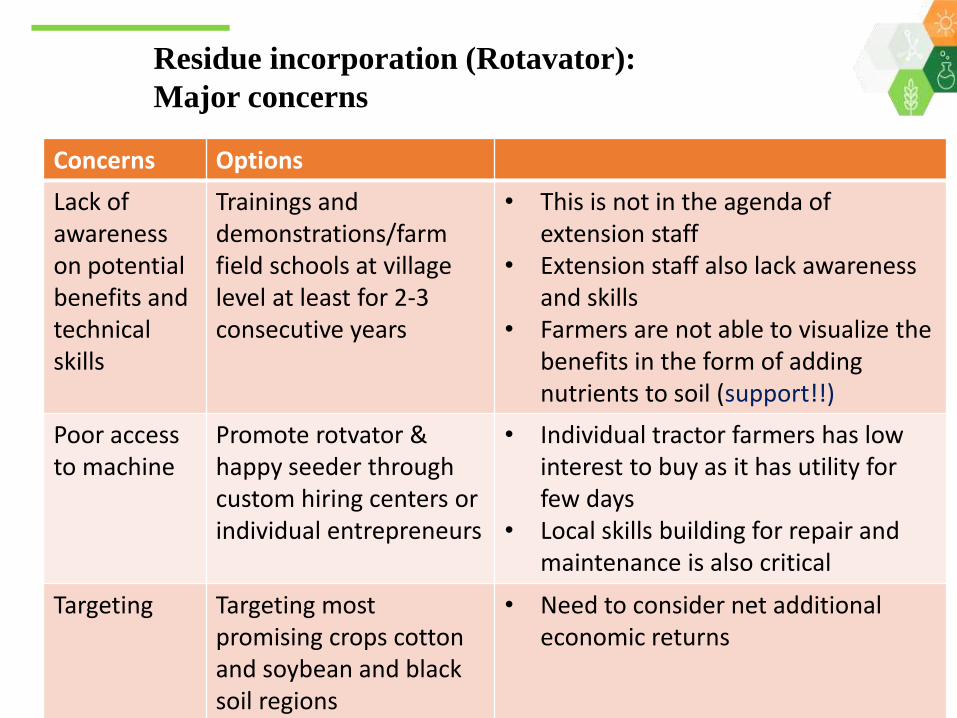
Residue incorporation (Rotavator):
Major concerns
Concerns Options
Lack of awareness on potentialbenefits and technical skills
Trainings anddemonstrations/farm field schools at village level at least for 2-3 consecutive years
• This is not in the agenda of extension staff
• Extension staff also lack awareness and skills
• Farmers are not able to visualize the benefits in the form of adding nutrients to soil (support!!)
Poor access to machine
Promote rotvator & happy seeder through custom hiring centers or individual entrepreneurs
• Individual tractor farmers has low interest to buy as it has utility for few days
• Local skills building for repair and maintenance is also critical
Targeting Targeting most promising crops cotton and soybean and black soil regions
• Need to consider net additional economic returns
28
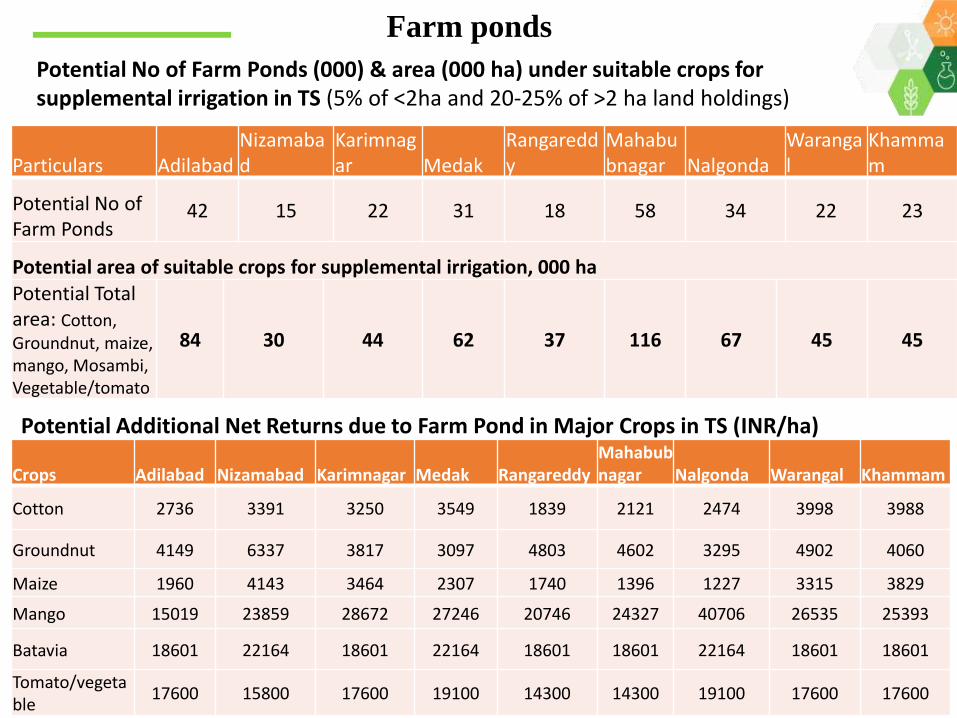
Potential No of Farm Ponds (000) & area (000 ha) under suitable crops for supplemental irrigation in TS (5% of <2ha and 20-25% of >2 ha land holdings)
Particulars AdilabadNizamabad
Karimnagar Medak
Rangareddy
Mahabubnagar Nalgonda
Warangal
Khammam
Potential No of Farm Ponds
42 15 22 31 18 58 34 22 23
Potential area of suitable crops for supplemental irrigation, 000 haPotential Total area: Cotton,Groundnut, maize, mango, Mosambi, Vegetable/tomato
84 30 44 62 37 116 67 45 45
Farm ponds
Crops Adilabad Nizamabad Karimnagar Medak RangareddyMahabubnagar Nalgonda Warangal Khammam
Cotton 2736 3391 3250 3549 1839 2121 2474 3998 3988
Groundnut 4149 6337 3817 3097 4803 4602 3295 4902 4060
Maize 1960 4143 3464 2307 1740 1396 1227 3315 3829
Mango 15019 23859 28672 27246 20746 24327 40706 26535 25393
Batavia 18601 22164 18601 22164 18601 18601 22164 18601 18601
Tomato/vegetable
17600 15800 17600 19100 14300 14300 19100 17600 17600
Potential Additional Net Returns due to Farm Pond in Major Crops in TS (INR/ha)
AgMIP Sentinel
Sites
29
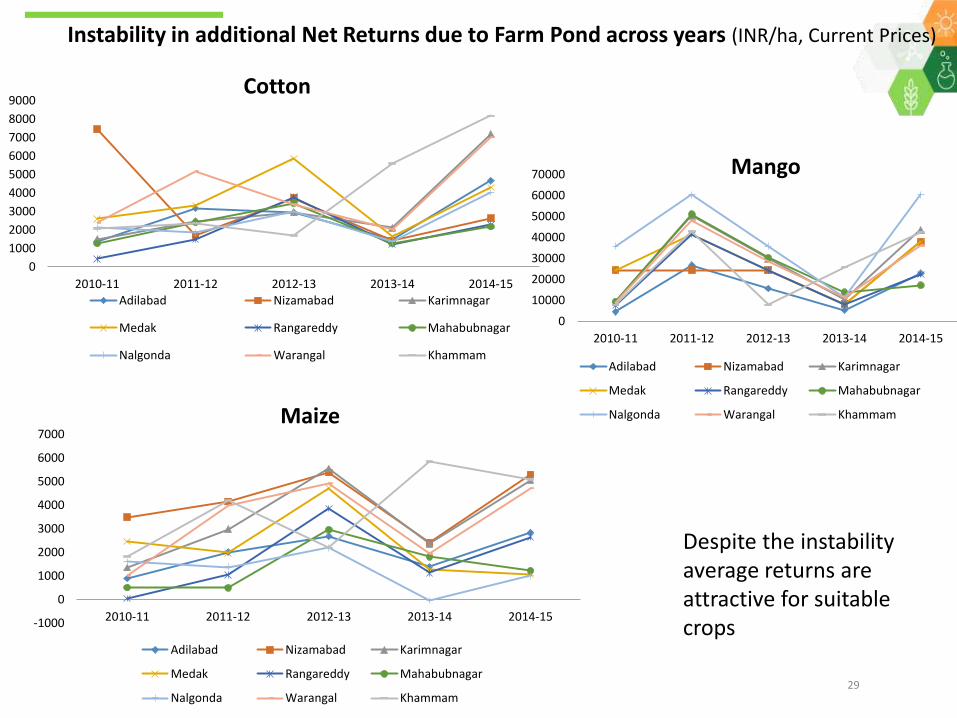
Instability in additional Net Returns due to Farm Pond across years (INR/ha, Current Prices)
0
1000
2000
3000
4000
5000
6000
7000
8000
9000
2010-11 2011-12 2012-13 2013-14 2014-15
Cotton
Adilabad Nizamabad Karimnagar
Medak Rangareddy Mahabubnagar
Nalgonda Warangal Khammam
-1000
0
1000
2000
3000
4000
5000
6000
7000
2010-11 2011-12 2012-13 2013-14 2014-15
Maize
Adilabad Nizamabad Karimnagar
Medak Rangareddy Mahabubnagar
Nalgonda Warangal Khammam
0
10000
20000
30000
40000
50000
60000
70000
2010-11 2011-12 2012-13 2013-14 2014-15
Mango
Adilabad Nizamabad Karimnagar
Medak Rangareddy Mahabubnagar
Nalgonda Warangal Khammam
Despite the instability average returns are attractive for suitable crops
AgMIP Sentinel
Sites
30
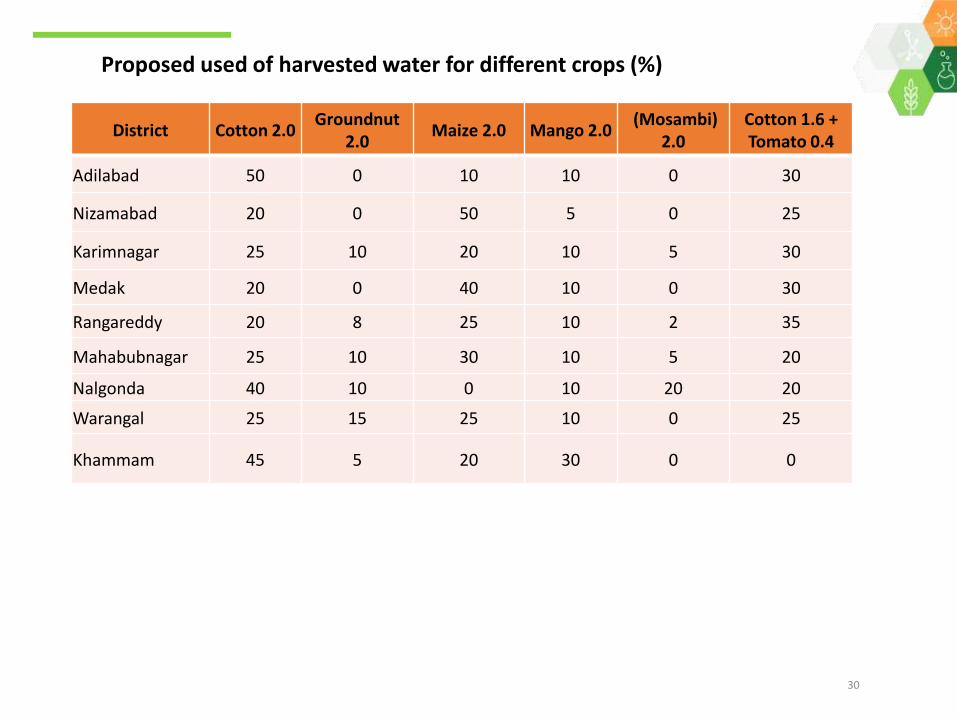
Proposed used of harvested water for different crops (%)
District Cotton 2.0Groundnut
2.0Maize 2.0 Mango 2.0
(Mosambi) 2.0
Cotton 1.6 + Tomato 0.4
Adilabad 50 0 10 10 0 30
Nizamabad 20 0 50 5 0 25
Karimnagar 25 10 20 10 5 30
Medak 20 0 40 10 0 30
Rangareddy 20 8 25 10 2 35
Mahabubnagar 25 10 30 10 5 20
Nalgonda 40 10 0 10 20 20
Warangal 25 15 25 10 0 25
Khammam 45 5 20 30 0 0
AgMIP Sentinel
Sites
31
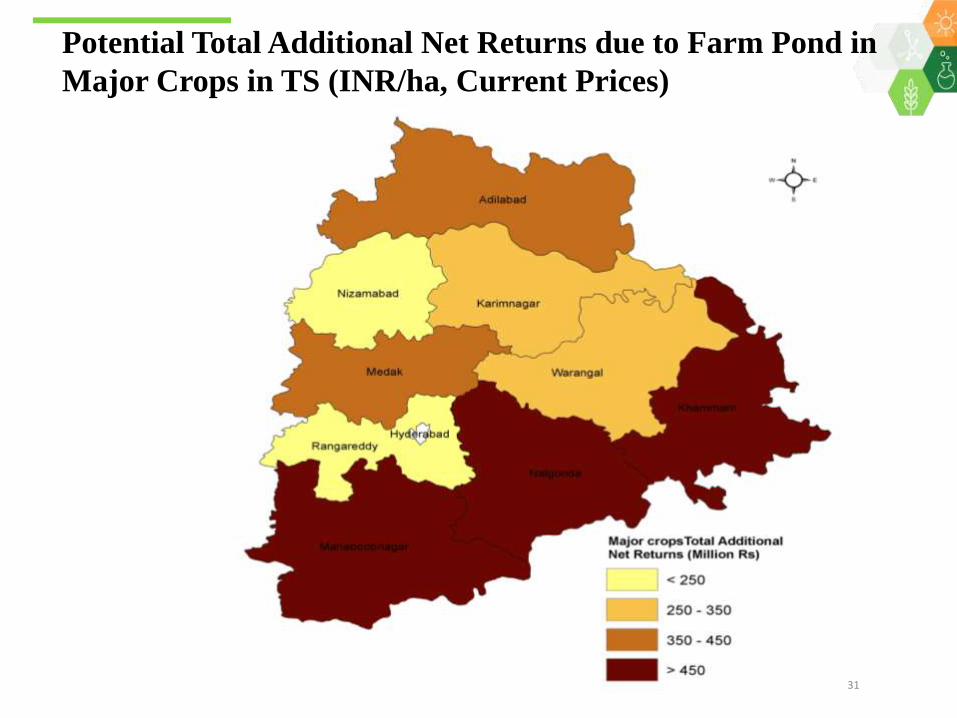
Potential Total Additional Net Returns due to Farm Pond in
Major Crops in TS (INR/ha, Current Prices)
AgMIP Sentinel
Sites
32
District
Infrastructure with Drip System(Million Rs)
Infrastructure with Sprinkler System (Million Rs)
Capacity Development (Million Rs)
Total Additional Net Returns (Million Rs)
Adilabad 7439 6419 4 387
Nizamabad 2647 2284 3 171
Karimnagar 3869 3339 4 326
Medak 5480 4729 3 436
Rangareddy 3235 2791 3 220
Mahabubnagar 10303 8890 5 428
Nalgonda 5947 5131 4 678
Warangal 3952 3410 4 262
Khammam 4006 3456 3 460
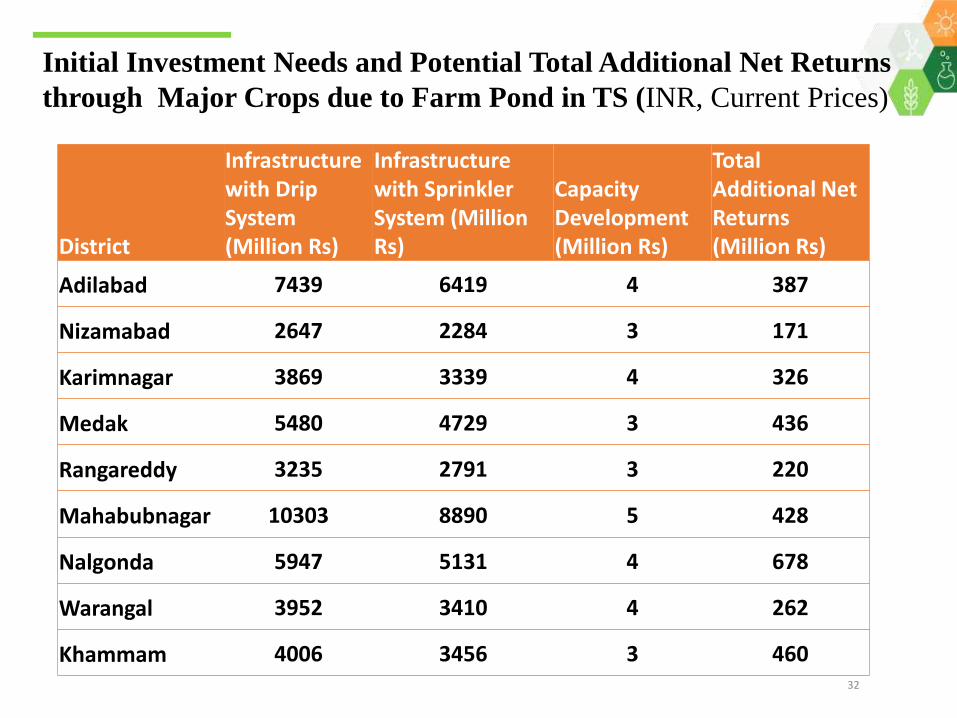
Initial Investment Needs and Potential Total Additional Net Returns
through Major Crops due to Farm Pond in TS (INR, Current Prices)
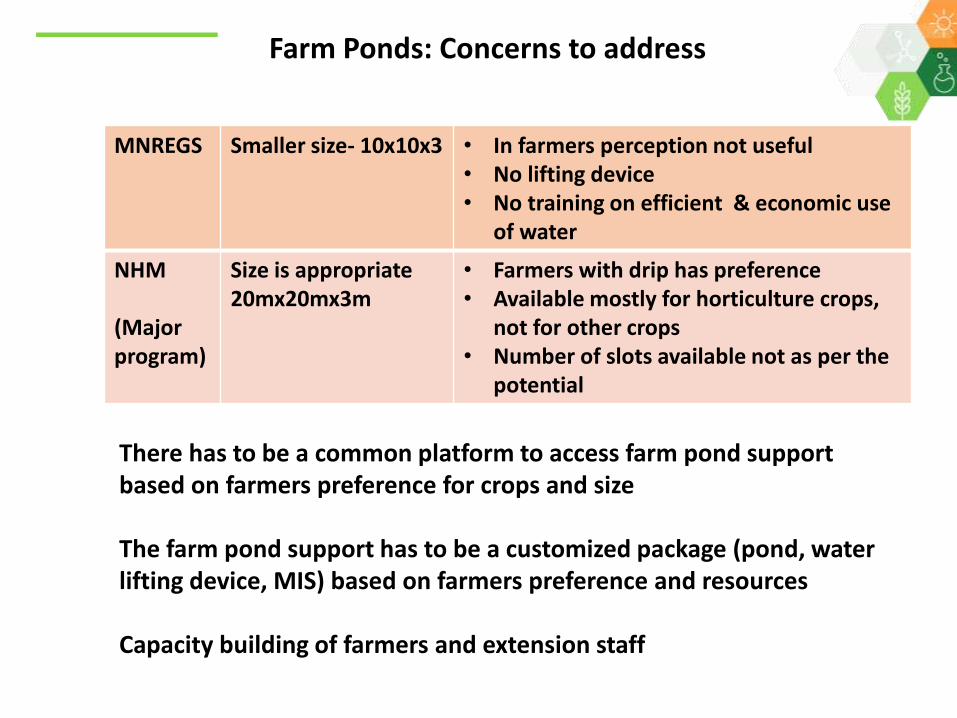
Farm Ponds: Concerns to address
MNREGS Smaller size- 10x10x3 • In farmers perception not useful• No lifting device• No training on efficient & economic use
of water
NHM
(Major program)
Size is appropriate20mx20mx3m
• Farmers with drip has preference• Available mostly for horticulture crops,
not for other crops• Number of slots available not as per the
potential
There has to be a common platform to access farm pond support based on farmers preference for crops and size
The farm pond support has to be a customized package (pond, water lifting device, MIS) based on farmers preference and resources
Capacity building of farmers and extension staff
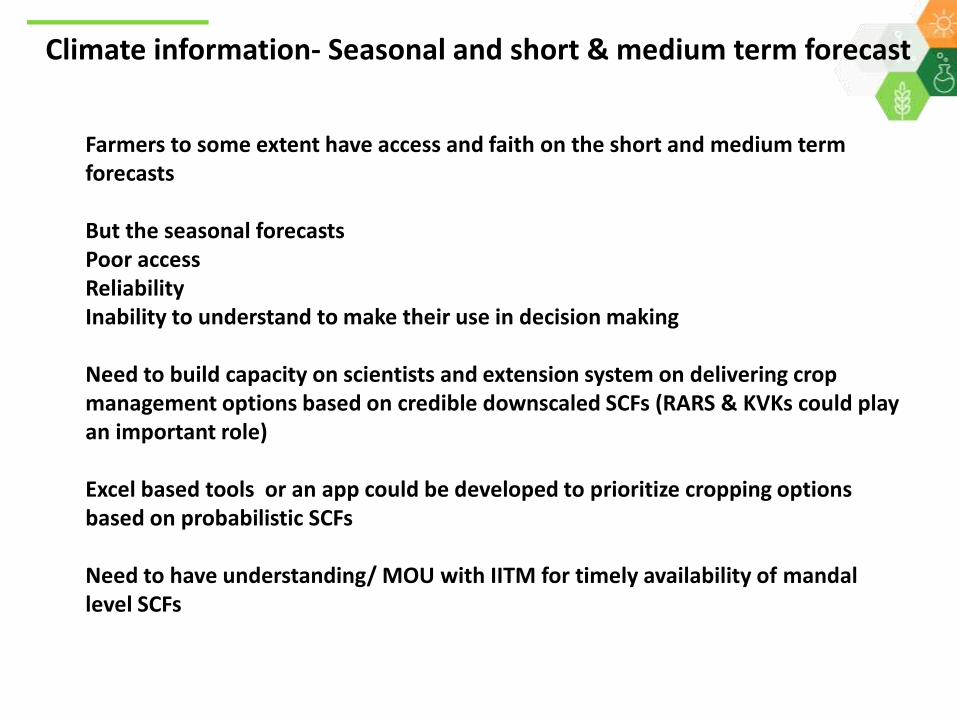
Climate information- Seasonal and short & medium term forecast
Farmers to some extent have access and faith on the short and medium term forecasts
But the seasonal forecasts Poor access ReliabilityInability to understand to make their use in decision making
Need to build capacity on scientists and extension system on delivering crop management options based on credible downscaled SCFs (RARS & KVKs could play an important role)
Excel based tools or an app could be developed to prioritize cropping options based on probabilistic SCFs
Need to have understanding/ MOU with IITM for timely availability of mandallevel SCFs
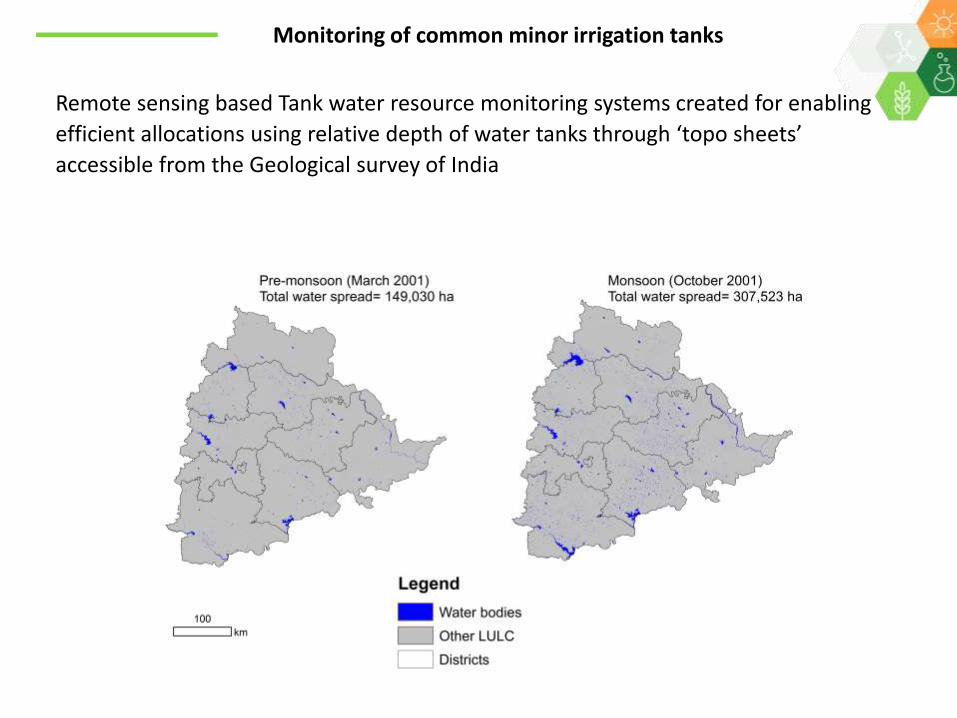
Remote sensing based Tank water resource monitoring systems created for enabling
efficient allocations using relative depth of water tanks through ‘topo sheets’
accessible from the Geological survey of India
Monitoring of common minor irrigation tanks
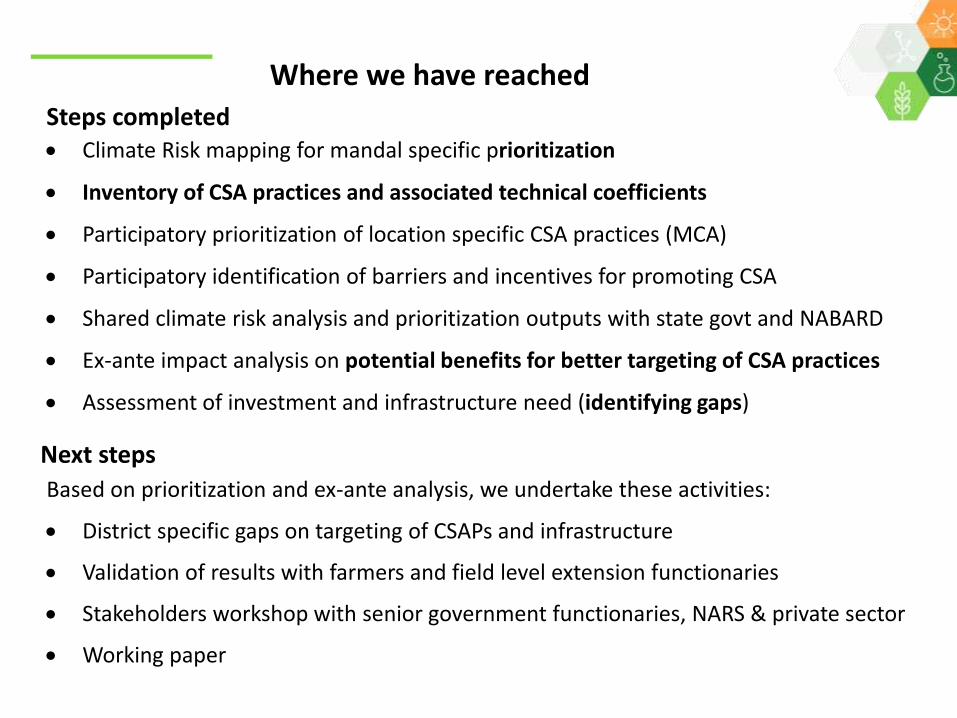
Based on prioritization and ex-ante analysis, we undertake these activities:
District specific gaps on targeting of CSAPs and infrastructure
Validation of results with farmers and field level extension functionaries
Stakeholders workshop with senior government functionaries, NARS & private sector
Working paper
Where we have reached
Climate Risk mapping for mandal specific prioritization
Inventory of CSA practices and associated technical coefficients
Participatory prioritization of location specific CSA practices (MCA)
Participatory identification of barriers and incentives for promoting CSA
Shared climate risk analysis and prioritization outputs with state govt and NABARD
Ex-ante impact analysis on potential benefits for better targeting of CSA practices
Assessment of investment and infrastructure need (identifying gaps)
Steps completed
Next steps
Thank you!