Embed Size (px)
Citation preview
REPUBLIC OF INDONESIA
MINISTRY OF FINANCE
INTEGRITY • PROFESSIONALISM • SINERGY • SERVICE EXCELLENCE • CONTINUOUS LEARNING
12th OECD-Asian Senior Budget Officials Annual Meeting
Bangkok, 15 – 16 December 2016
1
Indonesia: Managing Public
Spending for Sustainable Growth
Presented by Didik Kusnaini

INTEGRITY • PROFESSIONALISM • SINERGY • SERVICE EXCELLENCE • CONTINUOUS LEARNING
Strong Commitment to Continue The Ongoing Reform Through Fiscal Policy:
(1) Friendly for Growth, (2) Effective in Reducing Poverty and Inequality, and (3) Increasing People Participation
Ministry of Finance, Republic of Indonesia

3 INTEGRITY • PROFESSIONALISM • SINERGY • SERVICE EXCELLENCE • CONTINUOUS LEARNING
• Inflation Management
• Prudent monetary policy support for stabilization and growth
• Accommodative Macro-prudential Policy
• Effort to reduce volatility
Budget • Focusing on more sustainable
revenue, esp. taxation • More realistic revenue target
calculation • Increasing more productive
spending, inc. infrastructure • Budget efficiency on non-priority
spending • More sustainable financing • Maintaining fiscal rule of 3%
deficit to GDP
Incentives • Investment friendly policies • Regulation to stimulate the trade
of high value added domestic products
Budget • Better targeted subsidy • Social welfare spending • Strengthening regional
involvement through intergovernmental transfer
Incentives • Effort to maintain consumption
growth • Deregulations to ease business
climate • Increasing non taxable income
threshold • Improving the easiness in
doing business
Main strategy to spur economic growth Integrated policy framework to achieve sustainable and equitable growth
Growth Friendly Fiscal Policy To
Achieve Sustainable And Equitable Growth
LONG Term Policies
Supportive yet independent
monetary policies
SHORT – MEDIUM
Term Policies
By utilizing: - Credible and realistic budget - Incentives for strategic sectors - Support for stable consumption
4 INTEGRITY • PROFESSIONALISM • SINERGY • SERVICE EXCELLENCE • CONTINUOUS LEARNING
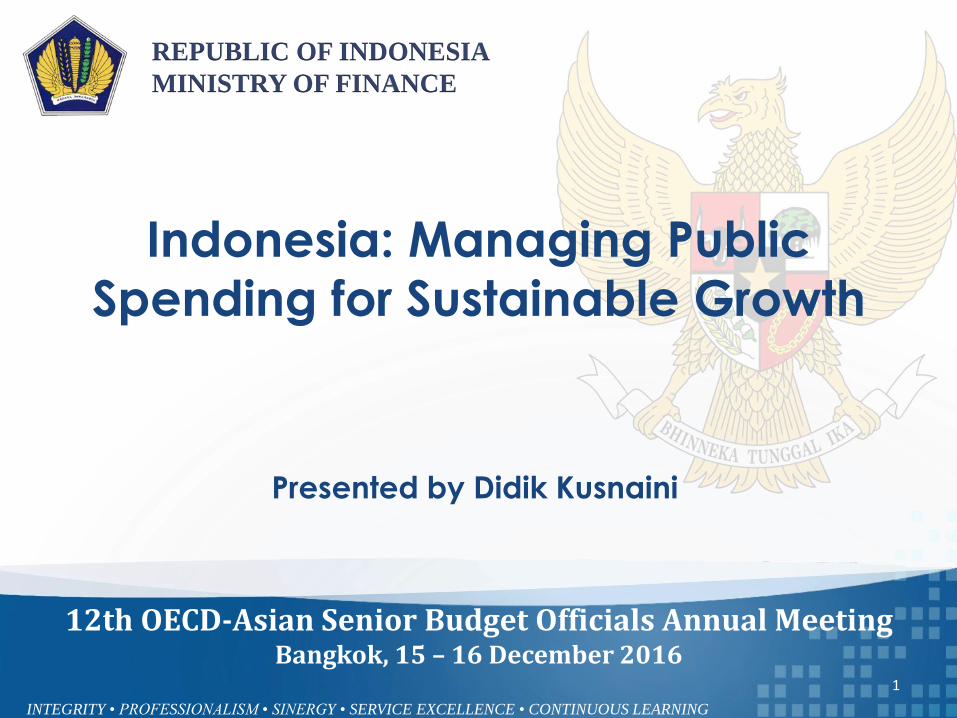
Description (IDR Trillion) 2016
R-Budget September FY Outlook
A. Revenue 1.786,2 1.081,2 1.582,9
I. Domestic Revenue 1.784,2 1.080,0 1.580,9
1. Tax Revenue 1.539,2 896,1 1.320,2
2. Non Tax Revenue 245,1 183,8 260,7
II. Grant 2,0 1,2 2,0
B. Government Expenditure 2.082,9 1.305,5 1.898,6
I. Central Government 1.306,7 767,7 1.195,3
1. Ministerial Spending 767,8 428,6 672,0
2. Non Ministerial Spending 538,9 339,1 523,3
II. Intergovernmental Transfer 776,3 537,8 703,3
1. Regional Transfer 729,3 501,0 659,1
2. Village Fund 47,0 36,8 44,2
C. Primary Balance (105,5) -77,7 (126,4)
D. Surplus/Deficit (296,7) -224,3 (315,7)
% to GDP (2,35) -1,79 (2,50)
E. Financing 296,7 391,9 315,7
I. Debt Securities 371,6 n/a 387,8
II. Investment Financing (94,0) n/a (91,5)
III. Other Financing 19,1 n/a 19,4
2016 BUDGET OUTLOOK OBJECTIVES • More realistic budget position • Strengthening Government’s credibility
in managing Budget • Improving market confidence • Reliable baseline to formulate 2017
budget
SHORTFALL PROJECTION State Revenue : Rp203,3 T Taxation Revenue : Rp219,0 T Adjustment from: a) Global and domestic slowdown; b) Low Commodity prices (oil, coal, and
CPO)
SPENDING ADJUSTMENT • Efficiency on less priority expenditure • Meanwhile, productive spending is
preserved • Adjustment on intergovernmental
transfer
WIDER DEFICIT TO MAINTAIN THE GROWTH PACE • But still maintained below 3%
2016 Budget consolidation to be more realistic and credible Adjusting budget to be align with current economic condition
5 INTEGRITY • PROFESSIONALISM • SINERGY • SERVICE EXCELLENCE • CONTINUOUS LEARNING
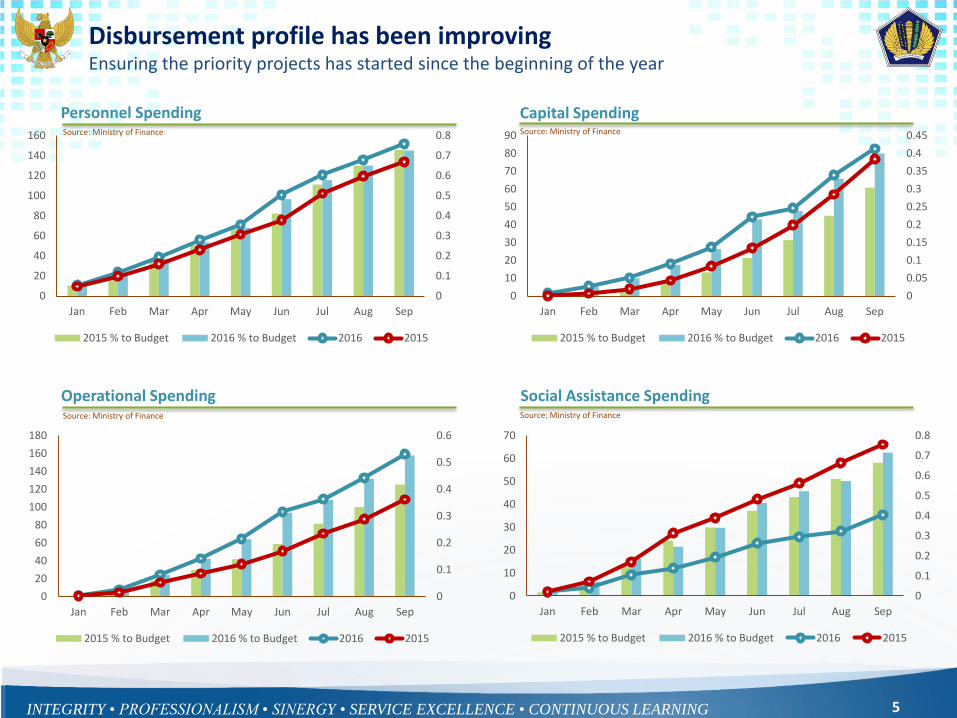
Disbursement profile has been improving Ensuring the priority projects has started since the beginning of the year
Operational Spending Social Assistance Spending
Capital Spending Personnel Spending Source: Ministry of Finance Source: Ministry of Finance
Source: Ministry of Finance Source: Ministry of Finance
0
0.1
0.2
0.3
0.4
0.5
0.6
0.7
0.8
0
20
40
60
80
100
120
140
160
Jan Feb Mar Apr May Jun Jul Aug Sep
2015 % to Budget 2016 % to Budget 2016 2015
0
0.05
0.1
0.15
0.2
0.25
0.3
0.35
0.4
0.45
0
10
20
30
40
50
60
70
80
90
Jan Feb Mar Apr May Jun Jul Aug Sep
2015 % to Budget 2016 % to Budget 2016 2015
0
0.1
0.2
0.3
0.4
0.5
0.6
0
20
40
60
80
100
120
140
160
180
Jan Feb Mar Apr May Jun Jul Aug Sep
2015 % to Budget 2016 % to Budget 2016 2015
0
0.1
0.2
0.3
0.4
0.5
0.6
0.7
0.8
0
10
20
30
40
50
60
70
Jan Feb Mar Apr May Jun Jul Aug Sep
2015 % to Budget 2016 % to Budget 2016 2015

INTEGRITY • PROFESSIONALISM • SINERGY • SERVICE EXCELLENCE • CONTINUOUS LEARNING
Government Strengthens Its Commitment on the Budget Reform
as Reflected in the 2017 Budget Ministry of Finance, Republic of Indonesia
7 INTEGRITY • PROFESSIONALISM • SINERGY • SERVICE EXCELLENCE • CONTINUOUS LEARNING
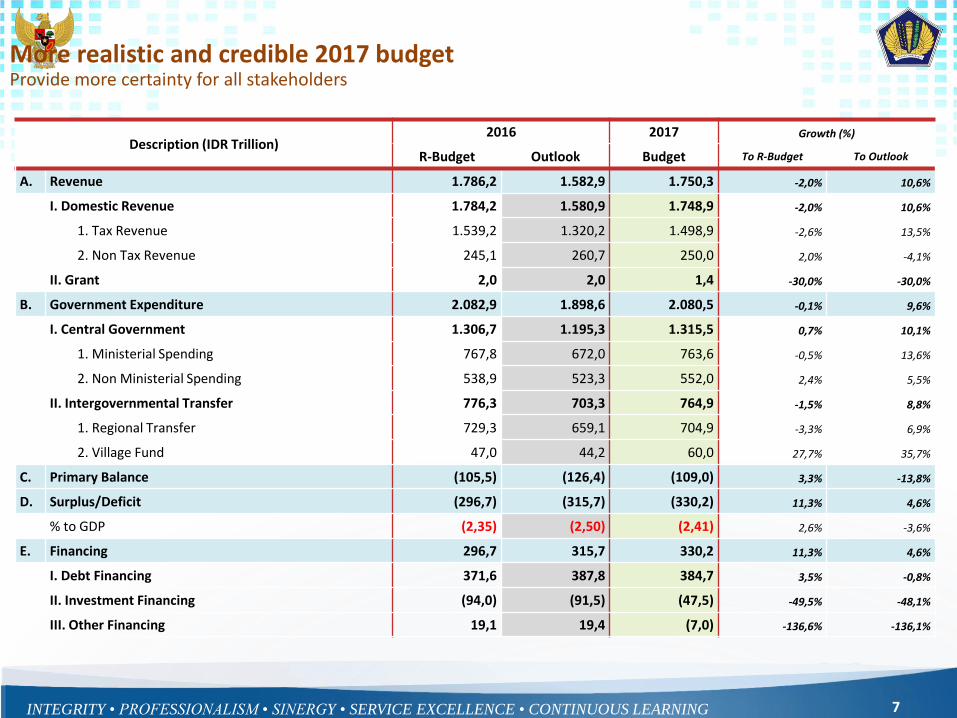
More realistic and credible 2017 budget Provide more certainty for all stakeholders
Description (IDR Trillion) 2016 2017 Growth (%)
R-Budget Outlook Budget To R-Budget To Outlook
A. Revenue 1.786,2 1.582,9 1.750,3 -2,0% 10,6%
I. Domestic Revenue 1.784,2 1.580,9 1.748,9 -2,0% 10,6%
1. Tax Revenue 1.539,2 1.320,2 1.498,9 -2,6% 13,5%
2. Non Tax Revenue 245,1 260,7 250,0 2,0% -4,1%
II. Grant 2,0 2,0 1,4 -30,0% -30,0%
B. Government Expenditure 2.082,9 1.898,6 2.080,5 -0,1% 9,6%
I. Central Government 1.306,7 1.195,3 1.315,5 0,7% 10,1%
1. Ministerial Spending 767,8 672,0 763,6 -0,5% 13,6%
2. Non Ministerial Spending 538,9 523,3 552,0 2,4% 5,5%
II. Intergovernmental Transfer 776,3 703,3 764,9 -1,5% 8,8%
1. Regional Transfer 729,3 659,1 704,9 -3,3% 6,9%
2. Village Fund 47,0 44,2 60,0 27,7% 35,7%
C. Primary Balance (105,5) (126,4) (109,0) 3,3% -13,8%
D. Surplus/Deficit (296,7) (315,7) (330,2) 11,3% 4,6%
% to GDP (2,35) (2,50) (2,41) 2,6% -3,6%
E. Financing 296,7 315,7 330,2 11,3% 4,6%
I. Debt Financing 371,6 387,8 384,7 3,5% -0,8%
II. Investment Financing (94,0) (91,5) (47,5) -49,5% -48,1%
III. Other Financing 19,1 19,4 (7,0) -136,6% -136,1%
8 INTEGRITY • PROFESSIONALISM • SINERGY • SERVICE EXCELLENCE • CONTINUOUS LEARNING
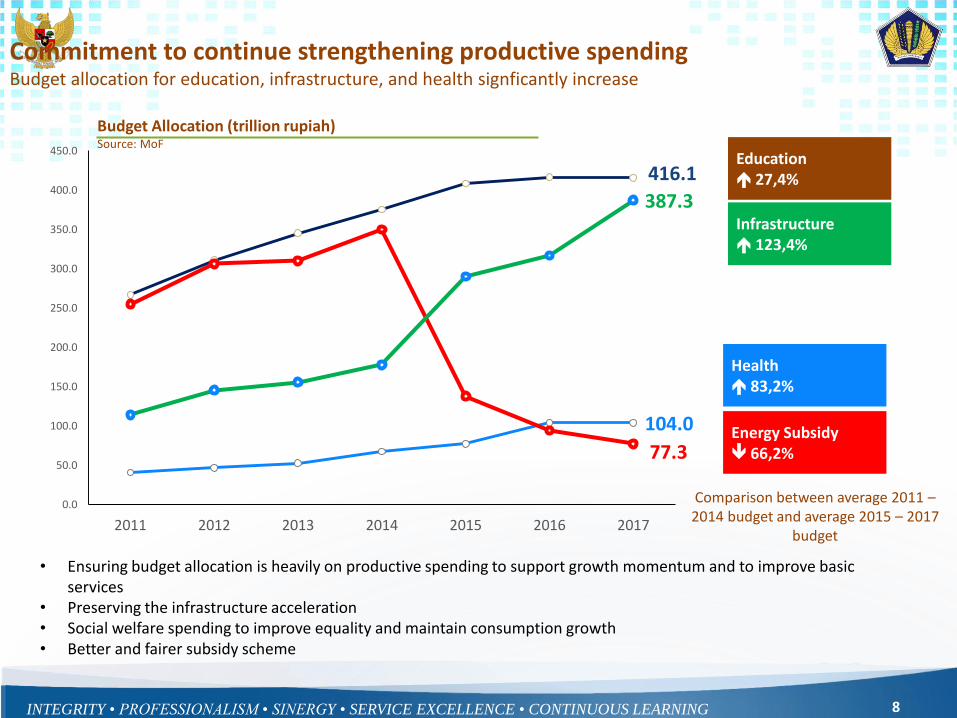
Education 27,4%
Infrastructure 123,4%
Energy Subsidy 66,2%
Health 83,2%
Budget Allocation (trillion rupiah) Source: MoF
Comparison between average 2011 – 2014 budget and average 2015 – 2017
budget
Commitment to continue strengthening productive spending Budget allocation for education, infrastructure, and health signficantly increase
• Ensuring budget allocation is heavily on productive spending to support growth momentum and to improve basic services
• Preserving the infrastructure acceleration • Social welfare spending to improve equality and maintain consumption growth • Better and fairer subsidy scheme
416.1
104.0
77.3
387.3
0.0
50.0
100.0
150.0
200.0
250.0
300.0
350.0
400.0
450.0
2011 2012 2013 2014 2015 2016 2017

9 INTEGRITY • PROFESSIONALISM • SINERGY • SERVICE EXCELLENCE • CONTINUOUS LEARNING
416.1
0
50
100
150
200
250
300
350
400
450
2009 2010 2011 2012 2013 2014 2015 2016 2017APBN
Rp Tn
104.0 2.7 2.8 3.0
2.7 2.8 3.3
3.8
5.0 5.0
-
1.00
2.00
3.00
4.00
5.00
6.00
0
50
100
150
200
2009 2010 2011 2012 2013 2014 2015 2016 2017APBN
APBNP
% of APBNP
Rp Tn %
Budget for Health Program
Budget for Education Program
% of Budget
Budget
Certification 101,100 teachers 10,200 lecturers
Immunization Basic and complete immunization for 92% of 0-11 months old infants
Bidikmisi 360.5 thousands college students
Health Insurance Subsidy (PBI) 94.4 million people
School Operational Assistance (BOS) 8.5 million students
Community Health Centre (Puskesmas) 700 regencies School
Rehabilitation 41,128 rooms
Stunting Prevention Stunting prevention to 29.6% of children below 2 years old
Family Plan Program (KB) 6.7 million people
Operational Assistance for Colleges 107 Colleges/Universities
Indonesia Smart Card (KIP) 19.5 million students
Priority programs to improve basic service as well as to address poverty and inequality Maintaining 20 percent and 5 percent of budget for education and health, respectively
10 INTEGRITY • PROFESSIONALISM • SINERGY • SERVICE EXCELLENCE • CONTINUOUS LEARNING
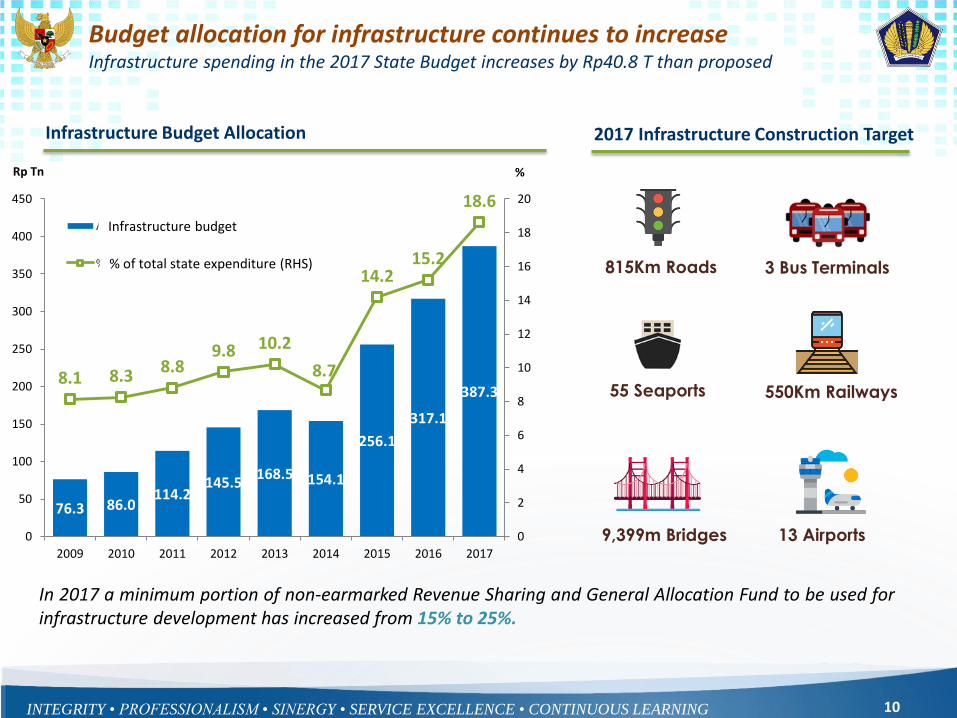
76.3 86.0 114.2
145.5 168.5 154.1
256.1
317.1
387.3 8.1 8.3
8.8 9.8 10.2
8.7
14.2 15.2
18.6
0
2
4
6
8
10
12
14
16
18
20
0
50
100
150
200
250
300
350
400
450
2009 2010 2011 2012 2013 2014 2015 2016 2017
% Rp Tn
Anggaran Infrastruktur
% thd Belanja Negara (RHS)
In 2017 a minimum portion of non-earmarked Revenue Sharing and General Allocation Fund to be used for infrastructure development has increased from 15% to 25%.
Infrastructure budget
% of total state expenditure (RHS)
Infrastructure Budget Allocation 2017 Infrastructure Construction Target
Budget allocation for infrastructure continues to increase Infrastructure spending in the 2017 State Budget increases by Rp40.8 T than proposed
13 Airports
3 Bus Terminals
55 Seaports 550Km Railways
9,399m Bridges
815Km Roads

11 INTEGRITY • PROFESSIONALISM • SINERGY • SERVICE EXCELLENCE • CONTINUOUS LEARNING
137.8
94.4 77.3 74.3
83.4 82.7
65%
53%
48%
35%
47%
52%
0%
10%
20%
30%
40%
50%
60%
70%
0
20
40
60
80
100
120
140
160
2015 2016 2017
Energy Subsidy Non Energy Subsidy
Portion of Ener. Subs Portion of Non Ener. Subs
In IDR Tn
Better targeting of subsidies policy in 2017 The non energy subsidy allocation is now higher than energy subsidy
Energy Subsidy
Fuel and 3kg LPG subsidies Rp32.3 T: Using close distribution (by name and by
address) Gradual implementation Recipients are 26 million poor households and
2.3 million micro business
Electricity subsidy Rp45,0 T: Recipients are 19.1 million customers of R-1/450
VA and 4.05 million customers of R-1/900 VA For non poor customers of 900VA, the tariff will
be gradually adjusted by three times every two months.
Non Energy Subsidy Food subsidy will be given to 14.3 million
households Gradual conversion of Rastra (rice for the poor)
to become non-cash/voucher food assistance program. Pilot project in 44 cities.
Fertilizer and seeds subsidies program are directed to support the improvement of agriculture productivity
Provision of 9.55 millions volume of fertilizer subsidy
Seeds subsidy provision for rice and soybean. Support MSME through KUR (interest subsidy)
Share of Ener. Subs Share of Non Ener. Subs
12 INTEGRITY • PROFESSIONALISM • SINERGY • SERVICE EXCELLENCE • CONTINUOUS LEARNING
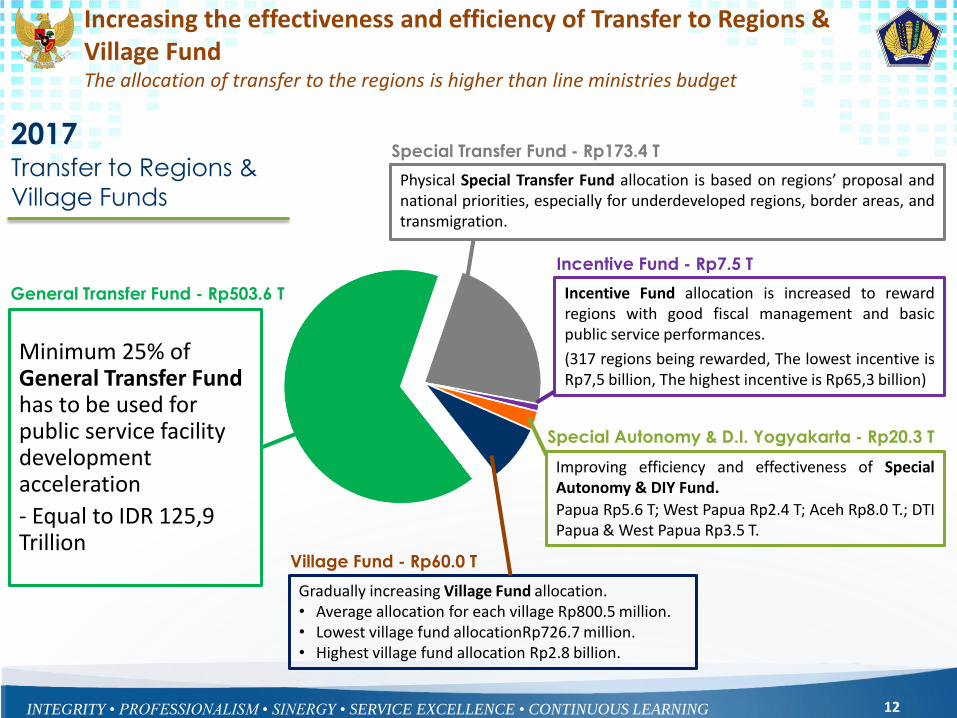
Minimum 25% of General Transfer Fund has to be used for public service facility development acceleration
- Equal to IDR 125,9 Trillion
General Transfer Fund - Rp503.6 T
Physical Special Transfer Fund allocation is based on regions’ proposal and national priorities, especially for underdeveloped regions, border areas, and transmigration.
Special Transfer Fund - Rp173.4 T
Incentive Fund allocation is increased to reward regions with good fiscal management and basic public service performances.
(317 regions being rewarded, The lowest incentive is Rp7,5 billion, The highest incentive is Rp65,3 billion)
Incentive Fund - Rp7.5 T
Gradually increasing Village Fund allocation. • Average allocation for each village Rp800.5 million. • Lowest village fund allocationRp726.7 million. • Highest village fund allocation Rp2.8 billion.
Village Fund - Rp60.0 T
Improving efficiency and effectiveness of Special Autonomy & DIY Fund.
Papua Rp5.6 T; West Papua Rp2.4 T; Aceh Rp8.0 T.; DTI Papua & West Papua Rp3.5 T.
Special Autonomy & D.I. Yogyakarta - Rp20.3 T
Increasing the effectiveness and efficiency of Transfer to Regions & Village Fund The allocation of transfer to the regions is higher than line ministries budget
2017 Transfer to Regions &
Village Funds
13 INTEGRITY • PROFESSIONALISM • SINERGY • SERVICE EXCELLENCE • CONTINUOUS LEARNING
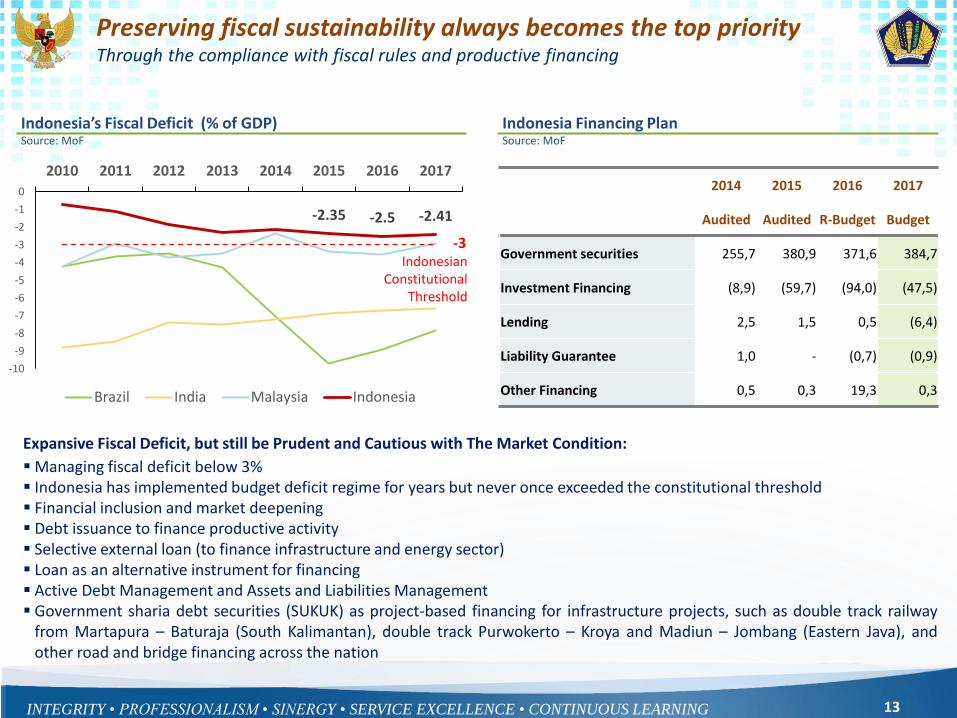
Preserving fiscal sustainability always becomes the top priority Through the compliance with fiscal rules and productive financing
2014 2015 2016 2017
Audited Audited R-Budget Budget
Government securities 255,7 380,9 371,6 384,7
Investment Financing (8,9) (59,7) (94,0) (47,5)
Lending 2,5 1,5 0,5 (6,4)
Liability Guarantee 1,0 - (0,7) (0,9)
Other Financing 0,5 0,3 19,3 0,3
Expansive Fiscal Deficit, but still be Prudent and Cautious with The Market Condition:
Managing fiscal deficit below 3% Indonesia has implemented budget deficit regime for years but never once exceeded the constitutional threshold Financial inclusion and market deepening Debt issuance to finance productive activity Selective external loan (to finance infrastructure and energy sector) Loan as an alternative instrument for financing Active Debt Management and Assets and Liabilities Management Government sharia debt securities (SUKUK) as project-based financing for infrastructure projects, such as double track railway
from Martapura – Baturaja (South Kalimantan), double track Purwokerto – Kroya and Madiun – Jombang (Eastern Java), and other road and bridge financing across the nation
Indonesia’s Fiscal Deficit (% of GDP) Source: MoF
-2.35 -2.5 -2.41
-3
-10
-9
-8
-7
-6
-5
-4
-3
-2
-1
0
2010 2011 2012 2013 2014 2015 2016 2017
Brazil India Malaysia Indonesia
Indonesian Constitutional
Threshold
Indonesia Financing Plan Source: MoF
14 INTEGRITY • PROFESSIONALISM • SINERGY • SERVICE EXCELLENCE • CONTINUOUS LEARNING
4.1
5.9 6.6
7.9 8.0 9.3
10.4
4.4 4.3 4.6 3.4
7.1
-
2.00
4.00
6.00
8.00
10.00
12.00
Thai
lan
dB
aa1
Sou
th A
fric
aB
aa2 Tu
rki
Ba1
Ind
iaB
aa3
Ph
ilip
pin
es
Baa
2
Ind
on
esia
Baa
3
Bra
zil
Ba2
Avg. Coupon Avg. Coupon
7.6 10.0
16.0 16.6 16.9 19.6
21.4
13.6 14.6
16.9
11.0
16.5
-
5.00
10.00
15.00
20.00
25.00
Turk
iB
a1
Ph
ilip
pin
es
Baa
2
Bra
zil
Ba2
Ind
iaB
aa3
Ind
on
esia
Baa
3
Thai
lan
dB
aa1
Sou
th A
fric
aB
aa2
Avg. Actual Tenor Avg. Actual Tenor
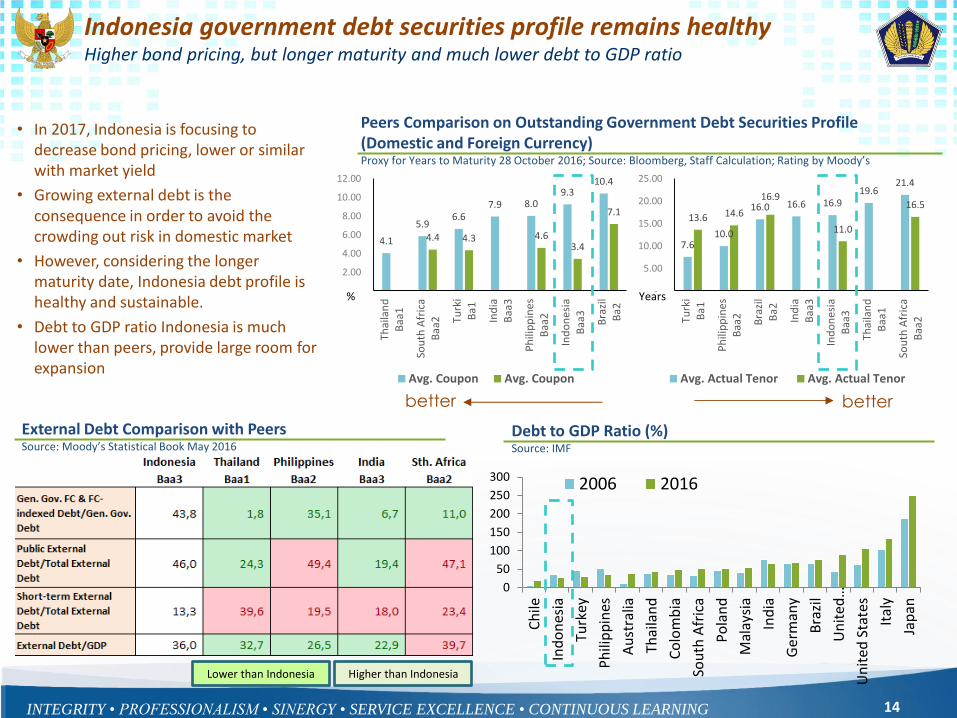
Peers Comparison on Outstanding Government Debt Securities Profile (Domestic and Foreign Currency) Proxy for Years to Maturity 28 October 2016; Source: Bloomberg, Staff Calculation; Rating by Moody’s
better better
0
50
100
150
200
250
300
Ch
ile
Ind
on
esia
Turk
ey
Ph
ilip
pin
es
Au
stra
lia
Thai
lan
d
Co
lom
bia
Sou
th A
fric
a
Po
lan
d
Mal
aysi
a
Ind
ia
Ger
man
y
Bra
zil
Un
ited
…
Un
ited
Sta
tes
Ital
y
Jap
an
2006 2016
Debt to GDP Ratio (%) Source: IMF
External Debt Comparison with Peers Source: Moody’s Statistical Book May 2016
• In 2017, Indonesia is focusing to decrease bond pricing, lower or similar with market yield
• Growing external debt is the consequence in order to avoid the crowding out risk in domestic market
• However, considering the longer maturity date, Indonesia debt profile is healthy and sustainable.
• Debt to GDP ratio Indonesia is much lower than peers, provide large room for expansion
% Years
Indonesia government debt securities profile remains healthy Higher bond pricing, but longer maturity and much lower debt to GDP ratio
Lower than Indonesia Higher than Indonesia

15 INTEGRITY • PROFESSIONALISM • SINERGY • SERVICE EXCELLENCE • CONTINUOUS LEARNING
PT. Waskita Karya (Persero) Tbk Capital Injection 2015 IDR. 3,5 Trillion
FY 2015 Audited
Q2 2016 Unaudited
Total Liabilities (IDR Trillion) 20,6 30,2
Total Equity (IDR Trillion) 9,7 10,3
Total Asset (IDR Trillion) 30,3 40,5
(Tot. Liabilities 2016 – Tot. Liabilities 2015) Injected Capital
2,75 x
IDR. 2 Trillion - National strategic
infrastructure project - Priority project - PPP
IDR. 1 Trillion - Focus on infrastructure
project’s guarantee, esp. PPP Projects
IDR. 2 Trillion - Support 1 million houses
program
IDR. 2 Trillion - Support export-oriented
enterprises - Continue the National Interest
Account (NIA) program
State Asset Management (BLU LMAN) IDR. 20 Trillion
Mainly, to support 30 national strategic infrastructure project (as land bank) and other states property management Existing Assets Portfolio: Ex-Pertamina (e.g. LNG Badak Bontang assets), Ex-BPPN
More targeted and strategic capital injection To leverage SOEs capital which have strong relation to infrastructure development and export performance
The effectiveness of 2015 Government Capital Injection to Leverage SOE’s Financing: PT. Waskita Karya (Persero) Tbk Source: MoF
INTEGRITY • PROFESSIONALISM • SINERGY • SERVICE EXCELLENCE • CONTINUOUS LEARNING
Thank You Ministry of Finance, Republic of Indonesia
17 INTEGRITY • PROFESSIONALISM • SINERGY • SERVICE EXCELLENCE • CONTINUOUS LEARNING
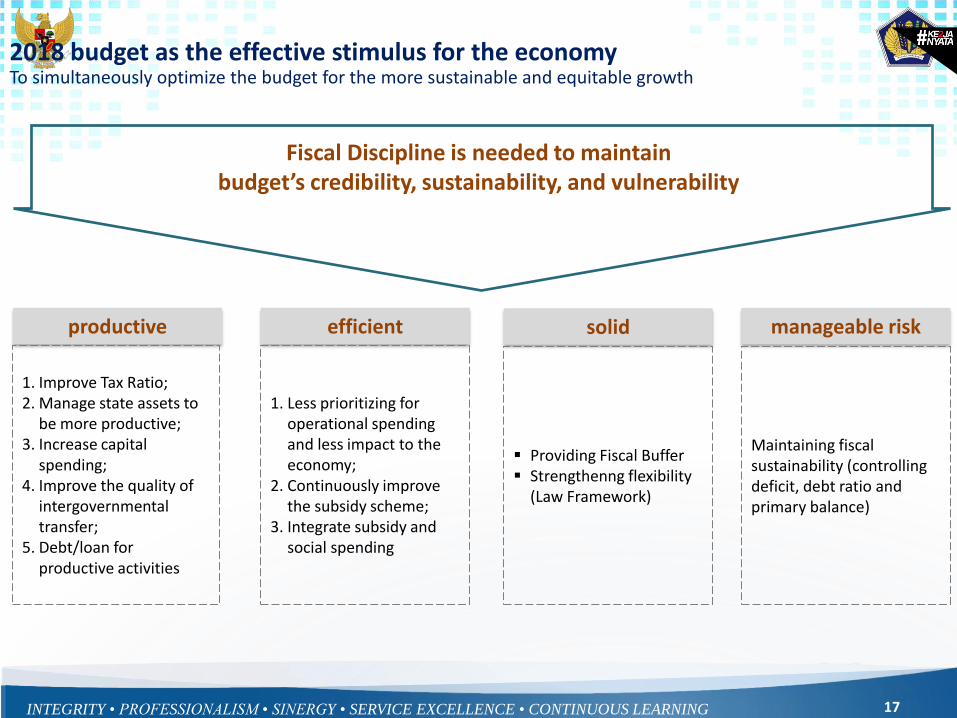
Fiscal Discipline is needed to maintain budget’s credibility, sustainability, and vulnerability
productive efficient solid manageable risk
1. Improve Tax Ratio; 2. Manage state assets to
be more productive; 3. Increase capital
spending; 4. Improve the quality of
intergovernmental transfer;
5. Debt/loan for productive activities
1. Less prioritizing for operational spending and less impact to the economy;
2. Continuously improve the subsidy scheme;
3. Integrate subsidy and social spending
Providing Fiscal Buffer Strengthenng flexibility
(Law Framework)
Maintaining fiscal sustainability (controlling deficit, debt ratio and primary balance)
2018 budget as the effective stimulus for the economy To simultaneously optimize the budget for the more sustainable and equitable growth


![Amanah Saham Nasional Berhad (ASNB) - MASTER ......ASB 3 Didik : Amanah Saham Bumiputera 3 – Didik [formerly kown as Amanah Saham Didik] ASN : Amanah Saham Nasional ASN Imbang 1](https://img.pdfslide.us/doc/110x75/611a65731f6af02a78680513/amanah-saham-nasional-berhad-asnb-master-asb-3-didik-amanah-saham.jpg)