Embed Size (px)
Citation preview
POWER OF PARTNERSHIPS: How Businesses and Municipalities Can Work Together to Solve
Transportation & Economic Development Challenges Through Transportation Demand Management
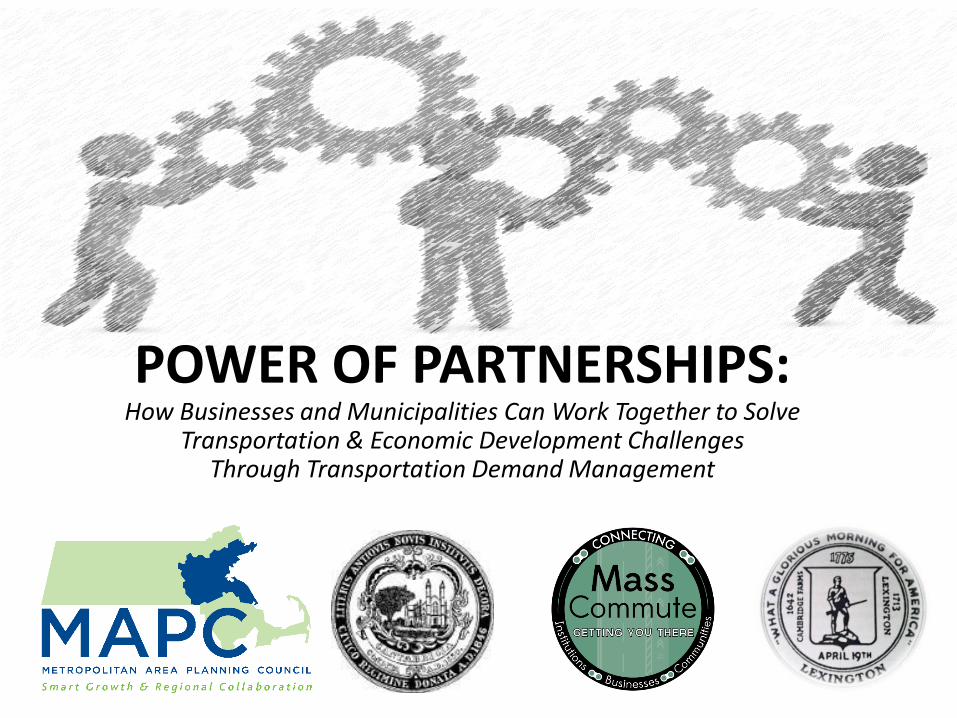
Julia Prange Wallerce
Executive Director, MassCommute
Stephanie Groll
PTDM Officer, City of Cambridge
Alison Felix, AICP
Senior Transportation Planner, MAPC
Melisa Tintocalis
Economic Development Director, Town of Lexington
Alison Felix, AICP
Senior Transportation Planner, MAPC
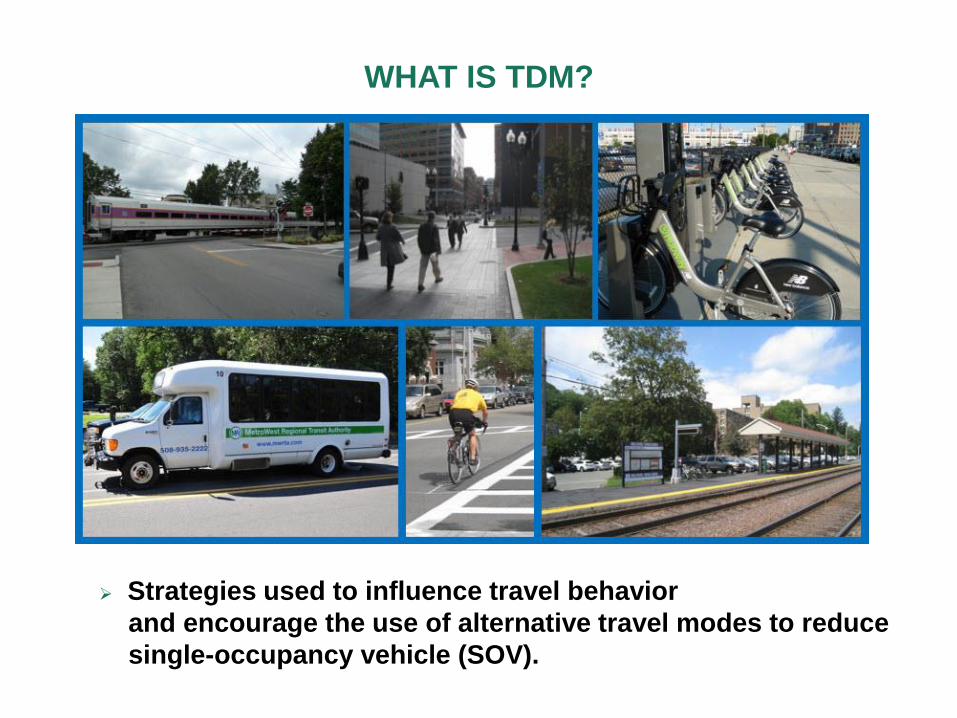
Strategies used to influence travel behavior
and encourage the use of alternative travel modes to reduce
single-occupancy vehicle (SOV).
WHAT IS TDM?
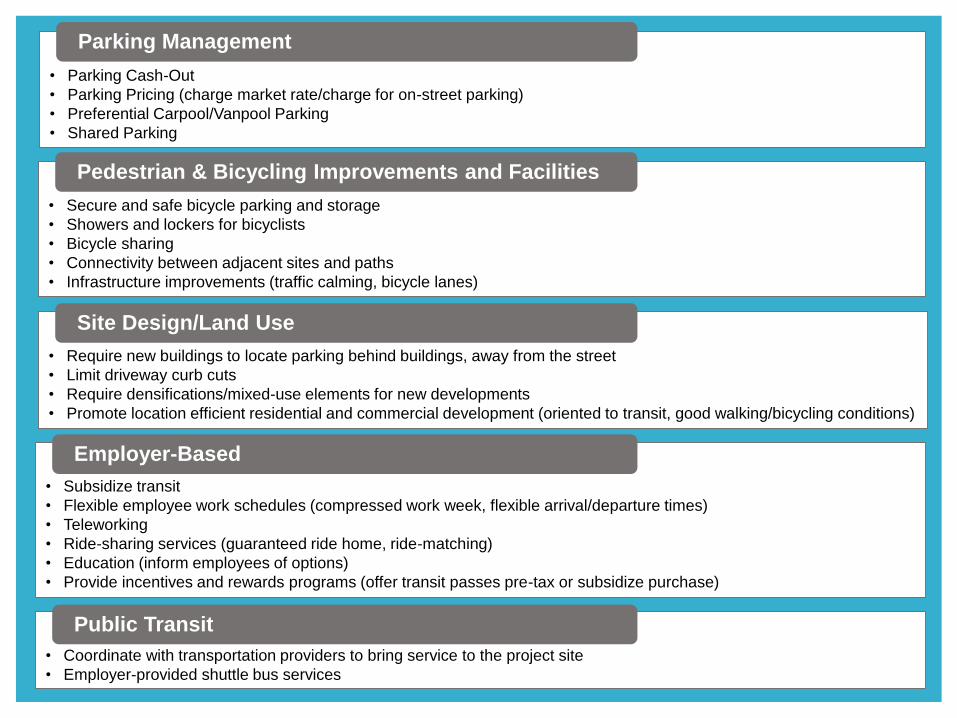
• Parking Cash-Out
• Parking Pricing (charge market rate/charge for on-street parking)
• Preferential Carpool/Vanpool Parking
• Shared Parking
Parking Management
• Secure and safe bicycle parking and storage
• Showers and lockers for bicyclists
• Bicycle sharing
• Connectivity between adjacent sites and paths
• Infrastructure improvements (traffic calming, bicycle lanes)
Pedestrian & Bicycling Improvements and Facilities
• Require new buildings to locate parking behind buildings, away from the street
• Limit driveway curb cuts
• Require densifications/mixed-use elements for new developments
• Promote location efficient residential and commercial development (oriented to transit, good walking/bicycling conditions)
Site Design/Land Use
• Subsidize transit
• Flexible employee work schedules (compressed work week, flexible arrival/departure times)
• Teleworking
• Ride-sharing services (guaranteed ride home, ride-matching)
• Education (inform employees of options)
• Provide incentives and rewards programs (offer transit passes pre-tax or subsidize purchase)
Employer-Based
• Coordinate with transportation providers to bring service to the project site
• Employer-provided shuttle bus services
Public Transit
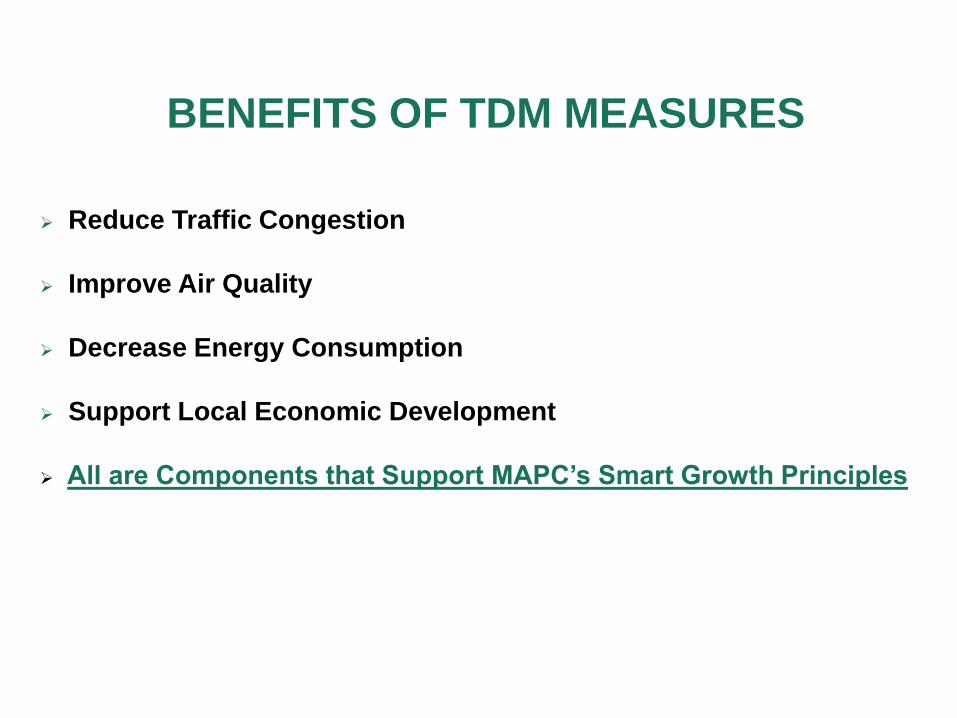
BENEFITS OF TDM MEASURES
Reduce Traffic Congestion
Improve Air Quality
Decrease Energy Consumption
Support Local Economic Development
All are Components that Support MAPC’s Smart Growth Principles
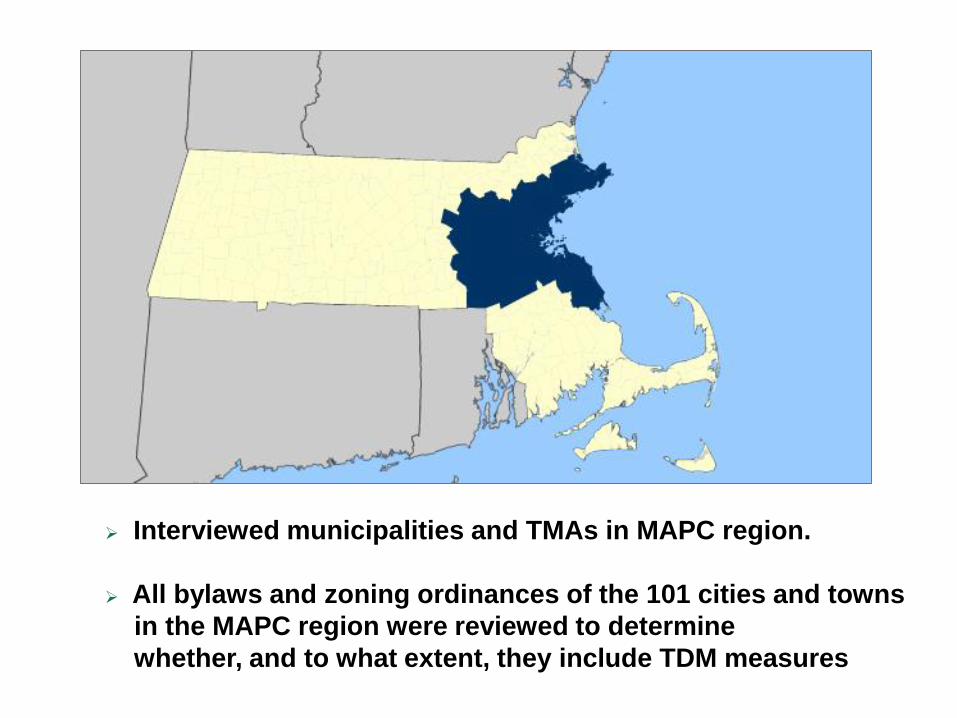
Interviewed municipalities and TMAs in MAPC region.
All bylaws and zoning ordinances of the 101 cities and towns
in the MAPC region were reviewed to determine
whether, and to what extent, they include TDM measures
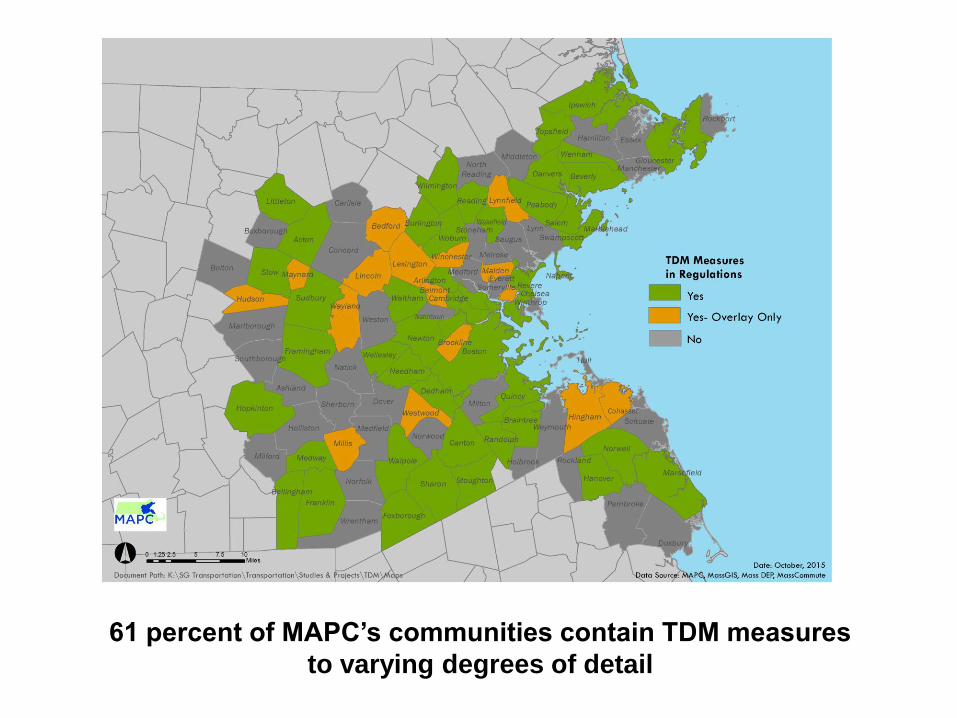
61 percent of MAPC’s communities contain TDM measures
to varying degrees of detail
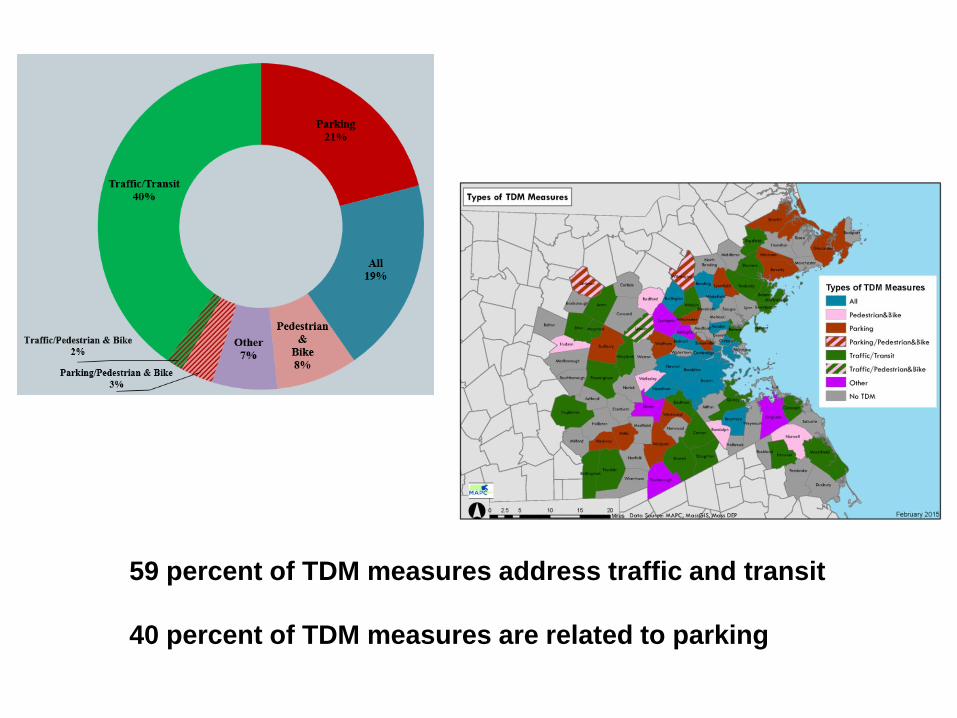
59 percent of TDM measures address traffic and transit
40 percent of TDM measures are related to parking
CASE STUDIES
Extensively researched local and national case studies.
Case studies include various approaches such as parking and
transportation management, transportation mitigation funds,
and required TDM measures in traffic studies.
Specific TDM measures address bicycle parking, design standards,
vehicular parking, and requiring TMA membership and participation
as part of TDM programs.
Report contains over 60 case studies and
the relevant by-law or ordinance.
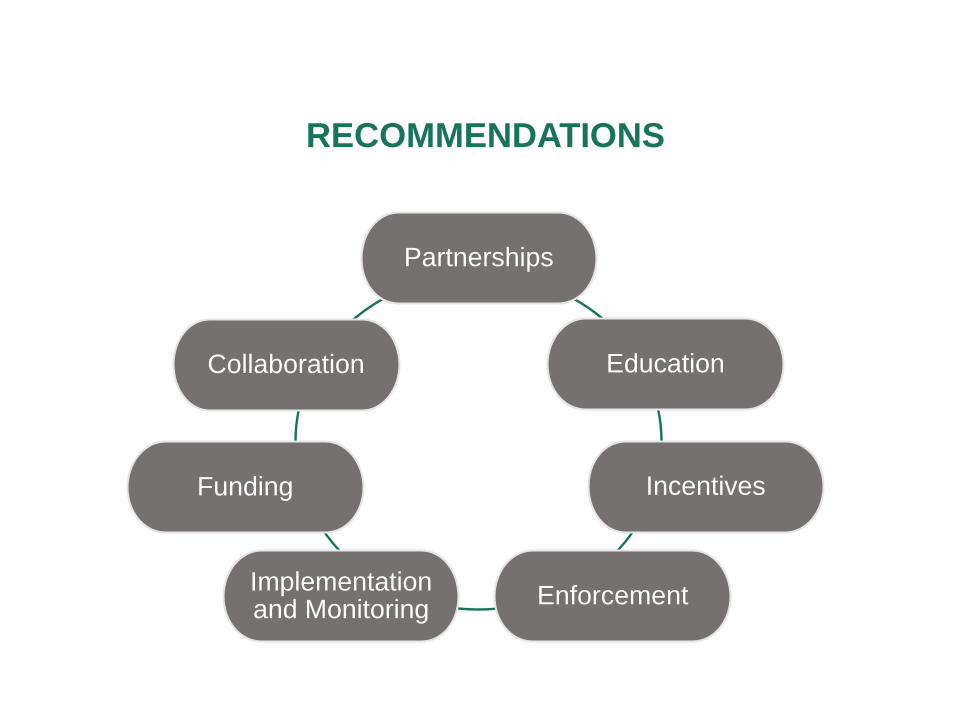
Partnerships
Education
Incentives
EnforcementImplementation and Monitoring
Funding
Collaboration
RECOMMENDATIONS
Stephanie Groll
PTDM Officer, City of Cambridge
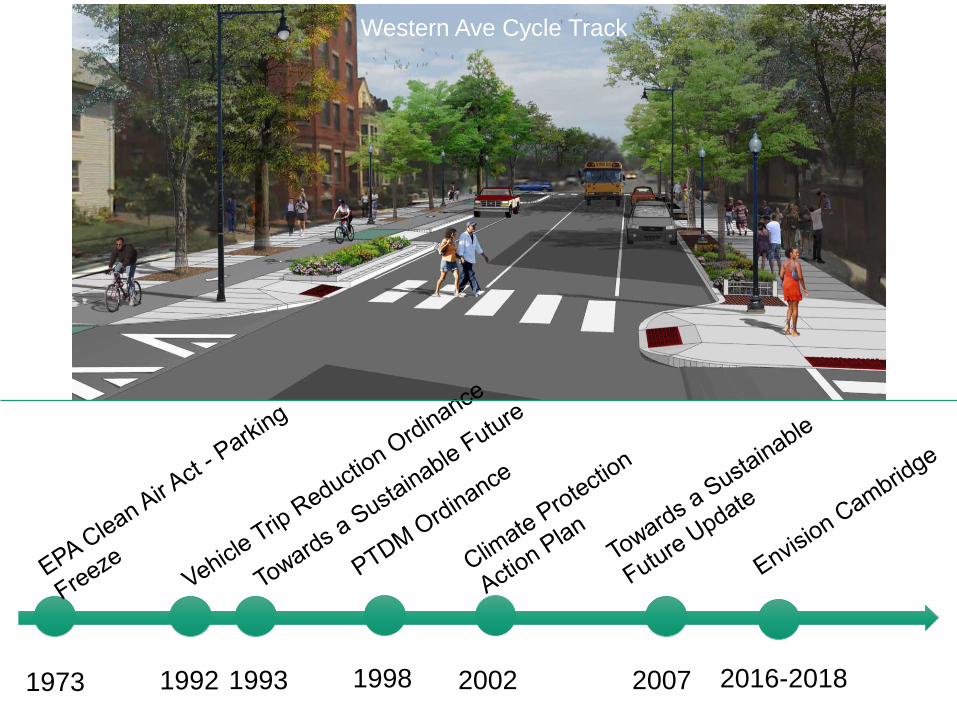
1992 1993 1998 200720021973
Western Ave Cycle Track
2016-2018
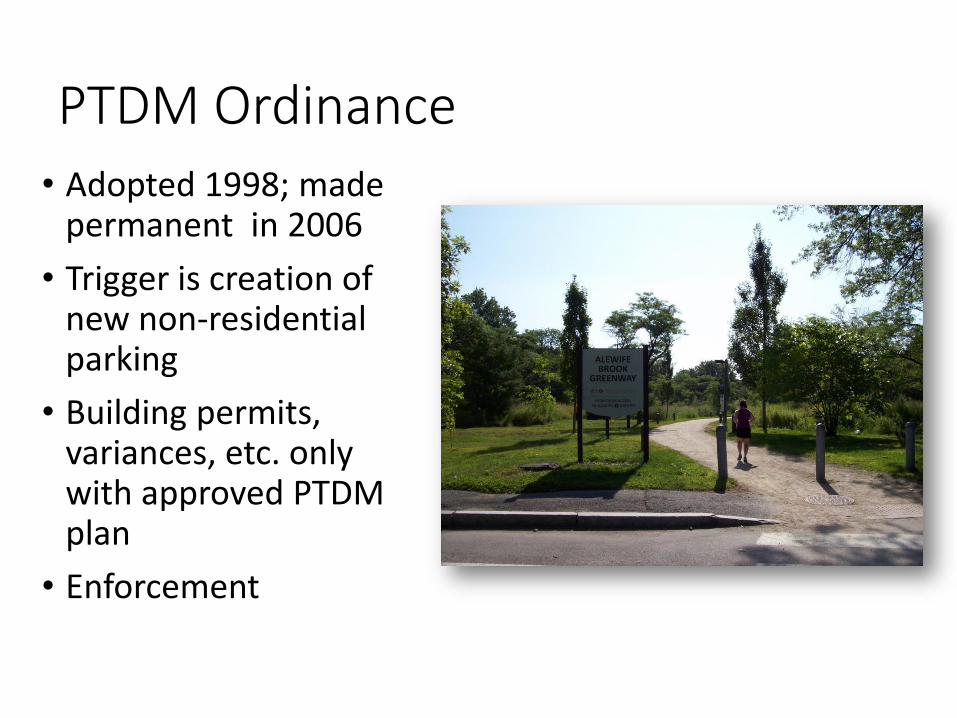
PTDM Ordinance• Adopted 1998; made
permanent in 2006
• Trigger is creation of new non-residential parking
• Building permits, variances, etc. only with approved PTDM plan
• Enforcement
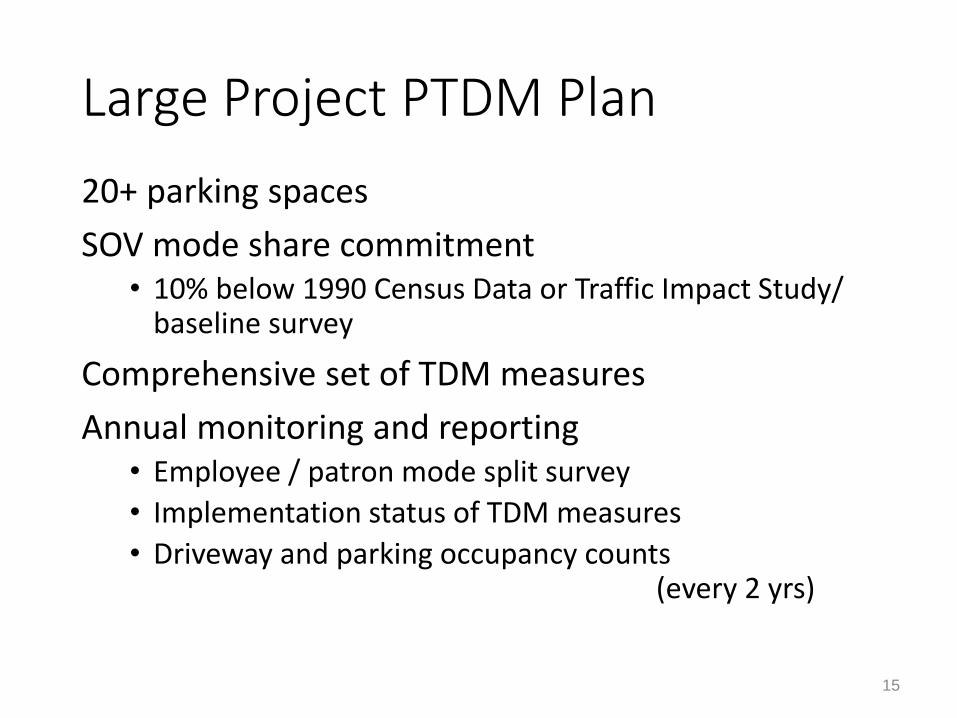
Large Project PTDM Plan
20+ parking spaces
SOV mode share commitment• 10% below 1990 Census Data or Traffic Impact Study/
baseline survey
Comprehensive set of TDM measures
Annual monitoring and reporting• Employee / patron mode split survey
• Implementation status of TDM measures
• Driveway and parking occupancy counts (every 2 yrs)
15

What are the MOST effective TDM measures?
1. Low parking ratios
2. Paid parking—Daily, not monthly
3. Something-for-everyone benefit
4. Hire locally
1.3
1.1
00.10.20.30.40.50.60.70.80.9
11.11.21.31.41.5
Par
kin
g R
atio
(Sp
ace
s/1
,00
0
sf)
2009 2013
Only 67%
occupied
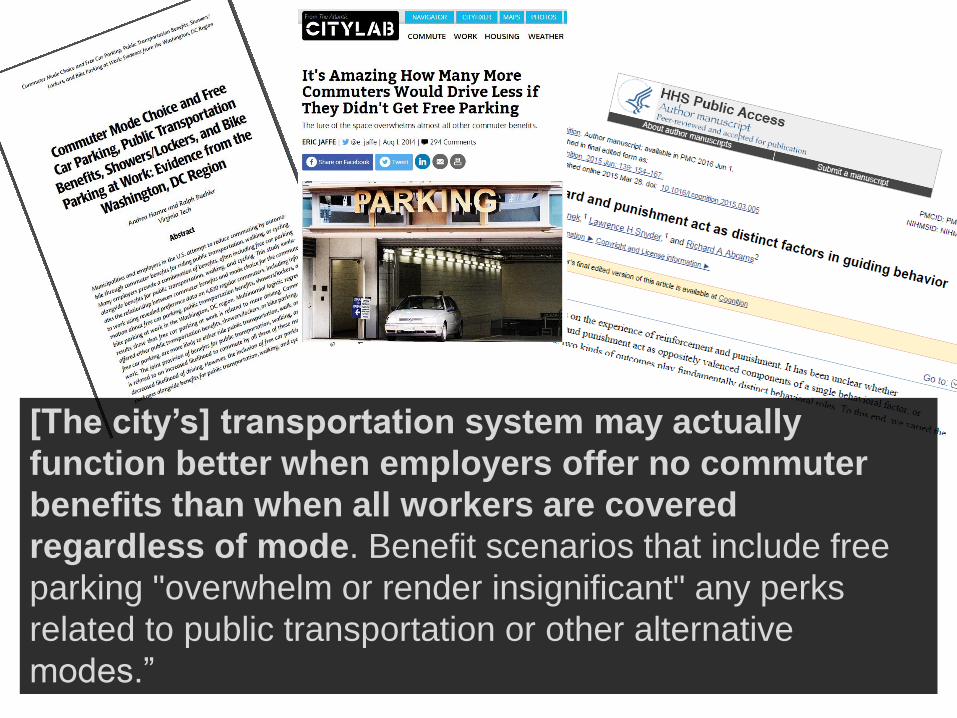
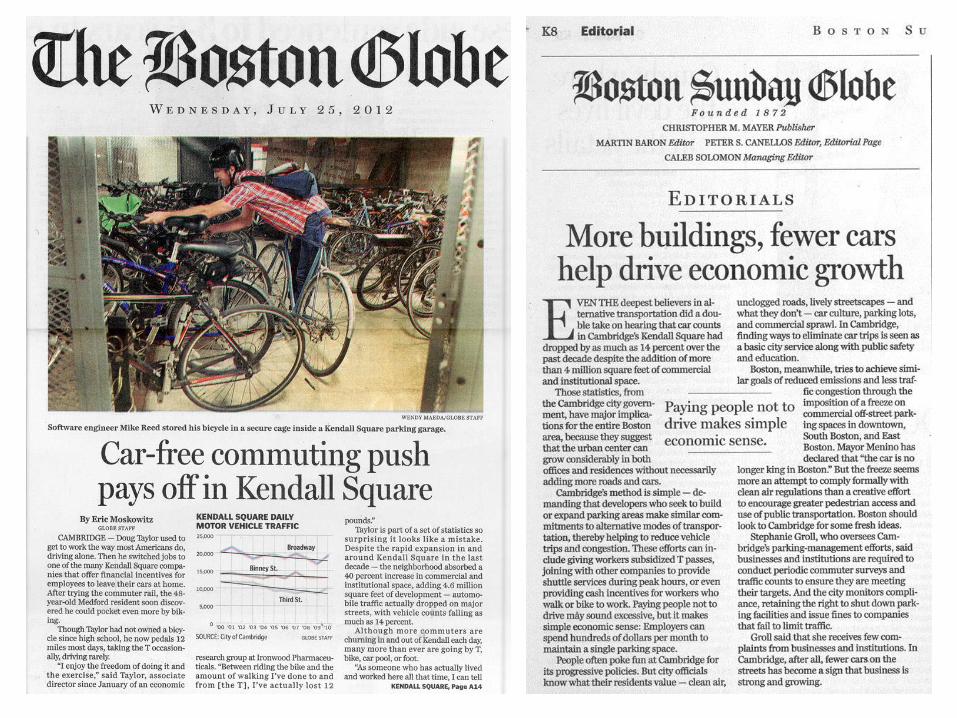
[The city’s] transportation system may actually
function better when employers offer no commuter
benefits than when all workers are covered
regardless of mode. Benefit scenarios that include free
parking "overwhelm or render insignificant" any perks
related to public transportation or other alternative
modes.”
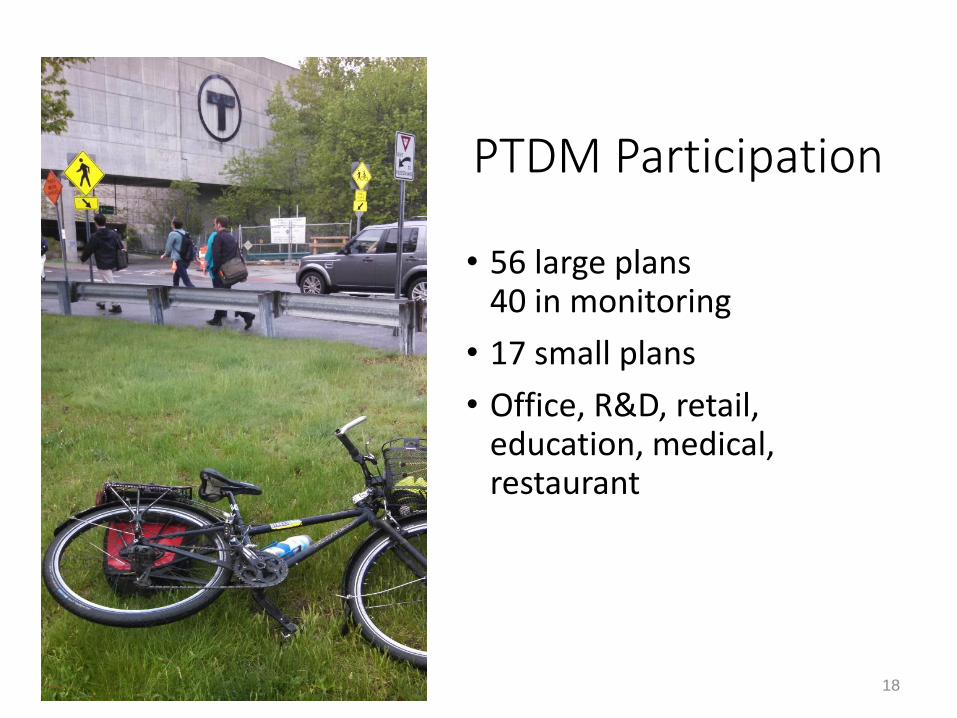
PTDM Participation
• 56 large plans40 in monitoring
• 17 small plans
• Office, R&D, retail, education, medical, restaurant
18
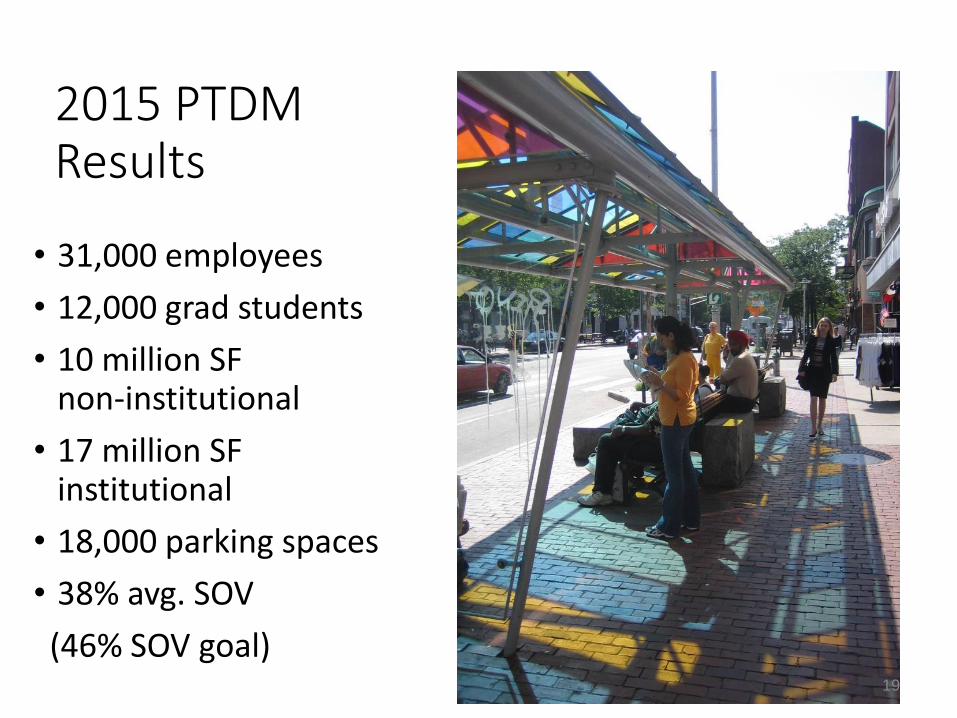
2015 PTDM Results
• 31,000 employees
• 12,000 grad students
• 10 million SF non-institutional
• 17 million SF institutional
• 18,000 parking spaces
• 38% avg. SOV
(46% SOV goal)19

Reported SOV Rate vs Average SOV Goal
38%
39%
41%
44%43%
44%44%43%43%
46%
49%47%
53%
48%
41%
30%
35%
40%
45%
50%
55%
201520142013201220112010200920082007200620052004200320022001
Overall Annual Average SOV SOV Target
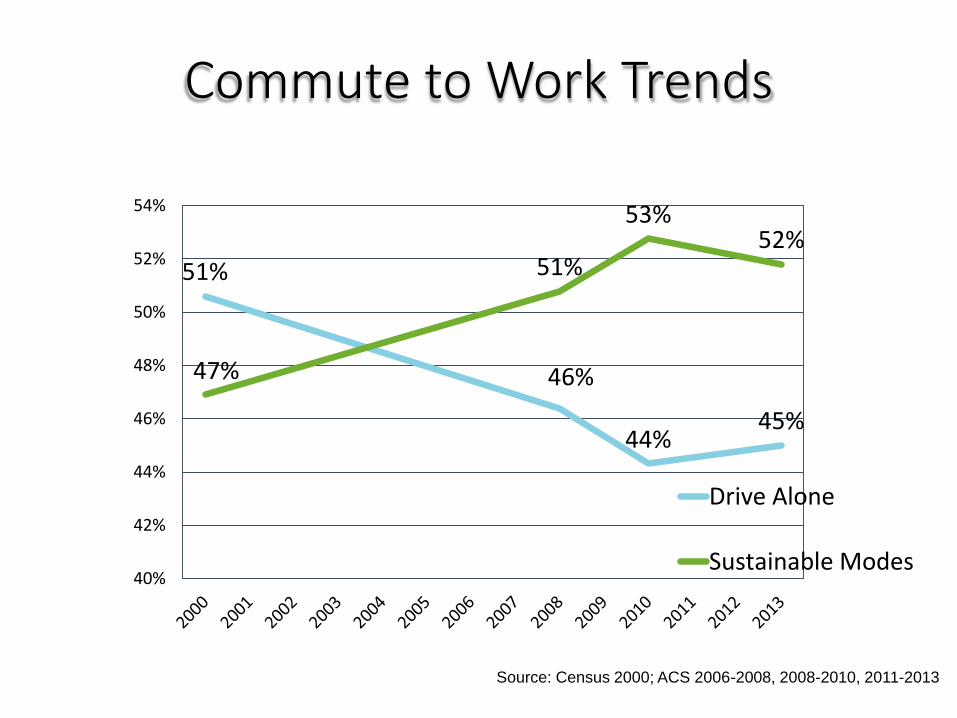
51%
46%
44%45%
47%
51%
53%52%
40%
42%
44%
46%
48%
50%
52%
54%
Drive Alone
Sustainable Modes
Commute to Work Trends
Source: Census 2000; ACS 2006-2008, 2008-2010, 2011-2013
22
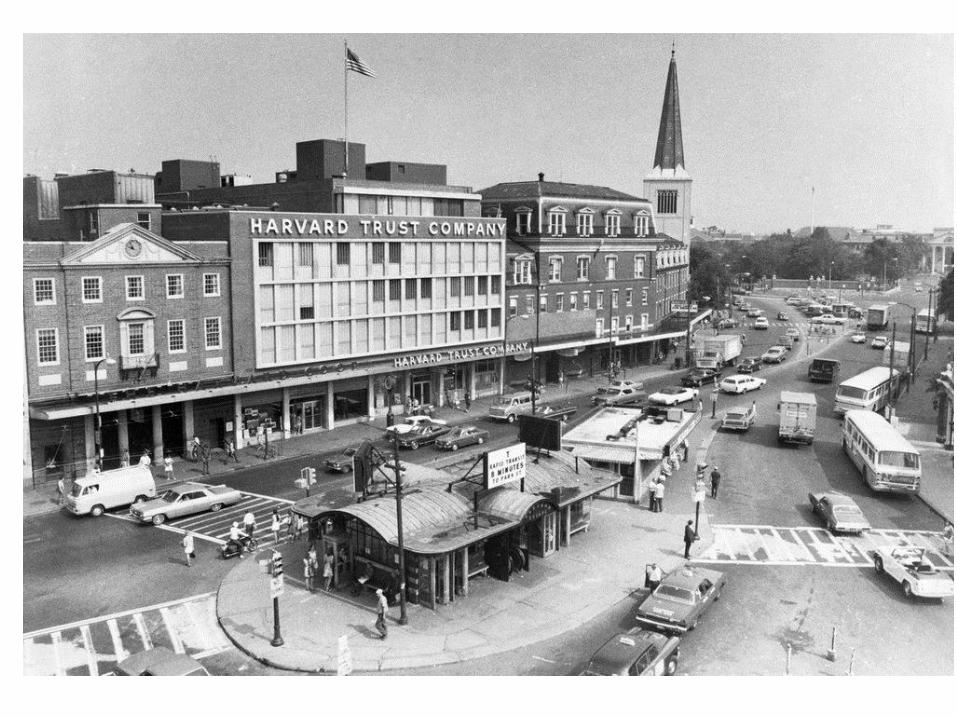
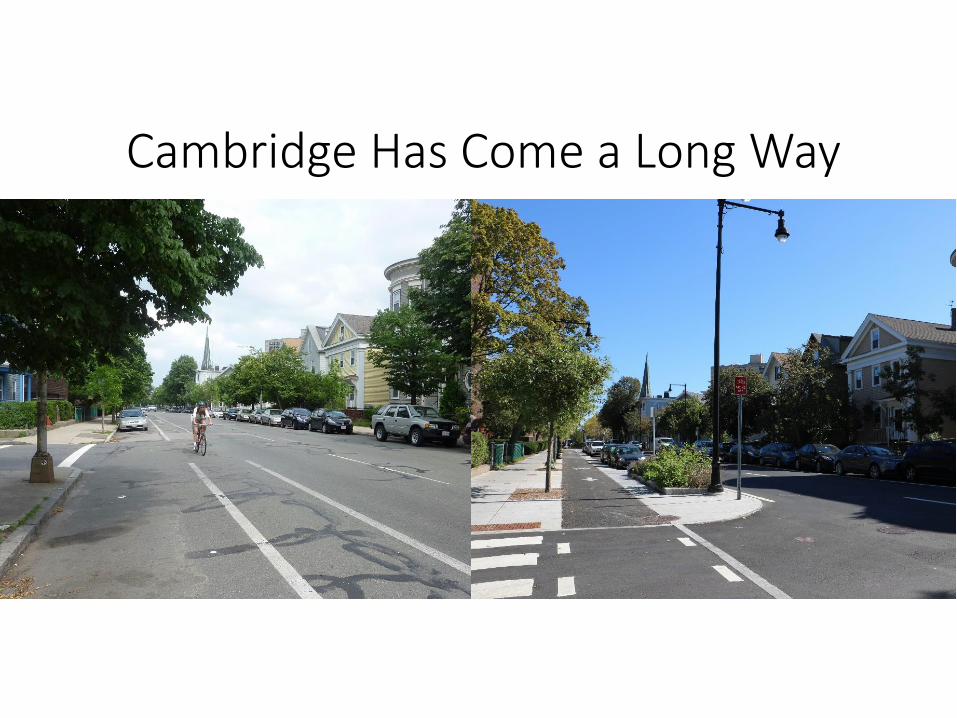
Cambridge Has Come a Long Way
Julia Prange Wallerce
Executive Director, Mass Commute
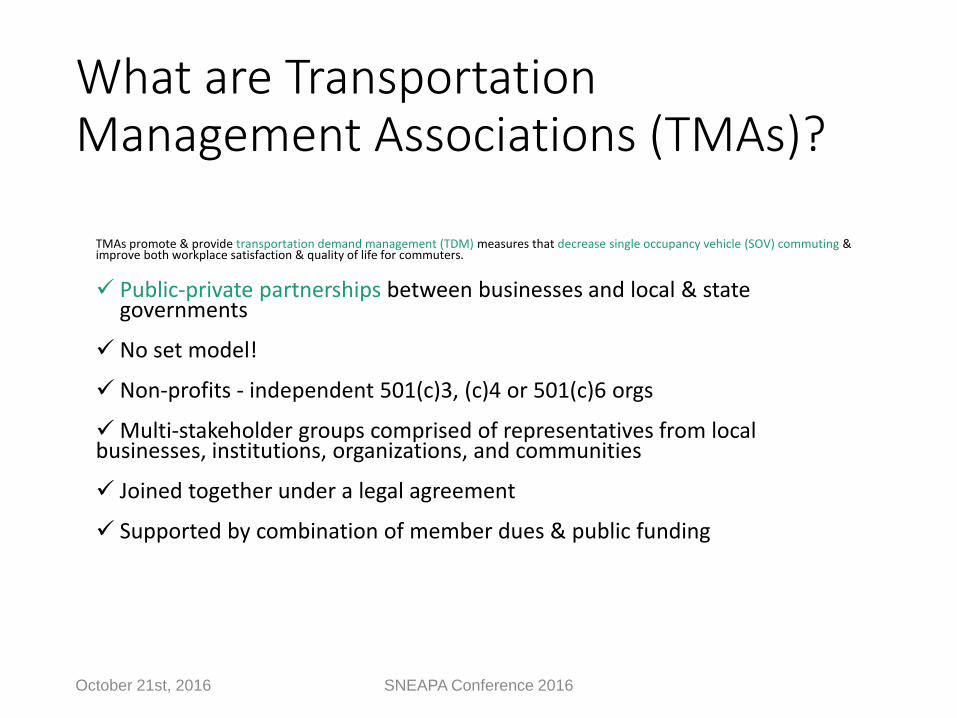
What are Transportation Management Associations (TMAs)?
TMAs promote & provide transportation demand management (TDM) measures that decrease single occupancy vehicle (SOV) commuting & improve both workplace satisfaction & quality of life for commuters.
Public-private partnerships between businesses and local & state governments
No set model!
Non-profits - independent 501(c)3, (c)4 or 501(c)6 orgs
Multi-stakeholder groups comprised of representatives from local businesses, institutions, organizations, and communities
Joined together under a legal agreement
Supported by combination of member dues & public funding
October 21st, 2016 SNEAPA Conference 2016

Why do we have TMAs?
October 21st, 2016 SNEAPA Conference 2016
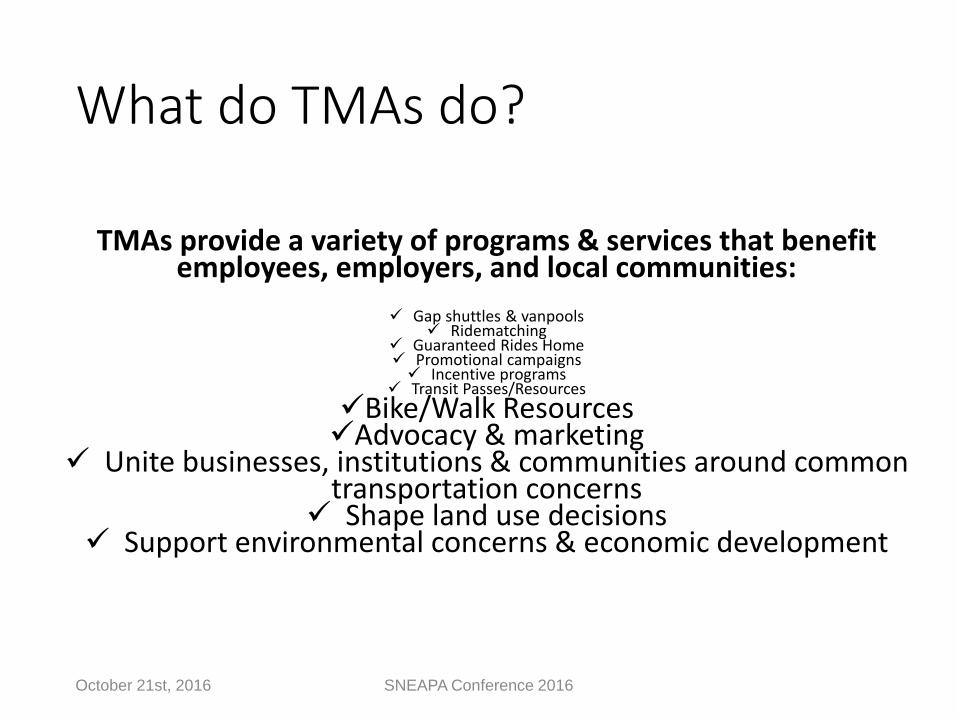
What do TMAs do?
TMAs provide a variety of programs & services that benefit employees, employers, and local communities:
Gap shuttles & vanpools Ridematching
Guaranteed Rides Home Promotional campaigns Incentive programs
Transit Passes/Resources
Bike/Walk Resources Advocacy & marketing
Unite businesses, institutions & communities around common transportation concerns
Shape land use decisions Support environmental concerns & economic development
October 21st, 2016 SNEAPA Conference 2016
October 13th, 2015 RTAC Meeting 29
October 21st, 2016 SNEAPA Conference 2016
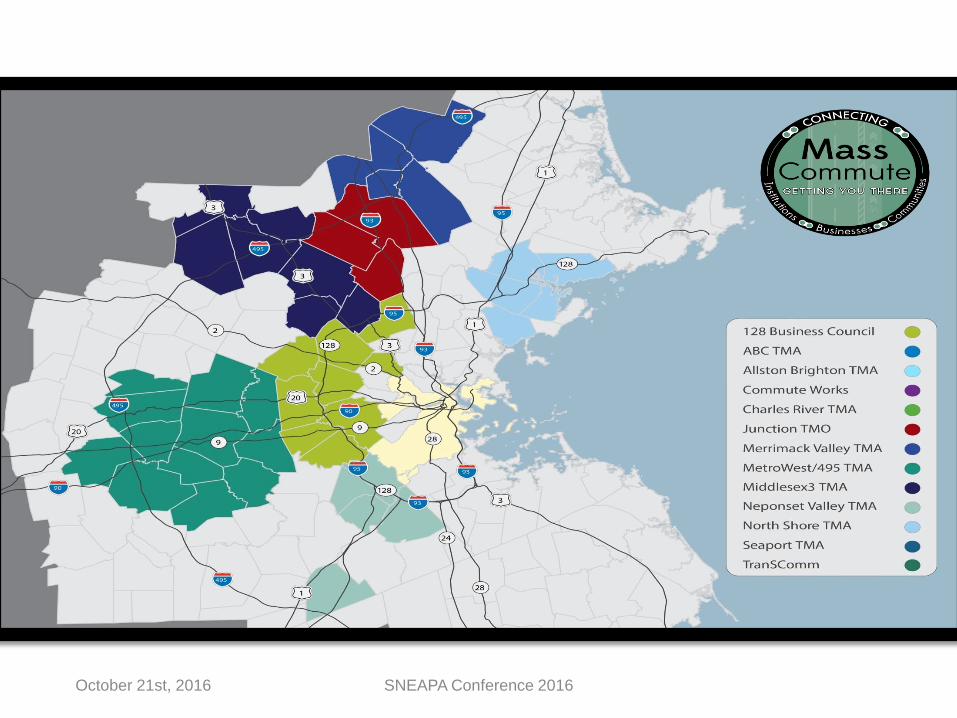
Where does MassCommute fit in?
MassCommute is a registered non-profit coalition of 14 TMAs led by a part-time Executive Director and TMA staffed committees.
The MassCommute TMAs serve over 350 member companies and institutions in 48 municipalities
MassCommute’s Mission is to “Collaborate, Advocate, and Inform”
October 21st, 2016 SNEAPA Conference 2016
TMA funding
The majority of TMA funding comes from member dues, which vary from TMA to TMA
CMAQ (Congestion Management & Air Quality) grants through MassDOT for Operational Assistance or Marketing & Public Outreach
MassDOT administers a statewide CMAQ program via FHWA
11 Massachusetts TMAs were receiving annual CMAQ dollars from MassDOT – Considered “Operational Assistance Funding”- since 2009
5 year cap on Operational Assistance Funding. As of 2016, new funding through CMAQ “Education &
Marketing” (also funds MassRIDES)
Look for opportunities for to tap into state/local grant programs –Example: CIC Grant in Massachusetts
October 21st, 2016 SNEAPA Conference 2016
October 13th, 2015 RTAC Meeting 33
MassCommute Annual Events
October 13th, 2015 RTAC Meeting 34
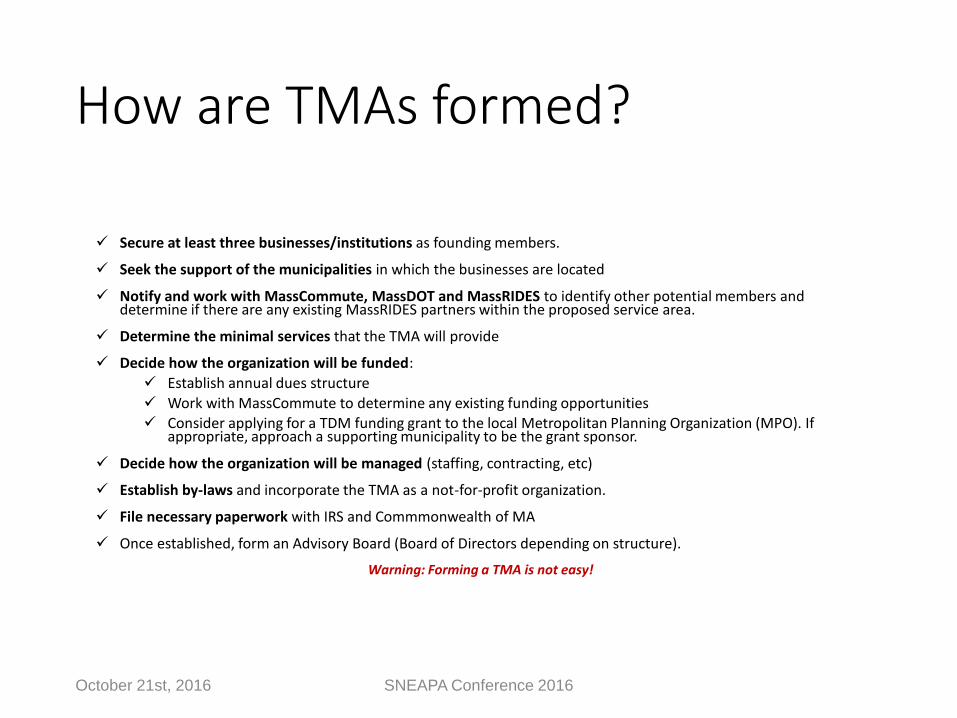
How are TMAs formed?
Secure at least three businesses/institutions as founding members.
Seek the support of the municipalities in which the businesses are located
Notify and work with MassCommute, MassDOT and MassRIDES to identify other potential members and determine if there are any existing MassRIDES partners within the proposed service area.
Determine the minimal services that the TMA will provide
Decide how the organization will be funded:
Establish annual dues structure
Work with MassCommute to determine any existing funding opportunities Consider applying for a TDM funding grant to the local Metropolitan Planning Organization (MPO). If
appropriate, approach a supporting municipality to be the grant sponsor.
Decide how the organization will be managed (staffing, contracting, etc)
Establish by-laws and incorporate the TMA as a not-for-profit organization.
File necessary paperwork with IRS and Commmonwealth of MA
Once established, form an Advisory Board (Board of Directors depending on structure).
Warning: Forming a TMA is not easy!
October 21st, 2016 SNEAPA Conference 2016

TMA Research: White Paper 2015
October 21st, 2016 SNEAPA Conference 2016
Massachusetts’ TMAs:
Are uniquely collaborative
Support state climate and transportation initiatives
Augment regional rideshare and employer programs
Three Tiers of Effective TDM Synergy!1. State & Regional TDM Programs (like MassRIDES)
2. Local TDM Programs (like TMAs)
3. Employer TDM Programs
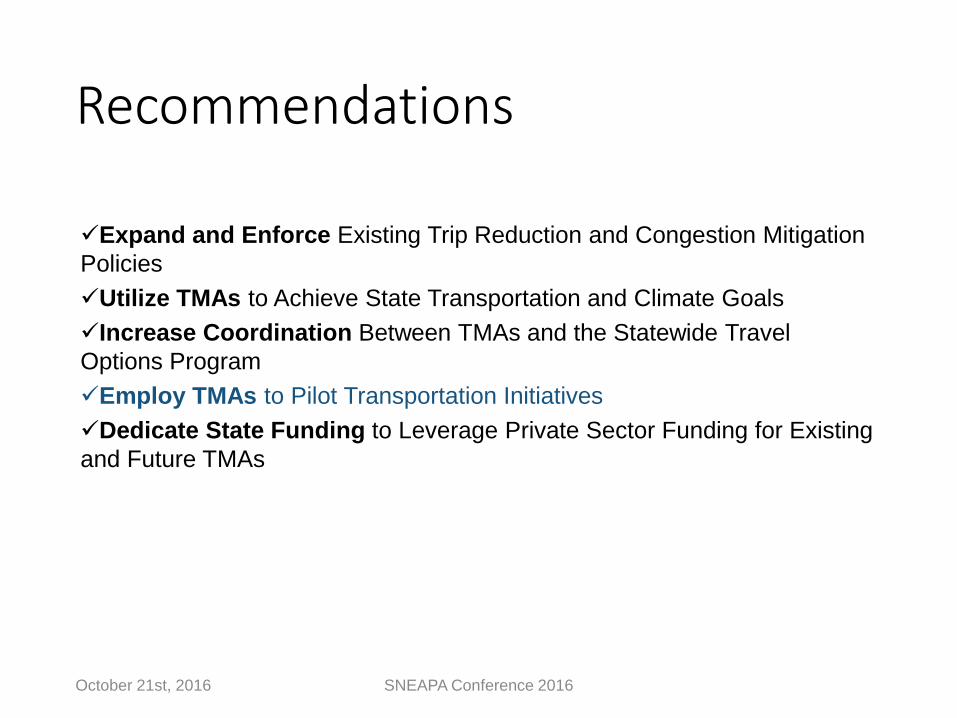
Recommendations
October 21st, 2016 SNEAPA Conference 2016
Expand and Enforce Existing Trip Reduction and Congestion Mitigation
Policies
Utilize TMAs to Achieve State Transportation and Climate Goals
Increase Coordination Between TMAs and the Statewide Travel
Options Program
Employ TMAs to Pilot Transportation Initiatives
Dedicate State Funding to Leverage Private Sector Funding for Existing
and Future TMAs
October 21st, 2016 SNEAPA Conference 2016
Contact Information:
Julia Prange Wallerce
Executive Director,
MassCommute
@Masscommute
October 21st, 2016 SNEAPA Conference 2016
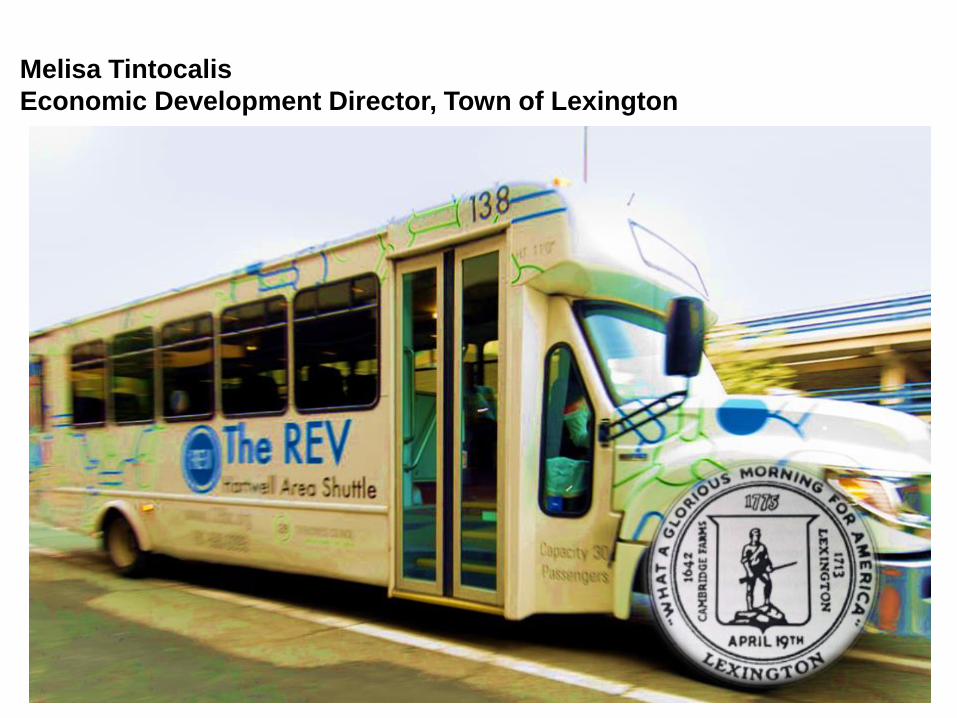
Melisa Tintocalis
Economic Development Director, Town of Lexington
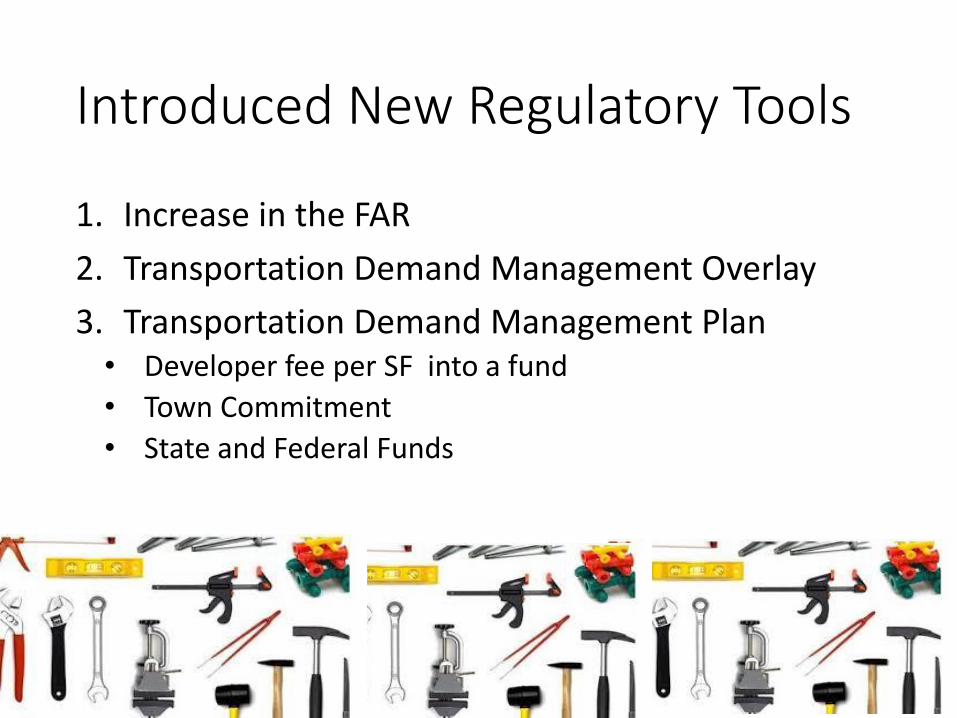
Introduced New Regulatory Tools
1. Increase in the FAR
2. Transportation Demand Management Overlay
3. Transportation Demand Management Plan• Developer fee per SF into a fund
• Town Commitment
• State and Federal Funds
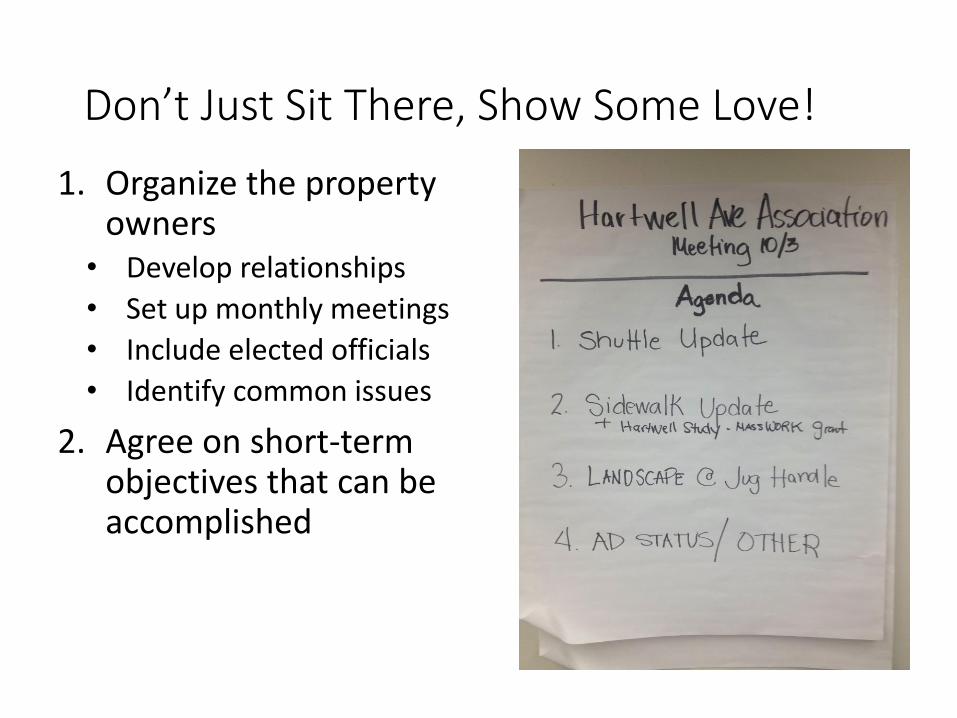
Don’t Just Sit There, Show Some Love!
1. Organize the property owners
• Develop relationships
• Set up monthly meetings
• Include elected officials
• Identify common issues
2. Agree on short-term objectives that can be accomplished
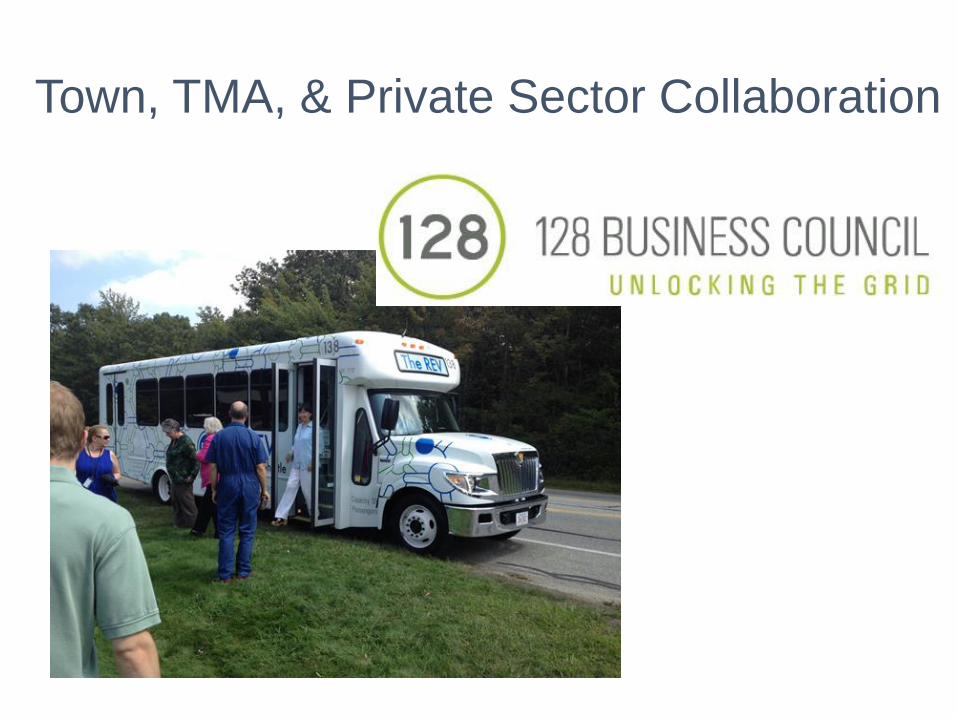
Town, TMA, & Private Sector Collaboration
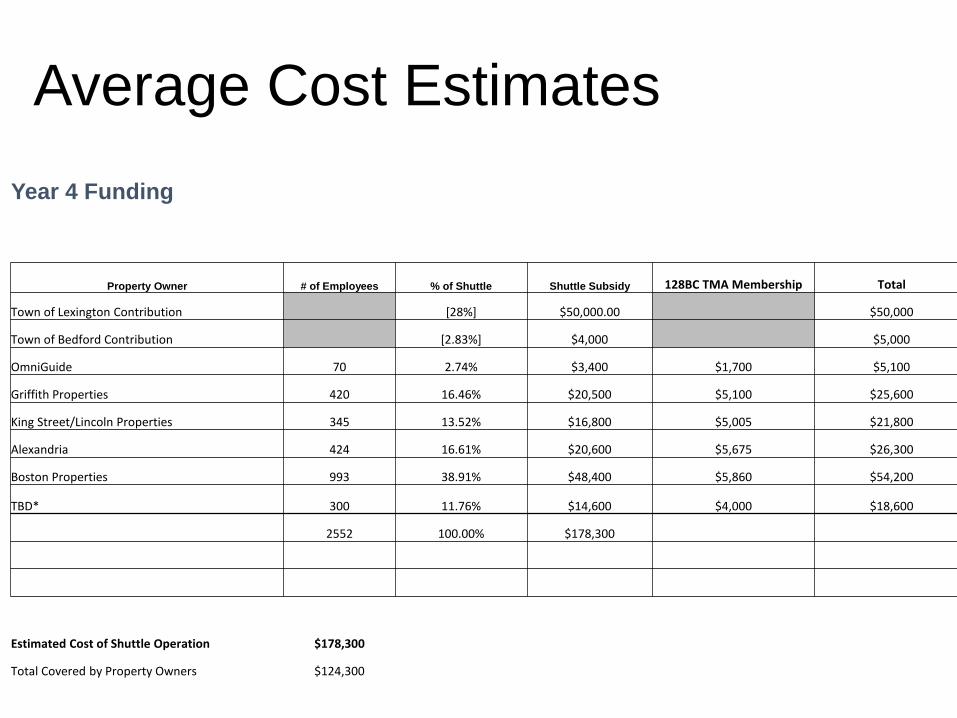
Average Cost Estimates
Year 4 Funding
Property Owner # of Employees % of Shuttle Shuttle Subsidy 128BC TMA Membership Total
Town of Lexington Contribution [28%] $50,000.00 $50,000
Town of Bedford Contribution [2.83%] $4,000 $5,000
OmniGuide 70 2.74% $3,400 $1,700 $5,100
Griffith Properties 420 16.46% $20,500 $5,100 $25,600
King Street/Lincoln Properties 345 13.52% $16,800 $5,005 $21,800
Alexandria 424 16.61% $20,600 $5,675 $26,300
Boston Properties 993 38.91% $48,400 $5,860 $54,200
TBD* 300 11.76% $14,600 $4,000 $18,600
2552 100.00% $178,300
Estimated Cost of Shuttle Operation $178,300
Total Covered by Property Owners $124,300
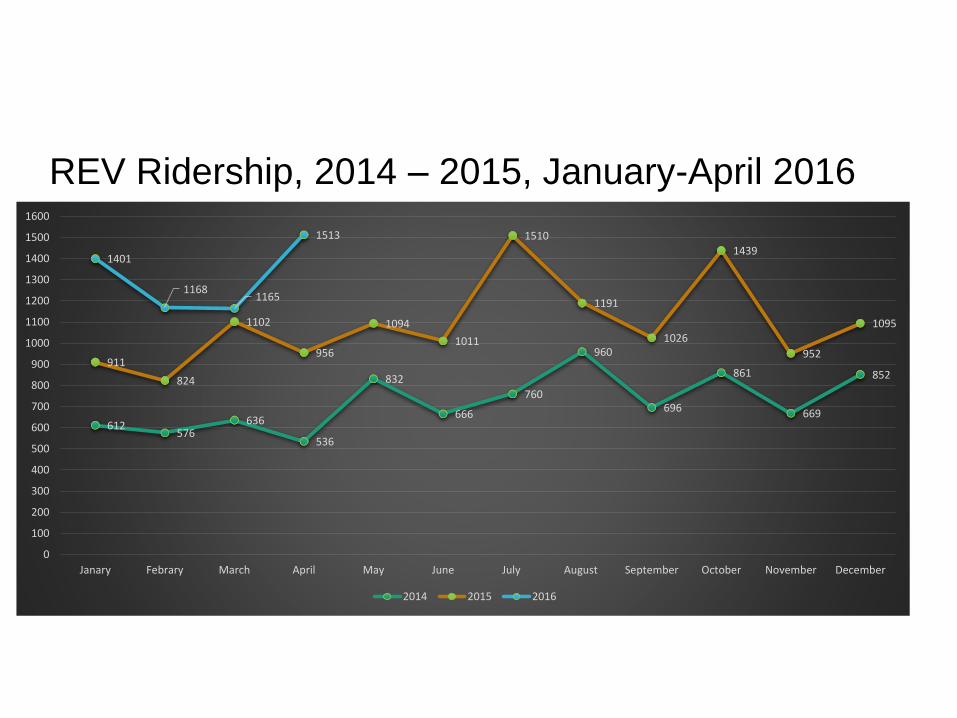
REV Ridership, 2014 – 2015, January-April 2016
612576
636
536
832
666
760
960
696
861
669
852911
824
1102
956
1094
1011
1510
1191
1026
1439
952
1095
1401
11681165
1513
0
100
200
300
400
500
600
700
800
900
1000
1100
1200
1300
1400
1500
1600
Janary Febrary March April May June July August September October November December
2014 2015 2016
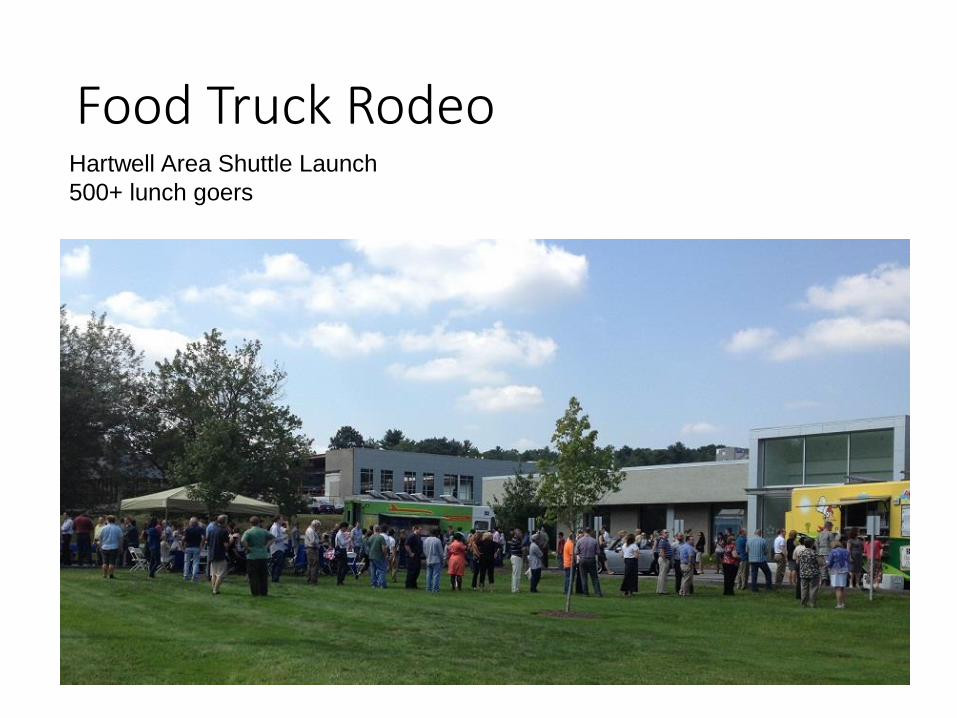
Food Truck Rodeo Hartwell Area Shuttle Launch
500+ lunch goers
Any examples of how the
REV has improved your
daily commute?
Convenience and comfort
Spending less gas money
Less stressful than driving or taking a public bus
Most Common Responses
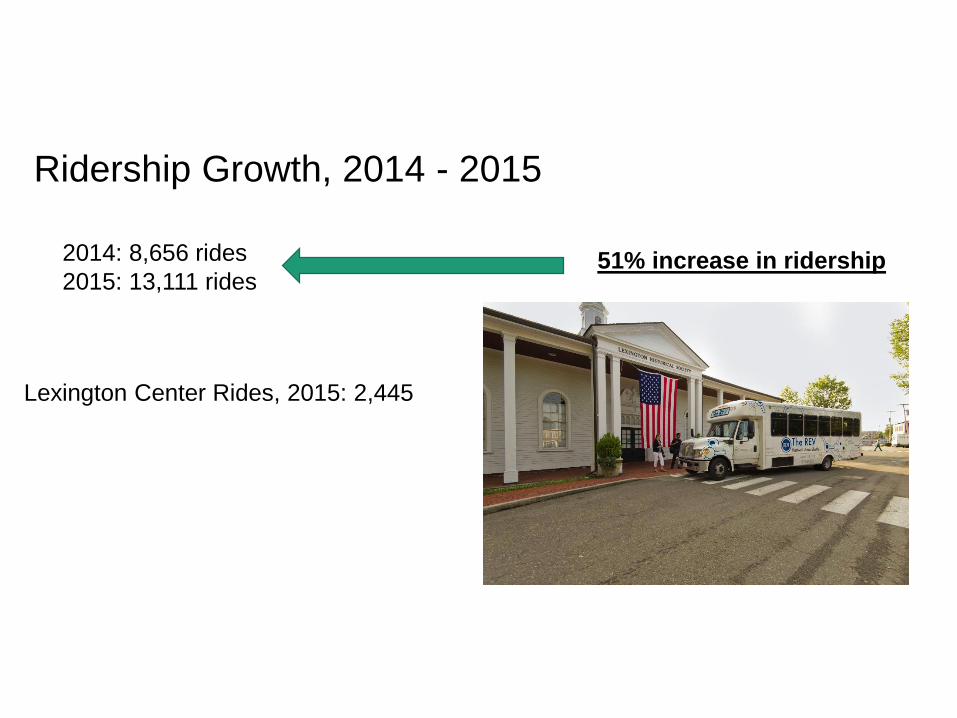
Ridership Growth, 2014 - 2015
2014: 8,656 rides
2015: 13,111 rides51% increase in ridership
Lexington Center Rides, 2015: 2,445
Value of Alternative Transportation in Marketing Real Estate