Embed Size (px)
Citation preview
170OVERTIMEIN FINLAND
Petri Böckerman
1
PALKANSAAJIEN TUTKIMUSLAITOS •• TYÖPAPEREITA
LABOUR INSTITUTE FOR ECONOMIC RESEARCH •• DISCUSSION PAPERS
Labour Institute for Economic Research. Pitkänsillanranta 3 A, FIN–00530 Helsinki, Finland.Fax: +358–9–2535 7332. E-mail: [email protected]. I am grateful to Mika Haapanen,Pekka Ilmakunnas, Reija Lilja and Ralf Ramm-Schmidt for comments. I am grateful to ReijoMarjanen for the information about the applied data. I would also like to thank two anonymousreferees for valuable comments and suggestions. The usual disclaimer applies.
Helsinki 2001
170
OVERTIME
IN FINLAND
Petri Böckerman

2
ISBN 952–5071–57–XISSN 1457–2923

3
ABSTRACT
This study is about the incidence of overtime hours in Finland. The investigation uses uni-
que individual-level data from the manufacturing industries from 1989 to 1995. The results
reveal that the hours of overtime divided by the number of total hours decline in age of an
employee. The overtime hours also decline in wage per straight-time hours and in straight-
time hours. Males and newcomers tend to work more overtime, but leavers work less overti-
me. In addition, the overtime hours are more frequent in the population of small establish-
ments in the Finnish manufacturing industries. There are also strong industry effects.
(JEL:J21).
TIIVISTELMÄ
Tutkimuksessa tarkastellaan ylitöiden määräytymistä teollisuustyöntekijöitä kuvaavalla yk-
silöaineistolla vuosina 1989–1995. Tulosten mukaan ylitöiden osuus kokonaistyöajasta
alenee työntekijän iän noustessa. Ylityöt myös vähenevät säännöllisen työajan tuntipalkan
ja säännöllisen työajan noustessa. Miehet ja tulokkaat tekevät enemmän ylitöitä, mutta
lähtijät vähemmän. Lisäksi ylityöt ovat yleisempiä pienissä ja miesvaltaisissa toimipaikois-
sa. Toimialojen välillä on myös suuria eroja ylitöiden osuudessa.
1. INTRODUCTION
Europe’s high unemployment trap has inspired a number of ambitious plans to solve the
dilemma. One of them is known as ”work-sharing”. The underlying idea of work-sharing
is to redistribute the available work to more people and thereby give a stake to unemplo-
yed persons. The conduct of work-sharing is closely related to the evolution and the inci-
dence of overtime, because a rise in the paid or unpaid overtime hours can even reverse
the supposed positive employment effects of work-sharing1.

4
However, the underlying empirical incidence of overtime hours has not been focused upon
by labour market research in Europe2. This may reflect, at least partly, the well-known fact
that among professional economists work-sharing is not a popular measure to cure Euro-
pean unemployment (see, for example, Layard, Nickell and Jackman, 1991). The aim of
this study is to characterize the incidence of overtime hours in Finland by using unique
individual-level data from manufacturing industries from 1989 to 1995. Thus, this empi-
rical investigation fills a gap in the existing Finnish literature on working time issues.
This study appears in six parts. The first part of the study provides selected theoretical
considerations on the issue of overtime hours and clarifies the key conceptual questions.
In addition, the most important elements of overtime regulation in by the Finnish institu-
tions are discussed. The second part provides a brief snapshot of earlier empirical investi-
gations into the issues of overtime hours in Europe. Thus, the motivation of the selected
variables in the estimated overtime equation is based on previous literature on the inciden-
ce of overtime hours at the individual level. In addition, detailed elaboration is focused on
the available Finnish studies on the hours of work in the manufacturing industries. The
third part provides a description of the applied individual-level data. The forth part inclu-
des a characterization of paid overtime hours in a nutshell by applying kernel-density es-
timations and the simple scatterplots of the individual-level data. The fifth part provides an
analysis of the incidence of overtime hours by applying regression techniques. In particu-
lar, the study includes a consideration of establishment characteristics to the incidence of
overtime hours at the individual level, which has been largely a neglected issue in the ear-
lier literature on overtime hours. The last part concludes with some reflections.
2. BACKGROUND
The appearance of overtime hours can be explained as follows (see, e.g. Bauer and Zim-
mermann, 1999). Firms use overtime hours (in other words, the intensive margin of la-
bour utilization in contrast to the extensive margin of labour utilization), because of the
presence of quasi-fixed cost of employment, i.e. hiring and training costs and various em-
ployee benefits that are related to employment but not to performed working hours. In
practice, firms can utilize overtime hours by different ways. There are at least two major
5
types of overtime (see, for example, Bauer and Zimmermann 1999, 2–3). The so-called
transitory overtime hours are compensated with free time for involved employees. In this
case, overtime hours are often used in order to increase the flexibility of firm’s operations.
On the other hand, there are definite overtime hours which are not compensated with free
time. These definite overtime hours can further be divided into paid and unpaid overtime.
Thus, it is important to stress that the applied data in the following parts of the study
contains only paid overtime hours. This is due to the fact there is no information at all on
the number of unpaid overtime hours in the manufacturing industries. In fact, the litera-
ture on overtime hours is focused mainly on these paid definite overtime hours (see Bauer
and Zimmermann 1999, 2–3). However, the focus on the incidence of overtime hours of
manual workers means that the exclusion of unpaid overtime hours is not a severe prob-
lem from the point of view of this study. This is due to the fact that, among manual wor-
kers, there are hardly any incentives to perform unpaid overtime hours. Bell, Hart, Hubler
and Schwerdt (2000, 3–6) provide various reasons to perform unpaid overtime hours.
The reasons (for example, conjecture that unpaid overtime work represents a form of gift
exchange à la Akerlof) point out that the incidence of unpaid overtime should be much
more common among non-manual workers. However, the information compiled by Sta-
tistics Finland (1995) indicates that there was an increase in the unpaid overtime hours
during the great depression of the early 1990s.
One of the most important features of overtime hours is that firms usually pay a substan-
tial overtime premium. In fact, Hart and Ma (2000) provide a recent theoretical investiga-
tion into the presence of overtime premium. The model indicates that the wage premium
serves to achieve contract efficiency within the framework of asymmetric information. The
result is based on the notion that with both extensive and intensive margins of labour utili-
zation, the wage rate alone cannot set to achieve both optimal separation and optimal
worker utilisation. Thus, the presence of overtime premium provides an additional in-
strument that can solve the problem.
The issue of overtime hours is tightly linked to the discussion of work-sharing. In fact, the
underlying productivity of performed overtime hours is an important element that affects
to the demand for overtime hours by firms and to the effects of work-sharing. Ilmakunnas
(1994) provides detailed empirical evidence about the productivity of overtime hours for
6
the Finnish manufacturing industries based on national accounts. The results indicate that
the productivity of overtime hours is about the same as that of standard hours.
The institutional setup of the Finnish labour markets is highly relevant for the regulation
of working time and for the overtime compensation schemes. Labour market policy is the
result of a close and long-term interplay between organised agents and the government in
Finland. Thus, Finland provides an example, par excellence, of a corporatist political and
economic system (Vartiainen 1998, 9–11). Thus, the regulation of working time in Fin-
land is based on Working Hours Act that is prepared on a tripartite basis. This means that
representatives of employers, employees and government are involved to the reforms of
Working Hours Act. The Working Hours Act is a general law, supplemented in many
sectors by more specific acts3. Under the Act, there are upper limits of 8 regular working
hours per day and 40 per week. According the Working Hours Act overtime comprises
the time in excess of regular hours, on either the daily or weekly basis. Employees must
also pay extra for overtime in Finland. The premium for daily overtime is 50% for the first
two hours and 100% for each following hour. The premium for weekly overtime is 50%,
irrespective of the number of hours.
3. THE EARLIER STUDIES
There are some empirical investigations into the issues of overtime hours in the context of
European labour markets. This snapshot of the existing literature is focused on the studies
that look at the incidence of overtime hours at the individual-level of the economy.
The unregulated UK labour markets provide an interesting opportunity to investigate the
incidence of overtime hours. Bell, Hart, Hubler and Schwerdt (2000) observe that the
quantitative significance of both paid and unpaid overtime is greater in the UK with res-
pect to Germany4. They present overtime hours equations by applying Tobit estimating
procedure. The results indicate that paid overtime is more common among manual wor-
kers. In addition, the study includes company size as a potential factor in explaining over-
time hours. Based on a priori theoretical reasoning, it would be expected that larger firms
would more typically formalise their work arrangements. This is done in an effort to redu-

7
ce various transaction costs associated with operations. Thus, larger firms should use
more paid overtime hours, but less unpaid overtime hours due to more formal work arra-
gements. However, the empirical results by Bell et al (2000) are mixed in this respect and
do not provide solid evidence for the hypothesis that the share of paid overtime hours is
higher among large firms.
In addition, Bell and Hart (1999) provide a detailed analysis of the incidence of overtime
hours in the UK by applying individual-level data on male non-managerial workers. The
results can be summarized as follows. The straight-time wage exerts a negative influence
on overtime incidence, which is consistent with an income effect. Straight-time weekly
hours are negatively related to the incidence of overtime hours. The number of overtime
hours also rises with age up to the late 40s before declining. Thus, there is an inverted U-
profile. Central and local government workers work significantly fewer weekly overtime
hours compared to the private sector workers, which is in line with common sense, becau-
se various production fluctuations are more frequent in the private sector of the
economy5. In addition, the results indicate that collective bargaining agreements succeed
in reducing straight-time while rising overtime hours with respect to uncovered workers6.
This feature enchances the covered/uncovered wage differential in the UK7.
Working time issues have also been debated in Germany. Thus, there are studies of over-
time hours with German data. Bauer and Zimmermann (1999) provide a detailed elabo-
ration of overtime hours in Germany by applying individual-level data. The estimated
overtime equations are similar Tobit specifications as in the investigation by Bell and Hart
(1999). The results reveal that individuals working in small firms have a higher probability
of working overtime hours. Levels of skill also play an important role in the incidence of
overtime hours. Thus, skilled blue-collar workers have a higher probability to work over-
time than unskilled blue-collar workers8. In addition, Bauer and Zimmermann (1999)
note that the share of overtime has declined sharply in Germany during the past few deca-
des9.
A well-known empirical regularity says that overtime hours rapidly adjust to the scale of
the economic activity10. Hart (2000) provides an elaboration of overtime hours during the
great depression of the 1930s. The results indicate that the British engineering industry
adjusted to the severe falls in demand during the 1930s by cutting the hours of work. The

8
period of the following investigation includes the great depression of the 1990s in Finland.
In fact, during the slump there was indeed a sharp decline in overtime hours also in Fin-
land. In addition, Kalwij and Gregory (2000) investigate the issue of overtime hours in
Great Britain over the period from 1975 to 1999. The main result of the study is that the
decline in unionisation has not altered the use of overtime in Great Britain. As in a num-
ber of other countries the incidence of overtime shows a distinct procyclical movement
during the period of investigation. The easiest way to include this feature of overtime
hours is simply to introduce year dummies to the estimated overtime equations11.
The earlier studies on the issue of overtime hours are mainly limited to the one single so-
called stylized feature of the overtime hours in Finland. Holm and Kiander (1993), and
Ilmakunnas (1995) conclude that reductions in standard working time have had a slight
employment-increasing effect, but no effect on overtime hours12. This means that there
has been no rise in the share of paid overtime hours within the Finnish manufacturing in-
dustries during the past few decades13 (Fig. 1). In other words, in the long run the time
path of actual working hours closely follows that of standard hours working, at least in the
case of the Finnish manufacturing industries. This is due to the fact that a permanent
increase in overtime is a far too expensive way to adjust labour input from the point of
view of firms.
FIG. 1. A share of overtime hours with respect to the total working time in theFinnish manufacturing industries from 1950 to 1999 (%)
Source: The Confederation of Finnish Industry and Employers.
1
2
3
4
5
1950 1955 1960 1965 1970 1975 1980 1985 1990 1995

9
However, there is one earlier study that applies detailed individual-level data in the elabo-
ration of overtime hours in the Finnish economy. Asplund (1995) has investigated the un-
derlying incidence of overtime hours in Finland from 1980 to 1993 by applying the same
individual-level data covering the manufacturing industries as in this study14. The main
focus in the investigation by Asplund (1995) is on the underlying sectoral composition of
overtime hours and the individual characteristics in the incidence of overtime hours. The
results based on the individual-level data indicate that there are some key factors that ex-
plain most of the incidence of overtime hours within the Finnish manufacturing industries.
These factors are by nature rather similar to the variables applied in the empirical studies
by other countries’ data. These variables include age (i.e. young employees tend to work
more overtime hours than older ones) and gender (i.e. men tend to work more overtime
than women). The results also reveal that newcomers tend to work more overtime than
the rest of the personnel within manufacturing firms. In addition, there was a sharp decli-
ne in overtime hours during the great depression of the 1990s in Finland15. However, the
study by Asplund (1995) does not include the elaboration of establishments’ characteris-
tics (such as the size of the establishment) as a potential element of the underlying inci-
dence of overtime hours in the manufacturing industries in Finland.
4. THE DATA
The empirical investigation is based on the yearly observations from 1989 to 1995. The
data covers the manufacturing industries in the Finnish economy. This narrow focus of
the study, which is dictated by the availability of the data, on the manufacturing industries
is, of course, a major drawback due to the well-known empirical regularity that in the mo-
dern industrial economies the contribution of manufacturing industries to GDP has decli-
ned considerably during the past few decades. Thus, the modern economies have strongly
tended to draw away from the manufacturing industries toward service sectors. This styli-
zed fact of structural change in the composition of economic activity applies to Finland.
However, despite this apparent erosion in the relative strength of the manufacturing in-
dustries, manufacturing still represents a more important role in the Finnish economy
compared to most of the European countries. In addition, non-manufacturing industries

10
represent other forms of less stable labour relations (such as part-time work and various
temporary employment contracts), which can be considered to be substitutes for the im-
plementation of overtime hours16. In addition, a casual evidence seems to indicate that
unpaid overtime is more common within non-manufacturing industries.
The applied individual-level data is from the records of the Confederation of Finnish In-
dustry and Employers17 (Teollisuus ja Työnantajat, TT). The data is based on the fact that
each year TT conducts a survey among its member employers and gathers detailed infor-
mation on paid wages, salaries and the hours of work of employees18. The sample contains
all the workers who are employed in a firm that is affiliated to TT. Year 1990 was chosen
as the base year and within each firm the workers were put in order according to their
mean pay and every 15th was then selected for the sample. Longitudinal data was then
created from 1990 onwards and backwards by applying unique personal codes that iden-
tify the workers of the manufacturing industries in Finland. The applied version of the
data covers the situation during the last quarter of each year from 1989 to 1995. Thus,
the data does not contain, for example, students that work only during the summer vaca-
tions. The data covers manual workers of the Finnish manufacturing industries and it
contains 56 135 observations.
The individual-level data is originally from 1980 to 1995. However, in this analysis of the
incidence of overtime hours it is important to take into account the characteristics of es-
tablishments, which are available only from 1989 onwards. Thus, the applied version of
the data in the following elaboration is from 1989 to 199519. In addition, it is important to
stress that the data is not complete linked employer-employee data, because it contains
only the size of establishment and the share of women in the establishment.
The applied variables of the analysis are summarized in Table 1. In addition, Appendix 1
of this study provides the selected descriptive statistics for the most important variables in
the estimated overtime equations. In the following analysis of the incidence of overtime
hours an effort is made to explain a share of overtime hours in the total of hours of work
at the individual level (OVERTIME). The share of overtime is by definition a variable boun-
ded by [0, 1]. However, the upper bound of the variable is reached if and only if an individual
does not perform standard hours of work at all, which is in practice out of question due to
the overtime regulations in the Finnish manufacturing industries. Most of the selected varia-
11
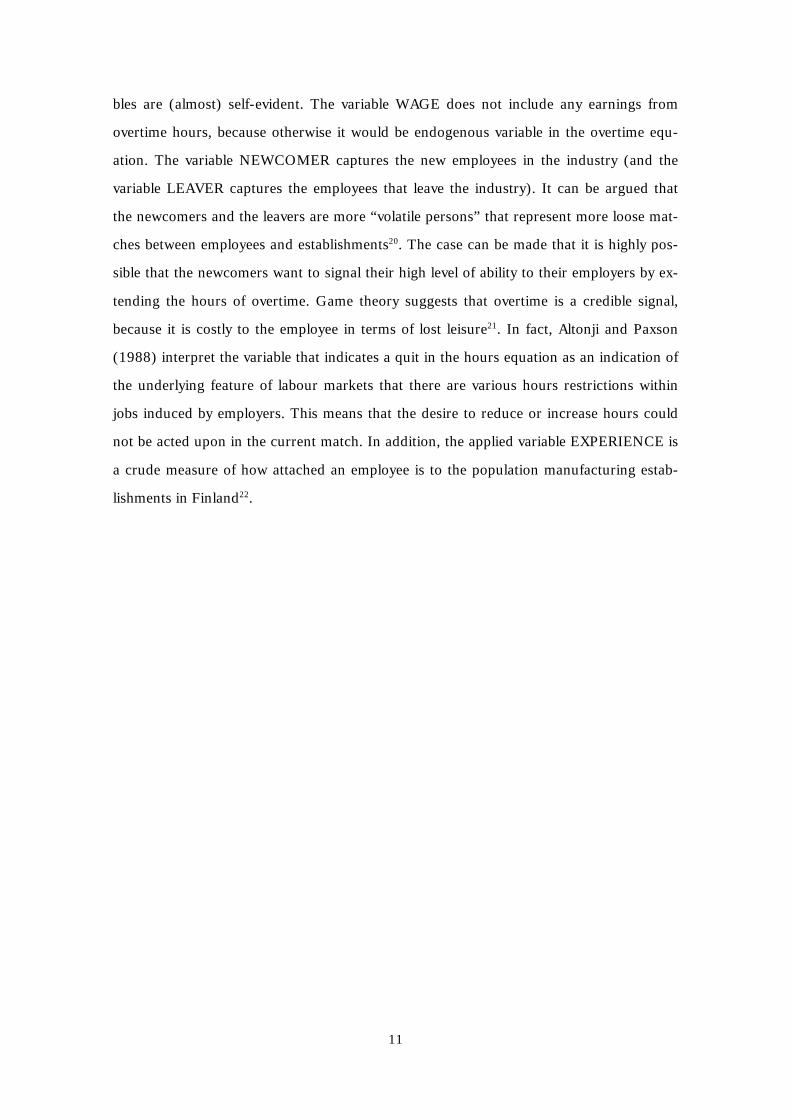
bles are (almost) self-evident. The variable WAGE does not include any earnings from
overtime hours, because otherwise it would be endogenous variable in the overtime equ-
ation. The variable NEWCOMER captures the new employees in the industry (and the
variable LEAVER captures the employees that leave the industry). It can be argued that
the newcomers and the leavers are more “volatile persons” that represent more loose mat-
ches between employees and establishments20. The case can be made that it is highly pos-
sible that the newcomers want to signal their high level of ability to their employers by ex-
tending the hours of overtime. Game theory suggests that overtime is a credible signal,
because it is costly to the employee in terms of lost leisure21. In fact, Altonji and Paxson
(1988) interpret the variable that indicates a quit in the hours equation as an indication of
the underlying feature of labour markets that there are various hours restrictions within
jobs induced by employers. This means that the desire to reduce or increase hours could
not be acted upon in the current match. In addition, the applied variable EXPERIENCE is
a crude measure of how attached an employee is to the population manufacturing estab-
lishments in Finland22.

12
TABLE 1. The description of the selected variables
Variable Definition/measurement
Individual-level characteristics
OVERTIME Hours of overtime divided by the number of total hours
AGE Age of an employeeAGE2 AGE squaredWAGE A log of the wage of an employee divided by the straight-time
hoursWAGE2 WAGE squaredTIME Straight-time hoursTIME2 TIME squaredGENDER 1=female, 0=maleNEWCOMER Employee that was not in the industry one year previously,
1=newcomer, 0 otherwise.LEAVER Employee that leaves the industry between this year and the
next, leaver=1, 0 otherwiseEXPERIENCE Total number of years in which the worker appears in the ap-
plied data from 1980 to 1995. The variable provides a crudemeasure of the professionalilty of an individual in the manu-facturing industries.
METROPOLITAN The collective agreement stipulates slighly higher pay in themetropolitan areas where the costs of living (such as housing)are presumably higher, a person is living in the metropolitanarea=1, 0 otherwise.
Establishments’ characteristics
SIZE Size of establishment measured by the number of employeesWOMEN Share of women in the establishment
Dummy variables
INDUSTRIES23 5–1, attached to employees based on the union code of anemployee
YEARS 7–1, from 1989 to 1995OCCUPATIONS24 428–1, based on the classification of occupations by Statistics
FinlandREGIONS 281–1, based on the counties in Finland
The applied data does not contain industry classification as such. However, by using the
code that delivers the information about the attachment of the employee to the collective
agreements it is possible to create good proxies for the industry dummies. Thus, the study
includes a large number of dummy variables. These variables are attached to the indust-
ries, occupations25, regions (i.e. counties) and years (because of the fluctuations of over-
time hours due to business cycles during the 1990s).

13
5. THE CHARACTERIZATION OF OVERTIME HOURS AT
THE INDIVIDUAL LEVEL
This section of the study provides a brief characterization of overtime hours at the indivi-
dual level by applying kernels and simple scatterplots of the data. The main stylized fea-
tures can be summarized as follows26. The first fact concerns the notion that for most of
the employees overtime hours represent only a small part of the total hours of work. This
observation is evident in the figure showing the underlying distribution of overtime hours
(Fig. 2). This stylized feature means that the hours of overtime are also at the individual
level an extremely flexible part of total working time. In fact, according to the data, over-
time compensation covers from 1989 to 1995 in average about 1.8 % of total salary of
manual workers in the Finnish manufacturing industries27. Thus, it seems reasonable to
relate the incidence of overtime hours to various measurable characteristics held by indivi-
duals and establishments in the Finnish manufacturing industries. In addition, this feature
of overtime hours means that the various reforms of taxation that affect the supply of
hours of work should have a large impact on overtime hours28.
In addition, the scatterplots of the share of the overtime hours at the individual level tend
to give support to the notion that the share of overtime is negatively related to the AGE of
an employee29 (Fig. 3). In fact, there seems to exist an inverted U-shape relation, which is
in line with the earlier studies on the incidence of overtime hours in the European labour
markets. Steward and Swaffield (1997) provide an explanation for this pattern of overti-
me hours with respect to age, which is based on the notion that over a third of manual
workers in the UK would prefer to work fewer hours at the prevailing wage than they do.
Thus, the inverted U-profile of overtime hours can be rationalized as a result of deviations
between desired and actual hours, i.e. employees are forced to work more hours than they
want because of institutional forces, job insecurity etc. In addition, Steward and Swaffield
(1997) argue that the fact that the age profile of desired hours is not matched by that in
actual hours means that employers set constraints of hours above employee preferences.
Ilmakunnas (1997, 27–98) provides detailed empirical evidence for the view that there
exists a great number of disparities in desired and actual hours of work also in the Finnish
economy. Graversen and Smith (1998) document this inverted U-profile in terms of age
for Danish men, but are unable to find it for Danish women.

14
The variable OVERTIME seems to be positively related to the variable WAGE (Fig. 4). In
fact, the figure suggests that the overtime hours tend to rise at the individual-level as the
wage per straight-time hours rises, which would be consistent with the notion of the sub-
stitution effect. The income effect of a straight-time wage would be consistent with a de-
cline in overtime hours as straight-time wage increases. In addition, the variable
OVERTIME seems to be negatively related to the SIZE of the establishment (Fig. 5). Thus,
there some preliminary evidence that the employees in the population of small establishments
tend to work more overtime than the rest of the workers in the manufacturing industries in
Finland30.
The distribution of straigth-time hours reveals additional features. Thus, Fig. 6 depicts the
kernel density estimate of straight-time hours from 1989 to 199531. In fact, the applied
variable TIME does not match with the definition of so-called standard hours stipulated
by the collective agreements in the Finnish manufacturing industries. This is due to the
fact that the applied data covers also manual workers that have worked only a part of the
last quarter from 1989 to 1995. In addition, the data contains, for example, workers that
have had sickness leaves during the period of the sample.

15
FIG. 2. The distribution of OVERTIME from 1989 to 1995
FIG. 3. A scatterplot of OVERTIME and AGE from 1989 to 1995
overt
ime
Frequency0 10000 20000 30000 40000
0
.924979
overt
ime
age15 65
0
.925

16
FIG. 4. A scatterplot of OVERTIME and WAGE from 1989 to 1995
FIG. 5. A scatterplot of OVERTIME and SIZE from 1989 to 1995
overt
ime
wage7.65181 11.8808
0
.925
overt
ime
size1 200
0
.925

17
FIG. 6. Kernel density estimate for TIME from 1989 to 1995
6. THE RESULTS
Owing to the fact that the share of overtime is by definition a censored variable bounded
by [0, 1], it is convenient to estimate a Tobit specification following the recent empirical
studies by Bauer and Zimmermann (1999), Bell and Hart (1999) as follows32:
(1) OVERTIMEi = ββ ’X i + εi if ββ’X i + εi > 0
0 if ββ’X i + εi ≤ 0,
where the dependent variable OVERTIMEi refers to the share of overtime hours with res-
pect to the individual i, X i is a vector of explanatory variables, ββ is a vector of the estimated
coefficients, and εi is a normal distributed error term with mean 0 and variance σ2.
Density
Kernel Density Estimatetime
-8.96183 836.962
4.8e-07
.005207

18
TABLE 2. The results from Tobit regressions (dependent variable: OVERTIME)
Model 1 Model 2
Coefficients t-statistics Coefficients t-statistics
AGE .0011793 2.333 .0012056 2.409AGE2 –.0208697 –3.347 –.0202752 –3.283WAGE .6935911 6.960 .3855061 3.893WAGE2 –2.882085 –4.896 –.9860306 –1.684TIME .0002701 11.651 .0002718 11.786TIME2 –.0038625 –5.124 –.0038829 –5.193GENDER –.0070666 –6.975 –.0062141 –6.072NEWCOMER .0170021 12.735 .016204 12.340LEAVER –.0036845 –3.005 –.0035256 –2.913EXPERIENCE –.0011369 –10.910 –.001217 –11.413METROPOLITAN .0000136 0.017 –.0033075 –0.692
SIZE –.0002506 –23.858 –.0002623 –15.388WOMEN –.0001352 –2.205 –.0001119 –1.746
Constant 2.608299 3.012 –.31172 –0.362
Dummy variables
INDUSTRIES Yes Yes
YEARS Yes Yes
OCCUPATIONS No No
REGIONS No Yes
Log-likelihood 14518.8 15906.1
Observations 55 896 55 896
Censored observations 29 776 29 776
The estimation results are summarized in Table 2. The results indicate that that the hours
of overtime divided by the number of total hours decline in age of an employee33. In addi-
tion, the overtime hours tend to decline at the individual-level as the wage per straight-
time hours rises. The estimation results indicate that a rise in the straigth-time hours gives
a mild decline in the overtime hours. This negative effect from straight-hours to overtime
hours is an indication of the income effect. The observation that a decline in straight-
hours would lead (other things being equal) to an increase in overtime hours is not fa-

19
vourable to the conduct of work-sharing in the Finnish manufacturing industries. Howe-
ver, the conclusion regarding the work-sharing is not definite due to the fact that the va-
riation in the variable TIME comes, in addition to legislated working time reductions,
from part-time work, absence due to the sickness leaves, holidays etc., and from the inclu-
sion of the employees that are newcomer or leavers34. An important point is also related to
the implementation of work-sharing. Ilmakunnas (1994, 550) stresses the view that when
working time changes are imposed in the form of more holidays rather than in the form of
a shorter daily working time, there should be expected less increase in overtime hours and
more scope for positive employment effects. These results are in line with the observations
by Bell and Hart (1999) that both wage per straigth-time hours and straight-time weekly
hours are negatively related to the incidence of overtime hours in the UK. In contrast,
Graversen and Smith (1998) observe the positive association for the Danish workers bet-
ween overtime hours and wage per straight-time hours.
Males work more overtime. The reason can be a division of labour within families. Thus,
families like to extend the hours of work by males, because males typically have higher
wages. Females often have also looser connections to the labour market in Finland too, at
least during childbearing years, when they, to a larger extent than males, work part-time
or are out of the labour force (for example, due to the maternity leaves35). Newcomers
tend to work more overtime, but leavers work less overtime36. Thus, a decline in overtime
hours could serve as a signal that the employee is about to separate from the current
match. Thus, the large underlying magnitude of gross worker flows in the economies can
perhaps partly be explained by the fact that there are hours restrictions37. The estimation
results also indicate that more experienced employees tend to work fewer overtime hours
in the Finnish manufacturing. An explanation for this feature of the incidence of overtime
hours could be that the senior workers tend to work more unpaid overtime, because they
occupy higher positions within the establishments. In addition, the variable
METROPOLITAN is not a statistically significant factor for explaining the incidence of
overtime hours.
The establishment characteristics included are also important for the underlying incidence
of overtime hours in Finland. Thus, overtime hours are more frequent in the population of
small establishments in the Finnish manufacturing industries38. This particular observation
is consistent with one of the well-known stylized features in the industrial organisation

20
literature (see, for example, Caves, 1998), which states that the variance of growth rates in
employment, sales or some other key measures of economic activity tend to decline with
the size of a firm. The relationship of overtime hours and the size of an establishment was
also investigated separately for the year 1991, which constituted the bottom of the great
Finnish depression of the early 1990s. The results reveal that the observation that overti-
me hours decline in the size of an establishment did hold also during the great depression,
but the effect of establishments’ size on the overtime hours was slightly milder than during
the period from 1989 to 199539. Thus, the stylized feature that overtime hours are more
common among small establishments does not break during the times of extreme
economic slowdown. The establishments that have less than twenty employees were drop-
ped off the data40, but the result according to which overtime hours are more common
among small establishments remained. Thus, the result is not driven by very small plants
either. The overtime equation was also estimated separately for the five industries of this
study. The estimations reveal that overtime hours are more common among small estab-
lishments within metal industries, manufacture of wood and wood and cork products, and
manufacture of paper and paper products, but there no relationship between overtime
hours and the size of an establishment at all within textile industries. In addition, within
apparel industries the hours of overtime are actually more common among bigger estab-
lishments. The results also indicate that the share of women in the establishment has a ne-
gative effect on the incidence of overtime hours in the Finnish manufacturing industries.
All industry and year dummies included are also statistically significant ones. Thus, there
are strong industry effects41. In particular, the incidence of overtime hours is more fre-
quent in the manufacture of paper and paper products. This notion is in line with com-
mon sense, because the manufacture of paper and paper products is characterized by
strong fluctuations in demand and the high capital intensivity of production means that
labour costs are only a minor part of the total costs for the establishments in this industry.
For the sake of the robustness of the above results the overtime equation was estimated
from 1980 to 1995 without establishments’ characteristics42. All other results remained the
same except the feature that the estimation covering the period from 1980 to 1995 does
not give statistically significant results for the variable LEAVER. Thus, the applied data
covering the period from 1980 to 1995 is not in line with the view that leavers tend to
work fewer overtime hours in the Finnish manufacturing industries. In addition, the over-
21
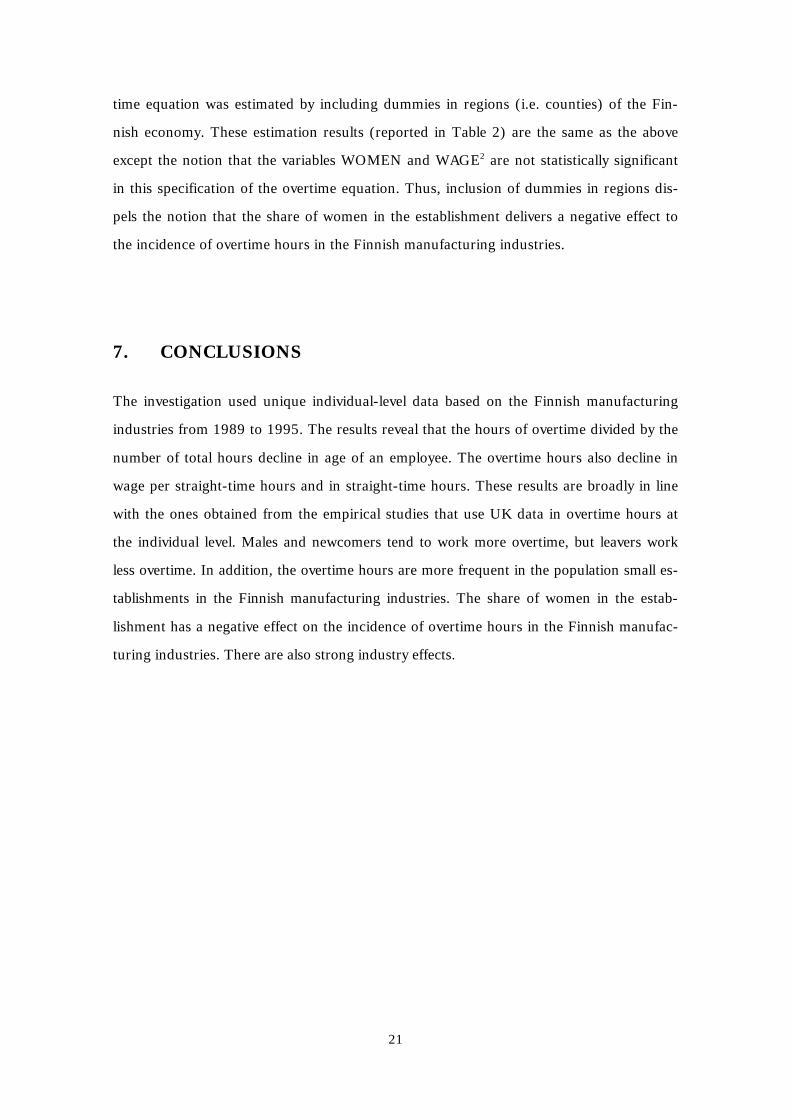
time equation was estimated by including dummies in regions (i.e. counties) of the Fin-
nish economy. These estimation results (reported in Table 2) are the same as the above
except the notion that the variables WOMEN and WAGE2 are not statistically significant
in this specification of the overtime equation. Thus, inclusion of dummies in regions dis-
pels the notion that the share of women in the establishment delivers a negative effect to
the incidence of overtime hours in the Finnish manufacturing industries.
7. CONCLUSIONS
The investigation used unique individual-level data based on the Finnish manufacturing
industries from 1989 to 1995. The results reveal that the hours of overtime divided by the
number of total hours decline in age of an employee. The overtime hours also decline in
wage per straight-time hours and in straight-time hours. These results are broadly in line
with the ones obtained from the empirical studies that use UK data in overtime hours at
the individual level. Males and newcomers tend to work more overtime, but leavers work
less overtime. In addition, the overtime hours are more frequent in the population small es-
tablishments in the Finnish manufacturing industries. The share of women in the estab-
lishment has a negative effect on the incidence of overtime hours in the Finnish manufac-
turing industries. There are also strong industry effects.

22
REFERENCES
Altonji, J.G. and C.H. Paxson (1988). ”Labor Supply Preferences, Hours Constraints, and
Hours-Wage Trade-offs.” Journal of Labour Economics 6, 254–276.
Altonji, J.G. and C.H. Paxson (1992). ”Labor Supply, Hours Constraints, and Job Mobility.”
The Journal of Human Resources 27, 256–278.
Asplund, R. (1994). ”Teollisuuden työntekijöiden palkat ja inhimillinen pääoma.” (in Finnish).
Discussion Papers 484. The Research Institute of the Finnish Economy.
Asplund, R. (1995). ”Teollisuustyöntekijöiden ylityöt 1980-1993.” (in Finnish). Kansantalou-
dellinen aikakauskirja 91, 127–135.
Bauer, T. and K.F. Zimmermann (1999). ”Overtime Work and Overtime Compensation in
Germany.” IZA Discussion Papers 48. The Institute for the Study of Labor.
Bell, D.N.F. and R.A. Hart (1999). ”Overtime Working in an Unregulated Labour Market.”
IZA Discussion Papers 44. The Institute for the Study of Labor.
Bell, D.N.F., R.A. Hart, O. Hubler and W. Schwerdt (2000). ”Paid and Unpaid Overtime
Working in Germany and the UK.” IZA Discussion Papers 133. The Institute for the Study of
Labor.
Bell, L.A. and R.B. Freeman (2001). ”The Incentive for Working Hard: Explaining Hours
Worked Differences in the U.S. Germany.” Labour Economics 8, 181–202.
Böckerman, P. and J. Kiander (2001). ”Has Work-sharing Worked in Finland?.” Applied
Economics Letters 8, Forthcoming.
Caves, R.E. (1998). “Industrial Organization and New Findings on the Turnover and Mobil-
ity of Firms.” Journal of Economic Literature 36, 1947–1982.
Contensou, F. and R. Vranceanu (2000). Working Time. Theory and Policy Implications.
Cheltenham: Edward Elgar.
Davis, S.J. and J. Haltiwanger (1999). “Gross job flows.” In Handbook of Labour Eco-
nomics, Vol. 3. Eds. O. Ashenfelter and D. Card. Amsterdam: North-Holland.
Eriksson, T. and S. Fellman (1995). ”Determinants of Firms’ Operating Times – Some
Evidence from Firm-level Data.” Discussion Papers 542. The Research Institute of the Finnish
Economy.

23
Graversen, E.K. and N. Smith (1998). ”Labour Supply, Overtime Work and Taxation in
Denmark.” Working Papers 98–06. Centre for Labour Market and Social Research.
Golden, L. and S. Glosser (1994). ”Average Working Hours as a Leading Economic Variable in
U.S. Manufacturing.” Working Papers #11–94–3–CES. The Pennsylvania State University,
Department of Economics.
Green, F. (2001). ”It’s Been a Hard Day’s Night: The Role of Concentration and Intensification
of Work in Late Twentieth-century Britain.” British Journal of Industrial Relations 39, 53–80.
Green, F. and S. McIntosh (2001). ”The Intensification of Work in Europe.” Labour
Economics 8, 291–308.
Hamermesh, D.S. (1993). Labor Demand. Princeton: Princeton University Press.
Hamermesh, D.S. (1994). ”Policy Transferability and Hysteresis: Daily and Weekly Hours in
the BRD and the US.” Working Papers 4773. National Bureau of Economic Research.
Hart, R.A. (2000). ”Hours and Wages in the Depression: British Engineering, 1926–1938.” IZA
Discussion Papers 132. The Institute for the Study of Labor.
Hart, R.A. and Y. Ma (2000). ”Why Do Firms Pay an Overtime Premium?.” IZA Discussion
Papers 163. The Institute for the Study of the Labor.
Harvey, A.S., K. Fisher, J. Gershuny and A. Akbari (2000). ” Examining Working Time
Arrangements Using Time Use Survey Data.” Working Papers 22/2000. Institute for Social and
Economic Research.
Hohti, S. (2000). ”Toimipaikan koko ja työpaikat Suomen teollisuudessa.” (in Finnish). Studies,
216. Ministry of Labour.
Holm, P. and J. Kiander (1993). ”The Effects of Work-sharing on Employment and Overtime
in Finnish Manufacturing 1960–1987.” Applied Economics 25, 801–810.
Hunt, J. (1997). ”Has work-sharing worked in Germany?”. The Quarterly Journal of
Economics CXII, 117–148.
Ilmakunnas, P. (1994). ”Returns to Workers and hours in Finnish Manufacturing”. Empirical
Economics 19, 533–553.
Ilmakunnas, P. (1995). ”Working Time and Labour Demand in Finnish Manufacturing: Short-
run and Long-run Effects.” Applied Economics 27, 995–1002.
24
Ilmakunnas, S. (1997). ”Female Labour Supply and Work Incentives”. Studies 68. Labour
Institute for Economic Research.
Kalwij, A.S. and M. Gregory (2000). ”Overtime in Great Britain Over the Period 1975–1999: A
Panel Data Analysis”. Working Papers 27/2000. University of Oxford, Department of
Economics.
Kauhanen, M. (2000). ”Määräaikaiset työsuhteet ja sosiaaliturvajärjestelmän kestävyys.” (in
Finnish). Selvityksiä, 2000:9. Sosiaali- ja terveysministeriö.
Kettunen, J. and R. Marjanen (1992). ”Suomen Työnantajain Keskusliiton palkkatilastot:
Syntyhistoria, sisältö ja käyttötarkoitus.” (in Finnish). Discussion Papers 425. The Research
Institute of the Finnish Economy.
Kettunen, J. and J. Vartiainen (1993). ”Suomen teollisuuden työntekijöiden palkkarakenne.” (in
Finnish). Discussion Papers 431. The Research Institute of the Finnish Economy.
Kiander, J. and P. Vartia (1996). “The Great Depression of the 1990s in Finland.” Finnish
Economic Papers 1, 72–88.
Layard, R., S. Nickell and R. Jackman (1991). Unemployment. Macroeconomic Performance
and the Labour Market. Oxford: Oxford University Press.
Lazear, E.P. (1998). ”Hiring Risky Workers”. In Internal Labour Markets, Incentives and
Employment, Eds. I. Ohashi and T. Tachibanaki. London: Macmillan Press.
Santamäki-Vuori, T. and S. Parviainen (1996). The Labour Market in Finland. Labour
Institute for Economic Research, Studies, 64.
Statistics Finland (1987). ”Classification of Occupations”. Helsinki.
Statistics Finland (1995). ”Työvoiman liikkuvuus ja työelämän joustot.” (in Finnish). Labour
Market Statistics 1995:12. Helsinki.
Steward, M.B. and J.K. Swaffield (1997). ”Constraints on the Desired Hours of Work of
British Men.” The Economic Journal 107, 520–535.
Vartiainen, J. (1993). ”Metalliteollisuuden työntekijöiden palkanmuodostus työehtosopimuksen
valossa.” (in Finnish). Studies 44. Labour Institute for Economic Research.
Vartiainen, J. (1998). The Labour Market in Finland: Institutions and Outcomes. Publica-
tions Series, 1998/2. Prime Ministers Office.

25
Vartiainen, J. (1999). ”Job Assignment and the Gender Wage Differential: Theory and Evidence
on Finnish Metalworkers.” Discussion Papers 155. Labour Institute for Economic Research.
Vartiainen, J. (2000). ”Palkkarakenne ja työurat paneeliaineiston valossa.” (in Finnish). Studies
78. Labour Institute for Economic Research.

26
APPENDIX 1. Selected descriptive statistics (from 1989 to 1995)
MEAN STD MIN MAX
OVERTIME .028 .051 0 1
AGE 39.5 10.1 15 65
WAGE 8.56 .266 7.65 11.8
TIME 362.5 101.2 1 827
EXPERIENCE 10.0 4.95 1 16
SIZE 32.3 37.6 1 200
WOMEN 3.34 7.06 0 100

27
1 Hamermesh (1993) provides a summary of the empirical studies.2 Contensou and Vranceanu (2000) provide a detailed discussion of working time issues.3 Santamäki-Vuori and Parviainen (1996, 67–69) provide these stylized facts of the regulation ofworking time in Finland.4 Overtime hours are indeed common across industrialized countries. Harvey, Fisher, Gershunyand Akbari (2000) observe that half of the men in the Netherlands and Norway do some work out-side regular business hours, and two-thirds of men in Canada and Sweden worked at least partlyoutside these hours. Green and McIntosh (2001) provide empirical evidence on the intensificationof labour effort in Europe.5 In fact, this point is tautology in the case of Finland, because the output of the public sector de-fined as a sum hours. The other reasons for the low share of overtime hours within public sectormay include tight labour contracts and tight budget ceilings, which do not enable paid overtimehours. However, it must be stressed that overtime hours could be used even in the total absence offluctuations in production due to the fixed costs of hiring and training new employees. In addition,fluctuations may increase the utilization of overtime hours without increasing the total workingtime in the case that overtime hours are compensated with time off instead increased earnings. Thelatter case corresponds to the so-called transitory overtime hours that are used to increase theflexibility of firm’s operations.6 The consideration of collective agreements on the incidence of overtime hours in the Finnishmanufacturing industries is not possible due to the fact that the binding collective agreements coverthe whole of the manufacturing industries in Finland.7 Green (2001) reports that the dispersion of working hours has increased in the UK. Thus, work-ing hours have been concentrated into fewer households.8 In the investigation of overtime hours within Finnish manufacturing industries it is not possible toinclude education as a potential factor that explain the incidence of overtime hours. This is simplydue to the fact that the data does not contain an education code at all. However, almost all workersin manufacturing industries in Finland belong to the group in the often applied four-category clas-sification that has had only basic education or possesed some vocational certificates. Thus, it can beargued that education is perhaps not so important in the incidence of overtime hours within theFinnish manufacturing industries.9 Bell and Freeman (2001) argue that workers choose hours of work in order to gain promotionsand advance in the distribution of earnings. Thus, the more unequally distributed U.S. earningsgenerate more overtime hours than the German earnings distribution.10 Overtime hours are sometimes used as a leading indicator of economic activity. Golden andGlosser (1994) observe that the average working week length in the U.S. manufacturing indus-tries has become less associated with the business cycle over the past few decades. Thus, overtimehours nowadays are less liable leading indicator of economic activity.11 Thus, the following analysis of overtime hours within the Finnish manufacturing industries doesnot incorporate macroeconomic indicators, because the focus of the study is on the incidence ofovertime hours at the individual level.12 A study by Böckerman and Kiander (2001) suggests that a reduction in average hours seems to deli-ver an increase in employment on condition that output does not deteriorate as a result of shorter wor-king time in the Finnish economy. However, the maintenance of output level in the case of shorteraverage working hours is a challenging exercise. In addition, the conduct of work-sharing as a policyscheme is limited by the celebrated Lucas critique.

28
13 Figure 1 implies that the average for the variable OVERTIME from 1989 to 1995 is 3.3 %. Incontrast, the applied version of the individual-level data implies that the average for the variableOVERTIME is 2.8 % for the same period (Appendix 1). This discrepancy is due to the fact that theapplied individual-level data covers only the last quarter of each year from 1989 to 1995.14 An article by Asplund (1995) does not include the tabulation of the estimation results concerningthe incidence of overtime hours at the individual level, but the results are said to to be based onvarious specifications of Tobit and Probit regressions.15 Kiander and Vartia (1996) provide a summary of the great slump of the 1990s.16 Kauhanen (2000, 14-16) documents this sectoral pattern of temporary employment contracts forthe Finnish economy during the 1990s.17 Approximately 5 600 companies are members of the Confederation. These companies employnearly 470 000 persons. In addition, the member companies account for more than 75% of thenation’s industrial value added and export income.18 Kettunen and Marjanen (1992), Kettunen and Vartiainen (1993), Vartiainen (1993) and Asp-lund (1994) contain a detailed description of the various aspects of the applied data.19 This implies that 94 239 observations are deleted by imposing this restriction.20 In fact, Lazear (1998) argues that firms like to hire risky workers in order to cash option values.Risky workers have some additional value from the point of view of firms because a better-than-expected worker can be kept and a worse-than-expected can be forced out of the match via layoff.This feature of optimal hiring policy is due to the fact that incomplete information between em-ployer and employee means that the underlying quality of a new match will reveal itself onlythrough the experimentation. In particular, firms in growing industries should prefer young, highvariance workers and be characterized by high worker turnover rates.21 In addition, Altonji and Paxson (1988) observe, using the Panel Study of Income Dynamics, thathours changes are indeed more variable across jobs than within jobs. Altonji and Paxson (1992)provide additional empirical evidence on this issue. In particular, Altonji and Paxson (1992) findthat in a sample of married women changes in many of the labor supply preference variables pro-duce much larger effects on hours when the job changes.22 Vartiainen (1999; 2000) applies the same variable. The variable EXPERIENCE is calculated cov-ering the whole period from 1980 to 1995. The applied variable is an imperfect and also downwardbiased measure of genuine labour market experience, because it does not capture at all employees’experience outside the manufacturing industries in Finland.23 The industries of this study are as follows: (i) metal industries, (ii) textile industries, (iii) apparelindustries, (iv) manufacture of wood and wood and cork products, and (v) manufacture of paperand paper products.24 Statistics Finland (1987) provides a detailed description of the classification of occupations.25 The occupation dummies are not included in the following estimations due to their poor per-formance in the overtime equations.26 These figures and Appendix 1 contain the outliers that were deleted before estimation of Tobitregressions.27 The most interesting stylized patterns from a regression specification that aims to explain over-time compensation divided by overtime hours (OVERCOMP) at the individual-level from 1989 to1995 with the same explanatory variable as in Table 1 are that the fact that OVERCOMP is higherfor the more experienced workers and the notion that OVERCOMP is higher in the smaller estab-lishments in the Finnish manufacturing industries. Bauer and Zimmermann (1999) investigate the

29
determination of overtime compensation in Germany.28 In fact, Hamermesh (1994) argues that the flexibility of overtime hampers efforts to transfer la-bour market reforms from another countries.29 The scatterplots include regression lines.30 However, it must be stressed that this impression is biased by the fact that the turnover in termsof entry and exit is much higher among small establishments. Of course, overtime hours are ob-served only in the case that it is a number above zero. In addition, it can be argued that the resultaccording to which there is a decline in the share of overtime hours in the size establishment isbased on simple aritmetics, because it is not possible to small establishments to make proportion-ately small changes in the number of their personnel. However, it must be noted that distinction ofpaid and unpaid overtime hours complicates this notion.31 The Epanechnikov is the applied kernel density estimate. It has the property that it is the mostefficient in minimizing the mean integrated squared error.32 Estimations were performed by STATA 6.0.33 The derivation of the estimated equation with respect to the variable AGE reveals the fact that allobservations of the data are on the declining section of the estimated parable.34 Hunt (1997) is able to exploit the cross-industry variation in standard hours in order to study theeffects of work-sharing in Germany.35 Ilmakunnas (1997) provides a recent study on Finnish female labour supply.36 About 72% of employees are males in the Finnish manufacturing industries.37 Davis and Haltiwanger (1999) provide a detailed survey to the literature on gross job and workerflows.38 This result is somewhat contradictory with the observation by Eriksson and Fellman (1995) ac-cording to which operating hours of firms tend to rise in plant size within the Finnish manufactur-ing industries.39 This pattern is consistent with an observation by Hohti (2000) for the Finnish manufacturingindustries according to which there was an episode of convergence in the actual average workinghours across the size categories from 1991 to 1994.40 This restriction eliminates 29 722 observations.41 Asplund (1995) provides an extensive discussion on this issue.42 The period from 1980 to 1995 includes 150 161 observations.

30