Embed Size (px)
Citation preview


PALKANSAAJIEN TUTKIMUSLAITOS •TYÖPAPEREITA LABOUR INSTITUTE FOR ECONOMIC RESEARCH • DISCUSSION PAPERS
* Corresponding author. Labour Institute for Economic Research, Pitkänsillanranta 3A, 6. krs. FIN-00530 Helsinki, FINLAND. Phone: +358-9-25357330. Fax: +358-9-25357332. E-mail: [email protected]
** Labour Institute for Economic Research and Institute for Labour Market Policy Evaluation. E-mail:
Helsinki 2007
238
Minimum wages and youth employment: Evidence from the Finnish retail trade sector
Petri Böckerman* Roope Uusitalo**

ISBN 978−952−209−051−5 ISSN 1795−1801

1
Tiivistelmä
Tutkimuksessa tarkastellaan työehtosopimuksissa määräytyvien alimpien taulukko-
palkkojen vaikutuksia palkkajakaumaan ja työllisyyteen vähittäiskaupan alalla. Ai-
neistona käytetään EK:n yksityisten palvelualojen palkka-aineistoa vuosilta 1990-
2005. Tähän aineistoon on liitetty työehtosopimuksiin perustuvat kaupan alan vähim-
mäispalkat. Tutkimuksessa käytetään hyväksi erityisesti niitä poikkeuksia, joita vä-
himmäispalkkoihin sovittiin työmarkkinaosapuolten kesken 1990-luvun puolivälissä.
Vuosina 1993-1995 oli mahdollista maksaa työehtosopimuksessa sovittua tauluk-
kopalkkaa matalampaa palkkaa alle 25-vuotiaille nuorille. Tulosten perusteella nuoria
koskevilla poikkeuksilla ei ollut vaikutuksia työllisyyteen, vaikka niillä olikin jonkin
verran vaikutuksia todellisuudessa maksettuihin palkkoihin erityisesti palkkajakau-
man alapäässä.
Abstract
Following an agreement between the trade unions and the employer organisations,
Finnish employers could pay less than the existing minimum wage for young workers
between 1993 and 1995. We examine the effects of these minimum wage exceptions
by comparing the changes in wages and employment of the groups whose minimum
wages were reduced with simultaneous changes among slightly older workers for
whom the minimum wage regulation was still binding. Our analysis is based on the
payroll record data and minimum wage agreements from the retail trade sector over
the period 1990-2005. We discover that average wages in the eligible group declined
only modestly despite the fact that the excess supply of labour during high
unemployment should make it relatively easy to attract workers even with low wages.
The minimum wage exceptions had no positive effects on employment.
JEL Codes: J31, J51
This paper contains 6764 words.

2
1. Introduction
The negative employment effects of minimum wages were taken granted for decades
(e.g. Stigler 1946; Brown et al. 1982). Only in the 1990s was this consensus view
challenged. In their influential book Card and Krueger (1995) argued that the existing
evidence of the minimum wage effects was questionable. They showed that minimum
wage increases often had no negative employment effects and sometimes the effects
were positive. Considerable debate about the relevance of the new view remains,
however (Neumark and Wascher 2006). The effects of minimum wages on youth
employment are subject to a similar controversy. Some studies find large negative
employment effects due to the increases in minimum wages (e.g. Abowd et al. 2000;
Pereira 2003), while other studies report considerable positive effects (e.g. Portugal
and Cardoso 2006; Hyslop and Stillman 2007).
This paper evaluates the effects of minimum wages on youth wages and employment
in Finland. The empirical analysis is based on a union agreement that allowed
employers to pay less than the minimum wage to workers who were below 25 years
of age and had at most one year’s work experience. Hence, in contrast to many recent
studies that have considered the effects of increases in minimum wages the Finnish
policy involved a temporary decrease in the minimum wage. This subminimum youth
wage policy was effective between 1993 and 1995 at the time of severe recession in
the Finnish economy. The policy intended to boost employment among the groups
that were most likely to be affected by high minimum wages. In this paper, we
analyse the effects of the policy by comparing the changes in wages and employment
of the group whose minimum wages were reduced with simultaneous changes among
slightly older workers for whom the minimum wage regulation was still binding.
We focus on the retail trade sector, because it is a low-wage industry, where one
could expect to discover negative employment effects stemming from minimum
wages. Moreover, the turnover of the workforce is high and part-time work is very
common, which could help firms to achieve desired changes in employment quickly
(Brown 1999).
Finland does not have statutory minimum wage laws. Instead, minimum wages are
determined in the contracts between the unions and the employer organisations.1

3
These contracts are extended to all workers in the sector and are therefore also
binding for non-union workers. Owing to the extension of union-bargained minimum
wages to all workers the employment effects of the minimum wage contracts could be
quite similar to the effects of statutory minimum wage laws. An interesting difference
is that the union contracts do not specify a single minimum wage but a set of task-
specific minimum wages. The minimum provisions vary across regions and the
contracts contain clauses on how minimum wages depend on seniority. In this sense,
the Finnish minimum wage system closely resembles the Swedish and Norwegian
systems (Askildsen et al. 2000; Skedinger 2006). Union bargaining over minimum
wages is not uncommon elsewhere either. For example, those seven EU countries that
do not have statutory minimum wages have all established a tradition of minimum
wages set by collective bargaining, often at the sectoral level. Even in countries with
statutory minimum wages the social partners may have a direct or a consultative role
in minimum wage adjustments (Eurofound 2007).
The evidence on the effects of union-negotiated minimum wages is sparse. Only one
out of 86 studies that are cited by Neumark and Wascher (2006) considers the effects
in the system with negotiated minimum wages. Skedinger (2007) argues that the
union-bargained minimum wage system is interesting, because the negative effects of
minimum wages can be larger or smaller, compared with the countries with statutory
minimum wage legislation, depending on how well the unions are able to assess what
a relevant market-clearing wage for unskilled workers is. The variation in the
minimum wage across workers and the changes in the minimum wage that affect only
some workers also help in studying the effects of the minimum wages. Skedinger
(2006) uses this strategy and finds that the increases in the minimum wages have had
significant negative effects on employment in Sweden.2
Our analysis is based on the payroll record data and minimum wage agreements for
the period 1990-2005. To preview the results, we show that the minimum wages
fundamentally shape wage distribution in the Finnish retail trade sector. There is a
clear spike in wage distribution at the minimum rate and missing mass below that
point. Still, we find that relaxing the minimum wage regulation for young workers
had only a minimal impact on the actual wages. We find no positive employment
effects.
4
The paper proceeds as follows. Section 2 describes the institutions and the structure of
negotiated minimum wages. Section 3 explains the minimum wage exceptions for
young workers during 1993-1995. Section 4 introduces the data. Section 5 contains
our analyses. Section 6 concludes.
2. Finnish labour relations and minimum wages
Description of Institutions
Wage bargaining in Finland involves a high degree of co-ordination between the different
unions and the employer organisations. A framework agreement is typically negotiated
centrally between the union and employer federations on a one- or two-year basis. After
central agreement has been reached, the individual unions and the respective employer
organisations bargain over wages separately in each industry. These contracts determine a
general wage increase applied to all wages and a wage schedule determining a minimum
pay in each task. The industry-specific collective labour agreements are also binding for
the non-union members in the industries where the union contract is “representative”.
This is assessed by a specific institution, the Board for Ratification of the Validity of
Collective Agreements and the Labour Court. They have considered a contract to be
representative when at least half of the workers in the industry are union members. Since
union density is about 70 per cent, most industries have a representative contract.
Consequently, the coverage of collective agreements is around 95% of all workers, one of
the highest rates among the OECD countries (Layard and Nickell 1999).
In the retail trade sector union density has declined rapidly but it was still about 55 per
cent in 2000 (Böckerman and Uusitalo 2006: 292). Minimum wages in the retail trade
are based on collective agreements between the Service Union United (PAM) and the
Federation of Finnish Commerce (formerly the Commercial Employers’ Association).
These minimum wages determine the lowest possible wage for each task in the retail
trade sector. Employers can naturally pay more than the minimum, and the average
wages are generally higher than the minimum rates. It is also possible that local
agreement in a firm leads to lower wage increases than the national union contract.
Under the current law, local agreements on wage increases are legally binding only if

5
their terms exceed the minimum terms in national contracts. Consequently, the
minimum conditions cannot be repealed by the conduct of local negotiations.
The Structure of Minimum Wages in the Retail Trade Sector
In the retail trade sector task-specific minimum wages vary by region, the job-
complexity level and the worker’s experience. The collective agreements specify
wages separately in three geographical regions. The aim is to compensate for the
regional differences in the cost of living. Minimum wages are highest in the Helsinki
metropolitan area (cost-of-living index region I) and lower in the cost-of-living index
regions II and III. The cost of living classification used in the contracts is mainly
based on the 1980 price-level estimates by Statistics Finland. These estimates
attempted to capture regional differences in commodity prices and housing costs
(Lehtonen et al. 1983). Even though these price-level estimates are obviously out of
date, the classification has proved to be hard to change. In fact, some municipalities
are still classified into a higher cost-of-living category based on even older data from
the cost of living study done in 1974 (Lind et al. 1975).
In addition to regional variation, minimum wages depend on the job-complexity level
and experience. In retail trade contracts there are six different job-complexity levels
and four different experience levels (1st, 3rd, 5th and 8th year seniority increment)
that determine minimum wages. These seniority increments are based on work
experience in the retail trade sector, not only on tenure in the current firm. In this
respect, the system in the Finnish retail sector is exactly the same as the one in
Swedish hotels and restaurants described by Skedinger (2006).
To illustrate the minimum wage structure in the retail trade sector, Figure 1 displays
the minimum wages in terms of regions and the worker’s experience in 2000. The
structure is largely similar in other years.3 In addition to the variation shown in Figure
1, there are separate minimum wages for trainees that are 85% of the lowest rate in
each region. All these aspects are taken into account when we analyse the effects of
minimum wages.
Figure 1 around here

6
Regarding the evolution of minimum wages over the period, it is important to note the
Finnish economy went through a severe recession in the early 1990s. Output fell by
14% in the years 1990-1993. The unemployment rate increased to almost 20% from
an average of around 5% during the 1980s. Consequently, there were substantial
pressures to increase flexibility in wage formation. Moreover, a national bargain
between the unions and employer organizations imposed a wage ‘freeze’ in the years
1992-1993 by extending the prevailing wage contracts.
3. Minimum wage exceptions
Because of macroeconomic difficulties, the right-wing government that was in power
between 1991 and 1995 threatened to create new legislation to relax the minimum
wage regulations for young workers. The aim of these plans was to improve
employment opportunities for young workers during the times of high unemployment.
To avoid legislative regulation and government involvement in wage bargaining the
trade unions made an agreement with the employer organisations. Consequently, the
minimum wages of young workers aged below 25 were temporarily reduced, based on
a union agreement. There were minor differences in the exact content and the
conditions of the exceptions between different sectors, because the agreements were
negotiated separately for each industry. The agreement for the retail trade sector was
signed on 7th June 1993. It was in force between 15th June 1993 and 15th June 1995.
Based on this agreement, the minimum wages of workers younger than 25 were
reduced to 80 per cent of the lowest task- and region-specific tariffs during their first
year in the retail trade sector. Furthermore, the trainee wage was reduced from 85 to
60 per cent of the lowest minimum wage prevailing in each region.
The only earlier attempt to evaluate the effects of the 1993-1995 minimum wage
exemptions was a telephone interview for a sample of 150 employers by Saari (1996).
His study covered all sectors, not only low-wage service sectors where the negative
effects of minimum wages are most likely to appear. Saari (1996) discovered that only
two out of 150 employers interviewed had taken advantage of the minimum wage
exemptions (i.e. paid a lower actual wage than the one stipulated in the collective

7
agreement). Therefore, Saari (1996) concludes that the exceptions did not have any
economically significant effect on employers’ hiring decisions.
4. Data
Our data comes from the payroll records of the Finnish employers’ association. The
data covers all private service sector workers in firms that are members of the
association. Hence, it covers around half of all workers in the retail trade sector. The
data provides information about monthly wages, weekly working time, and some
information about workers’ individual characteristics such as age, gender and
education. The data is detailed enough to identify all the factors that have an effect on
the minimum wages for each person. This is quite natural, since one of the main
purposes of collecting the data is to monitor wage growth after the union contract has
been agreed upon. The data covers the situation during one month of each year
(August before 1995 and October in and after 1995).
The monthly rate is defined as the ‘personal wages paid for regular working time’. It
includes such personal and ‘task’ specific bonuses (merit pay) that are paid at the
same amount in each month. The monthly rate excludes performance-based payments,
commissions, ‘profit sharing’ and similar payments. The monthly wage used is not
simply a minimum wage based on contracted wage scales, but includes a significant
person-specific component. The base wage excludes shift work, evening or Sunday
bonuses that are paid at the same amount each month.
Half of the persons employed in the retail sector work as part-time workers (i.e. work
regularly at most 34 hours per week). The average weekly working time is around 30
hours. Part-time work is much more common in the retail sector than in the labour
market in general. According to the Labour Force Survey by Statistics Finland the
share of part-time workers of all employees was 13% in 2005. Minimum wages are
stipulated on a monthly basis in the collective labour agreements of the retail trade
sector. For part-time workers, we construct a monthly wage by using the explicit
formula that is stated in the collective agreements (full-time equivalent monthly wage
= part-time worker’s current wage * (37.5 / part-time worker’s reported weekly
working hours)).

8
We focus on two major occupational groups in the retail trade sector, which both
consist of salespersons. Most of the workers (94%) in our data belong to the group of
salespersons whose work does not require special professional expertise.4 A typical
worker in the data is employed at the cash register in one of the retail business chains.
Minimum wages are defined separately for these two groups in each year and they
depend on region, the job-complexity level and the worker’s experience, as explained
earlier.
To avoid problems in defining the minimum rates for those that hold multiple jobs,
we use information on the salespersons that have only one job (during the one-month
interval of the data). These persons constitute around 99% of all available
observations. The number of persons in the data each year varies according to the
business cycle from around 30 000 to about 50 000. The total number of observations
over the period is approximately 580 000. Minimum wages are collected from the
collective agreements of the retail trade sector for each year and then linked to the
payroll record data by using information on region, the job-complexity level and the
worker’s experience.
5. The effects of union-negotiated minimum wages
Shaping the Wage Distribution
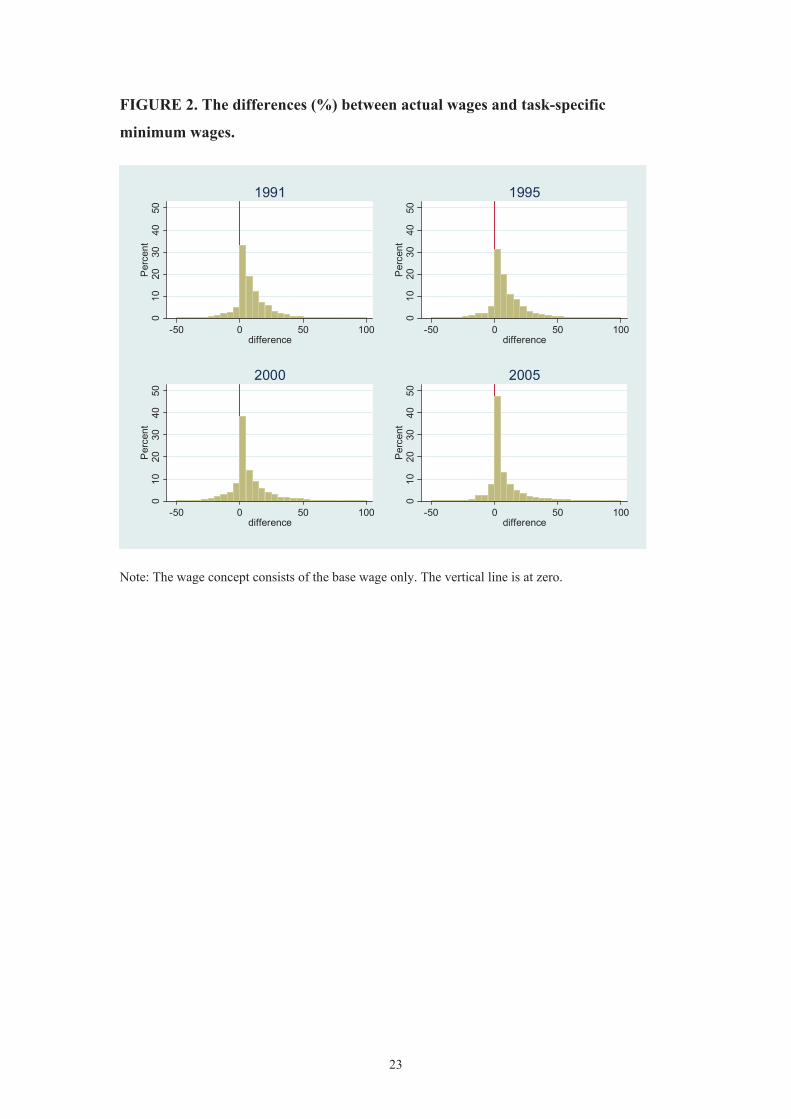
The differences in percentages between actual nominal monthly wages paid by
employers and the minimum monthly wages stipulated in the collective agreements
for the years 19915, 1995, 2000 and 2005 are shown in Figures 2-3 by using two
different wage concepts. The figures clearly show the effects of the minimum wage.
There is a clear cut-off in the wage distribution at the minimum rate and missing mass
below that point.
Figures 2-3 around here
Two additional points are worth noting. First, most of the workers receive actual
wages that are only slightly above the minimum wages that are stipulated in the
collective agreements. The pattern is in line with the findings by Jones et al. (2006)

9
that note the same by using the data from a Finnish retail firm. Second, there is a
small number of observations below the minimum rate. The share of subminimum
wages depends on the exact wage concept used. Strictly speaking, the minimum
wages refer to the base wage. The share of subminimum wages is larger when the
base wage is used (the average share is about 10% for the period). Their share is
around 5% when one is using the wage concept in which shift work, evening or
Sunday bonuses that are paid at the same amount each month are added to the base
wages. Some employers may confuse the base wage with the wage rate that contains
bonuses.6 There is evidence that in many cases when subminimum wages are
observed by using only the base wage, employers have assigned a large sum to the
bonuses that are separately reported in the payroll record data. We therefore prefer the
wage concept that includes shift work, evening and Sunday bonuses.
The remaining amount of subminimum wages is probably caused by the measurement
error in regular weekly working hours. Moreover, it is possible that employers make
mistakes when they classify their workers according to the job-complexity levels. The
latter source seems to be less important, because the number of subminimum wages
does not decrease much when the minimum wages are re-coded to the data without
taking advantage of job-complexity levels (and workers’ experience) and using
information only on their regional variation. Measurement errors in working hours are
important, because part-time work is very common. Overall, most subminimum
wages are only marginally less than the minimum rate.
For comparison, Skedinger (2006: 271), using similar payroll record data for Swedish
hotels and restaurants, reports that around one tenth of the observations have actual
wages below the binding minimum wage. Consequently, the share of subminimum
wages that we observe in the Finnish retail trade sector is of the same order of
magnitude as the one reported by Skedinger (2006). As expected, both of these shares
are significantly lower than the ones seen in household surveys that have often been
used to examine the effects of minimum wages (e.g. Stewart and Swaffield 2002).
The ‘Bite’ of Minimum Wages and Regional Variation
Figure 4 shows that the minimum wages were somewhat more binding during the
depression years in the early 1990s.7 The ‘bite’ of minimum wages tends to be weaker

10
for the youngest workers, because the minimum wages are lower for young workers
that have less experience than older workers.8 This particular pattern is not necessarily
common in the countries with statutory minimum wage legislation that specifies a
single minimum rate. Moreover, the ratio of minimum wages to average wages for
workers below age 25 declined drastically in 1993-1994 owing to the reduced
minimum wages schemes during the years of exceptions.9 This also suggests that the
cut in the minimum wage apparently did not substantially reduce average wages.
Figure 4 around here
It is interesting to study whether there appears additional regional variation in actual
wages that is not directly related to the minimum wages, because unemployment is
almost three times higher in some regions of Eastern and Northern Finland compared
with the regions in Southern Finland (around the Helsinki metropolitan area). To shed
light on this issue, we regress the logarithms of the minimum wages and the actual
wages by using indicators for three separate cost-of-living index regions of the
collective agreements as explanatory variables along with the control variables over
the period 1990-2005.10 We find that regional variation in actual wages is larger than
that in minimum wages. The level of actual wages and minimum wages is almost
similar in the cost-of-living index region II, but in the Helsinki metropolitan area the
actual wages are, on average, around 3% higher than the minimum rates, other things
being equal. This shows that actual wages react to regional labour market conditions.
Outcomes of the Minimum Wage Exceptions
We study the effects of minimum wage exceptions by comparing the changes in
wages and employment of the groups whose minimum wages were reduced to
simultaneous changes among slightly older workers for whom the minimum wage
regulation was still binding. We focus on the years 1991-1996, because the minimum
wage exceptions were in force in our data in 1993-1994. When examining the wage
effects, we restrict the data to workers below age 30 with a maximum of two years’
work experience to obtain a control group that would be as close a substitute as
possible to two treatment groups (workers below age 25 and trainees) that were
eligible for minimum wage exceptions in 1993-1994.

11
Figure 5 depicts the kernel density estimates for the distribution of actual nominal
wages for 1992-1993 and 1994-1995. First, in the top left-hand panel, we show the
wage distribution for workers below age 25 in 1992-1993. There was a small increase
in the mass at the lower tail of the distribution in 1993, which suggests that minimum
wage exceptions did have effects on actual wages. To illustrate this, the share of
wages that were under 800 (€) increased from 0.85% to 2.5% in 1992-1993. The top
right-hand panel shows the distribution for the control group (workers aged 25-30
who had a maximum of two years’ work experience) in 1992-1993. Overall, the
changes were minimal in 1992-1993. Both top panels are consistent with the fact that
there was a wage ‘freeze’ in 1992-1993. The lower panels in Figure 5 show the wage
distributions for the treatment group and the control group in 1994-1995. The picture
that emerges for the treatment group in 1994-1995 is not as clean as for the period
1992-1993, because there was a change in the interval of data collection in 1995 and
the overall increase in wages in 1994-1995. For these reasons, the estimates regarding
the decrease in the minimum wage in 1993 might be more reliable than the estimates
regarding the increase in 1995.
Figure 5 around here
To quantify the effects of the minimum wage exceptions on actual wages and to
assess their statistical significance, we report the levels and changes in wages among
the treatment and the control groups in Table 1. The first nine cells on the top left
corner report the average logarithm of wages in the period before (1991-1992), during
(1993-1994) and after (1995-1996) the minimum wage exceptions. In the top right
corner we report the changes in wages when minimum wage exceptions were
introduced in 1993 and the changes in wages when these exceptions were removed in
1995. We calculate these changes separately in two treatment groups (workers below
age 25 and trainees) and in the control group. In the bottom right corner we report the
differences in these changes. These difference-in-differences estimates capture the
effect of the minimum wage exceptions on actual average wages.
Table 1 around here
According to our estimates the decrease in the minimum wage decreased the average
wages among the young workers by 1 per cent compared to the older control group.
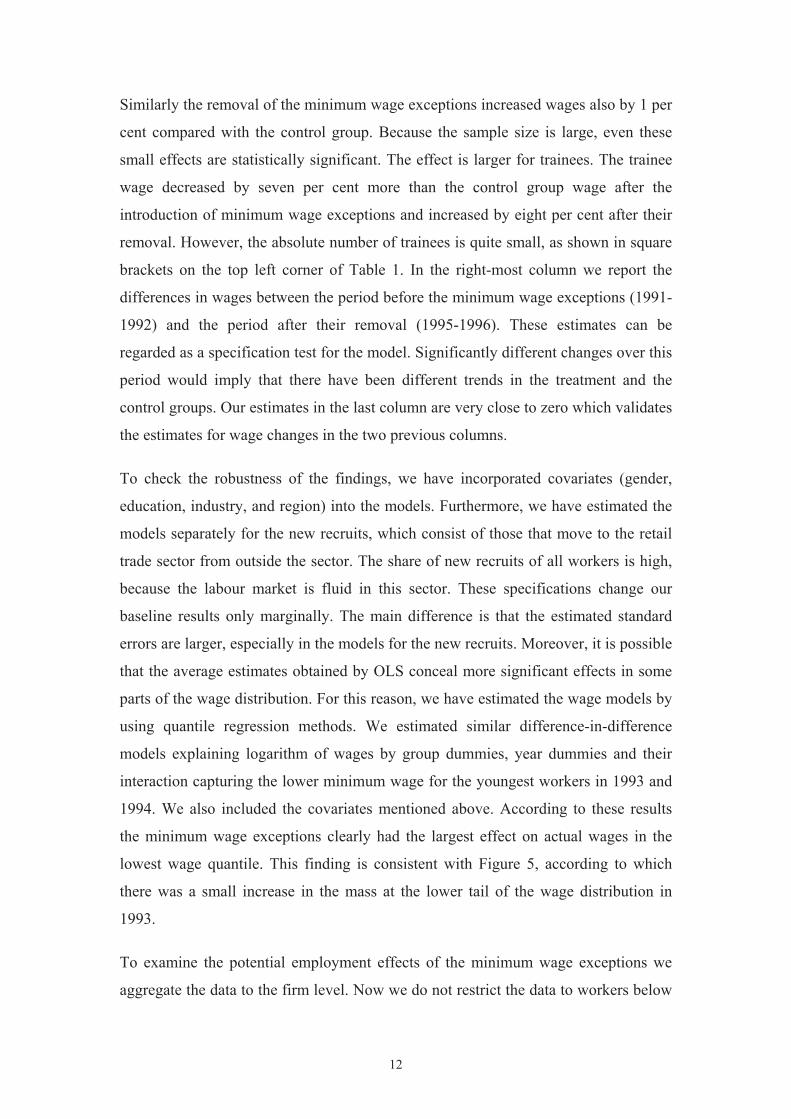
12
Similarly the removal of the minimum wage exceptions increased wages also by 1 per
cent compared with the control group. Because the sample size is large, even these
small effects are statistically significant. The effect is larger for trainees. The trainee
wage decreased by seven per cent more than the control group wage after the
introduction of minimum wage exceptions and increased by eight per cent after their
removal. However, the absolute number of trainees is quite small, as shown in square
brackets on the top left corner of Table 1. In the right-most column we report the
differences in wages between the period before the minimum wage exceptions (1991-
1992) and the period after their removal (1995-1996). These estimates can be
regarded as a specification test for the model. Significantly different changes over this
period would imply that there have been different trends in the treatment and the
control groups. Our estimates in the last column are very close to zero which validates
the estimates for wage changes in the two previous columns.
To check the robustness of the findings, we have incorporated covariates (gender,
education, industry, and region) into the models. Furthermore, we have estimated the
models separately for the new recruits, which consist of those that move to the retail
trade sector from outside the sector. The share of new recruits of all workers is high,
because the labour market is fluid in this sector. These specifications change our
baseline results only marginally. The main difference is that the estimated standard
errors are larger, especially in the models for the new recruits. Moreover, it is possible
that the average estimates obtained by OLS conceal more significant effects in some
parts of the wage distribution. For this reason, we have estimated the wage models by
using quantile regression methods. We estimated similar difference-in-difference
models explaining logarithm of wages by group dummies, year dummies and their
interaction capturing the lower minimum wage for the youngest workers in 1993 and
1994. We also included the covariates mentioned above. According to these results
the minimum wage exceptions clearly had the largest effect on actual wages in the
lowest wage quantile. This finding is consistent with Figure 5, according to which
there was a small increase in the mass at the lower tail of the wage distribution in
1993.
To examine the potential employment effects of the minimum wage exceptions we
aggregate the data to the firm level. Now we do not restrict the data to workers below

13
aged 30, but calculate the employment shares and the shares of hours worked by the
treatment groups and the control group. Another difference to the wage regressions is
that we weight our firm-level observations by the firm size. Otherwise, our difference-
in-differences estimates for employment effects are similar to earlier estimates for
wage changes.
In lower right corners of Table 2 we report weighted least squares estimates where we
explain the employment share of the treatment and the control groups in the firm with
time and group dummies and their interaction. The estimates in column titled “During
– Before” are based on comparison of employment changes between the treatment
and the control group when the minimum wages were reduced in 1993. Similarly the
estimates in column titled “After – During” are based on employment changes that
occurred when the minimum wage exceptions were removed in 1995 i.e. on an
increase in the minimum wage among the youngest workers. Either of these estimates
could be interpreted as an effect of minimum wage change and the setup can be
compared to the earlier studies based on minimum wage changes affecting some
particular group (e.g. Card and Krueger 1995; Portugal and Cardoso 2006; Hyslop
and Stillman 2007).
Table 2 around here
Our estimates in column “During – Before” reveal that minimum wage cut seems to
imply a decrease in employment in the affected groups. This result does not depend
on whether we examine employment shares or the shares of hours worked nor on
whether we examine workers below age 25 or trainees. These estimates are consistent
with the positive employment effects of minimum wages rising, for example, from a
monopsony model, as first argued by Card and Krueger (1995).
However, the estimates reported in column “After – During” reveal that employment
decreased also when the minimum wage exceptions were removed i.e. when
minimum wages increased. Employment in the groups affected by the minimum wage
increase decreased by 1.6 – 4.5 percentage points more than in the control group
depending on whether we examine the shares of employed or hours worked and
depending on which treatment group we examine. Given that wage changes reported

14
in Table 1 were relatively small this implies that increasing minimum wages has
substantial adverse effects on employment.
The contradictory findings are explained by the estimates in the right-most column
where we compare the years 1991-1992 to the years 1995-1996. Apparently there has
been a clear trend decreasing the employment of both treatment groups occurring
simultaneously with the minimum wage changes. However, such trends are hard to
detect with only one before-after comparison and short samples used in some earlier
studies e.g. Card and Krueger (1995).
We have performed several robustness checks and tried to take into account the
different trends in employment in different groups. To save space, we report only the
difference-in-difference estimates for the shares of hours worked (Table 3). Because
the number of firms changed over the period 1991-1996 we have estimated the
models separately for the firms that exist for the whole period 1991-1996. We have
also estimated separate models for the new recruits trying to account for the effects of
the decline in hiring rates during the depression years (e.g. Ilmakunnas and Maliranta
2003). The results remain the same in these specifications.
Table 3 around here
Furthermore, we have estimated several different models for more restricted groups of
new recruits by age. We report one specification in Table 3 in which we compare new
recruits aged 24 with those new recruits aged 26. This is the only specification that
passes our specification test and reveals no simultaneous group-specific trends. These
estimates point to positive employment effects following the cut in minimum wages
and to negative employment effects following a minimum wage increase. However,
the quantitative magnitude of the estimates is small, and they are not statistically
significant.
The literature often argues that the effects of minimum wages are largest for teenagers
(Neumark and Wascher 2004; 2006). For this reason, we have checked whether there
are any positive effects among the very youngest workers (those with age less than
20) that would be hidden in the aggregate numbers. The results do not change
compared with the baseline model.

15
In addition to the models shown in Table 3, we have incorporated group-specific
linear trends into the models. The results vary somewhat depending on the exact
specification of the model, but the overall picture is that it is very hard to detect
positive employment effects.
6. Conclusions
Following an agreement between the trade unions and the employers’ organisations,
Finnish employers could pay less than the existing minimum wage for young workers
for two years between 1993 and 1995. We examine the effects of these minimum
wage exceptions by comparing the changes in wages and employment of the groups
whose minimum wages were reduced with simultaneous changes among slightly older
workers for whom the minimum wage regulation was still binding. We discover that
average wages in the eligible group declined only modestly. We could not detect any
positive effects on employment.
At first sight, the findings for the minimum wage exceptions are somewhat surprising,
given the prevailing macroeconomic situation. Excess supply of labour should have
made it relatively easy to attract workers even with low wages. According to the LFS
by Statistics Finland, the unemployment rate was 31% for workers aged 20-24 in
1994. One explanation is that even in times of high unemployment employers were
not willing to pay less than the old minimum, fearing that paying less than a fair wage
would have adverse effects on effort. Experimental evidence supports this reasoning
(Falk et al. 2006). Furthermore, the Finnish findings are consistent with Katz and
Krueger (1992), who noted the low utilization of subminimum wages in a situation
where employers could have paid less than the minimum rate. In particular, it may be
difficult for firms to justify the payment of different wages for the same work for
workers with different ages. Then a temporary reduction in minimum wages for the
youngest workers does not cause significant changes in actual wages. This does not
the rule out the possibility that the reduction of minimum wages across the board or a
more permanent reduction in minimum wages would not have any effects.

16
Acknowledgements
This study is funded by the Finnish Work Environment Fund (Työsuojelurahasto). We
are grateful to Timo Reinikainen and Katja Veirto (Service Union United) for
providing information about the collective agreements in the retail trade sector.
Moreover, we are grateful to Eija Ahopelto (the Confederation of Finnish Industries)
for providing information about the payroll record data. We are also grateful to Per
Skedinger and Jari Vainiomäki for detailed comments. Paul A. Dillingham has kindly
checked the English language. The usual disclaimer applies.
References
Abowd, J.M., Kramarz, F., Lemieux, T. and Margolis, D.N. (2000). ‘Minimum wages
and youth employment in France and the United States’. In D.G. Blanchflower and
R.B. Freeman (eds.), Youth Employment and Joblessness in Advanced Countries,
Chicago: University of Chigaco Press.
Askildsen, J.E., Lommerund, K.E., Nilsen, O.A. and Salvanes. K.G. (2000). ‘Union
bargained minimum wages: Are there employment effects?’. Unpublished, University
of Bergen, Norway.
Bergholm, T. (2005). Sopimusyhteiskunnan synty I. Työehtosopimusten läpimurrosta
yleislakkoon. Helsinki: Otavan Kirjapaino Oy.
Brown, C., Gilroy, C. and Kohen, A. (1982). ‘The effect of the minimum wage on
employment and unemployment’. Journal of Economic Literature, 20: 487-528.
Brown, C. (1999). ‘Minimum wages, employment, and the distribution of income’. In
O. Ashenfelter and D. Card (eds.), Handbook of Labor Economics, Vol. 3B.
Amsterdam: North-Holland.
Böckerman, P. and Uusitalo, R. (2006). ‘Erosion of the Ghent system and union
membership decline: Lessons from Finland’. British Journal of Industrial Relations,
44: 283-303.

17
Card, D. and Krueger, A. (1995). Myth and Measurement: The New Economics of the
Minimum Wage. Princeton: Princeton University Press.
Eurofound (2007). Minimum wages in Europe. Dublin: European Foundation for the
Improvement of Living and Working Conditions.
Falk, A., Fehr, E. and Zehnder, C. (2006). ‘Fairness perceptions and reservation
wages – the behavioral effects of minimum wage laws’. The Quarterly Journal of
Economics, 121: 1347-1381.
Hyslop, D. and Stillman, S. (2007). ‘Youth minimum wage reform and the labour
market in New Zealand’. Labour Economics, 14: 201-230.
Ilmakunnas, P. and Maliranta, M. (2003). ‘The turnover of jobs and workers in a deep
recession: Evidence from the Finnish business sector’. International Journal of
Manpower, 24: 216-246.
Jones, D.C., Kalmi, P. and Kauhanen, A. (2006). ‘How does employee involvement
stack up? The effects of human resource management policies on performance in a
retail firm’. ILR Collection, Cornell University, Working Paper No. 3.
Katz, L.F. and Krueger, A.B. (1992). ‘The effect of the minimum wage on the fast-
food industry’. Industrial and Labor Relations Review, 46: 6-21.
Layard, R. and Nickell, S. (1999). ‘Labor market institutions and economic
performance’. In O. Ashenfelter and D. Card (eds.), Handbook of Labor Economics,
Vol. 3C. Amsterdam: North-Holland.
Lehtonen, V-M., Puustinen, T. and Tuominen, P. (1983). ‘Vuoden 1980
kalleustutkimus’. Statistics Finland, Studies No. 87.
Lind, T., Mäenpää, M., Puustinen, T. and Simola, A. (1975). ‘Kuntien
kalleustutkimus’. Statistics Finland, Studies No. 31.
Neumark, D. and Wascher, W. (2004). ‘Minimum wages, labor market institutions,
and youth employment: A cross-country analysis’. Industrial and Labor Relations
Review, 57: 223-248.

18
Neumark, D. and Wascher, W. (2006). ‘Minimum wages and employment: A review
of evidence from the new minimum wage research’. NBER Working Paper No.
12663.
Pereira, S.C. (2003). ‘The impact of minimum wages on youth employment in
Portugal’. European Economic Review, 49: 229-244.
Portugal, P. and Cardoso, A.R. (2006). ‘Disentangling the minimum wage puzzle: An
analysis of worker accessions and separations’. Journal of the European Economic
Association, 4: 988-1013.
Saari, E. (1996). ‘Joustoilla työtä? Työsopimuslain poikkeus ja sopimus nuorten
työllistymisedellytysten parantamiseksi - helpottuiko pitkäaikaistyöttömien ja nuorten
työhön pääsy?’. Työpoliittinen tutkimus No. 139. Ministry of Labour: Helsinki.
Sauramo, P. ja Solttila, H. (1985). ‘Minimipalkat ja nuorisotyöttömyys Suomessa
1965-1981’. Finnish Economic Journal, 81: 384-394.
Skedinger, P. (2006). ‘Minimum wages and employment in Swedish hotels and
restaurants’. Labour Economics, 13: 259-290.
Skedinger, P. (2007). ‘The design and effects of collectively agreed minimum wages:
Evidence from Sweden’. IFN Working Paper No. 700.
Stewart, M.B. and Swaffield, J.K. (2002). ‘Using the BHPS wave 9 additional
questions to evaluate the impact of the National Minimum Wage’. Oxford Bulletin of
Economics and Statistics, 64: 633-652.
Stigler, G.J. (1946). ‘The economics of minimum wage legislation’. The American
Economic Review, 36: 358-365.
19
TABLE 1. Difference-in-differences’ estimates of changes in wages
Before (1991-1992)
During (1993-1994)
After (1995-1996)
Change (During – Before)
Change (After – During)
Change (After – Before)
Average logarithm of wage
25≤ Age ≤ 30 6.992 (0.003) [3,120]
6.997 (0.003) [3,305]
7.128 (0.003) [3,616]
0.005 (0.004)
0.131 (0.004)
0.136 (0.004)
Age < 25 6.994 (0.002) [11,237]
6.988 (0.002) [8,885]
7.130 (0.002) [8,394]
-0.006 (0.003)
0.142 (0.003)
0.136 (0.003)
Trainees 6.967 (0.009) [389]
6.901 (0.011) [292]
7.111 (0.007) [623]
-0.066 (0.017)
0.210 (0.016)
0.144 (0.015)
Difference (Age<25) – (25≤ Age ≤ 30)
0.002 (0.004)
-0.008 (0.004)
0.002 (0.004)
-0.010 (0.005)
0.011 (0.005)
0.000 (0.005)
Difference (Trainees) – (25≤ Age ≤ 30)
-0.025 (0.010)
-0.096 (0.010)
-0.016 (0.008)
-0.071 (0.014)
0.079 (0.014)
0.009 (0.013)
Note: The wage concept is the logarithm of actual nominal wage that consists of base wage added to shift work, evening or Sunday bonuses that are paid at the same amount each month. Estimated standard errors in parentheses; number of observations in square brackets. The numbers in the shadowed area are the difference-in-differences’ estimates.

20
TABLE 2. Difference-in-differences’ estimates of changes in employment and hours worked
Before (1991-1992)
During (1993-1994)
After (1995-1996)
Change (During – Before)
Change (After – During)
Change (After – Before)
Employment share 25≤ Age ≤ 30 0.133
(0.002) 0.162
(0.002) 0.182
(0.002) 0.029
(0.003) 0.020
(0.003) 0.049
(0.003) Age < 25 0.195
(0.002) 0.190
(0.003) 0.183
(0.003) -0.006 (0.003)
-0.007 (0.004)
-0.013 (0.003)
Trainees 0.055 (0.001)
0.030 (0.001)
0.033 (0.001)
-0.025 (0.002)
0.005 (0.002)
-0.022 (0.002)
Difference (Age<25) – (25≤ Age ≤ 30)
0.062 (0.004)
0.028 (0.003)
0.001 (0.003)
-0.035 (0.004)
-0.027 (0.005)
-0.062 (0.004)
Difference (Trainees) – (25≤ Age ≤ 30)
-0.078 (0.002)
-0.132 (0.002)
-0.149 (0.002)
-0.054 (0.003)
-0.016 (0.003)
-0.071 (0.003)
Share of hours worked 25≤ Age ≤ 30 0.134
(0.002) 0.162
(0.002) 0.186
(0.002) 0.028
(0.003) 0.023
(0.003) 0.051
(0.003) Age < 25
0.178 (0.002)
0.169 (0.002)
0.147 (0.002)
-0.009 (0.003)
-0.022 (0.003)
-0.031 (0.003)
Trainees 0.040 (0.001)
0.022 (0.001)
0.019 (0.001)
-0.018 (0.001)
-0.003 (0.001)
-0.021 (0.001)
Difference (Age<25) – (25≤ Age ≤ 30)
0.044 (0.004)
0.007 (0.003)
-0.038 (0.003)
-0.037 (0.004)
-0.045 (0.005)
-0.082 (0.004)
Difference (Trainees) – (25≤ Age ≤ 30)
-0.094 (0.002)
-0.140 (0.002)
-0.167 (0.002)
-0.046 (0.003)
-0.026 (0.003)
-0.072 (0.003)
Number of firms 6 524 5 510 4 670
Note: Estimated standard errors in parentheses. The numbers in the shadowed area are the difference-in-differences’ estimates.

21
TABLE 3. Difference-in-differences’ estimates of changes in hours worked; additional specifications
Change (During – Before)
Change (After – During)
Change (After – Before)
Continuing firms 1991-1996 Difference (Age<25) – (25≤ Age ≤ 30)
-0.032 (0.006)
-0.046 (0.006)
-0.078 (0.006)
Difference (Trainees) – (25≤ Age ≤ 30)
-0.041 (0.004)
-0.026 (0.004)
-0.067 (0.004)
New recruits Difference (Age<25) – (25≤ Age ≤ 30)
-0.040 (0.009)
-0.066 (0.010)
-0.106 (0.008)
Difference (Trainees) – (25≤ Age ≤ 30)
-0.084 (0.007)
-0.042 (0.007)
-0.127 (0.007)
New recruits aged 24 vs. new recruits aged 26 Difference (Age 24 – Age 26)
0.004 (0.003)
-0.003 (0.004)
0.001 (0.004)
Age below 20 Difference (Age<20) – (25≤ Age ≤ 30)
-0.039 (0.003)
-0.026 (0.003)
-0.065 (0.003)
Note: Estimated standard errors in parentheses. The numbers in the shadowed area are the difference-in-differences’ estimates.

22
FIGURE 1. The level of minimum wages (€) in terms of regions and worker’s
experience measured in years (1-2, 3-4, 5-7, and 8-) for the salespersons whose
work does not require special professional expertise, for the year 2000.
1000
1050
1100
1150
1200
1250
1300
1350
1400
1-2 3-4 5-7 8-
The Helsinki metropolitan area Cost-of-living index region II Cost-of-living index region III
23
FIGURE 2. The differences (%) between actual wages and task-specific
minimum wages.
Note: The wage concept consists of the base wage only. The vertical line is at zero.
010
2030
4050
Per
cent
-50 0 50 100difference
1991
010
2030
4050
Per
cent
-50 0 50 100difference
1995
010
2030
4050
Per
cent
-50 0 50 100difference
2000
010
2030
4050
Per
cent
-50 0 50 100difference
2005

24
FIGURE 3. The differences (%) between actual wages and task-specific
minimum wages.
Note: The wage concept consists of the base wage added to shift work, evening or Sunday bonuses that are paid at the same amount each month. The vertical line is at zero.
05
1015
Per
cent
-50 0 50 100difference
1991
05
1015
Per
cent
-50 0 50 100difference
1995
05
1015
Per
cent
-50 0 50 100difference
2000
05
1015
Per
cent
-50 0 50 100difference
2005

25
FIGURE 4. The ratio of minimum wages to average wages.
Note: The wage concept consists of the base wage added to shift work, evening or Sunday bonuses that are paid at the same amount each month.
0.6
0.65
0.7
0.75
0.8
0.85
0.9
1991 1992 1993 1994 1995 1996 1997 1998 1999 2000 2001 2002 2003 2004 2005
age>=25 age<25

26
FIGURE 5. The wage distributions for the treatment group and the control
group.
Note: The wage concept is the logarithm of the actual nominal wage that consists of the base wage added to shift work, evening or Sunday bonuses that are paid at the same amount each month. The treatment group consists of workers below age 25 and the control group consists of workers aged 25-30 with a maximum of two years’ work experience. We have dropped 0.5% of the lowest and highest values.
Treatment groupwage
year 1992 year 1993
6.5 7 7.5 8
0
1
2
3
Control groupwage
year 1992 year 1993
6.5 7 7.5 8
0
1
2
3
Treatment groupwage
year 1994 year 1995
6.5 7 7.5 8
0
1
2
3
Control groupwage
year 1994 year 1995
6.5 7 7.5 8
0
1
2
3

27
1 There have been minimum wages in Finland as long as there have been collective agreements. The printers’ union negotiated the first collective agreements in the early 20th century. Collective agreements were not unusual before January 1940, when the employers formally recognized the unions for the first time (Bergholm 2005: 22-23). These contracts were not binding on non-members, however. 2 There is almost no evidence of the effects of minimum wages in Finland. The only existing study (Sauramo and Solttila 1985) uses time-series data on youth employment shares and the ratio of minimum and average wages at the industry level. It finds no negative effects on youth employment. 3 There have been some minor changes in the details of the system. There was an 11th year seniority increment in the years 1991-1999 that has not been applied in other years. Moreover, in the year 1990 (the first year of our data) the classification of seniority increment was different from the rest of the years (including 1st, 4th, 6th and 8th year seniority increment). 4 The results that are reported for the effects of minimum wage exceptions remain the same if we drop the group of salepersons whose work requires special professional expertise from the data, because very few young workers belong to this particular group. 5 We use data from 1991 instead of 1990 because the wage increases agreed in the 1990 contract raised the minimum wages from October 1st 1990. The year 1990 was also the first year when the payroll record data was gathered. Therefore, the data from 1990 may contain more errors. 6 Our discussions with the Finnish employers’ association support this conclusion. 7 Previously, it has been estimated for all sectors that the ratio of minimum rates to average wages is moderate in Finland, i.e. 0.52 (Layard and Nickell 1999: 3043). The estimate is not based on micro-level sources that would take into account all the relevant aspects in the determination of union-negotiated minimum wages, however. 8 We do not present separate ratios for trainees, because their number was rather small during the period 1993-1994. This is shown later in Table 1. 9 We do not include the year 1995 in the years of minimum wage exceptions, because the exceptions ended on June 15th 1995 and the payroll record data for the year 1995 was gathered from the firms in October. 10 The estimation results are available upon request. The industry classification that is available in the payroll record data refers to different retail trade chains. It does not correspond to the official industry classification that is used by Statistics Finland.