Embed Size (px)
Citation preview

MIAMI-DADE ACCESSIBILITY BASED NEEDS ASSESSMENT
March 29, 2017

1
2
3
4
1 WHAT IS ACCESSIBILITY?
2 TECHNICAL NUTS AND BOLTS
3 APPLICATIONS
PRESENTATION OVERVIEW
2
NEXT STEPS

1
A New Frame of Reference
WHAT IS ACCESSIBILITY?1

▪ Accessibility is a direct measure of fundamental question:
“WHAT OPPORTUNITES ARE AVAILABLE TO ME?”
▪ As accessibility increases, so too do opportunities
▪ Accessibility increases through improvements to activity
patterns and transportation networks
INTRODUCTION
STEPS TOWARD A NEW TOOL SET
4

▪ Walking, biking and transit central to today’s planning
context
▪ Federal planning emphasis areas
▪ Ladders of Opportunity: Access to Essential Services
▪ Transition to Performance-Based Planning and
Programming
▪ Models of Regional Planning Cooperation
▪ Tools not able to answer questions
INTRODUCTION
NEW CONTEXT, OLD TOOLS
5

INTRODUCTION
ACCESSIBILITY IS INFLUENCED BY TRANSPORTATION AND LAND USE
6
• Highway level of service
measures the impact of
congestion on speed
(travel time)
• Key assumption is: as
speed drops, so does
accessibility
• Given the influence of
proximity, is that always
true?
Yet, transportation planning has focused on mobility to estimate
accessibility impacts

The elegance of accessibility measures
▪ New metric that encompasses land use, network connectivity, performance
▪ Direct measure of what matters – access to opportunities (easy to explain)
▪ Measures across all travel modes (multimodal planning)
▪ Shifts focus to moving people & goods rather than “solving” congestion
▪ Encourages greater coordination between land use and transportation decisions (integrated planning tool)
▪ Measures disparities for differing groups across differing purposes and modes (ladders of opportunity)
ACCESSIBILITY IS A POWERFUL PLANNING CONCEPT AND TOOL
INTRODUCTION7

A SIMPLE BUT POWERFUL FRAMEWORK
INTRODUCTION8
ACCESSIBILITY =
Land Use
Transportation
Network
Opportunities
• Number
• Variety
• Proximity
Travel Time
• Connectivity
• Directness
• Safety
• Performance

❖Alternate tool to supplement use of SERPM
❖Mobility Needs Assessment Tool (MNAT) rethink
❖Value added to LRTP needs assessment process
▪ Multimodal considerations
▪ Integrated planning approach facilitates scenario planning
▪ Simple, elegant portrayal of system performance
▪ New comprehensive performance metric
▪ Streamlined approach to assist in project prioritization
MIAMI-DADE APPLICATION
INTRODUCTION9

▪ Where is accessibility high, low, other, in terms of # of accessible opportunities (heat maps)
▪ How do scores relate to peer areas (numbers)
▪ Land use vs. Connectivity vs. Mobility diagnostics (heat maps & numbers)
▪ Accessibility score deltas (heat maps & numbers)
▪ IN FUTURE APPLICATION, mode splits (numbers)
WHAT DO RESULTS LOOK LIKE?
INTRODUCTION10
Note: Results depicted here are an approximation of accessibility and do not represent actual accessibility simulation.

▪ Baseline or future conditions accessibility results
▪ Travel desires based on perfect grid or uncongested analysis
▪ Provides diagnostic capability to assess needs in addition to confirmed needs
WHAT DO RESULTS LOOK LIKE?
INTRODUCTION11
Note: Results depicted here are an approximation of accessibility and do not represent actual accessibility simulation.

▪ Generate existing accessibility scores by mode
▪ Define up to 50 scenarios composed of packages of investments to test 2040 Cost Feasible projects
▪ Define up to 25 additional custom scenarios to test specific concerns/issues/land use scenarios
▪ Summarize results in map and table format for comparison and assessment of 2040 plan
▪ Identify additional needs based on results
NEEDS ASSESSMENT PROCESSS
INTRODUCTION12
Note: Results depicted here are an approximation of accessibility and do not represent actual accessibility simulation.

1
Technical Nuts and Bolts
MODEL DEVELOPMENT2

MODEL DEVELOPMENT
▪ Purpose: Develop responsive tools for estimating bike/walk demand
▪ Major Needs/Concerns:
▪ Effect of Land Use
▪ Role of Facilities
▪ Impact on motorized travel
▪ Response:
▪ Need finer geographic resolution
▪ Major role for new data/tools
NCHRP 8-78 / REPORT 770
14

▪ MULTIMODAL ACCESSIBILITY
▪ Recognizes limitations on the amount of time we have to travel
▪ Applies those limitations to what we can reasonably get to by mode (decay function)
▪ DECAY FUNCTION IS NOT A NEW CONCEPT
▪ Gravity model is based on friction factors
▪ Decay by mode is new (gravity model distributes based on auto access)
▪ POWER OF GIS
▪ Enables a fine grain analysis (critical for short walk trips)
▪ Seamless data set
▪ RELATIONSHIP BETWEEN WHAT PEOPLE CAN GET TO BY MODE WITH WHAT & HOW PEOPLE TRAVEL ARE VERY STRONG
STEPS TOWARD A NEW TOOL SET
MODEL DEVELOPMENT15

MODEL DEVELOPMENT
ACCESSIBILITY SCORE CALCULATION
Accessibility =
σ𝑂𝑝𝑝𝑜𝑟𝑡𝑢𝑛𝑖𝑡𝑖𝑒𝑠
𝑇𝑟𝑎𝑣𝑒𝑙 𝑇𝑖𝑚𝑒 ∗𝑫𝒆𝒄𝒂𝒚
Where:
OPPORTUNITIES = Number of
Jobs (HBW) or Number of
Retail/Service Establishments
(HBNW)
TRAVEL TIME = Time to reach
opportunity over actual network
(Network Analyst)
DECAY = Factor reflecting
decrease in value of opportunity
that are farther away
16
Auto Transit Bike Walk
Modal Activity
Ranges (defined by
speeds)
Starting
Point
Travel Time
Decay Curve
Accessibility Score =
Σ time-decayed
opportunities

▪ Land Use: InfoUSA
▪ Employment & number of establishments by NAICs
▪ Exact x,y location
▪ Travel Networks: NAVTEQ, GTFS
▪ All streets, enhanced to include walk/bike facilities
▪ Detailed operations specific transit network
▪ Path selection – CUBE Sugar
▪ Travel Behavior:
▪ Regional HH Travel Survey
▪ Streetlight data (Big Data provider)
DATA AND TOOLS
MODEL DEVELOPMENT 17
HOUSEHOLDTRAVEL SURVEY
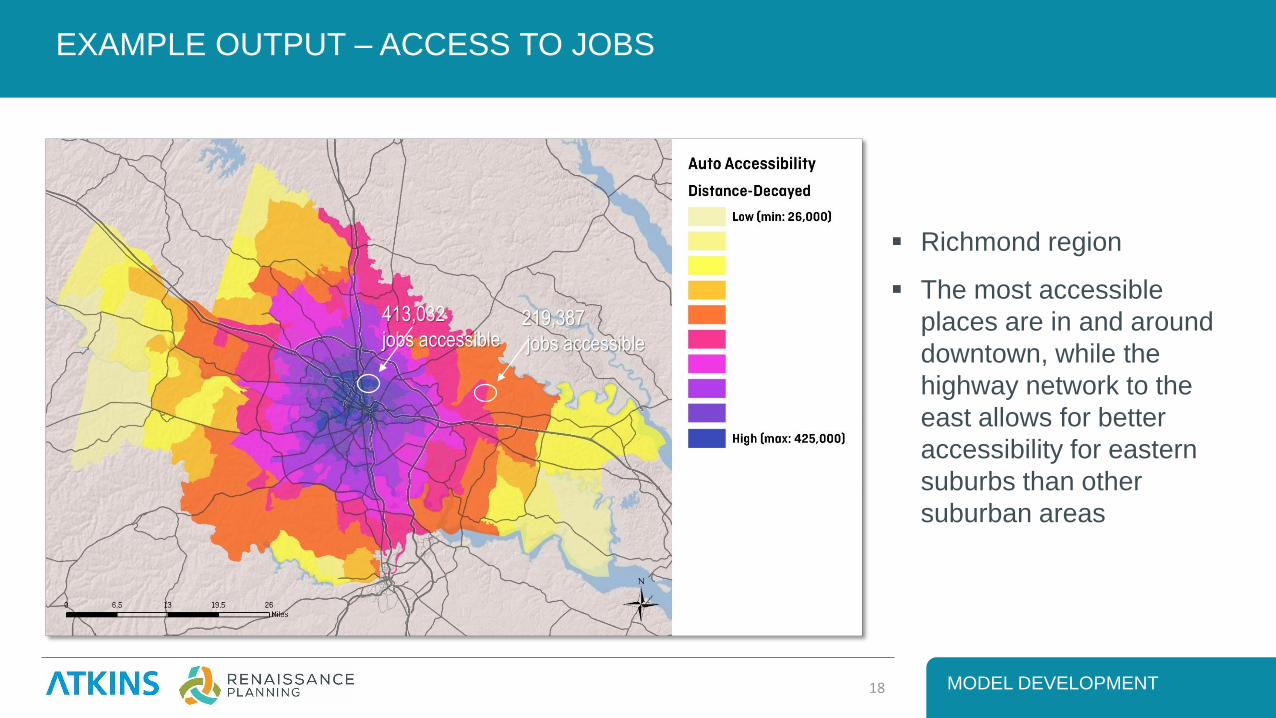
▪ Richmond region
▪ The most accessible
places are in and around
downtown, while the
highway network to the
east allows for better
accessibility for eastern
suburbs than other
suburban areas
MODEL DEVELOPMENT
EXAMPLE OUTPUT – ACCESS TO JOBS
18
413,032
jobs accessible219,387
jobs accessible

USING MODEL TO ESTIMATE WALK TRIP FLOWS*
MODEL DEVELOPMENT19
*WALC model available in NCHRP Report 770

IDENTIFYING UNMET WALK OPPORTUNITIES
MODEL DEVELOPMENT20
Major
Attractions
Major
Productions
“No-Man’s”
Land
Step 1 Step 2
Added
Link
Increases
Walk Trips

1
Lessons Learned So Far
APPLYING THE FRAMEWORK3

▪ Asheville, NC - Multimodal Accessibility Analysis in Support of Bicycle and Pedestrian Planning & Programming (sub-area)
▪ MDOT/Montgomery County 355 Corridor Bus Rapid Transit (BRT) Analysis (corridor)
▪ VDOT Multimodal Accessibility as a Statewide Performance Measure (system)
REAL WORLD APPLICATIONS
APPLYING THE FRAMEWORK22

APPLYING THE FRAMEWORK23
▪ 1,100 acre area adjacent to downtown Asheville
▪ Large proportion of disadvantaged communities
▪ Study focused on land use, multimodal connectivity, safety
▪ Accessibility analysis conducted broadly AND to analyze specific issues
MULTIMODAL SUBAREA PLAN
Asheville Multimodal Network

APPLYING THE FRAMEWORK
▪ Land use impacts on accessibility
▪ Results represented as number of jobs accessible to the area
▪ Orange = high accessibility
▪ Purple = low accessibility
WALK TO EMPLOYMENT – TESTING LAND USE
24
Asheville Multimodal Network
Existing network, Future land useExisting network, Existing land use

APPLYING THE FRAMEWORK
▪ Improved sidewalk connections
▪ New roadways connecting planned developments
▪ Trail improvements
▪ Fill sidewalk gaps and bike lanes
Asheville Multimodal Network
TESTED A NEW NETWORK OF MULTIMODAL FACILITIES VERSUS EXISTING
25
ASHEVILLE
Asheville Multimodal Network

APPLYING THE FRAMEWORK
▪ Network + land use impacts on accessibility
WALK TO EMPLOYMENT – TESTING NETWORK AND LAND USE
26
Asheville Multimodal Network
Future network, Future land useExisting network, Future land use

APPLYING THE FRAMEWORK
▪ Walk to food markets existing
▪ Discrete locations
▪ Conclusion -disadvantaged populations were disadvantaged in terms of accessibility
TESTED WALK ACCESS TO FOOD MARKETS
27
Asheville Multimodal Network

APPLYING THE FRAMEWORK
▪ New food market demonstrates expansion of accessibility
IF ONLY WE HAD A NEW MARKET
28
Asheville Multimodal Network

▪ Viable model for detailed analysis at the sub-area level
▪ Measurable impact on accessibility based on land use and network interventions
▪ Scale of land use data and detail of network data yielded differentiating results
▪ Approach can be used to measure total change in accessibility for a number of purposes
▪ Localized impact
▪ Access to particular destinations
▪ Benefits to certain groups
▪ Project prioritization
▪ Performance measurement
LESSONS AND OBSERVATIONS
APPLYING THE FRAMEWORK 29
Asheville Multimodal Network

MULTIMODAL / PERFORMANCE PLANNING
APPLYING THE FRAMEWORK 30
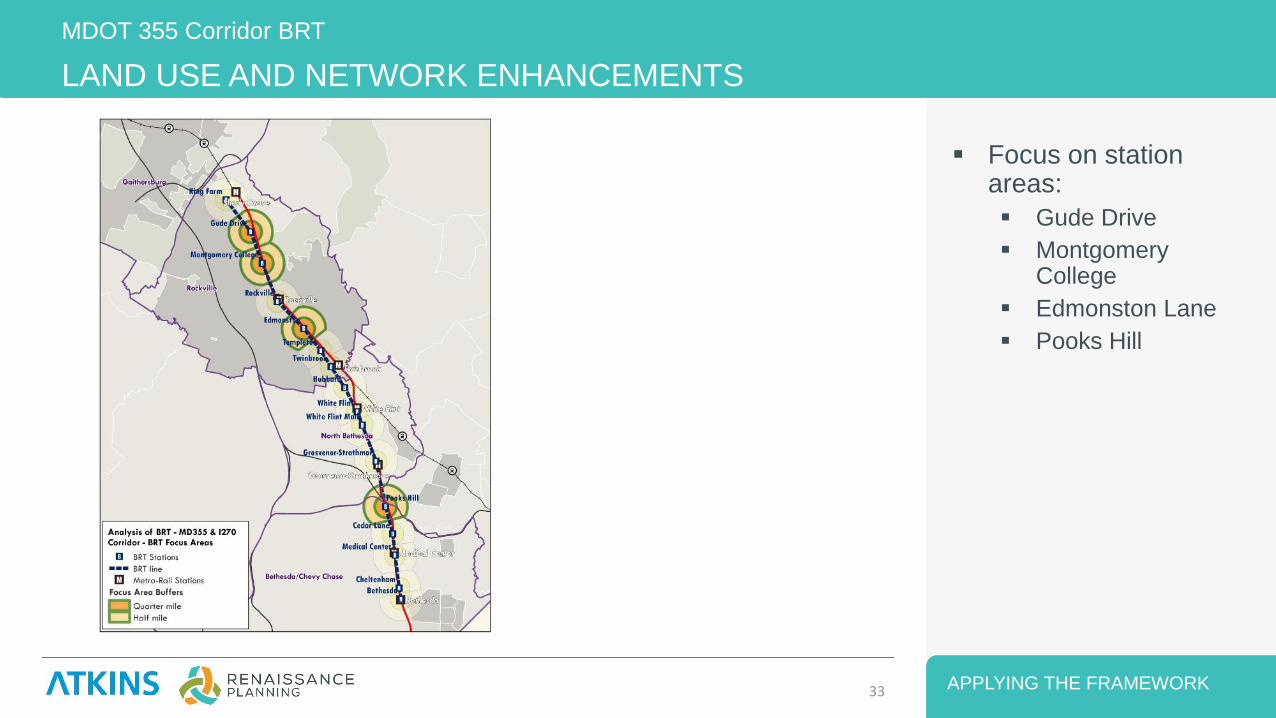
MDOT 355 Corridor BRT
▪ 26 miles
▪ BRT proposed in 355 corridor
▪ Early look at viability of investment
▪ Tested transit and land use scenarios
▪ Focused on mode shift as performance measure

▪ MODEL DEVELOPMENT
TRANSIT ACCESSIBILITIES: WORK & NON WORK (TAZ)
APPLYING THE FRAMEWORK31

MODE SHARES BY MMA TIER: HOME BASED WORK
APPLYING THE FRAMEWORK32
Transit (walk
or feeder
access)
Drive
Alone
Auto
Passenger
Transit
(auto
access) Walk Bicycle Other
Tier 1 <67k 8.0% 77.5% 2.8% 10.0% 0.8% 0.8% 249
Tier 2 67k-102k 10.5% 76.8% 2.2% 9.4% 0.6% 0.6% 181
Tier 3 103k-151k 12.6% 71.3% 4.8% 6.5% 1.7% 2.2% 0.9% 230
Tier 4 152k-228k 27.3% 55.1% 6.3% 3.9% 5.4% 1.0% 1.0% 205
Tier 5 >228k 45.8% 41.3% 1.7% 1.7% 7.3% 2.2% 179
19.7% 65.4% 3.6% 6.5% 2.7% 1.3% 0.7% 1044
Transit (walk
or feeder
access)
Drive
Alone
Auto
Passenger
Transit
(auto
access) Walk Bicycle Other
Tier 1 <329 9.4% 74.8% 4.4% 8.9% 0.6% 1.7% 0.3% 361
Tier 2 329-1513 13.8% 73.3% 2.4% 6.7% 0.5% 1.4% 1.9% 210
Tier 3 1514-3577 16.7% 65.6% 4.4% 8.9% 2.2% 1.1% 1.1% 180
Tier 4 3578-7607 29.1% 55.7% 5.1% 3.2% 7.0% 158
Tier 5 >7607 45.0% 43.6% 1.3% 1.3% 6.7% 2.0% 149
19.5% 65.7% 3.7% 6.5% 2.6% 1.3% 0.7% 1058
All
Walk MMA Tier
Percent of Trips by Mode
Trip
Sample
Size
All
Transit MMA Tier
Percent of Trips by Mode
Trip
Sample
Size
APPLYING THE FRAMEWORK
▪ Focus on station areas:
▪ Gude Drive
▪ Montgomery College
▪ Edmonston Lane
▪ Pooks Hill
LAND USE AND NETWORK ENHANCEMENTS
33
MDOT 355 Corridor BRT

APPLYING THE FRAMEWORK
▪ Inner circle – existing
▪ Middle circle – BRT improvement only
▪ Outer circle – BRT and enhanced transit oriented development
EFFECT OF SCENARIOS ON WORK MODE SHARES
34
MDOT 355 Corridor BRT

APPLYING THE FRAMEWORK
MAPPING ACCESSIBILITY AT STATEWIDE SCALE
35
VDOT OIPI Statewide Performance Measures

▪ 60% of score – change in cumulative job accessibility (within 45 minutes by auto, 60 minutes by transit)
▪ 20% of score – change in cumulative job accessibility for disadvantaged populations (within 45 minutes by auto, 60 minutes by transit)
▪ 20% of score – assessment of the project support for connections between modes and promotion of multiple transportation choices
APPLYING THE FRAMEWORK 36
MAPPING ACCESSIBILITY AT STATEWIDE SCALE
VDOT OIPI Statewide Performance Measures

▪ Access to specific job types
▪ Access to non-job locations (schools, recreation facilities)
▪ Access for disadvantaged populations
▪ Peak hour access vs. uncongested access
▪ Population-weighted access (i.e. how many people can take advantage of the access)
▪ Current research study for FHWA to look at data needs to support multimodal performance measures
OTHER POTENTIAL ANALYSES
APPLYING THE FRAMEWORK 37

3
1ST Steps and Schedule
NEXT STEPS

Data Preparation
▪ Assemble and process input data
▪ Test SERPM Micro Analysis Zones (MAZ) vs Census Block geographies
Run Tool
▪ Generate baseline accessibility results
Results Analysis Framework
▪ Research peer areas for accessibility comparisons
NEXT STEPS
MOVING FORWARD39

SCHEDULE
MOVING FORWARD40
Task Month 1 2 3 4 5 6 7 8 9
Data Preparation (networks, SE data)
Generate Base Scenario Results
Define Future Year Scenarios
Generate Future Year Scenario Results
Results Analysis – Assess Needs
Technical Memorandum
PAT Meetings

Carlos Roa
305.375.1833
Jack Schnettler
305.514.3369
Franco Saraceno
813.254.7741 Ext. 208
QUESTIONS???
???41