Embed Size (px)
Citation preview
Quality costs: paying for EarlyChildhood Education and CareKate Goddard and Emma Knights
Report series funded by
Final report
Quality costs: paying for Early ChildhoodEducation and Care
Kate Goddard and Emma Knights
Acknowledgements
Daycare Trust would like to thank the NuffieldFoundation for funding this research project. Thanks arealso due to the Social Market Foundation (in particularSandra Gruescu) and the Institute for Fiscal Studies(Mike Brewer) for their work on this project; membersof the Advisory board; and participants at theroundtables. For more details of the Advisory board androundtables, please see Appendices A and B.
The Nuffield Foundation is a charitable trust with theaim of advancing social well-being. It funds researchand provides expertise, predominantly in social policyand education. It has supported this project, but theviews expressed are those of the authors and notnecessarily those of the Foundation. More informationis available at www.nuffieldfoundation.org.
ContentsChapter 1: Introduction 3
Chapter 2: What is high quality early childhood education and care? 6
Chapter 3: What is the cost of quality? 13
Chapter 4: What parents currently pay 18
Chapter 5: Current government spending on early childhoodeducation and care 21
Chapter 6: Funding options for high quality early childhoodeducation and care 28
Chapter 7: Conclusions and recommendations 39
Appendices 44A. Advisory board membersB. Roundtable attendees
References 45
Quality costs: paying for Early Childhood Education and Care02
03
The Government’s vision, outlined in its Ten Year Strategyon Childcare,1 included the ambition that in future earlychildhood education and care (ECEC) provision in thiscountry will be among the best in the world with a betterqualified workforce; more workers trained to professionallevel; greater involvement of parents in planning anddelivering services; and reformed regulatory andinspection systems. This vision marked a very significantstep in the aspirations for ECEC, and has been followedby an expansion of provision. Although the quality of thisavailable provision is improving, it is still variable andthere is some way to go to achieve high quality ECEC forall pre-school children. Daycare Trust has always insistedthat quality is one of the foremost necessities of earlyyears provision but, while great strides have been madein expanding services, it is now generally accepted thatquality remains the last piece of the jigsaw to be fullyaddressed. Indeed quality has risen to the top of both thepolicy and practice agendas. There is now a large body ofwork on improving quality of provision – which will bereviewed here – but there has, until now, been no attemptto quantify the cost of improving quality to a consistentlyhigh level. This project aims to bring the work on qualityand sustainable funding together.
The aim of the Quality costs project is to identify theelements required for high quality provision of ECEC andto establish and cost a high quality model. Crucially, thecurrent costs and levels of funding for ECEC areidentified, and funding options for the high qualitymodel are explored in depth, to identify ways in whichECEC can be subsidised to ensure that the costs do notbecome prohibitive for parents.
BackgroundThe last decade has seen an increased focus on ECECfrom the current Government, both in terms of itsfunding and quality improvement. Prior to 1997, ECECwas mainly seen as a private matter, with patchy accessdepending on where families lived and how much theycould afford to pay. Since then, a number of policyinitiatives and strategies have been established toimprove the quality, availability and affordability of ECEC.
In 2004 the Government published its ten year strategy
for childcare, Choice for parents, the best start forchildren.2 The themes of the strategy were choice andflexibility, ensuring availability, building quality andaffordability. This outlined a number of policy initiatives toimprove the quality of ECEC services, such as: achildren’s workforce strategy to provide a newqualification and career structure; a £215 millionTransformation Fund to raise the quality and sustainabilityof childcare; partnership working with children’s centresand a reformed regulatory framework and inspectionregime. It also committed to extending the free earlyeducation places to 15 hours per week for 38 weeks peryear by 2015, with a long-term goal of 20 hours per week.
The childcare strategy was followed in 2006 by theChildcare Act,3 which took forward a number of theprovisions in the ten-year childcare strategy andenshrined them in law. Local authorities now have legalresponsibilities to survey local need and ensuresufficient places are available, and are required toimprove outcomes for all pre-school children and reduceinequalities between children. High quality ECEC is animportant element in this. The Childcare Act alsointroduced the Early Years Foundation Stage (EYFS),which sets the quality framework and welfarerequirements expected of ECEC providers.
Alongside these specific developments in ECEC, theGovernment has also committed to ending child povertyby 2020. This will entail getting more parents into work,as well as improving social mobility and high qualityECEC as a prerequisite to achieving both of theseambitions. Indeed, a key feature of countries that havebeen able to break the link between parental incomeand that of their children is high quality and highlysubsidised ECEC.
Five years on from the launch of the childcare strategy,most of the policy initiatives related to qualityimprovement have been implemented, at least partially.These include:� Reform of the ECEC workforce, led by the Children’s
Workforce Development Council, including:� a commitment to a graduate-led workforce in all full
daycare settings by 2015;� creation of the Early Years Professional Status (EYPS);
1. Introduction
04 Quality costs: paying for Early Childhood Education and Care
� a new single qualifications framework; and� the Graduate Leader Fund (following on from the
Transformation Fund).� A new regulatory framework and inspection regime
(through Ofsted) for all ECEC services.� A single quality framework –the EYFS (see above) –
providing an integrated approach to care andeducation and setting the national standards forlearning and development from birth to five.
England has adopted a market approach to ECEC, withprivate, voluntary and independent sector providersoperating alongside maintained sector provision. Forexample, the majority of full daycare is privately run, with66 per cent privately operated in 2007, and 21 per centrun by a voluntary organisation. Full daycare in children’scentres is more likely to run by a local authority (49 percent). However the Government recognised that marketforces alone would not produce the kind of childcaremarket envisaged in the strategy, so has thereforeplayed an active role in the market, for example, byproviding funding to create new places (particularly in themost disadvantaged areas) and to improve quality. Localauthorities have a key role in managing the market, andas mentioned above have a statutory responsibility toensure sufficient childcare is available in their area forworking parents. This will involve supporting existingproviders to remain sustainable, and/or establishing orcommissioning new provision where appropriate.
As noted above, quality is one of the key considerationsin the 10-year strategy and is essential in improvingoutcomes for children. Figures from Ofsted indicate thataround 60 per cent of ECEC settings are judged good oroutstanding. The number of good and outstandingsettings is higher in nursery schools and classes, withten per cent of settings judged outstanding comparedto five percent of childcare settings.5 Overall, aroundthree percent of settings are judged inadequate (onlyone per cent of nursery schools and classes), andOfsted reports that the main weaknesses includeinsufficient rigour in checking staff suitability, insufficientattention to risk assessment, and a lack of proceduresand records for safeguarding children.
Progression towards improved quality in ECEC is takingplace, but slowly, and the pace of change is slower thanthat in other countries (for example, New Zealand – wherechildcare provision started from a similar basis in the late1990s – has moved much more quickly to a system of
graduate-led ECEC settings, with financial incentives,such as higher rates of funding, for settings to improvequality). In England, for example, 75 per cent of all paidstaff in full daycare hold at least a Level 3 qualification,compared to 72 per cent in 2006 and 57 per cent in 2003;and 7 per cent hold at least a Level 6 qualification,compared to 4 per cent in 2006.6 So England is still someway from having a fully qualified workforce and only avery small percentage are graduates; despite the effortsbeing made to train Early Years Professionals (a graduate-level status for those working in ECEC) there are issues ofpay, conditions and parity with Qualified Teacher Statuswhich are yet to be resolved.
Therefore, as high quality provision undoubtedly has acost attached to it, this project examines whetherenough has been spent to achieve the level of qualitythat is needed to deliver the best possible provision andtherefore the best outcomes for children.
Scope and limitationsIt is a known fact that parents and the home environmenthave the largest impact on a child’s development. Thequality of the home learning environment and theinteractions between a parent and child plays a moresignificant role in producing better child outcomes thanparental income, mothers’ qualifications and socialclass.7 Evidence also suggests that parental interventionin children’s programmes produces modest positiveeffects on children’s cognitive development.8 Howeverthis project is concerned with the quality of formal ECEC,and not that provided at home.
Daycare Trust has had to restrict the project to groupcare. It has not been able to consider the quality andcost of childminders, as there is not the same evidencebase to enable discussion of high quality childminding inthe same way. Childminders also have a very differentcost basis which is not analysed here. This is not to saythat childminders don’t have an important role in ECECor don’t need to be of high quality; on the contrary, theyhave a very important role to play and are the firstchoice for many parents. Likewise, this projectconcentrates on pre-school provision and does notexplore other elements of the childcare market, such asout-of-school clubs or holiday playschemes.
The Quality costs project uses the Childcare and EarlyYears Providers Survey published by the Department for
Children, Schools and Families (DCSF) to form the basis ofthe modelling of current costs, which are then comparedto the costs associated with Daycare Trust’s high qualitymodel (see Chapter 3). As the DCSF survey is limited toproviders in England, research for the project has similarlylimited its scope. Furthermore, ECEC is a devolved matter,and therefore the relevant policies adopted varyconsiderably between the different UK countries, whichwould have added significant complication to the project.However, Working Paper 5 and Chapter 6 of this finalreport do consider the estimated costs to government at aUK level, by applying the Barnett formula.
Methodology and project partnersIn order to achieve the aims of the project, Daycare Trustworked with the Social Market Foundation (SMF) and theInstitute for Fiscal Studies (IFS). Their expertise in financialmodelling has been critical to the success of the project.
The project began with a literature review of the natureof quality ECEC. This was backed up by interviews withkey stakeholders and a roundtable discussion. The SMFworked with Daycare Trust’s high quality model and thedatasets from the 2007 Childcare and Early YearsProviders Survey to identify the current costs associatedwith the model, as well as the high quality costs whichwould arise from increased staff qualifications and pay.
The IFS then undertook a quantitative analysis ofdifferent policy options that help meet the total cost ofproviding high quality ECEC, considering the financialimpact on government and parents. Their analysis alsoconsiders the distributional impact on families withchildren. This involved modelling using the IFS’ micro-simulation model, TAXBEN.
The project team was supported by an advisory board,which included academics, researchers and childcareexperts, in addition to representatives from the DCSF,HM Treasury and the Children’s Workforce DevelopmentCouncil. Membership of the advisory board is detailed inAppendix A.
Two roundtables were held as part of the project. The firstwas held in October 2008 to discuss the research onquality and to identify any areas of research that had notbeen identified. This roundtable helped to develop thecomponents of the high quality model, and confirmed theneed to approach the model with a view of integrated
childcare and early years education, rather than seeingtwo different tiers or types of care. The second roundtablewas held in September 2009, near the conclusion of theproject, to give an opportunity for discussion on thefindings of the project; the level of spending that would berequired; and the potential funding mechanisms to ensurethat costs did not rise beyond a level that parents couldafford. Organisations represented at the roundtables aredetailed in Appendix B.
Detailed description of the methodology and outputsfrom the different stages of the project are available asfive working papers to accompany this final report:� Working Paper 1: What is high quality early childhood
education and care?Maxine Hill and Emma Knights, Daycare Trust
� Working Paper 2: What is the cost of quality?Sandra Gruescu, Social Market Foundation
� Working Paper 3: What do parents pay?Kate Goddard and Jonathan Rallings, Daycare Trust
� Working Paper 4: International comparisons of highquality early childhood education and careSandra Gruescu, Social Market Foundation
� Working Paper 5: Funding options for high qualityearly childhood education and careMike Brewer, Institute for Fiscal Studies
Structure of the reportThis final report of the Quality costs project brings togetherthe one-year research project and summarises theinformation from the five working papers. The report firstlyaddresses the issue of quality and reviews the relevantliterature, summarising the different factors necessary forhigh quality ECEC before outlining Daycare Trust’s highquality model. Chapter 3 discusses the cost calculation forthe high quality model and compares those costs to thecurrent situation. Chapters 4 and 5 discuss the currentlevels of funding for ECEC in England, firstly from feescharged by providers and secondly from Governmentsubsidies. Finally, in Chapter 6 we discuss the financerequired to fund the high quality model and explore thedifferent options for allocating funding. Chapter 7 containsour conclusions and recommendations for taking theresults of this project forward.
05

The first working paper explores in detail what is meantby good quality early childhood education and care(ECEC) and examines the factors that determine quality.It proposes a ‘high quality model’. The briefing paperdraws on three sources:1. A review of the literature from existing research on
ECEC quality.2. Interviews with key stakeholders including the
Department for Children, Schools and Families(DCSF), Ofsted, childcare providers’ representativeorganisations and two local authorities.
3. A policy roundtable with subject experts, policyofficials and representatives from the childcare sector.
Defining qualityIt is universally accepted that children should receive agood quality service in early years provision; yet,perhaps not surprisingly, there is no common agreementof what that means and no single definition of whatquality ECEC is. Many researchers have argued that asingle universally accepted definition of ‘quality’ isunachievable as it is value-based and subjective.
It is apparent that the understanding of what constitutes‘high quality ECEC’ differs depending on the individual’sperspective. For example, parents, children, ECEC staff andmanagers, local authorities and politicians approach ECECwith diverse attitudes and differ in their view of what ECECmight be expected to deliver. Interviews with stakeholdersidentified that bringing together these diverse views wasimportant and the working paper achieves that objective.
What is high quality ECEC aiming toachieve?There are a number of different aims that are prioritisedby different stakeholders, with the emphasis varying.These include:� ensuring children are ready for school by developing
good literacy and numeracy skills;� making sure children are safe and healthy;� keeping children happy and engaged in activities they
enjoy;
� ensuring children have good behaviour and are well-adjusted;
� closing the attainment gap between disadvantagedchildren and their peers; and
� enabling both parents to be in paid work.
The different definitions of quality reflect the variousaims of ECEC held to be most important by diversegroups, and the international evidence shows that qualityis measured differently in individual countries dependingupon the cultural values and constructions of childhood.9
Positive child outcomesAs noted by the Organisation for Economic Co-Operationand Development, positive child outcomes are a majorgoal for ECEC in all countries, but what differs is whichoutcomes are deemed to be more important. Forexample, the UK – as in many other English-speakingcountries and in France – prioritises outcomes that leadto children being ‘school ready’.10 Whereas countriessuch as Denmark, Sweden and Norway come from asocial pedagogy tradition which combines care,upbringing and learning, without hierarchy and with afocus on preparing children for life more broadly ratherthan focusing on school-readiness. A further example ofa different model of provision based on a different set ofcultural values and views on childhood is that in theReggio Emilio region in northern Italy. Children there areconsidered as able to think and act for themselves inorder to make meaning of their own experiences. ECECworkers therefore use an approach that takes intoaccount those children’s interests, experiences andchoices. The value placed on certain outcomesinfluences how services are developed as well as theway in which quality is defined and measured. TheReggio Emilio approach is now widely written about anddrawn on by many practitioners but it is not yet central tothe approach taken in this country to measure quality.
Identifying high quality in settingsDespite the emphasis in Working Paper 1 covering theoutcomes for children, it is appreciated that an
Quality costs: paying for Early Childhood Education and Care06
2. What is high quality earlychildhood education and care?
outcomes-based approach is not the only way in whichquality of ECEC can be defined or identified. Othermeasures include:� Observational rating scales used by trained
researchers and, increasingly, by practitioners.� Expert judgements from inspectors or advisers (such
as those used to ensure national standards aremaintained)11 – see the section on ‘Ofsted’ in WorkingPaper 1.
� Frameworks which provide a practical way of allowingthe various different stakeholders to share anddevelop mutual understanding of the quality concept.
What can be measured?Research on the impact of ECEC is rightly dominated bywhat is beneficial to children.12 The evidence in the, nowsubstantial, body of empirical research shows that goodquality ECEC is associated with better child outcomes,usually in future years (for example, school-readiness andbeyond). Sylva and Roberts refer to a child-outcomeapproach to defining quality as a ‘post-hoc’ one as qualityjudgements are made retrospectively.13 While there is anexcellent body of evidence on some later ‘outcomes forchildren’, there are no measures of the experiences ofchildren in the provision – for example, their happinessand engagement. Do they enjoy their time in childcare?There is a body of thought attempting to bring thisapproach, often linked to Emilio Reggio in Italy andbased on a children’s rights philosophy, more centrallyinto the discussion of quality.14 Daycare Trust is aware incarrying out this piece of work that the lack of empiricalevidence from this point of view – on the ‘here and now’experience for children – makes the task more difficult.
The impact of ECEC on childrenThere is now a large body of evidence – from the UK, theUSA and many European countries – that has examinedthe impact of ECEC on children.15 (The impact of ECECon children is discussed in detail in Working Paper 1.16)Melhuish provides a substantial overview of theinternational research and concludes that the research isconsistent in demonstrating a positive relationshipbetween ECEC from three years onwards andintellectual, social and behavioural development, and thatthe effects are greater for high quality provision.17 Thebenefits are varied and include improvements inchildren’s confidence, peer relationships and behaviour;their learning and development; and also a contribution
to breaking inter-generational disadvantage and poverty.However these benefits are highly dependent on thequality of provision. Research also shows that poorquality ECEC provision is no more beneficial to the childthan where there is no provision at all. Conversely, highquality ECEC produces better outcomes for children, andthe outcomes most often associated with high qualityprovision were summarised by Melhuish.18
In the UK, the largest and most widely cited study is theEffective Provision of Pre-School Education (EPPE)project which showed a significant link between higherquality provision for children from age three and betterintellectual and social/behavioural outcomes whenchildren enter school.19 Furthermore the advantages canlast a substantial amount of time, continuing throughoutprimary school. The EPPE project confirmed thatdisadvantaged children in particular have much to gainfrom ECEC provision; use by disadvantaged childrenproduces positive cognitive, language and socialdevelopment as long as the quality of provision is high.Full-time attendance led to no better gains than part-time attendance – once 15 hours a week is reachedthere are no further improvements in outcomes forchildren. Both the EPPE project and the evaluation ofthe Neighbourhood Nurseries Initiative (NNI)20 showedthat the benefits of good quality pre-school settings fordisadvantaged children are particularly significant wherethey attend with a mixture of children from differentsocial backgrounds.
Research on children under three-years-old is lessprevalent and less conclusive than that for the older agegroup. Some studies on the impact of ECEC for theunder threes find positive effects, some find negativeeffects and some find no discernible effects at all.Overall the research suggests that the quality of the carereceived and the number of hours spent in childcareboth affect the outcomes for children. Melhuish’s reviewfor the National Audit Office concluded that, for childrenwho are not disadvantaged in their home environment,use of high quality childcare in the first three years hasno strong effects upon cognitive and languagedevelopment. However disadvantaged children are likelyto benefit from high-quality provision in the first threeyears, with positive outcomes in language, cognitive andsocial development.21 Disadvantaged children benefitfrom high quality ECEC whether started in infancy or at alater age, and the greater the number of months attendedthe better the outcomes. High quality centre-based care
07
may facilitate in particular children’s languagedevelopment, but where ECEC quality is low, childrencan show lower language development than those notattending ECEC provision during the first three years.22
This demonstrates just how critical quality is in thedevelopment of ECEC.23 This has been recentlyconfirmed by the evaluation of the early education pilotsfor two-years-olds which concluded that the overall lackof a significant impact disguises the fact that childrenwho were in high quality provision showed significantimprovements in their vocabulary, as well asimprovements in parent-child interactions.24 The DCSFhas since refined the criteria for the free places for two-year-olds to require settings to be judged ‘good’ or‘outstanding’.
There is some suggestion from other sources that longhours in childcare provision from an early age can leadto slightly increased externalising behaviour (aggressionand disobedience) irrespective of quality.25 Melhuishconcluded in 2004 that long hours of group care amongnon-disadvantaged children aged under two mayincrease the risk of developing anti-social behaviour.Some studies define long as more than three days/20hours per week and others found negative effects onlyabove 35 hours of group care per week. Contrary tosome coverage in the press the studies show theincreased poor behaviours are very small and, unlike thepositive effects of high quality ECEC, may not last overthe years. Additionally in practice very few children inthe UK actually experience long hours in group care,especially under the age of two or even at age two.26
Furthermore, a recent UK study using Millennium CohortStudy data on childcare use and working mothersconcluded that group setting use by a nine-month-oldbaby is positively associated with school readinessscores at the age of three, and found no associationbetween that use and poor behavioural outcomes.27
Quality factors: process and structureMuch of the research on ECEC draws a distinctionbetween ‘structural’ and ‘process’ aspects. Melhuish’sreview of the literature on the impact of ECEC definedthese two aspects as:� Process dimensions – which are ‘the characteristics of
the child’s experience e.g. interactions with others,learning experiences, variety in stimulation,responsiveness in environment’.
� Structural dimensions – which focus on ‘aspects of
the environment that are fixed, e.g. accommodation,group size, adult-child ratio, training of staff, healthand safety, stability of staff, management structure’.
Structural aspects tend to be focused on areas wherelegislation of daycare quality exists, as these are easierto inspect and control.30 Process factors have beenexplored widely in other research,31 and are clearlyfundamental to delivering high quality ECEC. Researchevidence suggests that the quality of provision for theunder threes relies on affection, communication,responsiveness and continuity. The relationships childrenhave with both adults and other children – and the natureof the interactions between them – are crucial. Forchildren aged over three, the learning opportunities andeducation aspects of provision also become increasinglyimportant.32 EPPE showed that key quality indicatorsincluded warm interactive relationships with children, aswell as having a trained teacher as manager and a goodproportion of trained teachers on the staff.33
However, when looking at the financial implications ofhigh quality ECEC, process factors do not appear tohave a price tag attached to them which are separatefrom any structural issues. No stakeholder suggestedany additional costing associated with improving theprocess factors, apart from training costs. The failure toexplore the issues surrounding the ‘process’ aspects ofquality in the project is not due to a lack of appreciationof their fundamental importance, it is simply that – asthis project is chiefly concerned with how funding canbe used to improve the quality of early years provision –the overriding objective is to explore how financialinvestment could lead to an improved quality ofprovision, and it is the ‘structural’ aspects that directlyrequire additional funding. However it is likely that theimprovement brought about by structural factors will actthrough improving the process factors. As Melhuishobserved:
‘Structural factors seem to provide the necessaryconditions for process quality such as positivestaff/child interaction. They facilitate but do notguarantee good quality experiences for the child.’34
Quality factors and the stakeholderdiscussionsDaycare Trust undertook a number of stakeholderinterviews as part of the research (see Working Paper 1
Quality costs: paying for Early Childhood Education and Care08

for the organisations involved). All intervieweesidentified that the workforce was the main crucialaspect in determining quality, and that qualificationsand reflective practice needed to be improved. Amanagement approach based on understanding andpromoting quality through the whole organisation wasseen as critical.
When discussing the research that indicates that themaintained sector has higher quality provision, all theinterviewees indicated that it was important to drill downinto this finding to see what it is about the maintainedsector that brings quality. Interviewees suspected thatthe key to this is the workforce and their qualifications,training and status, although some mentioned betterpremises found in the maintained sector.
The Early Years Foundation Stage, and its bringingtogether of care and education, was welcomed andseen as a step forward.
Quality factors and the researchevidenceHere we summarise the structural factors associatedwith quality in the three main studies on ECEC that havebeen carried out in England over the past decade:� the EPPE study;� the NNI evaluation; and� the Millennium Cohort Study (MCS).
There are no studies which contradict these findings,and others add weight to the conclusions that these arethe structural factors which influence quality (forexample, Jane Waldfogel has identified that staff-childratios and education level of staff are key35). For furtherinformation, see Working Paper 1.36
SectorThe evidence from a number of studies suggests thatmaintained status is a strong predictor of quality. Forexample, EPPE found that, while good quality can befound across all types of early years settings, at the timethe study was conducted quality was found to be higheroverall in nursery schools and in settings with integratedcare and education.37 Both the NNI evaluation and theMCS found children’s centre status to have a positiveimpact on the quality of provision, with both showing itto be a stronger influence than sector on some issues,
whereas on others the impact may be because most arein the maintained sector.38
However it is not possible from those studies toascertain the additional expenditure which leads to theobserved higher quality. In the MCS some of the effectswere only apparent after staff qualifications wereremoved from the regression model, suggesting thatqualifications could be influencing the higher qualityobtained by the maintained sector.
Group size and size of centreThere are contradictory findings with these two factors.Although earlier studies has found smaller groupsproduced better outcomes,39 the MCS found that roomswith larger groups of children present were of the highestquality once other factors had been taken into account.Similarly, the MCS found that larger centres producedlower outcomes – although the NNI evaluation found theopposite.
Staff and manager qualifications andtrainingThere is much evidence to show that staff qualificationsand training are key indicators of quality. In a briefingpaper for Daycare Trust in 2004, Melhuish identified sixfactors related to staff characteristics that supportquality childcare:40
1. higher levels of staff education;2. in-service training;3. staff experienced in working with children;4. low staff turnover;5. adequate staff pay; and6. a trained centre manager to provide staff support and
supervision.
The EPPE study found that the most effective ECECprovision – ie that which produced better outcomes forchildren and had higher quality scores – had highlyqualified staff (mostly graduate teachers).41 The MCSreport also found staff qualifications – including those ofthe manager – to be a strong predictor of quality, whichhad a strong impact on children’s academic progress,developing language and interactions.42 The NNIevaluation also highlighted the importance of a well-qualified workforce – including access to a trainedteacher – for the provision of high quality caregiving andfor child outcomes.
09
Stability of staff groupA low turnover of staff contributes to high quality. Theimportance of consistency of care has been highlightedby a number of commentators.43 Melhuish, summarisingresearch on investing in quality childcare, said:
‘This issue of staff retention is critical to the quality ofchildcare. Indeed, without low staff turnover consistentlygood quality childcare becomes impossible.’44
PayThere is little research directly exploring the relationshipbetween staff pay and the quality of ECEC. The exceptionis a study conducted in the USA by Deborah Phillips et alwhich explored a range of quality indicators in centre-based childcare in 104 centres in Massachusetts, Virginiaand Georgia.45 The study found that the quality ofprovision was more strongly associated with the wagesof staff, and particularly the highest wage paid to full-timeteachers, than any other structural dimension of care.What is less understood is why staff wages play such astrong role in the quality of provision. It could bespeculated that higher staff wages first increases the poolof candidates for jobs and then staff retention,contributing to the stability of care for children andhelping to drive up quality. Qualitative work with childcarepractitioners concluded that the perpetuation of low payundermines efforts to raise the quality of the ECECworkforce and the services it provides.46
RatiosThe research evidence suggests that higher staff-childratios (fewer children per member of staff) are associatedwith better quality care and consequently better outcomesfor children.47 However, the interdependency of ratios withother quality indicators means that ratios should not betreated in isolation. For example, the lower ratios found innursery schools and classes do not necessarily result inpoorer quality, as the impact of sector type and staffqualifications tend to result in higher quality ECEC.48
International evidence reviewed by Mooney et al for theDepartment for Education and Skills in 2003 cited theexample of ECEC in France where poorer ratios wereoffset by staff qualifications and training, as well as warmstaff/child interaction.49 More staff per child can improvethe nature of interactions, but again this is not the onlyfactor in determining adult-child relationships. Anotherinternational review of the international evidence also
included staff salaries as one of the elements to which theimpact of ratios was ‘inextricably linked’.50 It arguedstrongly that making ratios dependent on staffqualifications and group size could provide a real incentiveto drive up the quality of care, because providers could bemore easily persuaded to employ better skilled staff ifthose staff could in turn care for more children.
Age rangeBoth the NNI evaluation and the MCS found that theoverall quality of provision is higher where older childrenwere cared for alongside younger children. The NNIevaluation, which particularly focused on provision forchildren aged under three and a half, found that mixed-age rooms produced better cognitive outcomes butslightly worse behavioural outcomes. It found thatyounger children in a mixed-age room benefitededucationally from the presence of older children asthey experienced educational activities and higher levelcommunication intended for the older children.However, there was a weak but significant effect onyounger children’s worried and upset behaviour (usingthe Adaptive Social Behaviour Index (ASBI) item 4 forexample: frowning or stamping their feet).
PremisesAll reviews included premises as one of the structuralaspects of quality – for example Melhuish included ‘safeand appropriate physical space’ alongside the six staffingfactors above. Furthermore, it is widely accepted in thesector that outdoor play is an important element of theexperience of children; although outdoor space is not arequirement in the EYFS.51 However there is no researchliterature that we can be drawn on to help in the task ofdirectly relating premises to the outcomes of children.
Interaction of these factorsAs mentioned earlier, the researchers have pointed outthat there is a complex interdependency betweenfactors such as staff qualifications, ratios and the qualityand type of provision, which suggests that it could bemore useful to consider the impacts of packages ofprovision rather than trying to identify the impact of aspecific factor.52 This confirmed earlier conclusions thatthe three factors of staff qualifications and training;group size; and staff-child ratios work together, ratherthan operate independently, to have a positive influenceon children’s outcomes.53
Quality costs: paying for Early Childhood Education and Care010
Daycare Trust’s high quality modelBased on the strong evidence reviewed above, DaycareTrust developed a ‘model’ of high quality ECEC.
Staff qualification levelsThere is strong research evidence showing theparamount importance of staff qualifications on thequality of childcare, which is supported by allstakeholders. It is clear that the ECEC profession needsnot only to be graduate-led but to include a significantproportion of graduates working with children. However itcould not be deciphered from the research evidenceexactly what proportion of staff needs to be graduates inorder to ensure high quality.
Two models were put forward to be costed for each agegroup:
2+ year oldsModel 1: 50% graduates, 50% Level 3 qualifiedModel 2: 33% graduates, 67% Level 3 qualified0–1 year oldsModel 1: 33% graduates, 67% Level 3 qualifiedModel 2: one graduate room leader, remaining staffhave Level 3 qualification
This reflects the substantial evidence showing thecentrality of staff qualifications in supporting quality ECECprovision, but also the interaction between qualificationand ratios. The greater number of staff required to workwith children under the age of two led to the proposal ofa slightly lower percentage of graduates.
ManagersGiven the demonstrated importance of leadership, it issuggested that all managers should be graduates andpaid accordingly.
Staff payThe model needs to adjust pay accordingly to reflect thehigher qualifications and to ensure staff can be recruitedand retained.
The Organisation for Economic Co-Operation andDevelopment has highlighted the low pay levels ofchildcare staff across different countries.54 ECEC staffacross the UK are paid at levels much below the nationalaverage and also below other professionals in thechildren’s sector. It is also striking that the staff in state-led settings (mainly full daycare in children’s centres,
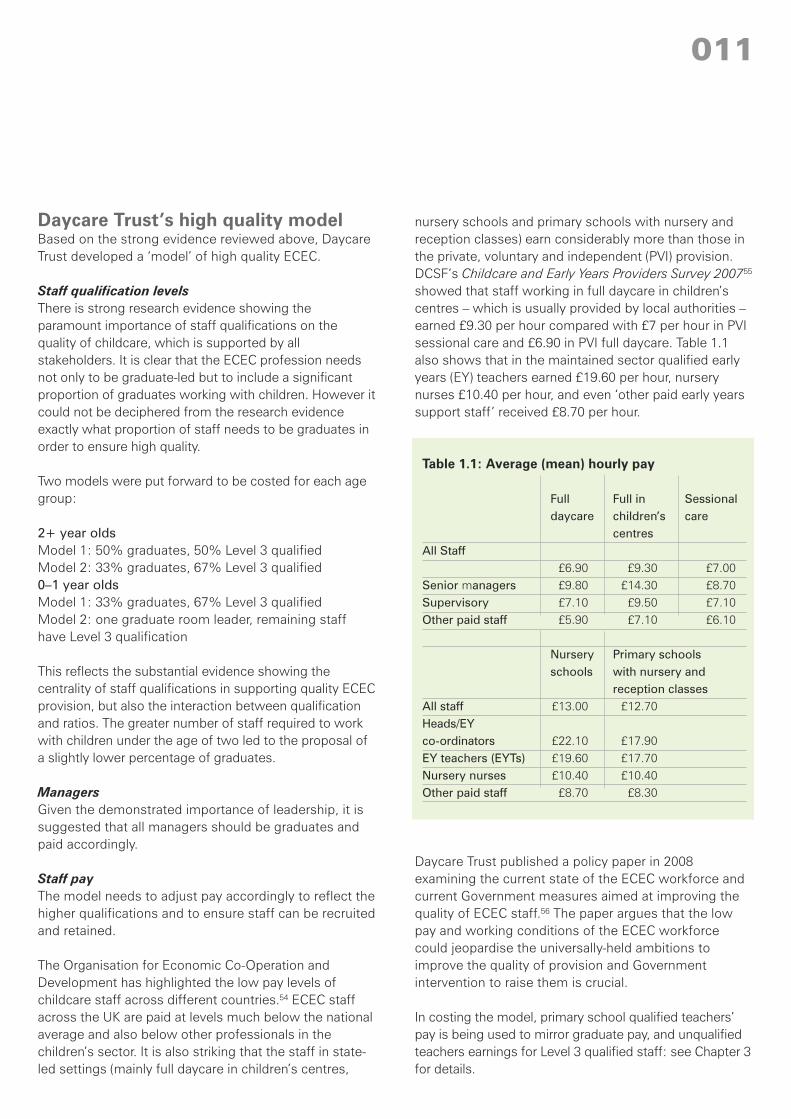
nursery schools and primary schools with nursery andreception classes) earn considerably more than those inthe private, voluntary and independent (PVI) provision.DCSF’s Childcare and Early Years Providers Survey 200755
showed that staff working in full daycare in children’scentres – which is usually provided by local authorities –earned £9.30 per hour compared with £7 per hour in PVIsessional care and £6.90 in PVI full daycare. Table 1.1also shows that in the maintained sector qualified earlyyears (EY) teachers earned £19.60 per hour, nurserynurses £10.40 per hour, and even ‘other paid early yearssupport staff’ received £8.70 per hour.
Table 1.1: Average (mean) hourly pay
Full Full in Sessionaldaycare children’s care
centresAll Staff
£6.90 £9.30 £7.00Senior managers £9.80 £14.30 £8.70Supervisory £7.10 £9.50 £7.10Other paid staff £5.90 £7.10 £6.10
Nursery Primary schoolsschools with nursery and
reception classesAll staff £13.00 £12.70Heads/EYco-ordinators £22.10 £17.90EY teachers (EYTs) £19.60 £17.70Nursery nurses £10.40 £10.40Other paid staff £8.70 £8.30
Daycare Trust published a policy paper in 2008examining the current state of the ECEC workforce andcurrent Government measures aimed at improving thequality of ECEC staff.56 The paper argues that the lowpay and working conditions of the ECEC workforcecould jeopardise the universally-held ambitions toimprove the quality of provision and Governmentintervention to raise them is crucial.
In costing the model, primary school qualified teachers’pay is being used to mirror graduate pay, and unqualifiedteachers earnings for Level 3 qualified staff: see Chapter 3for details.
011
Adult-child ratiosIt has already been seen that adult-child ratios are a keyfactor in ensuring quality, as well as being related tostaff qualifications, training, and group size. Theresearch – both from this country and others – does notlend itself to determining ideal ratios.
The current legal ratio for children and staff is laid out inthe Statutory Framework for the EYFS and covers allECEC providers. In group settings, for children agedunder two the minimum ratio is 1:3 (ie one staff memberfor every three children); and for two-year-olds it is 1:4.For children aged between three and seven it is 1:8, butwhere a member of staff holds Qualified Teacher Status,Early Years Professional Status or another relevant Level6 qualification the ratio is 1:13.57 The ratios are astatutory minimum requirement and some providers doexceed them.
It was expected that some stakeholders would voice adesire to increase the current minimum ratios in the highquality model, particularly given the unease from somequarters when the ratio was increased to 1:13 for four-year-olds with Level 6 qualified staff. However this wasnot the case. One manager of a small chain of full-timenurseries did feel strongly that the 1:13 ratio was notadequate and she was not intending to implement itwhen her staff became qualified; furthermore she hadmade the decision to reduce to 1:6 the ratio in one of hersettings which served a disadvantaged area, as she haslearnt that those children required more adult interactionthan the children in more affluent areas. This perhapsconfirms the EPPE finding that socially mixed settingstend to be of higher quality; but it is not a factor that canbe built into the standard model. On the other hand,stakeholders from nursery schools revealed that their1:13 ratios did not detract from their quality, a view whichis corroborated by the research evidence. It is thereforeconcluded from the available evidence that as long asstaff qualifications and pay are increased, the currentadult-child ratios set out in EYFS welfare requirements aresufficient to ensure high quality provision.
It is however worth noting the large difference betweentwo-year-olds with a 1:4 ratio and three-year-olds with a1:13 ratio; this is possibly too great a reduction in adultattention on reaching the third birthday. It is suggestedthat further work should be done to explore whetherthree-year-olds remain at the 1:8 ratio even once staffare qualified to Level 6.
PremisesFrom the literature it was not possible to provide anydefinitive conclusion on what premises costs would bein the high quality model. Therefore, Social MarketFoundation were asked to consider two extremes – thelow version with premises costs remaining at currentlevels and the other version with premises costsincreasing at the same rate as staff costs.
ConclusionStakeholder interviews and roundtable confirmed theconclusion in earlier literature reviews58 that there is noagreed understanding or definition of quality in ECECprovision. Moreover, it is not possible to come to onegiven that it is a very subjective issue. It varies with thesubject’s perceived objectives for the provision, theinfluence of cultural values, and – where consideration isbeing given to future outcomes for children – whichoutcomes are being prioritised.
Despite this, it is clear that a distinction can be drawnbetween ‘structural’ and ‘process’ aspects of quality:� Process dimensions are ‘the characteristics of the
child’s experience e.g. interactions with others,learning experiences, variety in stimulation,responsiveness in environment’.
� Structural dimensions focus on ‘aspects of theenvironment that are fixed, e.g. accommodation,group size, adult-child ratio, training of staff, healthand safety, stability of staff, management structure’.59
The research evidence shows which of these elementshas a demonstrable effect on the outcomes for children,and the extent to which they do so. It is clear from thisliterature review and confirmed by the project’sstakeholders that a significant increase in staffqualifications and pay is required if high quality ECECprovision is to be achieved in the UK. This is not to saythat a better qualified, rewarded and managed staff initself can form a guarantee that every child experienceshigh quality ECEC, but it should reduce staff turnoverand will lay the foundations in which the process factorscan flourish. Furthermore, neither current adult-childratio nor centre sizes would prevent high qualityprovision in these circumstances. Daycare Trust hastherefore costed two models of increased staffqualifications and pay, one more stretching than theother and with a range of costings to provideimprovement to premises.
012 Quality costs: paying for Early Childhood Education and Care

013
Following the establishment of the two variants of theDaycare Trust high quality model the next stage in theQuality costs project was to identify the costsassociated with the models, and to determine how theydiffer from the current reality.
Working Paper 2: What is the cost of quality? containsfull details of the methodology and costcalculationsundertaken by the Social Market Foundation for thiselement of the project. The working paper containscalculations for five different providers of earlychildhood education and care (ECEC): full daycare; fulldaycare in children’s centres; sessional care; nurseryschools; and nursery classes in primary schools. Inorder to summarise the methodology for this report, theintermediate tables present only the calculations for fulldaycare, but the tables giving the current wages costsand those showing the final cost figures are given for allfive types of provider.
The high quality model: cost factorsThe high quality model includes the following cost factors:
Staff qualificationsThe two models outlined in Chapter 2 provide the staffqualifications required:
For children aged 2 and over:Model 1: 50% of staff are graduates (Level 6 qualified)and 50% of staff are Level 3 qualified.Model 2: 33% of staff are graduates and 67% of staffare Level 3 qualified.
For children aged under 2:Model 1: 33% of staff are graduates, 67% are Level 3qualified.Model 2: One graduate room leader, with the remainingstaff Level 3 qualified.
Staff-child ratiosThe staff-child ratios used in the high quality model reflectthose currently required in the Early Years FoundationStage, as they were considered to be appropriate and fitfor purpose. The ratio for under twos is 1:3; decreasing to1:4 for two-year-olds. For children aged three and over,
the default ratio is 1:8, although if an ECEC setting has asuitable graduate working directly with the children, it ispermissible to operate with a ratio of 1:13. The latterreflects the situation in nursery classes, where there is aratio requirement of 2:26 (1:13) if one adult is a qualifiedteacher and one a qualified nursery assistant.
Staff payAs outlined in the previous chapter, good pay andconditions are essential for staff recruitment andretention, especially if there is an aspiration to see ECECstaff working at higher qualification levels. Therefore inthe high quality model, ECEC staff pay and conditionswere related to staff in primary schools, with graduates(Level 6) earning the equivalent of teachers’ pay(between £20,627 and £30,148). Level 3 qualified staffwould earn the equivalent of unqualified teachers(between £15,113 and £23,903). For costing purposesmid-point values were used: £25,388 and £19,508.Employer’s pension and National Insurance (NI)contributions were added to staff pay, at 14.1 per centand 9.1 per cent respectively. Therefore the hourly wage(based on 1,265 working hours per year, as in SchoolTeachers Pay and Conditions) plus employers’ pensionand NI contributions is £24.47 for Level 6 qualified staff,and £18.74 for those qualified to Level 3.
The senior manager wage is based on desk researchinto current levels of pay in full daycare settings and inschools, and is based on an hourly rate of £27.01 withemployer’s pension and NI contributions added. Thisequates to £47,000 based on 252 working days a year,or £28,000 for 1,265 working hours in order to compareto the figure for teachers above.
For staff pay in London, a weighting is applied, in linewith the standard weightings to teachers’ pay scales.Thus, the hourly wage (including pension and NIcontributions) in London is £28.17 (Level 6) or £21.89(Level 3). The London Senior Manager hourly rate(including pension and NI contributions) is £31.26.
Other costsIn addition to staff costs, there are other costs to take intoaccount, such as premises costs, expenditure on
3. What is the cost of quality?
014 Quality costs: paying for Early Childhood Education and Care
insurance, food, materials, etc. A number of reports – aswell as interviews with providers, local authorities androundtable discussions undertaken for this project –suggest that staff costs currently on average represent 70to 80 per cent of total costs. This varies considerably fromsetting to setting, depending on the region they are in andwhether they have their own specific premises or are, forexample, a sessional setting making use of a church hallor other community premises. For the cost-calculation,staff costs are set at 75 per cent of total costs, leaving allother costs (including premises) at 25 per cent of totalcosts. Therefore modelling the current costs, other costsare assumed to be 33 per cent of staff costs.
A further issue arises when working out the ‘other’ costsin the high quality model. Premises are a structuralquality factor and in many settings need to be improved;therefore to allow no increase at all ignores anyimprovements to premises and other factors whichrequire cost. On the other hand, to allow those aspectsto increase at the same rate as staff costs would imply apotential continuous increase in other costs as thequalifications of staff improve, and would not benecessary in many settings; indeed some argue that thisrelationship is implausible as a general rule. It is notjustifiable to come up with a figure or a formula forpremises which can represent the cost of a high qualitypremises in all parts of the country. Therefore the costingof the high quality model was carried out in two ways:1. With the other costs at 33% of the high quality staff
costs.2. With the other costs at 33% of the current staff costs
– referred to as ‘capped’. The capped option thereforeincludes only the increase in staff costs and maintainsa static value for other costs.
The cost of the high quality model is presented as a range,which allows for differences in premises, in terms of bothvariation in costs and their needs for improvement. Inmost cases the other costs required for the high qualitymodel are likely to fall somewhere between these twolevels, allowing for some improvement (and thereforeincreased costs) in other costs as well as premises.
EfficiencyIt is also important to take staff ‘efficiency’ into account,ie the amount of time that staff actually spend withchildren, rather than time spent on other activities such asplanning, team meetings, consultation with parents,
writing reports, lunch breaks, staff sickness etc. This doesnot imply that staff work ‘inefficiently’, merely that theycannot spend all their time directly with children. In thecost calculation, after discussion with stakeholders, staffefficiency is set at 85 per cent for sessional provision,nursery schools and nursery classes. For full daycare andfull daycare in children’s centres, efficiency levels are setslightly lower – at 80 per cent – to reflect both that theydo not necessarily have set sessions and that parents aregiven more flexibility in the hours they use (soconsequently it is harder to fill every hour of every place).
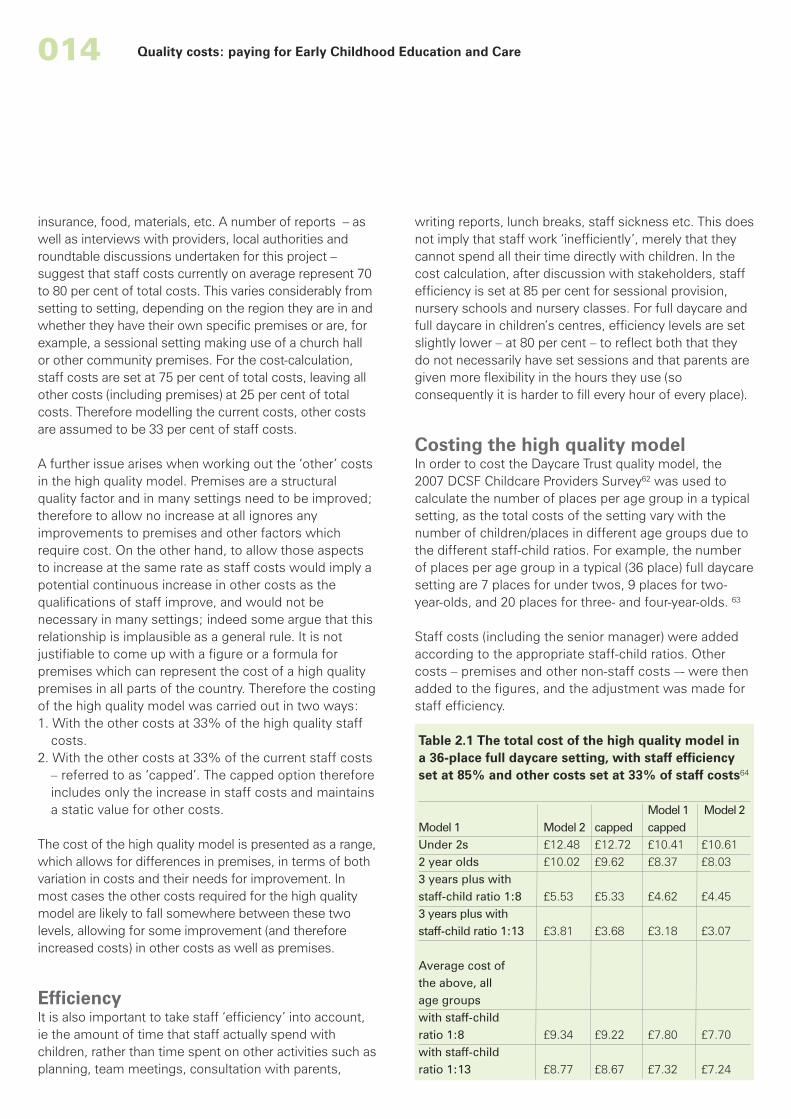
Costing the high quality modelIn order to cost the Daycare Trust quality model, the2007 DCSF Childcare Providers Survey62 was used tocalculate the number of places per age group in a typicalsetting, as the total costs of the setting vary with thenumber of children/places in different age groups due tothe different staff-child ratios. For example, the numberof places per age group in a typical (36 place) full daycaresetting are 7 places for under twos, 9 places for two-year-olds, and 20 places for three- and four-year-olds. 63
Staff costs (including the senior manager) were addedaccording to the appropriate staff-child ratios. Othercosts – premises and other non-staff costs –- were thenadded to the figures, and the adjustment was made forstaff efficiency.
Table 2.1 The total cost of the high quality model ina 36-place full daycare setting, with staff efficiencyset at 85% and other costs set at 33% of staff costs64
Model 1 Model 2Model 1 Model 2 capped cappedUnder 2s £12.48 £12.72 £10.41 £10.612 year olds £10.02 £9.62 £8.37 £8.033 years plus withstaff-child ratio 1:8 £5.53 £5.33 £4.62 £4.453 years plus withstaff-child ratio 1:13 £3.81 £3.68 £3.18 £3.07
Average cost ofthe above, allage groupswith staff-childratio 1:8 £9.34 £9.22 £7.80 £7.70with staff-childratio 1:13 £8.77 £8.67 £7.32 £7.24
015
The cost averaged over each of these age groups isincluded because settings often use their chargingstructure to cross-subsidise, ie their fees do not reflectthe full extent of the additional costs of caring for babiesand toddlers. This means that the lower cost of caringfor three- and four-year-olds offsets the costs foryounger children, where the ratios and therefore costsare higher. Working Paper 2 reports these averages forall types of other settings, but they are not taken intoaccount in this report as the charging regime should notmask the real costs to this extent.
As mentioned earlier in this chapter, costs in Londonneed to be adjusted to take into account the higherwage and premises costs. Therefore, when calculatingthe funding requirements for London in Chapter 6, 20per cent is added to the costs presented in this chapter.
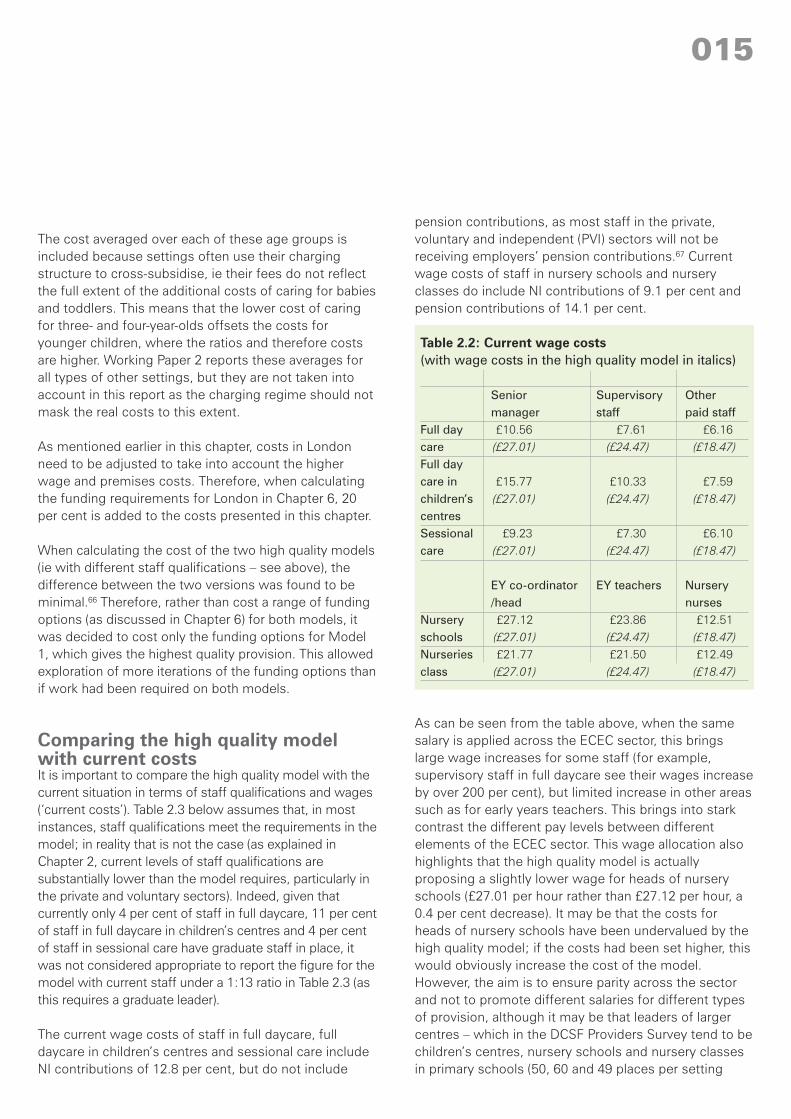
When calculating the cost of the two high quality models(ie with different staff qualifications – see above), thedifference between the two versions was found to beminimal.66 Therefore, rather than cost a range of fundingoptions (as discussed in Chapter 6) for both models, itwas decided to cost only the funding options for Model1, which gives the highest quality provision. This allowedexploration of more iterations of the funding options thanif work had been required on both models.
Comparing the high quality modelwith current costsIt is important to compare the high quality model with thecurrent situation in terms of staff qualifications and wages(‘current costs’). Table 2.3 below assumes that, in mostinstances, staff qualifications meet the requirements in themodel; in reality that is not the case (as explained inChapter 2, current levels of staff qualifications aresubstantially lower than the model requires, particularly inthe private and voluntary sectors). Indeed, given thatcurrently only 4 per cent of staff in full daycare, 11 per centof staff in full daycare in children’s centres and 4 per centof staff in sessional care have graduate staff in place, itwas not considered appropriate to report the figure for themodel with current staff under a 1:13 ratio in Table 2.3 (asthis requires a graduate leader).
The current wage costs of staff in full daycare, fulldaycare in children’s centres and sessional care includeNI contributions of 12.8 per cent, but do not include
pension contributions, as most staff in the private,voluntary and independent (PVI) sectors will not bereceiving employers’ pension contributions.67 Currentwage costs of staff in nursery schools and nurseryclasses do include NI contributions of 9.1 per cent andpension contributions of 14.1 per cent.
Table 2.2: Current wage costs(with wage costs in the high quality model in italics)
Senior Supervisory Othermanager staff paid staff
Full day £10.56 £7.61 £6.16care (£27.01) (£24.47) (£18.47)Full daycare in £15.77 £10.33 £7.59children’s (£27.01) (£24.47) (£18.47)centresSessional £9.23 £7.30 £6.10care (£27.01) (£24.47) (£18.47)
EY co-ordinator EY teachers Nursery/head nurses
Nursery £27.12 £23.86 £12.51schools (£27.01) (£24.47) (£18.47)Nurseries £21.77 £21.50 £12.49class (£27.01) (£24.47) (£18.47)
As can be seen from the table above, when the samesalary is applied across the ECEC sector, this bringslarge wage increases for some staff (for example,supervisory staff in full daycare see their wages increaseby over 200 per cent), but limited increase in other areassuch as for early years teachers. This brings into starkcontrast the different pay levels between differentelements of the ECEC sector. This wage allocation alsohighlights that the high quality model is actuallyproposing a slightly lower wage for heads of nurseryschools (£27.01 per hour rather than £27.12 per hour, a0.4 per cent decrease). It may be that the costs forheads of nursery schools have been undervalued by thehigh quality model; if the costs had been set higher, thiswould obviously increase the cost of the model.However, the aim is to ensure parity across the sectorand not to promote different salaries for different typesof provision, although it may be that leaders of largercentres – which in the DCSF Providers Survey tend to bechildren’s centres, nursery schools and nursery classesin primary schools (50, 60 and 49 places per setting
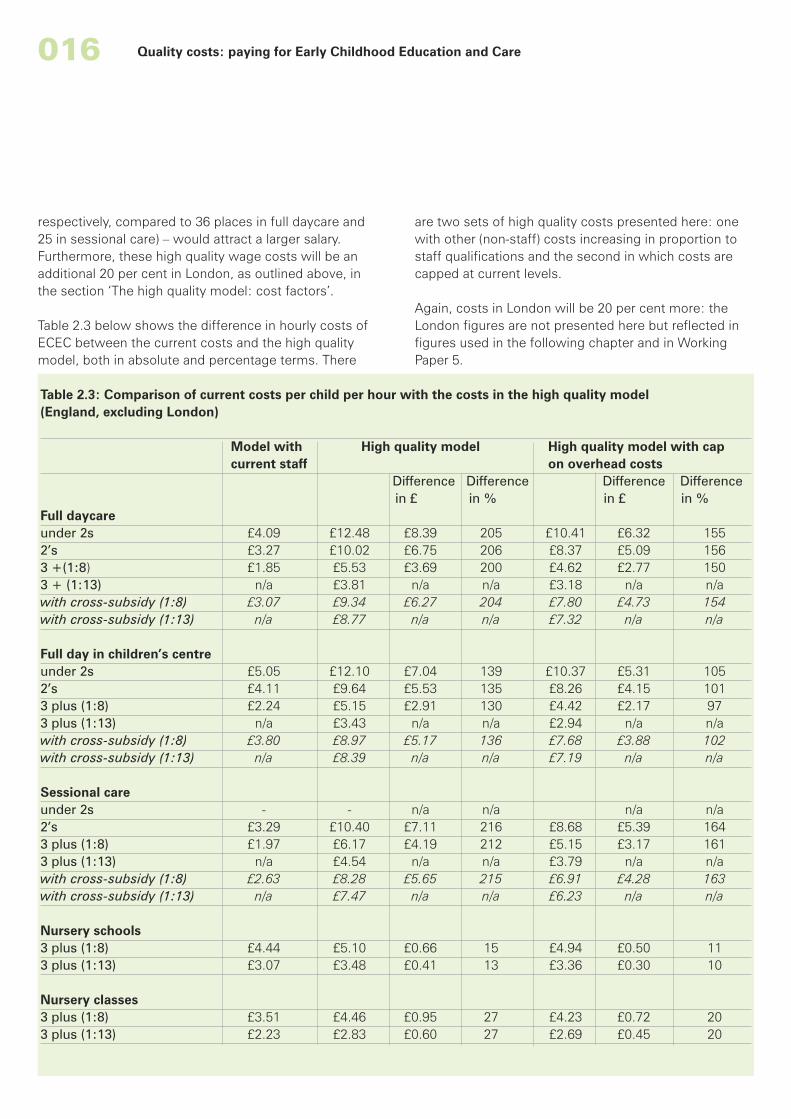
Table 2.3: Comparison of current costs per child per hour with the costs in the high quality model(England, excluding London)
Model with High quality model High quality model with capcurrent staff on overhead costs
Difference Difference Difference Differencein £ in % in £ in %
Full daycareunder 2s £4.09 £12.48 £8.39 205 £10.41 £6.32 1552’s £3.27 £10.02 £6.75 206 £8.37 £5.09 1563 +(1:8) £1.85 £5.53 £3.69 200 £4.62 £2.77 1503 + (1:13) n/a £3.81 n/a n/a £3.18 n/a n/awith cross-subsidy (1:8) £3.07 £9.34 £6.27 204 £7.80 £4.73 154with cross-subsidy (1:13) n/a £8.77 n/a n/a £7.32 n/a n/a
Full day in children’s centreunder 2s £5.05 £12.10 £7.04 139 £10.37 £5.31 1052’s £4.11 £9.64 £5.53 135 £8.26 £4.15 1013 plus (1:8) £2.24 £5.15 £2.91 130 £4.42 £2.17 973 plus (1:13) n/a £3.43 n/a n/a £2.94 n/a n/awith cross-subsidy (1:8) £3.80 £8.97 £5.17 136 £7.68 £3.88 102with cross-subsidy (1:13) n/a £8.39 n/a n/a £7.19 n/a n/a
Sessional careunder 2s - - n/a n/a n/a n/a2’s £3.29 £10.40 £7.11 216 £8.68 £5.39 1643 plus (1:8) £1.97 £6.17 £4.19 212 £5.15 £3.17 1613 plus (1:13) n/a £4.54 n/a n/a £3.79 n/a n/awith cross-subsidy (1:8) £2.63 £8.28 £5.65 215 £6.91 £4.28 163with cross-subsidy (1:13) n/a £7.47 n/a n/a £6.23 n/a n/a
Nursery schools3 plus (1:8) £4.44 £5.10 £0.66 15 £4.94 £0.50 113 plus (1:13) £3.07 £3.48 £0.41 13 £3.36 £0.30 10
Nursery classes3 plus (1:8) £3.51 £4.46 £0.95 27 £4.23 £0.72 203 plus (1:13) £2.23 £2.83 £0.60 27 £2.69 £0.45 20
Quality costs: paying for Early Childhood Education and Care016
respectively, compared to 36 places in full daycare and25 in sessional care) – would attract a larger salary.Furthermore, these high quality wage costs will be anadditional 20 per cent in London, as outlined above, inthe section ‘The high quality model: cost factors’.
Table 2.3 below shows the difference in hourly costs ofECEC between the current costs and the high qualitymodel, both in absolute and percentage terms. There
are two sets of high quality costs presented here: onewith other (non-staff) costs increasing in proportion tostaff qualifications and the second in which costs arecapped at current levels.
Again, costs in London will be 20 per cent more: theLondon figures are not presented here but reflected infigures used in the following chapter and in WorkingPaper 5.
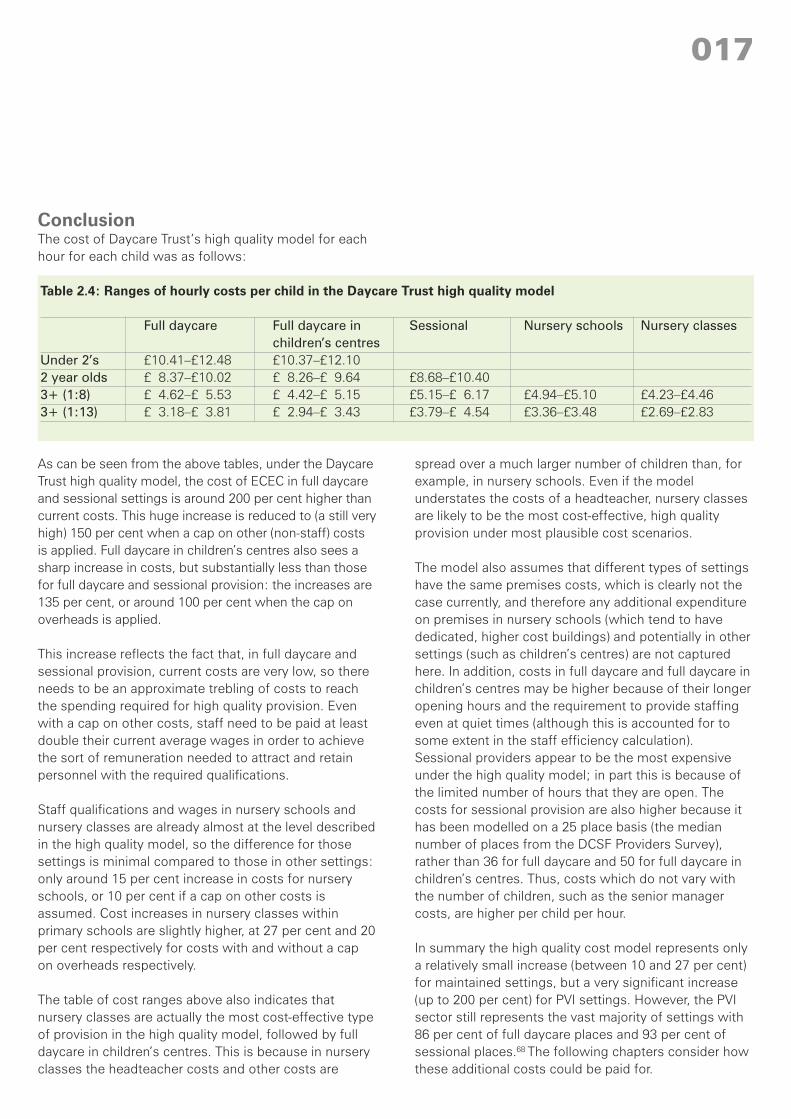
ConclusionThe cost of Daycare Trust’s high quality model for eachhour for each child was as follows:
As can be seen from the above tables, under the DaycareTrust high quality model, the cost of ECEC in full daycareand sessional settings is around 200 per cent higher thancurrent costs. This huge increase is reduced to (a still veryhigh) 150 per cent when a cap on other (non-staff) costsis applied. Full daycare in children’s centres also sees asharp increase in costs, but substantially less than thosefor full daycare and sessional provision: the increases are135 per cent, or around 100 per cent when the cap onoverheads is applied.
This increase reflects the fact that, in full daycare andsessional provision, current costs are very low, so thereneeds to be an approximate trebling of costs to reachthe spending required for high quality provision. Evenwith a cap on other costs, staff need to be paid at leastdouble their current average wages in order to achievethe sort of remuneration needed to attract and retainpersonnel with the required qualifications.
Staff qualifications and wages in nursery schools andnursery classes are already almost at the level describedin the high quality model, so the difference for thosesettings is minimal compared to those in other settings:only around 15 per cent increase in costs for nurseryschools, or 10 per cent if a cap on other costs isassumed. Cost increases in nursery classes withinprimary schools are slightly higher, at 27 per cent and 20per cent respectively for costs with and without a capon overheads respectively.
The table of cost ranges above also indicates thatnursery classes are actually the most cost-effective typeof provision in the high quality model, followed by fulldaycare in children’s centres. This is because in nurseryclasses the headteacher costs and other costs are
spread over a much larger number of children than, forexample, in nursery schools. Even if the modelunderstates the costs of a headteacher, nursery classesare likely to be the most cost-effective, high qualityprovision under most plausible cost scenarios.
The model also assumes that different types of settingshave the same premises costs, which is clearly not thecase currently, and therefore any additional expenditureon premises in nursery schools (which tend to havededicated, higher cost buildings) and potentially in othersettings (such as children’s centres) are not capturedhere. In addition, costs in full daycare and full daycare inchildren’s centres may be higher because of their longeropening hours and the requirement to provide staffingeven at quiet times (although this is accounted for tosome extent in the staff efficiency calculation).Sessional providers appear to be the most expensiveunder the high quality model; in part this is because ofthe limited number of hours that they are open. Thecosts for sessional provision are also higher because ithas been modelled on a 25 place basis (the mediannumber of places from the DCSF Providers Survey),rather than 36 for full daycare and 50 for full daycare inchildren’s centres. Thus, costs which do not vary withthe number of children, such as the senior managercosts, are higher per child per hour.
In summary the high quality cost model represents onlya relatively small increase (between 10 and 27 per cent)for maintained settings, but a very significant increase(up to 200 per cent) for PVI settings. However, the PVIsector still represents the vast majority of settings with86 per cent of full daycare places and 93 per cent ofsessional places.68 The following chapters consider howthese additional costs could be paid for.
Table 2.4: Ranges of hourly costs per child in the Daycare Trust high quality model
Full daycare Full daycare in Sessional Nursery schools Nursery classeschildren’s centres
Under 2’s £10.41–£12.48 £10.37–£12.102 year olds £ 8.37–£10.02 £ 8.26–£ 9.64 £8.68–£10.403+ (1:8) £ 4.62–£ 5.53 £ 4.42–£ 5.15 £5.15–£ 6.17 £4.94–£5.10 £4.23–£4.463+ (1:13) £ 3.18–£ 3.81 £ 2.94–£ 3.43 £3.79–£ 4.54 £3.36–£3.48 £2.69–£2.83
017
Before going on to consider the impact of the highercosts of Daycare Trust’s high quality model for earlychildhood education and care (ECEC) – especially in theprivate, voluntary and independent (PVI) sectors (whichmake up 87 per cent of full daycare settings and 93 percent of sessional settings69) – it is important that theamounts currently paid by both parents and theGovernment are established.
Working Paper 3, What do parents pay? compares thecurrent data on what parents pay and examines whatcan be learned about the prices that parents pay and thefees that providers charge. (These are generally not thesame amounts as most parents receive some kind ofsubsidy or help with costs, which will be exploredfurther below and in Chapter 5.)
Defining and identifying costs for earlychildhood education and careThere are a number of surveys that seek to documentthe cost of ECEC: both the price that parents pay andthe fees that ECEC providers charge. There are also anumber of difficulties in surveying and comparing thesecosts, namely:� the different definitions of ECEC used in different
surveys;� the nature of ‘costs’ and the pricing structures across
the sector; and� the complicated system of financial subsidy that
parents may be eligible for.
We use the following terms to define childcare costs:Cost is the amount that childcare providers need tospend in order to provide their service. This will includestaff wages, premises, and other resources, such asfood, activities, insurance.
Spend is the amount spent by parents on childcare.
Fees are the amounts that ECEC providers charge toparents – this will include any discounts (for example,for siblings) and could be higher than ‘cost’ if it includesan element of profit. The amount for fees will not reflectany subsidies that parents are receiving themselvesthrough the Working Tax Credit (WTC) or employer-
supported childcare. It could also be lower than ‘cost’price if supply-side subsidies are obtained fromgovernment, charitable donations or profit from otherservices.
With regard to fees, pricing structures vary, as, forexample, many full daycare providers only offer fixedlength sessions whereas others might have moreflexible pricing policies; and sessional care providersnormally offer a fixed-price session, but the length mayvary between 2.5 and 3.5 hours. There may be differentfees depending on the number of hours of childcareused, siblings involved, time of day, meals included andparents’ income. Due to child-staff ratio requirementsand statutory restrictions on factors such as floor space,most settings’ fees are slightly more expensive foryounger children. However, in general the fees structuredoes not fully reflect the cost structure, with the resultthat there is cross-subsidisation across age ranges toease the high cost of ECEC for younger children (undertwos and two-year-olds). Evidence of this is seen in thecost calculations of both current costs and the highquality model.
ECEC spend by parents is also difficult to ascertainbecause of the complicated system of financial subsidythat parents may be eligible for, through employer-supported childcare and the childcare element of WTC.Some children also receive free places, depending ontheir age. It is often difficult for parents to work out andreport what proportion of their childcare fees is coveredby the different subsidies. The Department for Children,Schools and Families (DSCF) Parents Survey seriescomments on the difficulties in surveying parents’spend on childcare. The researchers found that parentsare confident in discussing the amount they spend onchildcare from their own pockets, but less sure ofsubsidies provided by others, for example an employer,ex-partner or the local authority. Indeed, the 2008 surveyfound substantial under-reporting of childcare costs,where parents did not pay for childcare out of their ownpocket but were unaware of which otherorganisations/individuals had contributed to childcarecosts.
Quality costs: paying for Early Childhood Education and Care018
4. What parents currently pay
Surveys of the cost of early childhoodeducation and careThe different surveys of the cost of ECEC which havebeen explored as part of the Quality costs project are70:� Daycare Trust Childcare Cost Survey71.� DCSF’s Childcare and Early Years Survey of Parents72.� DCSF’s Childcare and Early Years Providers Survey73:
This report also includes comparisons based on levelof deprivation, with slightly lower costs in moredeprived areas; and by qualification of seniormanager, with settings employing Level 6-qualifiedsenior managers generally charging more (althoughnot in children’s centres).
� Department for Work and Pensions (DWP) Familiesand Children Study (FACS) FN674: Analysis of the 2005FACS data for Daycare Trust/NatCen’s Childcare nation
report shows that on average families spent 11 percent of their income on childcare, with lone parentsand families on lower incomes spending a higherproportion (16 per cent for lone parents and 20 percent for families in the lowest income group)75.
� HMRC Child and Working Tax Credit Statistics:76
Figures from April 2009 indicate that there were470,000 families benefiting from the childcare elementof WTC, with the average award for help with childcarecosts standing at £68.69. This reflects an averagespend of £94.12 per week that people are claiming for.(There is no detail on how many hours childcare thispays for, so it is not possible ascertain an hourly rate.)
� DWP Family Resources Survey.77
� Laing and Buisson’s Children’s Nurseries UK MarketReport.78
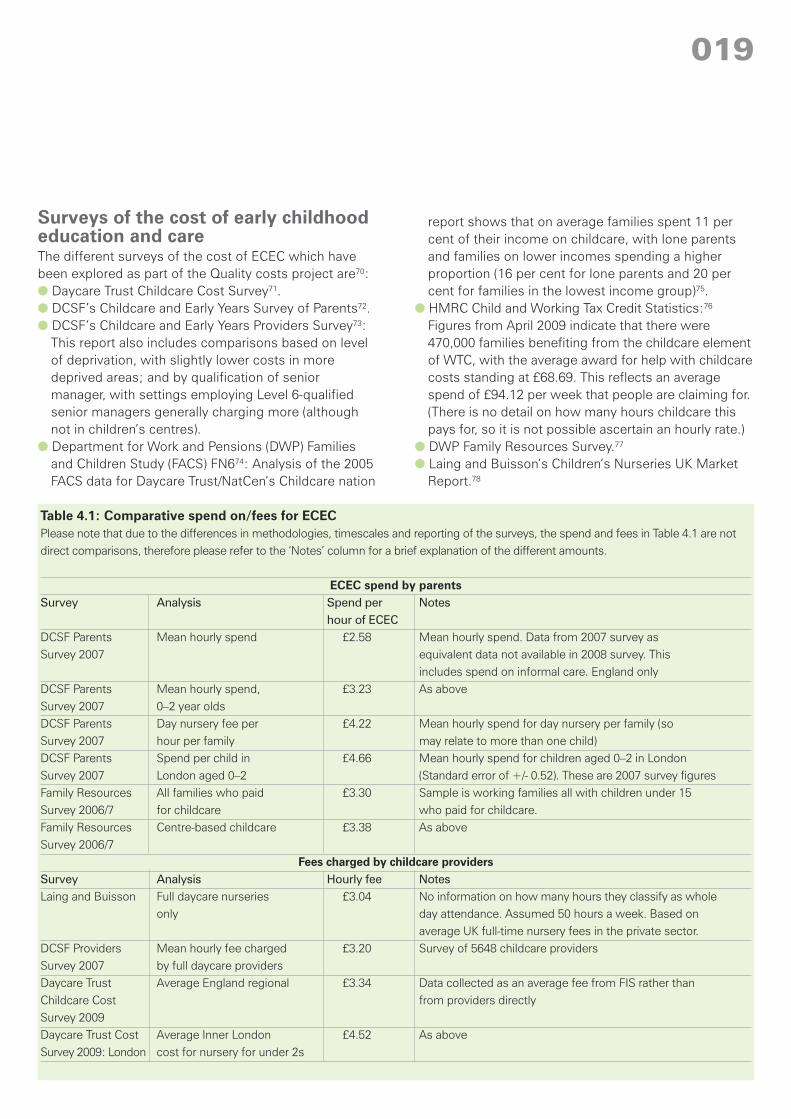
Table 4.1: Comparative spend on/fees for ECECPlease note that due to the differences in methodologies, timescales and reporting of the surveys, the spend and fees in Table 4.1 are notdirect comparisons, therefore please refer to the ‘Notes’ column for a brief explanation of the different amounts.
ECEC spend by parentsSurvey Analysis Spend per Notes
hour of ECECDCSF Parents Mean hourly spend £2.58 Mean hourly spend. Data from 2007 survey asSurvey 2007 equivalent data not available in 2008 survey. This
includes spend on informal care. England onlyDCSF Parents Mean hourly spend, £3.23 As aboveSurvey 2007 0–2 year oldsDCSF Parents Day nursery fee per £4.22 Mean hourly spend for day nursery per family (soSurvey 2007 hour per family may relate to more than one child)DCSF Parents Spend per child in £4.66 Mean hourly spend for children aged 0–2 in LondonSurvey 2007 London aged 0–2 (Standard error of +/- 0.52). These are 2007 survey figuresFamily Resources All families who paid £3.30 Sample is working families all with children under 15Survey 2006/7 for childcare who paid for childcare.Family Resources Centre-based childcare £3.38 As aboveSurvey 2006/7
Fees charged by childcare providersSurvey Analysis Hourly fee NotesLaing and Buisson Full daycare nurseries £3.04 No information on how many hours they classify as whole
only day attendance. Assumed 50 hours a week. Based onaverage UK full-time nursery fees in the private sector.
DCSF Providers Mean hourly fee charged £3.20 Survey of 5648 childcare providersSurvey 2007 by full daycare providersDaycare Trust Average England regional £3.34 Data collected as an average fee from FIS rather thanChildcare Cost from providers directlySurvey 2009Daycare Trust Cost Average Inner London £4.52 As aboveSurvey 2009: London cost for nursery for under 2s
019
ConclusionThe different surveys indicate that the average hourlyspend by parents is between £2.58 at the lower end and£3.30 at the upper end, although the average will belower in some regions and higher in others (such asLondon). Both of these figures – the former from theDCSF Parents Survey and the latter from the FamilyResources Survey – include the average costs for bothinformal and formal care. The DCSF Parents Survey alsoincludes nursery and reception classes, which will have amuch lower spend associated with them, if any at all.
Therefore, as this project is only concerned with the costof formal care, it can be supposed that the average spendby parents will be higher than these figures once informalcare and those with little or no cost are excluded.
Looking at fees charged by group providers, the figuresvary between £3.0481 and £3.34, again with higheramounts in London. It is possible that the average hourlyrates based on childcare fees are more accurate thanthose based on what parents say they spend and howmany hours they use, as parents can find it difficult tounderstand the cost of their childcare given the varioussubsidies that exist. However, these figures do notrepresent the actual cost of the provision for differentages of children, as they include the element of cross-subsidy discussed above (ie providers undercharging forbabies and overcharging for three- and four-year-olds).
This average hourly fee is similar to the average currentcost of a full daycare setting as identified in the costcalculation model in Chapter 3. In the cost calculation,staff wages at current levels – adjusted for staffefficiency and overhead costs of 33 per cent of staffcosts – would be an average £3.07 across all age groups(with a ratio of 1:8 for children aged three and above).However, this average cost again reflects the impact ofcross-subsidy, as the specific fees for different agegroups are substantially higher for the under twos (£4.09per hour) and substantially lower for those aged threeand over (£1.85 per hour).
The reported fees for ECEC, and even the reportedspend, do not necessarily reflect what parents pay, asmany parents will be able to access free places for theirthree- and four-year-olds (and in some cases two-year-olds), plus financial support with fees through thechildcare element of WTC and employer-supportedchildcare (as discussed in Chapter 5).
The impact of the increased cost of the high qualitymodel on parents will then be discussed in detail inChapter 6, as the costings for the high quality modelwould almost treble the fees for parents if the full extentof the increased cost was passed on to them.
International comparisons79
In France, the average charge to parents forchildren between 0 and 3 years is about 27% of thecosts; for children aged 3 and above public servicesare free. The cost of a crèche is in the region of€280 (around £25080) per month.
In Denmark, parents contribute on average 20%costs by paying fees that are scaled according toincome. There is a maximum limit on individualparent fees of 25% of costs.
In New Zealand, Kindergarten (sessional ECEC forchildren aged 2–5) is mainly government funded andcosts NZ $2–5 per morning or afternoon session.Daycare centres are open longer, have more flexiblehours and cost around NZ $200 (£88) a week for afull-time place.
In Sweden, maximum monthly fees for ECEC arearound SEK 1260 (£108) for the first child;households with a monthly income of over SEK42,000 pay at most the maximum fee, and otherfamilies on lower incomes pay less. No family paysmore than 3% of gross income and otherhouseholds pay a certain percentage of their grossincome. The maximum fees reduce for second andsubsequent children.
Quality costs: paying for Early Childhood Education and Care020
This chapter explores the current levels of Governmentfunding of early childhood education and care (ECEC),both demand-side and supply-side, before going on toexplore the options for funding the higher costs of thehigh quality model and the reforms to fundingarrangements that would be needed.
The overall funding levels for ECEC have increased underthe Labour Government since 1997, with initiatives suchas the free entitlement (now available for all three- andfour-year olds), Sure Start Children’s Centres, childcareelement of Working Tax Credit and employer-supportedchildcare, all leading to increased spending. TheGovernment has recognised the importance of earlyyears in combating disadvantage and improving childoutcomes (particularly for disadvantaged children) andhas therefore begun to invest accordingly.
Free entitlement and the DedicatedSchools GrantAll three- and four-year olds are currently entitled to 12.5hours each week of free early learning and childcare, for38 weeks per year. This is due to be extended to 15hours per week by 2010, to be delivered more flexibly. Apathfinder project is also providing ten hours per week(or in the original pilot areas, 15 hours per week), over 38weeks of the year, to disadvantaged two-year-olds. Theinitial pilot in 63 local authorities has been reported to besuccessful82 and therefore is being extended by theDepartment for Children, Schools and Families (DCSF) sothat free childcare is now available to the 15 per centmost disadvantaged two-year-olds across all localauthorities, costing £137 million over two years. GordonBrown announced at the 2009 Labour Party conferencethat this would be extended to 250,000 two-year-olds bythe end of the next Parliament, and paid for by endingthe tax breaks on employer-supported childcare (seesection on employer-supported childcare below).
DCSF data shows that 92 per cent of three-year-olds and98 per cent of four-year-olds were benefiting from some
free early education;83 although this may include somedouble counting if children access the entitlementthrough more than one provider. It does not give data onwhether children are taking up their full entitlement. TheDCSF Childcare and Early Years Survey 2008 indicatesthat 78 per cent of eligible three-year-olds receivedsome hours of free entitlement, and 8 per cent receivedearly years education but not the free entitlement. Someparents indicated that this was because their providerdid not offer the free hours, their child was too young, orthey did not know about the free entitlement.84 Twelveper cent of eligible three-year-olds were not receivingany early years education. Analysis of the 2004 DCSFParents Childcare Survey – undertaken by NatCen for theDaycare Trust/NatCen publication ‘Childcare Nation’ –found that children in non-working households, with lowincomes, or in lone parent families, were less likely totake up the early years entitlement. Fourteen per cent ofthose not using the free entitlement said it was becausethey couldn’t ‘afford to’, perhaps because providerswere charging some level of fee, or payment for mealsetc, or requiring parents to take longer sessions and payfor the additional element. The same report found that28 per cent of families using fewer than 12.5 hours perweek of childcare were paying a fee.85
Funding for the free entitlement is difficult to quantify,as it is provided through the Dedicated Schools Grant(DSG) and the early years element is not ring-fenced.Spending on under fives is generally accepted as beingaround £4bn, but this includes spending on receptionclasses, and precise figures on free entitlementspending are unobtainable (either from DCSF or HMTreasury). Funding is further complicated by the fact thatmany children officially in receipt of the free entitlementare in reception classes at primary school, especiallynow that so many schools offer a single point of entryfor four-year-olds in September.
As funding for the free entitlement is provided by DCSFvia the DSG to local authorities, and by local authoritiesto schools and settings via locally determined funding
021
5. Current Government spendingon early childhood educationand care
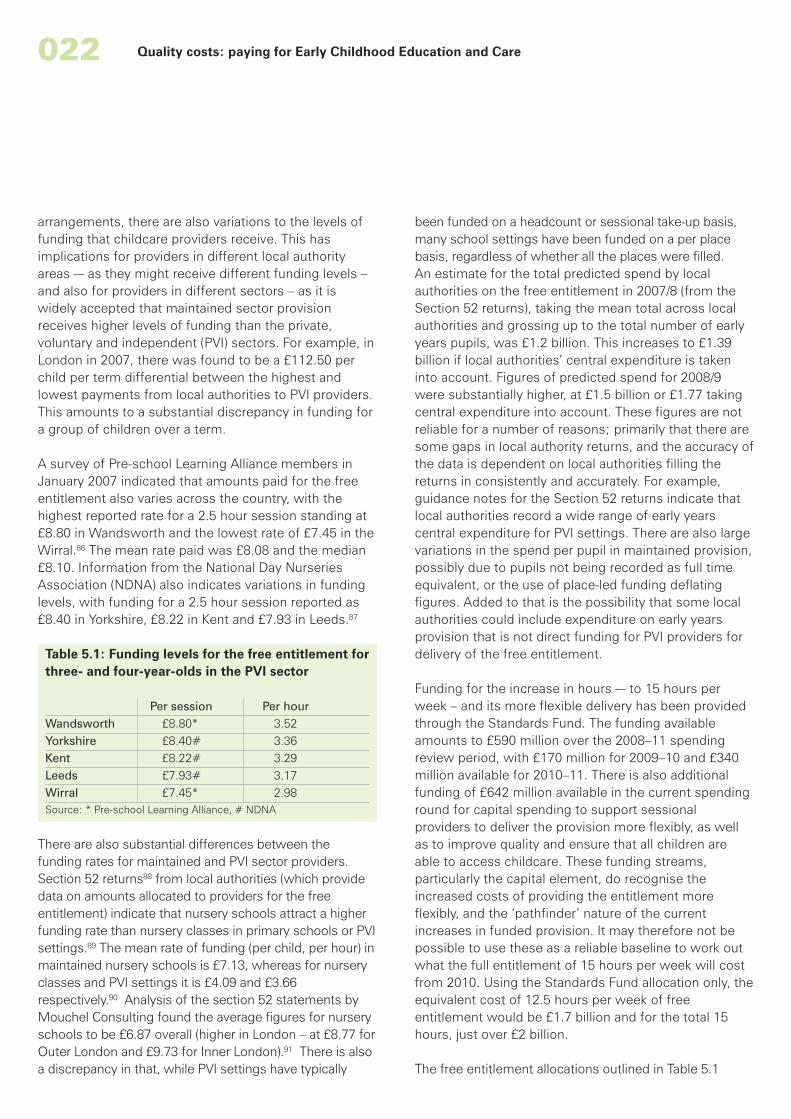
022 Quality costs: paying for Early Childhood Education and Care
arrangements, there are also variations to the levels offunding that childcare providers receive. This hasimplications for providers in different local authorityareas -– as they might receive different funding levels –and also for providers in different sectors – as it iswidely accepted that maintained sector provisionreceives higher levels of funding than the private,voluntary and independent (PVI) sectors. For example, inLondon in 2007, there was found to be a £112.50 perchild per term differential between the highest andlowest payments from local authorities to PVI providers.This amounts to a substantial discrepancy in funding fora group of children over a term.
A survey of Pre-school Learning Alliance members inJanuary 2007 indicated that amounts paid for the freeentitlement also varies across the country, with thehighest reported rate for a 2.5 hour session standing at£8.80 in Wandsworth and the lowest rate of £7.45 in theWirral.86 The mean rate paid was £8.08 and the median£8.10. Information from the National Day NurseriesAssociation (NDNA) also indicates variations in fundinglevels, with funding for a 2.5 hour session reported as£8.40 in Yorkshire, £8.22 in Kent and £7.93 in Leeds.87
Table 5.1: Funding levels for the free entitlement forthree- and four-year-olds in the PVI sector
Per session Per hourWandsworth £8.80* 3.52Yorkshire £8.40# 3.36Kent £8.22# 3.29Leeds £7.93# 3.17Wirral £7.45* 2.98Source: * Pre-school Learning Alliance, # NDNA
There are also substantial differences between thefunding rates for maintained and PVI sector providers.Section 52 returns88 from local authorities (which providedata on amounts allocated to providers for the freeentitlement) indicate that nursery schools attract a higherfunding rate than nursery classes in primary schools or PVIsettings.89 The mean rate of funding (per child, per hour) inmaintained nursery schools is £7.13, whereas for nurseryclasses and PVI settings it is £4.09 and £3.66respectively.90 Analysis of the section 52 statements byMouchel Consulting found the average figures for nurseryschools to be £6.87 overall (higher in London – at £8.77 forOuter London and £9.73 for Inner London).91 There is alsoa discrepancy in that, while PVI settings have typically
been funded on a headcount or sessional take-up basis,many school settings have been funded on a per placebasis, regardless of whether all the places were filled.An estimate for the total predicted spend by localauthorities on the free entitlement in 2007/8 (from theSection 52 returns), taking the mean total across localauthorities and grossing up to the total number of earlyyears pupils, was £1.2 billion. This increases to £1.39billion if local authorities’ central expenditure is takeninto account. Figures of predicted spend for 2008/9were substantially higher, at £1.5 billion or £1.77 takingcentral expenditure into account. These figures are notreliable for a number of reasons; primarily that there aresome gaps in local authority returns, and the accuracy ofthe data is dependent on local authorities filling thereturns in consistently and accurately. For example,guidance notes for the Section 52 returns indicate thatlocal authorities record a wide range of early yearscentral expenditure for PVI settings. There are also largevariations in the spend per pupil in maintained provision,possibly due to pupils not being recorded as full timeequivalent, or the use of place-led funding deflatingfigures. Added to that is the possibility that some localauthorities could include expenditure on early yearsprovision that is not direct funding for PVI providers fordelivery of the free entitlement.
Funding for the increase in hours -– to 15 hours perweek – and its more flexible delivery has been providedthrough the Standards Fund. The funding availableamounts to £590 million over the 2008–11 spendingreview period, with £170 million for 2009–10 and £340million available for 2010–11. There is also additionalfunding of £642 million available in the current spendinground for capital spending to support sessionalproviders to deliver the provision more flexibly, as wellas to improve quality and ensure that all children areable to access childcare. These funding streams,particularly the capital element, do recognise theincreased costs of providing the entitlement moreflexibly, and the ‘pathfinder’ nature of the currentincreases in funded provision. It may therefore not bepossible to use these as a reliable baseline to work outwhat the full entitlement of 15 hours per week will costfrom 2010. Using the Standards Fund allocation only, theequivalent cost of 12.5 hours per week of freeentitlement would be £1.7 billion and for the total 15hours, just over £2 billion.
The free entitlement allocations outlined in Table 5.1
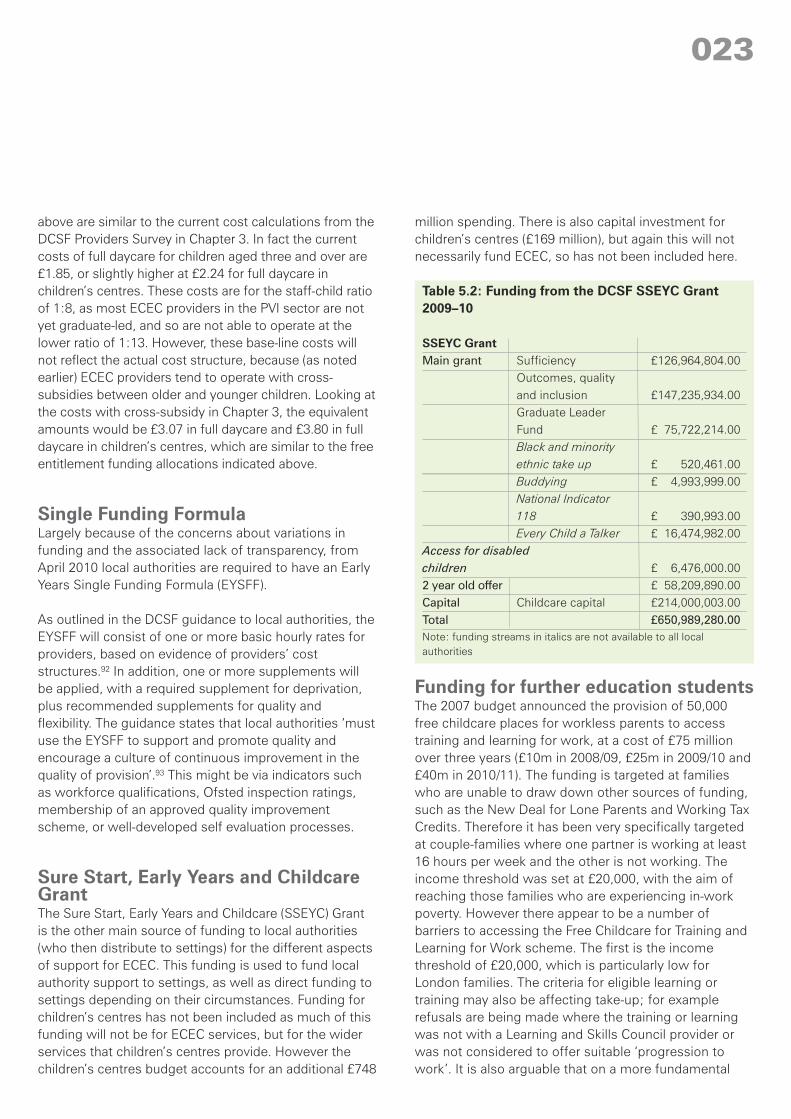
023
above are similar to the current cost calculations from theDCSF Providers Survey in Chapter 3. In fact the currentcosts of full daycare for children aged three and over are£1.85, or slightly higher at £2.24 for full daycare inchildren’s centres. These costs are for the staff-child ratioof 1:8, as most ECEC providers in the PVI sector are notyet graduate-led, and so are not able to operate at thelower ratio of 1:13. However, these base-line costs willnot reflect the actual cost structure, because (as notedearlier) ECEC providers tend to operate with cross-subsidies between older and younger children. Looking atthe costs with cross-subsidy in Chapter 3, the equivalentamounts would be £3.07 in full daycare and £3.80 in fulldaycare in children’s centres, which are similar to the freeentitlement funding allocations indicated above.
Single Funding FormulaLargely because of the concerns about variations infunding and the associated lack of transparency, fromApril 2010 local authorities are required to have an EarlyYears Single Funding Formula (EYSFF).
As outlined in the DCSF guidance to local authorities, theEYSFF will consist of one or more basic hourly rates forproviders, based on evidence of providers’ coststructures.92 In addition, one or more supplements willbe applied, with a required supplement for deprivation,plus recommended supplements for quality andflexibility. The guidance states that local authorities ‘mustuse the EYSFF to support and promote quality andencourage a culture of continuous improvement in thequality of provision’.93 This might be via indicators suchas workforce qualifications, Ofsted inspection ratings,membership of an approved quality improvementscheme, or well-developed self evaluation processes.
Sure Start, Early Years and ChildcareGrantThe Sure Start, Early Years and Childcare (SSEYC) Grantis the other main source of funding to local authorities(who then distribute to settings) for the different aspectsof support for ECEC. This funding is used to fund localauthority support to settings, as well as direct funding tosettings depending on their circumstances. Funding forchildren’s centres has not been included as much of thisfunding will not be for ECEC services, but for the widerservices that children’s centres provide. However thechildren’s centres budget accounts for an additional £748
million spending. There is also capital investment forchildren’s centres (£169 million), but again this will notnecessarily fund ECEC, so has not been included here.
Table 5.2: Funding from the DCSF SSEYC Grant2009–10
SSEYC GrantMain grant Sufficiency £126,964,804.00
Outcomes, qualityand inclusion £147,235,934.00Graduate LeaderFund £ 75,722,214.00Black and minorityethnic take up £ 520,461.00Buddying £ 4,993,999.00National Indicator118 £ 390,993.00Every Child a Talker £ 16,474,982.00
Access for disabledchildren £ 6,476,000.002 year old offer £ 58,209,890.00Capital Childcare capital £214,000,003.00Total £650,989,280.00Note: funding streams in italics are not available to all localauthorities
Funding for further education studentsThe 2007 budget announced the provision of 50,000free childcare places for workless parents to accesstraining and learning for work, at a cost of £75 millionover three years (£10m in 2008/09, £25m in 2009/10 and£40m in 2010/11). The funding is targeted at familieswho are unable to draw down other sources of funding,such as the New Deal for Lone Parents and Working TaxCredits. Therefore it has been very specifically targetedat couple-families where one partner is working at least16 hours per week and the other is not working. Theincome threshold was set at £20,000, with the aim ofreaching those families who are experiencing in-workpoverty. However there appear to be a number ofbarriers to accessing the Free Childcare for Training andLearning for Work scheme. The first is the incomethreshold of £20,000, which is particularly low forLondon families. The criteria for eligible learning ortraining may also be affecting take-up; for examplerefusals are being made where the training or learningwas not with a Learning and Skills Council provider orwas not considered to offer suitable ‘progression towork’. It is also arguable that on a more fundamental
024 Quality costs: paying for Early Childhood Education and Care
level, by excluding lone parents, the scheme is nottargeting those who need help the most. The majority ofenquiries to Daycare Trust’s Information Line aboutfinancial help for student parents are from lone parents(approximately 75 per cent of calls from students infurther education in July–August 2009) who areobviously not eligible for the scheme and yet are unableto find suitable alternative funding. Whilst in theory thisis provided by Jobcentre Plus, feedback from our callerssuggests that this is rarely available.
There are two other funding streams for furthereducation students who need support with funding theirchildcare: Learner Support Funds and Care to Learn.Learner Support Funds are allocated through theLearning and Skills Council and in 2009/10 there is£30,897,000 available for childcare support for studentsaged 20 and over. The fund is discretionary and collegesset their own eligibility criteria. Care to Learn is a moregenerous funding allocation for teenage learners,whereby young parents are entitled to (rather than ableto apply for) childcare support and associated travel, upto £160 a week (£175 in London).
Childcare element of Working TaxCreditThe Childcare element of Working Tax Credit (WTC) canprovide families on low to middle incomes with up to 80per cent of their childcare costs, if a lone parent (or bothparents in a couple) is (or are) in work for at least 16hours a week. This is up to a maximum level of £175 forone child and £300 for two or more children, meaningthat parents can claim a maximum of £140 a week forone child and £240 for two or more children.
The average amount received by claimants had beendeclining: from £49.50 per week in 2005/06 to £48.45 in2006/07. However, since the 2006 increase in subsidyrate from 70 per cent to 80 per cent, there has been anincrease in the amounts claimed, with the average(snapshot) figures for December 2008 and April 2009standing at £68.3794 and £68.69 respectively.95 With thenumber of families benefitting in April 2009 standing at470,400, the amount paid for the childcare element perweek is around £32.3 million, or £1.68 billion per year.Looking at finalised annual awards (which are moreaccurate as they are subject to retrospectiveassessment), the annual childcare entitlement for2007/08 was £1.36 billion.
There are, however, substantial numbers of parents whowork more than 16 hours per week and do not receivethe childcare element.96 According to HMRC tax creditstatistics, 766,400 single parents work more than 16hours a week and receive more than the family element,but do not claim the childcare element. For some ofthese families it is likely that they will be choosing touse informal care and so not eligible to claim thechildcare element, but there will be others who choosenot to take up the tax credit or do not know that they areeligible.
The reasons for the low take up of the credit is due inpart to the tax credit taper, which limits the amount paidas income levels increase. Therefore, although thechildcare element can pay up to 80 per cent of costs, formost families the amounts paid will be much lower. Forexample a lone parent, with one child and childcarecosts of £156 a week,97 who earns £30,000 per annumwould get approximately 23 per cent of his/her costspaid. A couple with two children under five who havechildcare costs of £156 a week per child (the averagefull-time nursery fees for over twos in England from theDaycare Trust 2009 survey) and earn a combined total of£30,000 per annum would get £151.55 from thechildcare element and £96.97 from child tax credit, withthe childcare element covering 49 per cent of theirchildcare costs. If household income was £40,000, thechildcare element paid would reduce to £76.24, or 25per cent of the childcare costs paid.
The restricted and complicated eligibility criteria andongoing problems with the administration of the taxcredit further compound the issue. (It seems likely thatat least two-fifths of lone parents receiving tax creditshave been affected by overpayment or underpayment.98)Although the issue with overpayments has improvedsubstantially recently, the press coverage at the heightof the problem seems to have remained in the publicmemory, and this deters potential claimants. Parentstend to have fairly regular changes in circumstanceswhen it comes to childcare costs, because of changesto their working hours, school holidays etc. It is verydifficult to work out ‘average’ childcare costs as definedby HM Revenue & Customs (HMRC) and childcare costsvary considerably over time (for example during thesummer holidays) which increases the risk ofoverpayments or other mistakes.
025
Childcare Affordability Programmeand the Child Poverty PilotsThis is a London-only scheme aiming to make childcaremore affordable for lower income families and toincrease their opportunity of getting in to paidemployment. The Childcare Affordability Programme(CAP) 05 was launched in 2005 and was originallyintended to end in 2008, but has been extended untilDecember 2009.99
HMRC and the London Development Agency (LDA) arecurrently running a number of tax credit pilots, whichaim to test out ways of simplifying tax credits andmaking them meet parents’ needs more effectively.These pilots build on the work of the LDA’s ChildcareAffordability Programme, which funded an additional£30 of childcare costs -– up to a total of £205 per week –to acknowledge the high costs of childcare in thecapital. The extension of CAP05 until December 2009will fund places up to £215 per week. Under the ChildPoverty Pilots:1. In the South East region the most vulnerable parents
will be provided with financial support at the timewhen childcare costs are incurred – up to 80 per centof the total cost, as opposed to an average amountbased on costs over the year.
2. 500 families in five London Boroughs will have accessto intensive guidance to navigate the benefits system.
3. 500 families in five London Boroughs will have 100per cent of their childcare costs paid through taxcredits – up to £215 per week for one child and £350for two or more children.
4. For families with disabled children 80 per cent ofchildcare costs will be paid through tax credits – up toa total of £215 for a disabled child and £350 for aseverely disabled child.
Employer-supported childcareEmployer-supported childcare was introduced by theGovernment in 2005 to help working parents with the costof formal childcare. The majority of employers use achildcare voucher company to administer the scheme,although some (mainly smaller employers) pay childcareproviders directly. Each parent can receive up to £243worth of vouchers each month (or £55 each week) freefrom Income Tax and National Insurance Contributions(NICs). The scheme is primarily administered as a salarysacrifice, whereby the employee is provided with childcarevouchers in lieu of a portion of their salary. Although in
theory it can be added on top of salary, in practice the vastmajority of employers provide childcare support throughsalary sacrifice (only nine per cent of parents in the 2008DCSF Parents Childcare survey received contributions ontop of their salary100). So rather than contributing towardsthe costs of childcare, employers are benefiting directlyfrom the voucher scheme.
In September 2009, Gordon Brown announced in hisspeech to the Labour Party conference that he proposedto extend the free entitlement to 250,000 two-year-olds forten hours per week, thereby reaching a third of all two-year-olds, rather than the current 15 per cent. However, topay for this extension, he announced that he would phaseout the tax exemptions on employer-supported childcare,thus closing the scheme to new entrants from 2011 andentirely in 2015. The rationale for this policy change is thatthe benefits of employer-supported childcare are skewedtowards higher-rate taxpayers. At the time of writing this isunder review.
In December 2008, data collated by HMRC from 12voucher companies indicated there were 29,864employers and 298,643 employees in receipt ofchildcare vouchers (ie excluding those receiving directpayments and direct provision).101
Further data from HM Treasury, published as part of thePre-Budget Report and Budget reporting, indicates thatthe cost of the tax/NICs exemptions associated withemployer-supported childcare was £500 million for2008/09. This included £130 million as an estimate ofthe amounts saved by employers on reduced NICs.
This data on employee use of childcare vouchers andthe amount of tax and NICs revenue forgone is asubstantial increase on earlier years. A study by theNational Centre for Social Research analysed the uptakeand impact of the childcare-related Income Tax and NICsreforms in late 2005.102 The study reported that 1.4 percent of organisations in the sample offered childcarevouchers, equivalent to approximately 9,600organisations in the UK. The number of organisationsoffering direct payments to childcare providers was3,600 and those offering direct childcare provisionnumbered 4,900. The limited number of organisationsreported to be offering childcare vouchers is explainedin part by a lack of awareness of the existence of thescheme at the time of the study. In their report,Kazimirski et al made a cautious estimate of around
026 Quality costs: paying for Early Childhood Education and Care
175,000 recipients of financial help through employer-supported childcare in the UK. This figure includesrecipients of direct payments and direct provision, inaddition to those receiving childcare vouchers.
The 2008 Parents’ Childcare Survey found that sevenpercent of families who had paid for childcare in the lastweek had received financial help from their employer,with 73 per cent of those receiving vouchers and 14 percent having payments made directly from their employerto their childcare provider.103 Eighty three per cent ofpeople receiving support from their employers did sothrough salary sacrifice and only nine per cent receivedsupport in addition to their salary.
According to the Family Resources Survey (analysed bythe Institute for Fiscal Studies specifically for thisproject), 110,000 individuals in 2005/06 and 160,000individuals in 2006/07 were currently receiving vouchers
from their employer to pay for childcare (thiscorresponded to 105,000 and 140,000 families).104 In2006/07, 68 per cent said it was part of a salary sacrificearrangement. The most common amounts to be paidamong those taking salary sacrifice were £50 and £55 aweek. Alongside the difficulties in surveying childcarefees outlined in the previous chapter, it is likely thatsome parents are not reporting receipt of thesevouchers when asked about any benefits-in-kind thatcome with their employment.
Total government spendingAdding together all the elements of governmentspending, we see that the Government is currentlyspending between £3.5 billion and £4.1 billion a year,depending on which estimate is taken for spending onthe free entitlement. The lower estimate, for 2007/8 isuseful for this project as it provides comparable figures
Government spending on ECEC in other countries105
As discussed in Working Paper 4: International comparisons of high quality early childhood education and care, ifECEC services are seen as a public good, it is the role of government to supply this good and control its funding,regulation and quality. The OECD states that ‘for the moment at least, a public supply-side investment model,managed by public authorities, brings more uniform quality and superior coverage of childhood populations thanparent subsidy models’.106
France spends 1 per cent of GDP on ECEC (with children starting compulsory schooling at the age of six). The averagecost to parents for ECEC for children aged up to three is around 27 per cent of the costs, and for children aged threeand over, pre-school services are free. There are also substantial benefits for families in which a parent chooses tostop work, or work less, to look after young children. This reflects the French pro-natal approach.
In Denmark, local authorities fund around 80 per cent of the cost of ECEC, with parents contributing an average of20 per cent, with contributions scaled according to income.
New Zealand has a Funding Subsidy that pays different rates for teacher-led services, centre-based services andhome-based care services. Within each group there are separate rates for children aged under and over two. Thereis also a higher rate of funding for the teacher-led services for three- and four-year-olds, and some additionalfunding elements for certain communities, to establish new centres or to improve the quality in existing centres.
In Sweden, children aged one to six can attend full time pre-school, which is usually open from 6.30am to 6.30pmMonday to Friday. Local authorities can charge a ‘reasonable’ fee for pre-school places, but there is a system ofmaximum fees whereby families with an income of over SEK 42,000 (around £3,800) per month pay at most themaximum fee (SEK 1,260/£110 per month for the first child for example); other families pay at most a certainpercentage of their gross income. Therefore parents contribute around 10 per cent of the costs of ECEC.
027
with the cost calculation (based on 2007 data from theDCSF Providers’ Survey) and financial modeling (basedon 2006/7 data from the Family Resources Survey).There are other elements of government spending -– forexample on various Sure Start funding streams that arenot directly related to ECEC but to wider children’sservices, such as capital costs for children’s centres(which may not deliver ECEC as part of their services) -–and they have not been included here.
Note that the figures in Table 5.3 below on the childcareelement of WTC and employer-supported childcare willnot all be spent on ECEC – some will be spent onchildcare for school-aged children.
Table 5.3: Estimate of government spending onearly childhood education and care in England
£ millionFree entitlement for 3 and 4 year olds(without central expenditure)2007/8 1,2142008/09 1,790Standards Fund for increasing the freeentitlement to 15 hours 170Childcare element of WTC [2007/08] 1,129107
Employer supported childcare [2008/09] 307108
Other DCSF funding streams [2009/10] 651Spend on ECEC for students [LearnerSupport Funds, Care to Learn and FreeChildcare for Training and Learning forWork 2009/10] 88Childcare Affordability Pilot [2009/10] 7Total (using 2008/9 expenditure forthe free entitlement) 4,142Note: For the childcare element of WTC and employer-supportedchildcare, some of these amounts will be spent on over fives
If the funding for children’s centres, children’s centrescapital and Sure Start Local Programmes are added, thespending level rises by £1.2 billion, to between £4.7billion and £5.3 billion overall. As mentioned above, thisreport does not include these areas of spending in theoverall figures because they are concerned with widerearly years provision rather than ECEC per se.
This level of spending represents between 0.33 per centand 0.4 per cent of England’s GDP109 or, if we gross upthe England spend according to the Barnett formula
(which says that UK costs are 23.8 per cent higher thanthose in England), this would give a UK spend ofbetween £4.4 billion and £5.12 billion, equating tobetween 0.35 and 0.4 per cent of UK GDP.
Previous studies have also estimated spend on ECEC asaround 0.4–0.5 per cent of GDP. For example, thePricewaterhouseCoopers report for Daycare Trust andthe Social Market Foundation in 2004 estimated spendto be 0.43 per cent of GDP. The OECD’s Starting Strong IIset estimated spend at 0.45 per cent.110 The UnicefReport Card noted that England spent 0.5 per cent ofGDP on ECEC.111 These estimates are likely to includespending on children’s centres and Sure Start LocalProgrammes (and the PricewaterhouseCoopers reportdefinitely includes spending on Sure Start), which, ifincluded, would also take the figure mentioned here tobetween 0.43 and 0.48 per cent of GDP.
This is a huge increase in funding levels since thebeginning of the ten-year childcare strategy, withspending in 1997 around £2 billion, including £0.5 billionon the nursery voucher scheme,112 and less than £0.1billion on the childcare element of working tax credit (orits predecessors). However this level of funding is stillsomeway short of the investment required to secure thehigh quality ECEC as presented by Daycare Trust in thehigh quality model – whilst ensuring it remainsaffordable to parents.
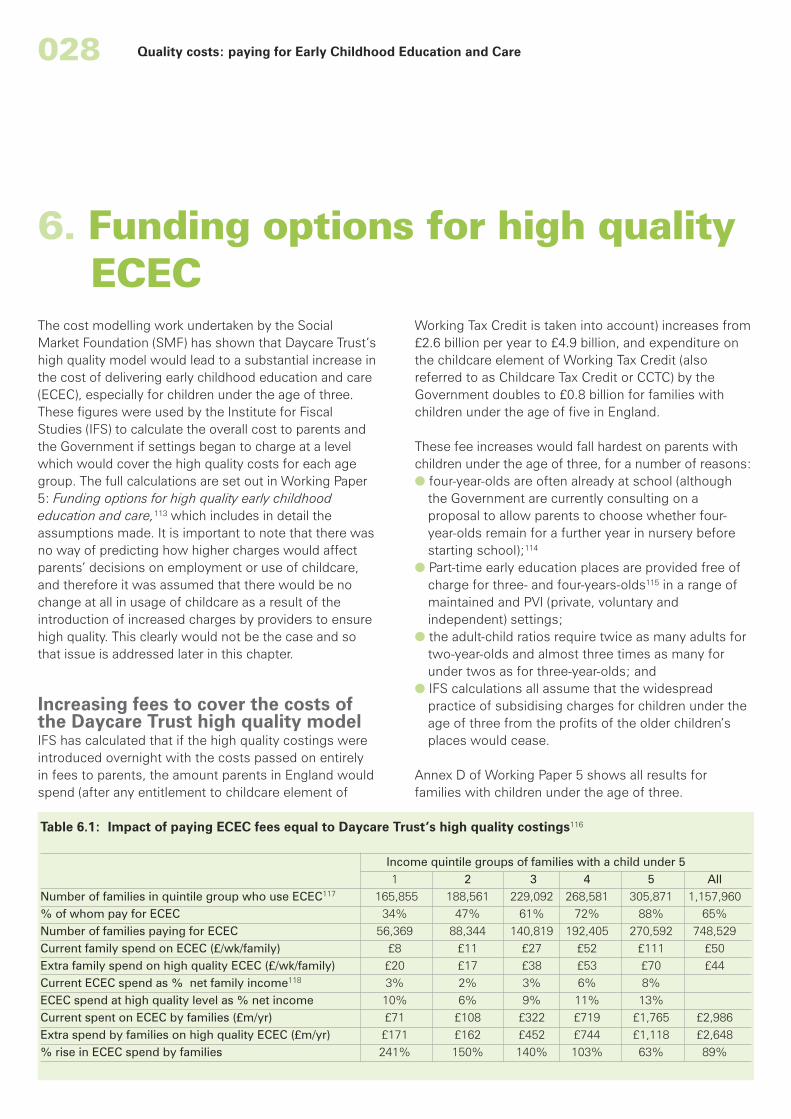
028 Quality costs: paying for Early Childhood Education and Care
The cost modelling work undertaken by the SocialMarket Foundation (SMF) has shown that Daycare Trust’shigh quality model would lead to a substantial increase inthe cost of delivering early childhood education and care(ECEC), especially for children under the age of three.These figures were used by the Institute for FiscalStudies (IFS) to calculate the overall cost to parents andthe Government if settings began to charge at a levelwhich would cover the high quality costs for each agegroup. The full calculations are set out in Working Paper5: Funding options for high quality early childhoodeducation and care,113 which includes in detail theassumptions made. It is important to note that there wasno way of predicting how higher charges would affectparents’ decisions on employment or use of childcare,and therefore it was assumed that there would be nochange at all in usage of childcare as a result of theintroduction of increased charges by providers to ensurehigh quality. This clearly would not be the case and sothat issue is addressed later in this chapter.
Increasing fees to cover the costs ofthe Daycare Trust high quality modelIFS has calculated that if the high quality costings wereintroduced overnight with the costs passed on entirelyin fees to parents, the amount parents in England wouldspend (after any entitlement to childcare element of
Working Tax Credit is taken into account) increases from£2.6 billion per year to £4.9 billion, and expenditure onthe childcare element of Working Tax Credit (alsoreferred to as Childcare Tax Credit or CCTC) by theGovernment doubles to £0.8 billion for families withchildren under the age of five in England.
These fee increases would fall hardest on parents withchildren under the age of three, for a number of reasons:� four-year-olds are often already at school (although
the Government are currently consulting on aproposal to allow parents to choose whether four-year-olds remain for a further year in nursery beforestarting school);114
� Part-time early education places are provided free ofcharge for three- and four-years-olds115 in a range ofmaintained and PVI (private, voluntary andindependent) settings;
� the adult-child ratios require twice as many adults fortwo-year-olds and almost three times as many forunder twos as for three-year-olds; and
� IFS calculations all assume that the widespreadpractice of subsidising charges for children under theage of three from the profits of the older children’splaces would cease.
Annex D of Working Paper 5 shows all results forfamilies with children under the age of three.
Table 6.1: Impact of paying ECEC fees equal to Daycare Trust’s high quality costings116
Income quintile groups of families with a child under 51 2 3 4 5 All
Number of families in quintile group who use ECEC117 165,855 188,561 229,092 268,581 305,871 1,157,960% of whom pay for ECEC 34% 47% 61% 72% 88% 65%Number of families paying for ECEC 56,369 88,344 140,819 192,405 270,592 748,529Current family spend on ECEC (£/wk/family) £8 £11 £27 £52 £111 £50Extra family spend on high quality ECEC (£/wk/family) £20 £17 £38 £53 £70 £44Current ECEC spend as % net family income118 3% 2% 3% 6% 8%ECEC spend at high quality level as % net income 10% 6% 9% 11% 13%Current spent on ECEC by families (£m/yr) £71 £108 £322 £719 £1,765 £2,986Extra spend by families on high quality ECEC (£m/yr) £171 £162 £452 £744 £1,118 £2,648% rise in ECEC spend by families 241% 150% 140% 103% 63% 89%
6. Funding options for high qualityECEC
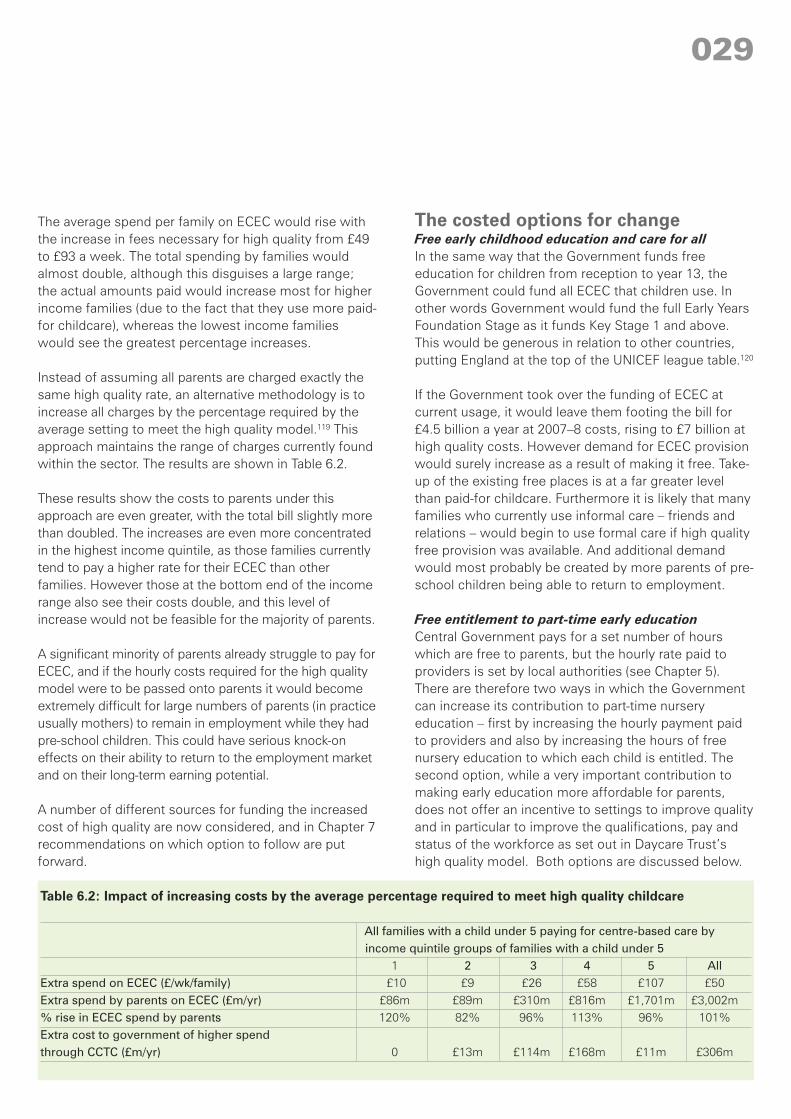
029
The average spend per family on ECEC would rise withthe increase in fees necessary for high quality from £49to £93 a week. The total spending by families wouldalmost double, although this disguises a large range;the actual amounts paid would increase most for higherincome families (due to the fact that they use more paid-for childcare), whereas the lowest income familieswould see the greatest percentage increases.
Instead of assuming all parents are charged exactly thesame high quality rate, an alternative methodology is toincrease all charges by the percentage required by theaverage setting to meet the high quality model.119 Thisapproach maintains the range of charges currently foundwithin the sector. The results are shown in Table 6.2.
These results show the costs to parents under thisapproach are even greater, with the total bill slightly morethan doubled. The increases are even more concentratedin the highest income quintile, as those families currentlytend to pay a higher rate for their ECEC than otherfamilies. However those at the bottom end of the incomerange also see their costs double, and this level ofincrease would not be feasible for the majority of parents.
A significant minority of parents already struggle to pay forECEC, and if the hourly costs required for the high qualitymodel were to be passed onto parents it would becomeextremely difficult for large numbers of parents (in practiceusually mothers) to remain in employment while they hadpre-school children. This could have serious knock-oneffects on their ability to return to the employment marketand on their long-term earning potential.
A number of different sources for funding the increasedcost of high quality are now considered, and in Chapter 7recommendations on which option to follow are putforward.
The costed options for changeFree early childhood education and care for allIn the same way that the Government funds freeeducation for children from reception to year 13, theGovernment could fund all ECEC that children use. Inother words Government would fund the full Early YearsFoundation Stage as it funds Key Stage 1 and above.This would be generous in relation to other countries,putting England at the top of the UNICEF league table.120
If the Government took over the funding of ECEC atcurrent usage, it would leave them footing the bill for£4.5 billion a year at 2007–8 costs, rising to £7 billion athigh quality costs. However demand for ECEC provisionwould surely increase as a result of making it free. Take-up of the existing free places is at a far greater levelthan paid-for childcare. Furthermore it is likely that manyfamilies who currently use informal care – friends andrelations – would begin to use formal care if high qualityfree provision was available. And additional demandwould most probably be created by more parents of pre-school children being able to return to employment.
Free entitlement to part-time early educationCentral Government pays for a set number of hourswhich are free to parents, but the hourly rate paid toproviders is set by local authorities (see Chapter 5).There are therefore two ways in which the Governmentcan increase its contribution to part-time nurseryeducation – first by increasing the hourly payment paidto providers and also by increasing the hours of freenursery education to which each child is entitled. Thesecond option, while a very important contribution tomaking early education more affordable for parents,does not offer an incentive to settings to improve qualityand in particular to improve the qualifications, pay andstatus of the workforce as set out in Daycare Trust’shigh quality model. Both options are discussed below.
Table 6.2: Impact of increasing costs by the average percentage required to meet high quality childcare
All families with a child under 5 paying for centre-based care byincome quintile groups of families with a child under 5
1 2 3 4 5 AllExtra spend on ECEC (£/wk/family) £10 £9 £26 £58 £107 £50Extra spend by parents on ECEC (£m/yr) £86m £89m £310m £816m £1,701m £3,002m% rise in ECEC spend by parents 120% 82% 96% 113% 96% 101%Extra cost to government of higher spendthrough CCTC (£m/yr) 0 £13m £114m £168m £11m £306m
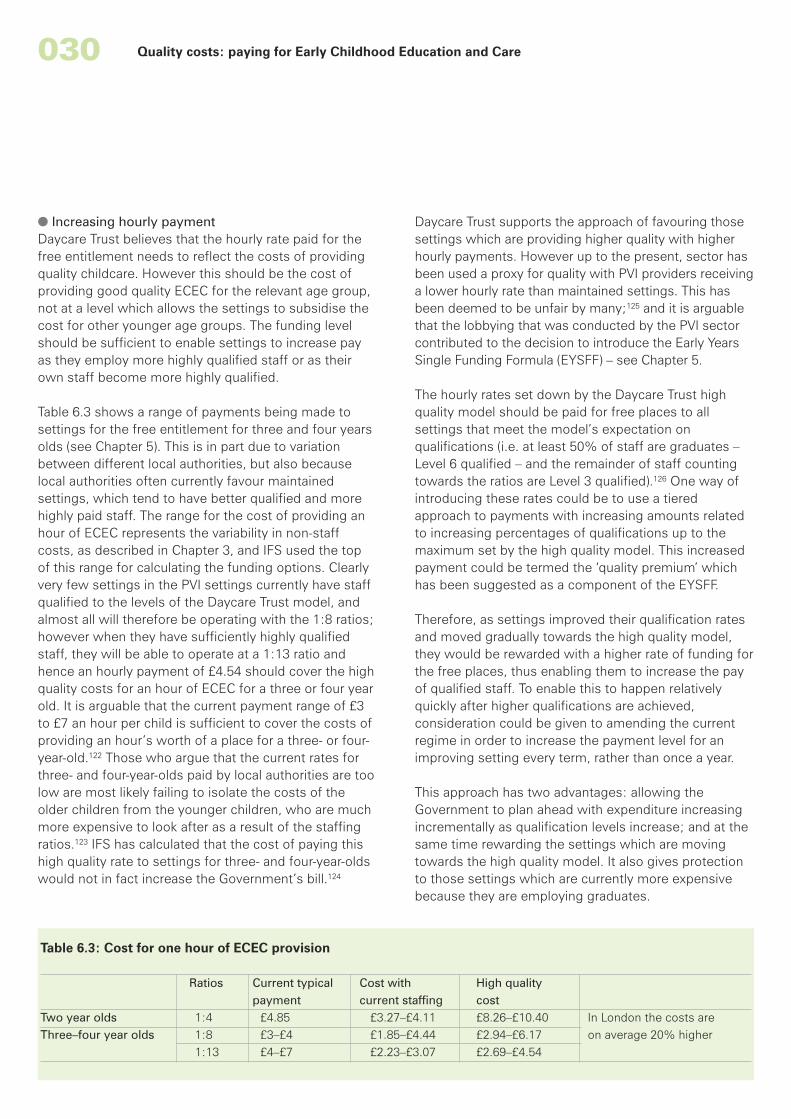
� Increasing hourly paymentDaycare Trust believes that the hourly rate paid for thefree entitlement needs to reflect the costs of providingquality childcare. However this should be the cost ofproviding good quality ECEC for the relevant age group,not at a level which allows the settings to subsidise thecost for other younger age groups. The funding levelshould be sufficient to enable settings to increase payas they employ more highly qualified staff or as theirown staff become more highly qualified.
Table 6.3 shows a range of payments being made tosettings for the free entitlement for three and four yearsolds (see Chapter 5). This is in part due to variationbetween different local authorities, but also becauselocal authorities often currently favour maintainedsettings, which tend to have better qualified and morehighly paid staff. The range for the cost of providing anhour of ECEC represents the variability in non-staffcosts, as described in Chapter 3, and IFS used the topof this range for calculating the funding options. Clearlyvery few settings in the PVI settings currently have staffqualified to the levels of the Daycare Trust model, andalmost all will therefore be operating with the 1:8 ratios;however when they have sufficiently highly qualifiedstaff, they will be able to operate at a 1:13 ratio andhence an hourly payment of £4.54 should cover the highquality costs for an hour of ECEC for a three or four yearold. It is arguable that the current payment range of £3to £7 an hour per child is sufficient to cover the costs ofproviding an hour’s worth of a place for a three- or four-year-old.122 Those who argue that the current rates forthree- and four-year-olds paid by local authorities are toolow are most likely failing to isolate the costs of theolder children from the younger children, who are muchmore expensive to look after as a result of the staffingratios.123 IFS has calculated that the cost of paying thishigh quality rate to settings for three- and four-year-oldswould not in fact increase the Government’s bill.124
Daycare Trust supports the approach of favouring thosesettings which are providing higher quality with higherhourly payments. However up to the present, sector hasbeen used a proxy for quality with PVI providers receivinga lower hourly rate than maintained settings. This hasbeen deemed to be unfair by many;125 and it is arguablethat the lobbying that was conducted by the PVI sectorcontributed to the decision to introduce the Early YearsSingle Funding Formula (EYSFF) – see Chapter 5.
The hourly rates set down by the Daycare Trust highquality model should be paid for free places to allsettings that meet the model’s expectation onqualifications (i.e. at least 50% of staff are graduates –Level 6 qualified – and the remainder of staff countingtowards the ratios are Level 3 qualified).126 One way ofintroducing these rates could be to use a tieredapproach to payments with increasing amounts relatedto increasing percentages of qualifications up to themaximum set by the high quality model. This increasedpayment could be termed the ‘quality premium’ whichhas been suggested as a component of the EYSFF.
Therefore, as settings improved their qualification ratesand moved gradually towards the high quality model,they would be rewarded with a higher rate of funding forthe free places, thus enabling them to increase the payof qualified staff. To enable this to happen relativelyquickly after higher qualifications are achieved,consideration could be given to amending the currentregime in order to increase the payment level for animproving setting every term, rather than once a year.
This approach has two advantages: allowing theGovernment to plan ahead with expenditure increasingincrementally as qualification levels increase; and at thesame time rewarding the settings which are movingtowards the high quality model. It also gives protectionto those settings which are currently more expensivebecause they are employing graduates.
Table 6.3: Cost for one hour of ECEC provision
Ratios Current typical Cost with High qualitypayment current staffing cost
Two year olds 1:4 £4.85 £3.27–£4.11 £8.26–£10.40 In London the costs areThree–four year olds 1:8 £3–£4 £1.85–£4.44 £2.94–£6.17 on average 20% higher
1:13 £4–£7 £2.23–£3.07 £2.69–£4.54
Quality costs: paying for Early Childhood Education and Care030
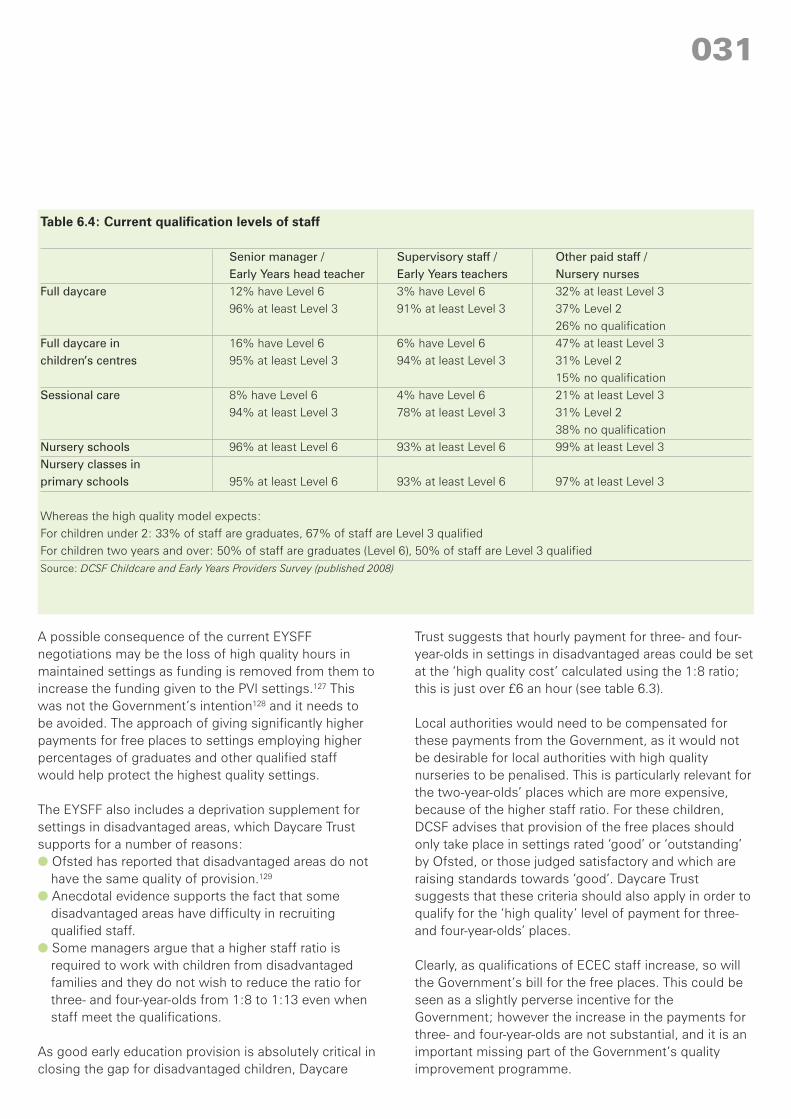
A possible consequence of the current EYSFFnegotiations may be the loss of high quality hours inmaintained settings as funding is removed from them toincrease the funding given to the PVI settings.127 Thiswas not the Government’s intention128 and it needs tobe avoided. The approach of giving significantly higherpayments for free places to settings employing higherpercentages of graduates and other qualified staffwould help protect the highest quality settings.
The EYSFF also includes a deprivation supplement forsettings in disadvantaged areas, which Daycare Trustsupports for a number of reasons:� Ofsted has reported that disadvantaged areas do not
have the same quality of provision.129
� Anecdotal evidence supports the fact that somedisadvantaged areas have difficulty in recruitingqualified staff.
� Some managers argue that a higher staff ratio isrequired to work with children from disadvantagedfamilies and they do not wish to reduce the ratio forthree- and four-year-olds from 1:8 to 1:13 even whenstaff meet the qualifications.
As good early education provision is absolutely critical inclosing the gap for disadvantaged children, Daycare
Trust suggests that hourly payment for three- and four-year-olds in settings in disadvantaged areas could be setat the ‘high quality cost’ calculated using the 1:8 ratio;this is just over £6 an hour (see table 6.3).
Local authorities would need to be compensated forthese payments from the Government, as it would notbe desirable for local authorities with high qualitynurseries to be penalised. This is particularly relevant forthe two-year-olds’ places which are more expensive,because of the higher staff ratio. For these children,DCSF advises that provision of the free places shouldonly take place in settings rated ‘good’ or ‘outstanding’by Ofsted, or those judged satisfactory and which areraising standards towards ‘good’. Daycare Trustsuggests that these criteria should also apply in order toqualify for the ‘high quality’ level of payment for three-and four-year-olds’ places.
Clearly, as qualifications of ECEC staff increase, so willthe Government’s bill for the free places. This could beseen as a slightly perverse incentive for theGovernment; however the increase in the payments forthree- and four-year-olds are not substantial, and it is animportant missing part of the Government’s qualityimprovement programme.
Table 6.4: Current qualification levels of staff
Senior manager / Supervisory staff / Other paid staff /Early Years head teacher Early Years teachers Nursery nurses
Full daycare 12% have Level 6 3% have Level 6 32% at least Level 396% at least Level 3 91% at least Level 3 37% Level 2
26% no qualificationFull daycare in 16% have Level 6 6% have Level 6 47% at least Level 3children’s centres 95% at least Level 3 94% at least Level 3 31% Level 2
15% no qualificationSessional care 8% have Level 6 4% have Level 6 21% at least Level 3
94% at least Level 3 78% at least Level 3 31% Level 238% no qualification
Nursery schools 96% at least Level 6 93% at least Level 6 99% at least Level 3Nursery classes inprimary schools 95% at least Level 6 93% at least Level 6 97% at least Level 3
Whereas the high quality model expects:For children under 2: 33% of staff are graduates, 67% of staff are Level 3 qualifiedFor children two years and over: 50% of staff are graduates (Level 6), 50% of staff are Level 3 qualifiedSource: DCSF Childcare and Early Years Providers Survey (published 2008)
031
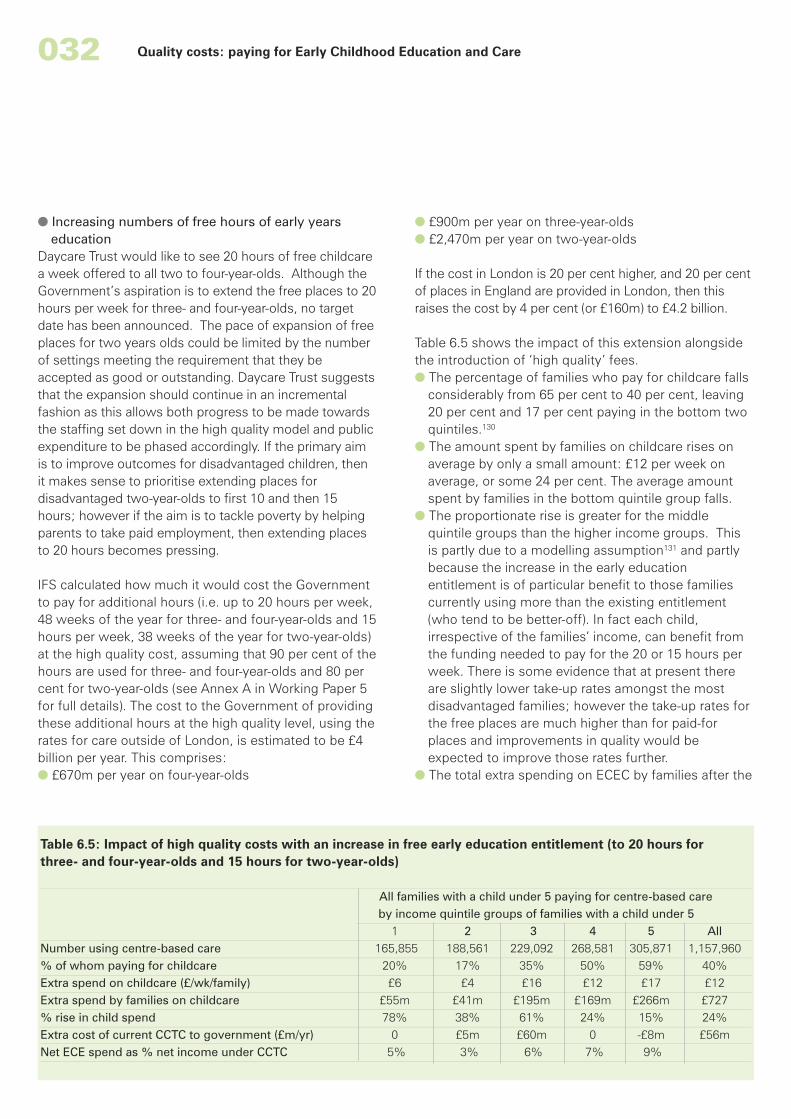
032 Quality costs: paying for Early Childhood Education and Care
� Increasing numbers of free hours of early yearseducation
Daycare Trust would like to see 20 hours of free childcarea week offered to all two to four-year-olds. Although theGovernment’s aspiration is to extend the free places to 20hours per week for three- and four-year-olds, no targetdate has been announced. The pace of expansion of freeplaces for two years olds could be limited by the numberof settings meeting the requirement that they beaccepted as good or outstanding. Daycare Trust suggeststhat the expansion should continue in an incrementalfashion as this allows both progress to be made towardsthe staffing set down in the high quality model and publicexpenditure to be phased accordingly. If the primary aimis to improve outcomes for disadvantaged children, thenit makes sense to prioritise extending places fordisadvantaged two-year-olds to first 10 and then 15hours; however if the aim is to tackle poverty by helpingparents to take paid employment, then extending placesto 20 hours becomes pressing.
IFS calculated how much it would cost the Governmentto pay for additional hours (i.e. up to 20 hours per week,48 weeks of the year for three- and four-year-olds and 15hours per week, 38 weeks of the year for two-year-olds)at the high quality cost, assuming that 90 per cent of thehours are used for three- and four-year-olds and 80 percent for two-year-olds (see Annex A in Working Paper 5for full details). The cost to the Government of providingthese additional hours at the high quality level, using therates for care outside of London, is estimated to be £4billion per year. This comprises:� £670m per year on four-year-olds
� £900m per year on three-year-olds� £2,470m per year on two-year-olds
If the cost in London is 20 per cent higher, and 20 per centof places in England are provided in London, then thisraises the cost by 4 per cent (or £160m) to £4.2 billion.
Table 6.5 shows the impact of this extension alongsidethe introduction of ‘high quality’ fees.� The percentage of families who pay for childcare falls
considerably from 65 per cent to 40 per cent, leaving20 per cent and 17 per cent paying in the bottom twoquintiles.130
� The amount spent by families on childcare rises onaverage by only a small amount: £12 per week onaverage, or some 24 per cent. The average amountspent by families in the bottom quintile group falls.
� The proportionate rise is greater for the middlequintile groups than the higher income groups. Thisis partly due to a modelling assumption131 and partlybecause the increase in the early educationentitlement is of particular benefit to those familiescurrently using more than the existing entitlement(who tend to be better-off). In fact each child,irrespective of the families’ income, can benefit fromthe funding needed to pay for the 20 or 15 hours perweek. There is some evidence that at present thereare slightly lower take-up rates amongst the mostdisadvantaged families; however the take-up rates forthe free places are much higher than for paid-forplaces and improvements in quality would beexpected to improve those rates further.
� The total extra spending on ECEC by families after the
Table 6.5: Impact of high quality costs with an increase in free early education entitlement (to 20 hours forthree- and four-year-olds and 15 hours for two-year-olds)
All families with a child under 5 paying for centre-based careby income quintile groups of families with a child under 5
1 2 3 4 5 AllNumber using centre-based care 165,855 188,561 229,092 268,581 305,871 1,157,960% of whom paying for childcare 20% 17% 35% 50% 59% 40%Extra spend on childcare (£/wk/family) £6 £4 £16 £12 £17 £12Extra spend by families on childcare £55m £41m £195m £169m £266m £727% rise in child spend 78% 38% 61% 24% 15% 24%Extra cost of current CCTC to government (£m/yr) 0 £5m £60m 0 -£8m £56mNet ECE spend as % net income under CCTC 5% 3% 6% 7% 9%
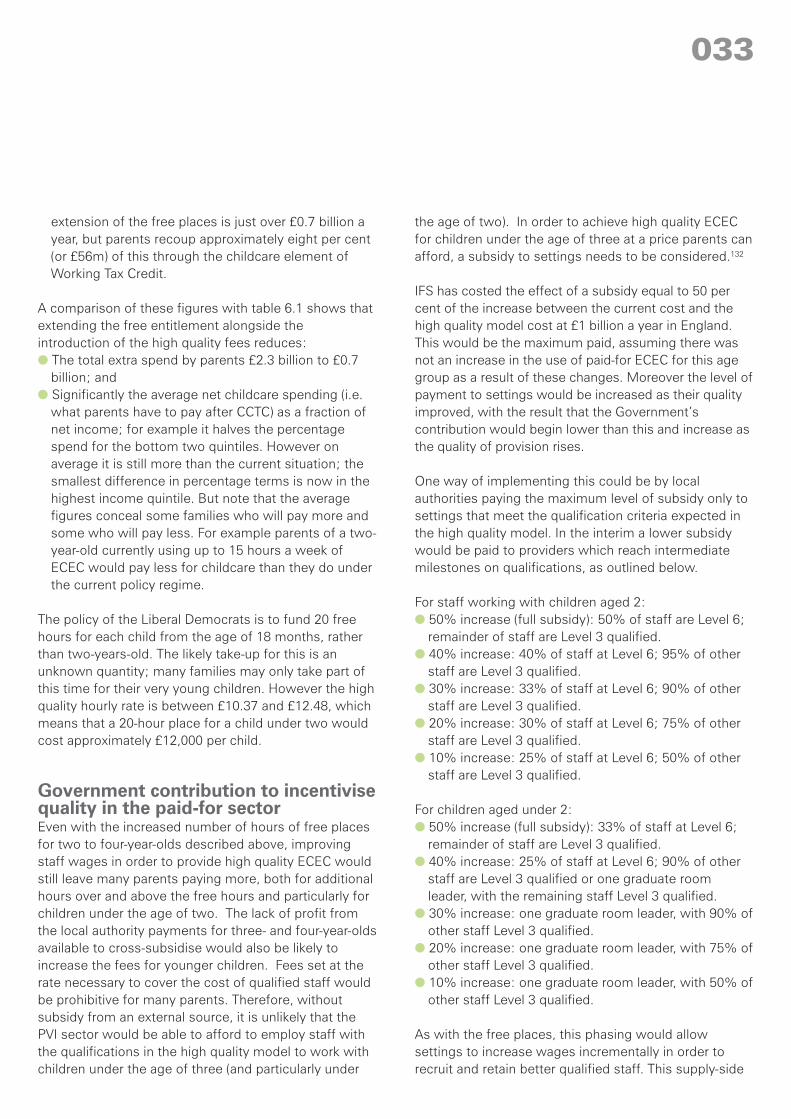
033
extension of the free places is just over £0.7 billion ayear, but parents recoup approximately eight per cent(or £56m) of this through the childcare element ofWorking Tax Credit.
A comparison of these figures with table 6.1 shows thatextending the free entitlement alongside theintroduction of the high quality fees reduces:� The total extra spend by parents £2.3 billion to £0.7
billion; and� Significantly the average net childcare spending (i.e.
what parents have to pay after CCTC) as a fraction ofnet income; for example it halves the percentagespend for the bottom two quintiles. However onaverage it is still more than the current situation; thesmallest difference in percentage terms is now in thehighest income quintile. But note that the averagefigures conceal some families who will pay more andsome who will pay less. For example parents of a two-year-old currently using up to 15 hours a week ofECEC would pay less for childcare than they do underthe current policy regime.
The policy of the Liberal Democrats is to fund 20 freehours for each child from the age of 18 months, ratherthan two-years-old. The likely take-up for this is anunknown quantity; many families may only take part ofthis time for their very young children. However the highquality hourly rate is between £10.37 and £12.48, whichmeans that a 20-hour place for a child under two wouldcost approximately £12,000 per child.
Government contribution to incentivisequality in the paid-for sectorEven with the increased number of hours of free placesfor two to four-year-olds described above, improvingstaff wages in order to provide high quality ECEC wouldstill leave many parents paying more, both for additionalhours over and above the free hours and particularly forchildren under the age of two. The lack of profit fromthe local authority payments for three- and four-year-oldsavailable to cross-subsidise would also be likely toincrease the fees for younger children. Fees set at therate necessary to cover the cost of qualified staff wouldbe prohibitive for many parents. Therefore, withoutsubsidy from an external source, it is unlikely that thePVI sector would be able to afford to employ staff withthe qualifications in the high quality model to work withchildren under the age of three (and particularly under
the age of two). In order to achieve high quality ECECfor children under the age of three at a price parents canafford, a subsidy to settings needs to be considered.132
IFS has costed the effect of a subsidy equal to 50 percent of the increase between the current cost and thehigh quality model cost at £1 billion a year in England.This would be the maximum paid, assuming there wasnot an increase in the use of paid-for ECEC for this agegroup as a result of these changes. Moreover the level ofpayment to settings would be increased as their qualityimproved, with the result that the Government’scontribution would begin lower than this and increase asthe quality of provision rises.
One way of implementing this could be by localauthorities paying the maximum level of subsidy only tosettings that meet the qualification criteria expected inthe high quality model. In the interim a lower subsidywould be paid to providers which reach intermediatemilestones on qualifications, as outlined below.
For staff working with children aged 2:� 50% increase (full subsidy): 50% of staff are Level 6;
remainder of staff are Level 3 qualified.� 40% increase: 40% of staff at Level 6; 95% of other
staff are Level 3 qualified.� 30% increase: 33% of staff at Level 6; 90% of other
staff are Level 3 qualified.� 20% increase: 30% of staff at Level 6; 75% of other
staff are Level 3 qualified.� 10% increase: 25% of staff at Level 6; 50% of other
staff are Level 3 qualified.
For children aged under 2:� 50% increase (full subsidy): 33% of staff at Level 6;
remainder of staff are Level 3 qualified.� 40% increase: 25% of staff at Level 6; 90% of other
staff are Level 3 qualified or one graduate roomleader, with the remaining staff Level 3 qualified.
� 30% increase: one graduate room leader, with 90% ofother staff Level 3 qualified.
� 20% increase: one graduate room leader, with 75% ofother staff Level 3 qualified.
� 10% increase: one graduate room leader, with 50% ofother staff Level 3 qualified.
As with the free places, this phasing would allowsettings to increase wages incrementally in order torecruit and retain better qualified staff. This supply-side
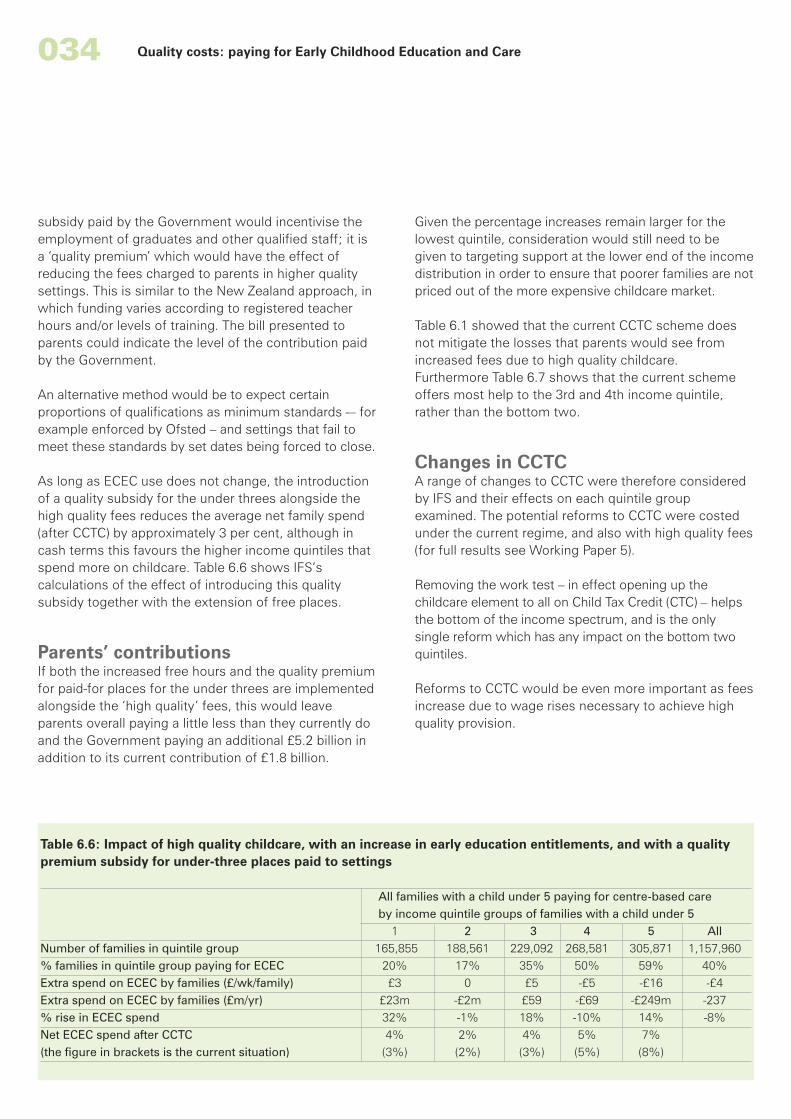
034 Quality costs: paying for Early Childhood Education and Care
subsidy paid by the Government would incentivise theemployment of graduates and other qualified staff; it isa ‘quality premium’ which would have the effect ofreducing the fees charged to parents in higher qualitysettings. This is similar to the New Zealand approach, inwhich funding varies according to registered teacherhours and/or levels of training. The bill presented toparents could indicate the level of the contribution paidby the Government.
An alternative method would be to expect certainproportions of qualifications as minimum standards -– forexample enforced by Ofsted – and settings that fail tomeet these standards by set dates being forced to close.
As long as ECEC use does not change, the introductionof a quality subsidy for the under threes alongside thehigh quality fees reduces the average net family spend(after CCTC) by approximately 3 per cent, although incash terms this favours the higher income quintiles thatspend more on childcare. Table 6.6 shows IFS’scalculations of the effect of introducing this qualitysubsidy together with the extension of free places.
Parents’ contributionsIf both the increased free hours and the quality premiumfor paid-for places for the under threes are implementedalongside the ‘high quality’ fees, this would leaveparents overall paying a little less than they currently doand the Government paying an additional £5.2 billion inaddition to its current contribution of £1.8 billion.
Given the percentage increases remain larger for thelowest quintile, consideration would still need to begiven to targeting support at the lower end of the incomedistribution in order to ensure that poorer families are notpriced out of the more expensive childcare market.
Table 6.1 showed that the current CCTC scheme doesnot mitigate the losses that parents would see fromincreased fees due to high quality childcare.Furthermore Table 6.7 shows that the current schemeoffers most help to the 3rd and 4th income quintile,rather than the bottom two.
Changes in CCTCA range of changes to CCTC were therefore consideredby IFS and their effects on each quintile groupexamined. The potential reforms to CCTC were costedunder the current regime, and also with high quality fees(for full results see Working Paper 5).
Removing the work test – in effect opening up thechildcare element to all on Child Tax Credit (CTC) – helpsthe bottom of the income spectrum, and is the onlysingle reform which has any impact on the bottom twoquintiles.
Reforms to CCTC would be even more important as feesincrease due to wage rises necessary to achieve highquality provision.
Table 6.6: Impact of high quality childcare, with an increase in early education entitlements, and with a qualitypremium subsidy for under-three places paid to settings
All families with a child under 5 paying for centre-based careby income quintile groups of families with a child under 5
1 2 3 4 5 AllNumber of families in quintile group 165,855 188,561 229,092 268,581 305,871 1,157,960% families in quintile group paying for ECEC 20% 17% 35% 50% 59% 40%Extra spend on ECEC by families (£/wk/family) £3 0 £5 -£5 -£16 -£4Extra spend on ECEC by families (£m/yr) £23m -£2m £59 -£69 -£249m -237% rise in ECEC spend 32% -1% 18% -10% 14% -8%Net ECEC spend after CCTC 4% 2% 4% 5% 7%(the figure in brackets is the current situation) (3%) (2%) (3%) (5%) (8%)
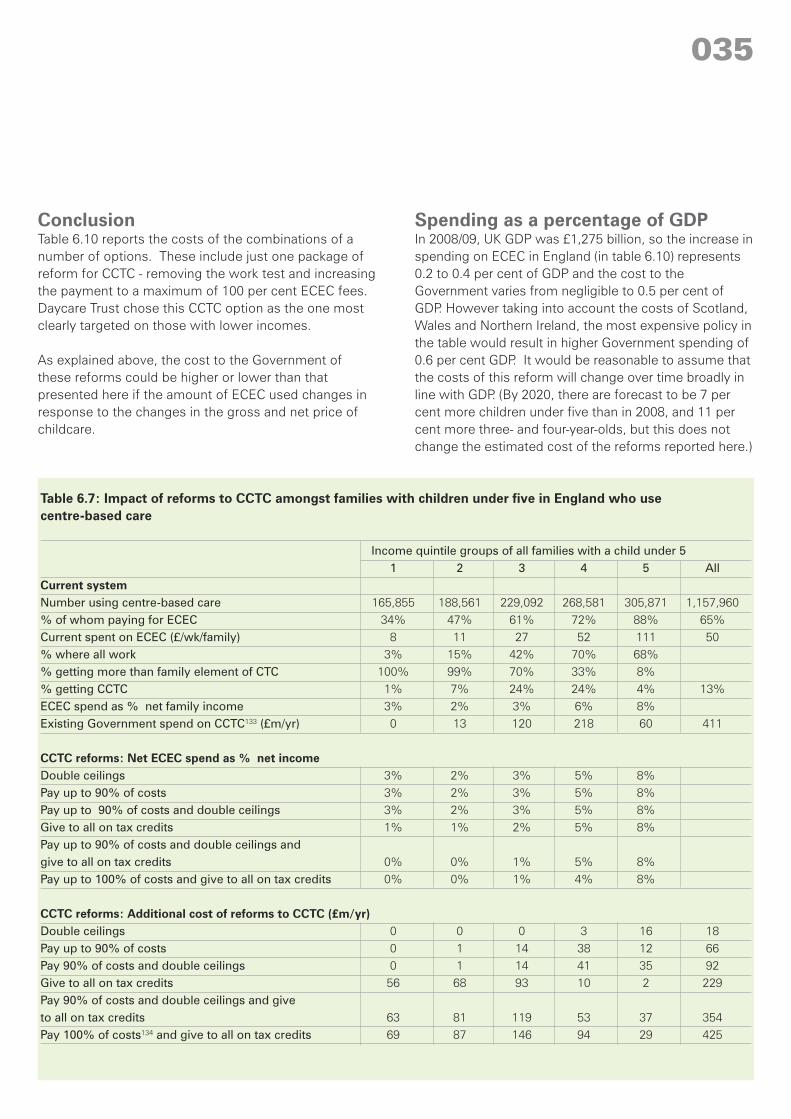
Table 6.7: Impact of reforms to CCTC amongst families with children under five in England who usecentre-based care
Income quintile groups of all families with a child under 51 2 3 4 5 All
Current systemNumber using centre-based care 165,855 188,561 229,092 268,581 305,871 1,157,960% of whom paying for ECEC 34% 47% 61% 72% 88% 65%Current spent on ECEC (£/wk/family) 8 11 27 52 111 50% where all work 3% 15% 42% 70% 68%% getting more than family element of CTC 100% 99% 70% 33% 8%% getting CCTC 1% 7% 24% 24% 4% 13%ECEC spend as % net family income 3% 2% 3% 6% 8%Existing Government spend on CCTC133 (£m/yr) 0 13 120 218 60 411
CCTC reforms: Net ECEC spend as % net incomeDouble ceilings 3% 2% 3% 5% 8%Pay up to 90% of costs 3% 2% 3% 5% 8%Pay up to 90% of costs and double ceilings 3% 2% 3% 5% 8%Give to all on tax credits 1% 1% 2% 5% 8%Pay up to 90% of costs and double ceilings andgive to all on tax credits 0% 0% 1% 5% 8%Pay up to 100% of costs and give to all on tax credits 0% 0% 1% 4% 8%
CCTC reforms: Additional cost of reforms to CCTC (£m/yr)Double ceilings 0 0 0 3 16 18Pay up to 90% of costs 0 1 14 38 12 66Pay 90% of costs and double ceilings 0 1 14 41 35 92Give to all on tax credits 56 68 93 10 2 229Pay 90% of costs and double ceilings and giveto all on tax credits 63 81 119 53 37 354Pay 100% of costs134 and give to all on tax credits 69 87 146 94 29 425
035
ConclusionTable 6.10 reports the costs of the combinations of anumber of options. These include just one package ofreform for CCTC - removing the work test and increasingthe payment to a maximum of 100 per cent ECEC fees.Daycare Trust chose this CCTC option as the one mostclearly targeted on those with lower incomes.
As explained above, the cost to the Government ofthese reforms could be higher or lower than thatpresented here if the amount of ECEC used changes inresponse to the changes in the gross and net price ofchildcare.
Spending as a percentage of GDPIn 2008/09, UK GDP was £1,275 billion, so the increase inspending on ECEC in England (in table 6.10) represents0.2 to 0.4 per cent of GDP and the cost to theGovernment varies from negligible to 0.5 per cent ofGDP. However taking into account the costs of Scotland,Wales and Northern Ireland, the most expensive policy inthe table would result in higher Government spending of0.6 per cent GDP. It would be reasonable to assume thatthe costs of this reform will change over time broadly inline with GDP. (By 2020, there are forecast to be 7 percent more children under five than in 2008, and 11 percent more three- and four-year-olds, but this does notchange the estimated cost of the reforms reported here.)
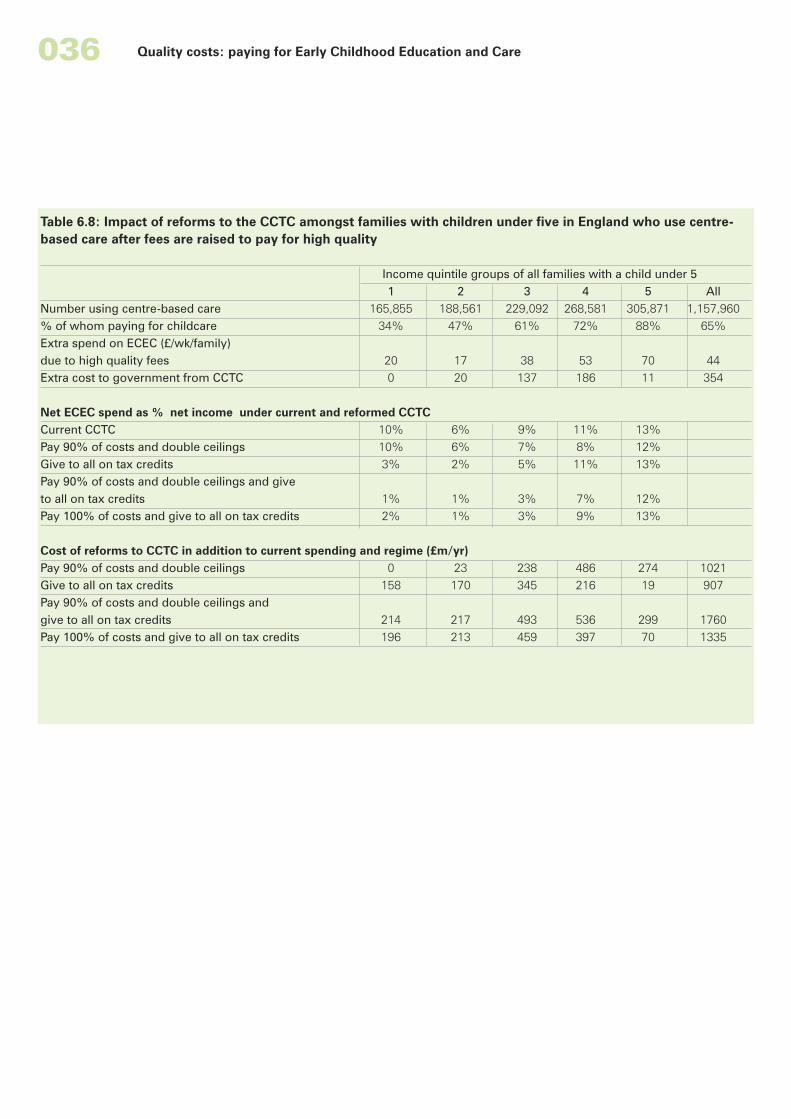
036 Quality costs: paying for Early Childhood Education and Care
Table 6.8: Impact of reforms to the CCTC amongst families with children under five in England who use centre-based care after fees are raised to pay for high quality
Income quintile groups of all families with a child under 51 2 3 4 5 All
Number using centre-based care 165,855 188,561 229,092 268,581 305,871 1,157,960% of whom paying for childcare 34% 47% 61% 72% 88% 65%Extra spend on ECEC (£/wk/family)due to high quality fees 20 17 38 53 70 44Extra cost to government from CCTC 0 20 137 186 11 354
Net ECEC spend as % net income under current and reformed CCTCCurrent CCTC 10% 6% 9% 11% 13%Pay 90% of costs and double ceilings 10% 6% 7% 8% 12%Give to all on tax credits 3% 2% 5% 11% 13%Pay 90% of costs and double ceilings and giveto all on tax credits 1% 1% 3% 7% 12%Pay 100% of costs and give to all on tax credits 2% 1% 3% 9% 13%
Cost of reforms to CCTC in addition to current spending and regime (£m/yr)Pay 90% of costs and double ceilings 0 23 238 486 274 1021Give to all on tax credits 158 170 345 216 19 907Pay 90% of costs and double ceilings andgive to all on tax credits 214 217 493 536 299 1760Pay 100% of costs and give to all on tax credits 196 213 459 397 70 1335
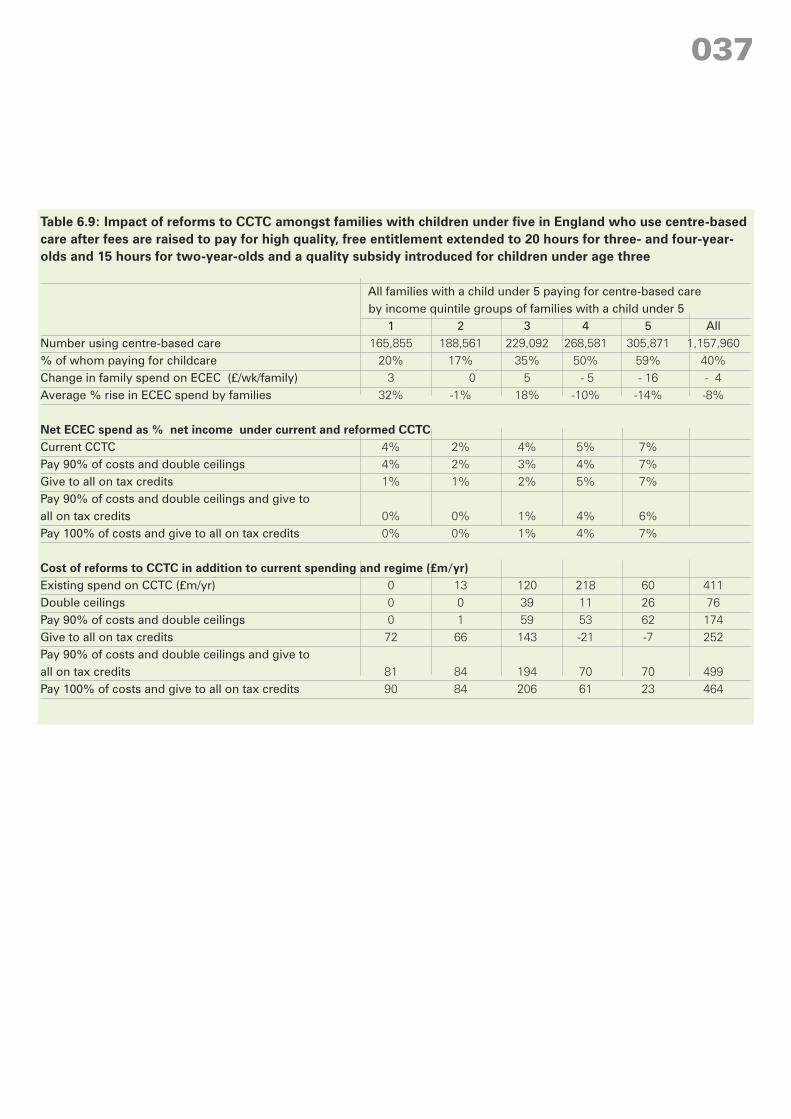
037
Table 6.9: Impact of reforms to CCTC amongst families with children under five in England who use centre-basedcare after fees are raised to pay for high quality, free entitlement extended to 20 hours for three- and four-year-olds and 15 hours for two-year-olds and a quality subsidy introduced for children under age three
All families with a child under 5 paying for centre-based careby income quintile groups of families with a child under 5
1 2 3 4 5 AllNumber using centre-based care 165,855 188,561 229,092 268,581 305,871 1,157,960% of whom paying for childcare 20% 17% 35% 50% 59% 40%Change in family spend on ECEC (£/wk/family) 3 0 5 - 5 - 16 - 4Average % rise in ECEC spend by families 32% -1% 18% -10% -14% -8%
Net ECEC spend as % net income under current and reformed CCTCCurrent CCTC 4% 2% 4% 5% 7%Pay 90% of costs and double ceilings 4% 2% 3% 4% 7%Give to all on tax credits 1% 1% 2% 5% 7%Pay 90% of costs and double ceilings and give toall on tax credits 0% 0% 1% 4% 6%Pay 100% of costs and give to all on tax credits 0% 0% 1% 4% 7%
Cost of reforms to CCTC in addition to current spending and regime (£m/yr)Existing spend on CCTC (£m/yr) 0 13 120 218 60 411Double ceilings 0 0 39 11 26 76Pay 90% of costs and double ceilings 0 1 59 53 62 174Give to all on tax credits 72 66 143 -21 -7 252Pay 90% of costs and double ceilings and give toall on tax credits 81 84 194 70 70 499Pay 100% of costs and give to all on tax credits 90 84 206 61 23 464
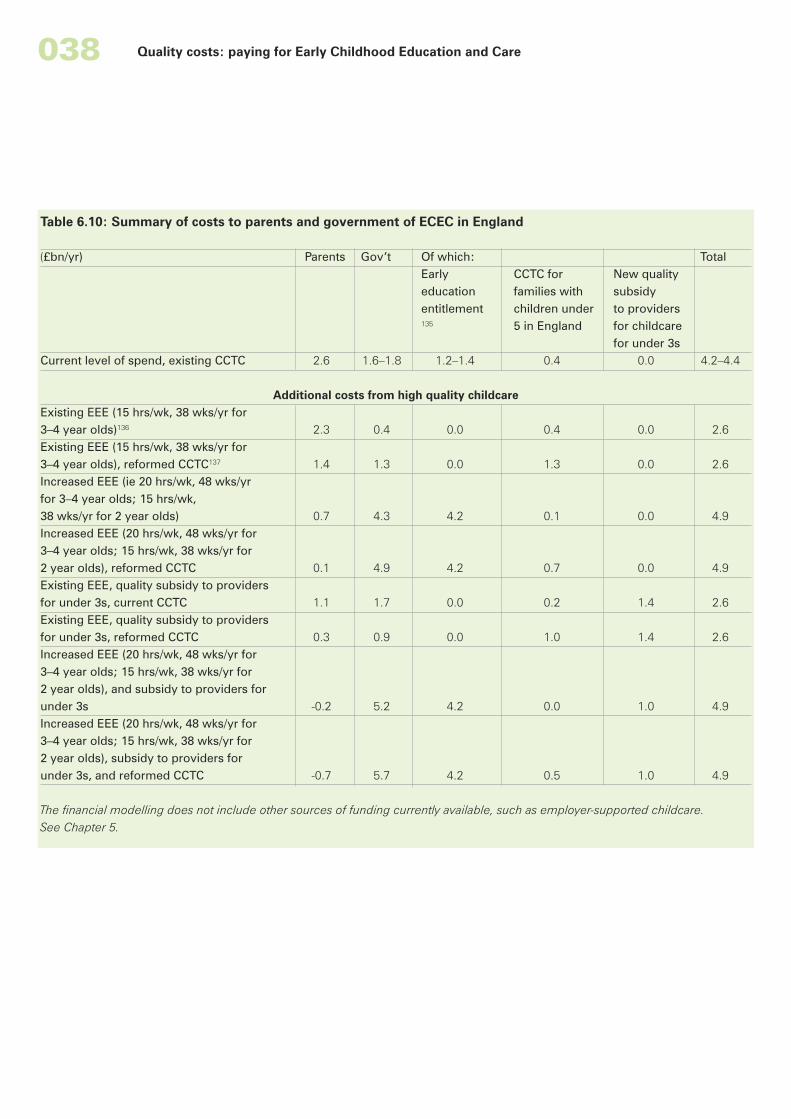
038 Quality costs: paying for Early Childhood Education and Care
Table 6.10: Summary of costs to parents and government of ECEC in England
(£bn/yr) Parents Gov’t Of which: TotalEarly CCTC for New qualityeducation families with subsidyentitlement children under to providers135 5 in England for childcare
for under 3sCurrent level of spend, existing CCTC 2.6 1.6–1.8 1.2–1.4 0.4 0.0 4.2–4.4
Additional costs from high quality childcareExisting EEE (15 hrs/wk, 38 wks/yr for3–4 year olds)136 2.3 0.4 0.0 0.4 0.0 2.6Existing EEE (15 hrs/wk, 38 wks/yr for3–4 year olds), reformed CCTC137 1.4 1.3 0.0 1.3 0.0 2.6Increased EEE (ie 20 hrs/wk, 48 wks/yrfor 3–4 year olds; 15 hrs/wk,38 wks/yr for 2 year olds) 0.7 4.3 4.2 0.1 0.0 4.9Increased EEE (20 hrs/wk, 48 wks/yr for3–4 year olds; 15 hrs/wk, 38 wks/yr for2 year olds), reformed CCTC 0.1 4.9 4.2 0.7 0.0 4.9Existing EEE, quality subsidy to providersfor under 3s, current CCTC 1.1 1.7 0.0 0.2 1.4 2.6Existing EEE, quality subsidy to providersfor under 3s, reformed CCTC 0.3 0.9 0.0 1.0 1.4 2.6Increased EEE (20 hrs/wk, 48 wks/yr for3–4 year olds; 15 hrs/wk, 38 wks/yr for2 year olds), and subsidy to providers forunder 3s -0.2 5.2 4.2 0.0 1.0 4.9Increased EEE (20 hrs/wk, 48 wks/yr for3–4 year olds; 15 hrs/wk, 38 wks/yr for2 year olds), subsidy to providers forunder 3s, and reformed CCTC -0.7 5.7 4.2 0.5 1.0 4.9
The financial modelling does not include other sources of funding currently available, such as employer-supported childcare.See Chapter 5.
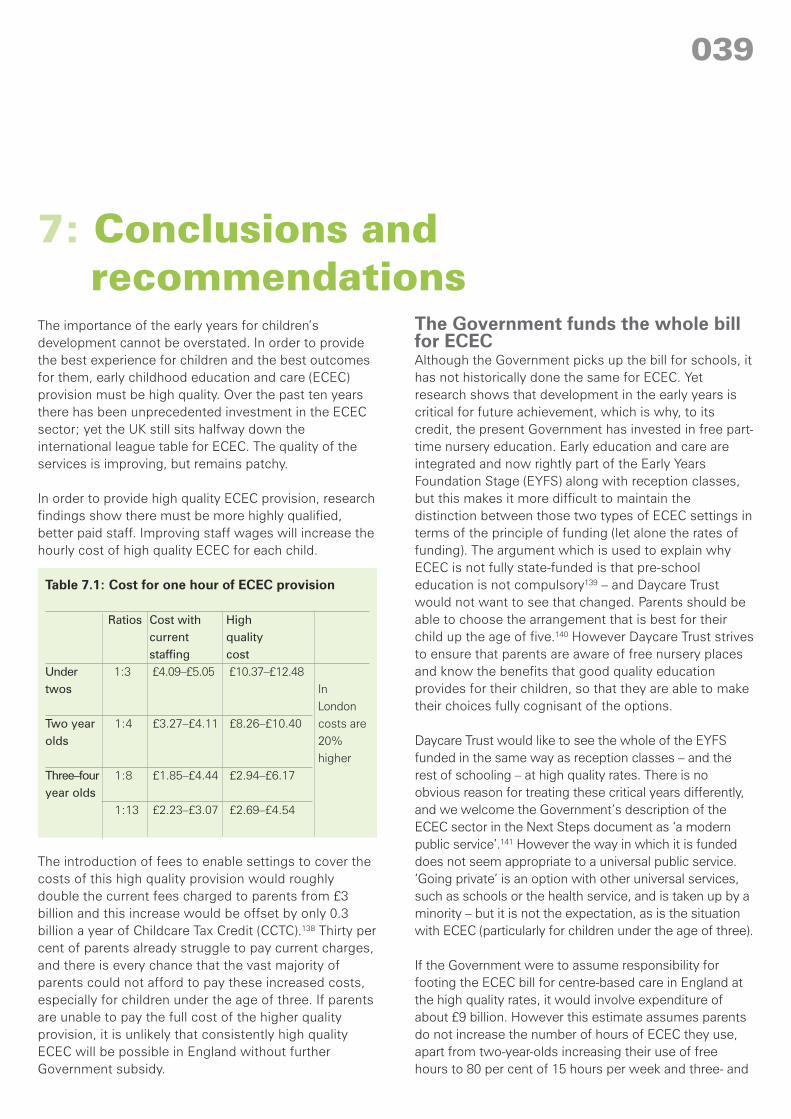
The importance of the early years for children’sdevelopment cannot be overstated. In order to providethe best experience for children and the best outcomesfor them, early childhood education and care (ECEC)provision must be high quality. Over the past ten yearsthere has been unprecedented investment in the ECECsector; yet the UK still sits halfway down theinternational league table for ECEC. The quality of theservices is improving, but remains patchy.
In order to provide high quality ECEC provision, researchfindings show there must be more highly qualified,better paid staff. Improving staff wages will increase thehourly cost of high quality ECEC for each child.
Table 7.1: Cost for one hour of ECEC provision
Ratios Cost with Highcurrent qualitystaffing cost
Under 1:3 £4.09–£5.05 £10.37–£12.48twos In
LondonTwo year 1:4 £3.27–£4.11 £8.26–£10.40 costs areolds 20%
higherThree–four 1:8 £1.85–£4.44 £2.94–£6.17year olds
1:13 £2.23–£3.07 £2.69–£4.54
The introduction of fees to enable settings to cover thecosts of this high quality provision would roughlydouble the current fees charged to parents from £3billion and this increase would be offset by only 0.3billion a year of Childcare Tax Credit (CCTC).138 Thirty percent of parents already struggle to pay current charges,and there is every chance that the vast majority ofparents could not afford to pay these increased costs,especially for children under the age of three. If parentsare unable to pay the full cost of the higher qualityprovision, it is unlikely that consistently high qualityECEC will be possible in England without furtherGovernment subsidy.
The Government funds the whole billfor ECECAlthough the Government picks up the bill for schools, ithas not historically done the same for ECEC. Yetresearch shows that development in the early years iscritical for future achievement, which is why, to itscredit, the present Government has invested in free part-time nursery education. Early education and care areintegrated and now rightly part of the Early YearsFoundation Stage (EYFS) along with reception classes,but this makes it more difficult to maintain thedistinction between those two types of ECEC settings interms of the principle of funding (let alone the rates offunding). The argument which is used to explain whyECEC is not fully state-funded is that pre-schooleducation is not compulsory139 – and Daycare Trustwould not want to see that changed. Parents should beable to choose the arrangement that is best for theirchild up the age of five.140 However Daycare Trust strivesto ensure that parents are aware of free nursery placesand know the benefits that good quality educationprovides for their children, so that they are able to maketheir choices fully cognisant of the options.
Daycare Trust would like to see the whole of the EYFSfunded in the same way as reception classes – and therest of schooling – at high quality rates. There is noobvious reason for treating these critical years differently,and we welcome the Government’s description of theECEC sector in the Next Steps document as ‘a modernpublic service’.141 However the way in which it is fundeddoes not seem appropriate to a universal public service.‘Going private’ is an option with other universal services,such as schools or the health service, and is taken up by aminority – but it is not the expectation, as is the situationwith ECEC (particularly for children under the age of three).
If the Government were to assume responsibility forfooting the ECEC bill for centre-based care in England atthe high quality rates, it would involve expenditure ofabout £9 billion. However this estimate assumes parentsdo not increase the number of hours of ECEC they use,apart from two-year-olds increasing their use of freehours to 80 per cent of 15 hours per week and three- and
7: Conclusions andrecommendations
039
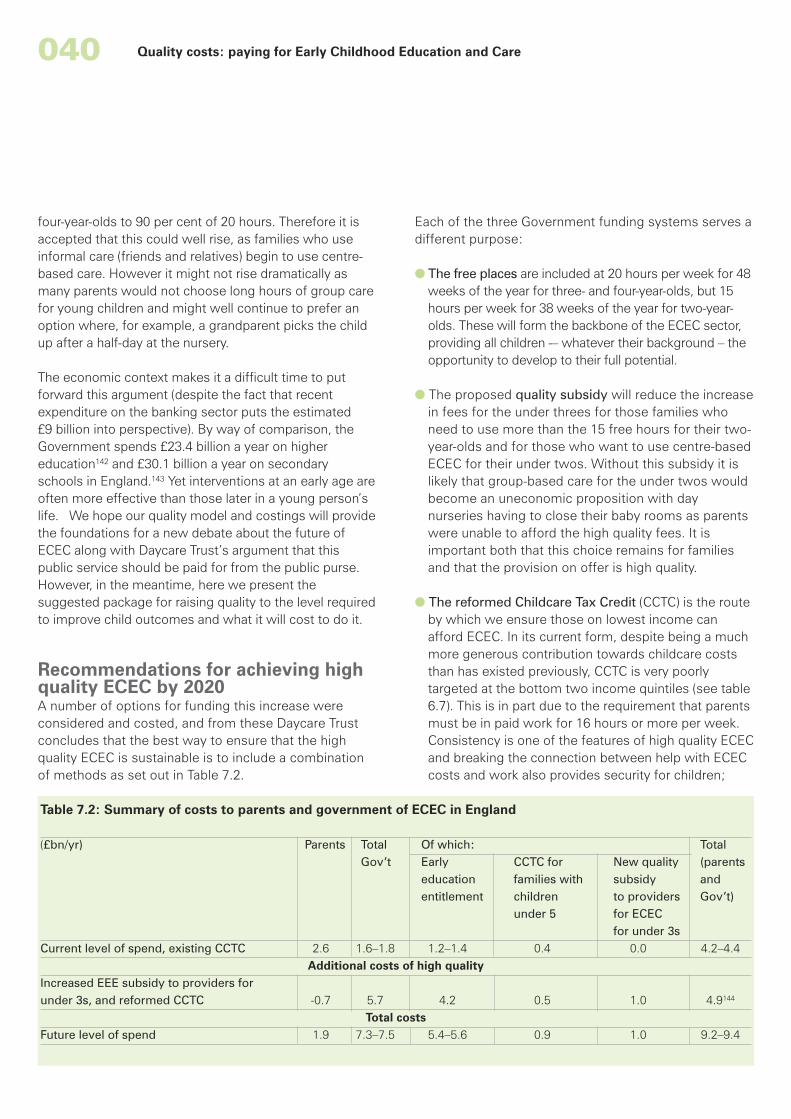
040 Quality costs: paying for Early Childhood Education and Care
four-year-olds to 90 per cent of 20 hours. Therefore it isaccepted that this could well rise, as families who useinformal care (friends and relatives) begin to use centre-based care. However it might not rise dramatically asmany parents would not choose long hours of group carefor young children and might well continue to prefer anoption where, for example, a grandparent picks the childup after a half-day at the nursery.
The economic context makes it a difficult time to putforward this argument (despite the fact that recentexpenditure on the banking sector puts the estimated£9 billion into perspective). By way of comparison, theGovernment spends £23.4 billion a year on highereducation142 and £30.1 billion a year on secondaryschools in England.143 Yet interventions at an early age areoften more effective than those later in a young person’slife. We hope our quality model and costings will providethe foundations for a new debate about the future ofECEC along with Daycare Trust’s argument that thispublic service should be paid for from the public purse.However, in the meantime, here we present thesuggested package for raising quality to the level requiredto improve child outcomes and what it will cost to do it.
Recommendations for achieving highquality ECEC by 2020A number of options for funding this increase wereconsidered and costed, and from these Daycare Trustconcludes that the best way to ensure that the highquality ECEC is sustainable is to include a combinationof methods as set out in Table 7.2.
Each of the three Government funding systems serves adifferent purpose:
� The free places are included at 20 hours per week for 48weeks of the year for three- and four-year-olds, but 15hours per week for 38 weeks of the year for two-year-olds. These will form the backbone of the ECEC sector,providing all children -– whatever their background – theopportunity to develop to their full potential.
� The proposed quality subsidy will reduce the increasein fees for the under threes for those families whoneed to use more than the 15 free hours for their two-year-olds and for those who want to use centre-basedECEC for their under twos. Without this subsidy it islikely that group-based care for the under twos wouldbecome an uneconomic proposition with daynurseries having to close their baby rooms as parentswere unable to afford the high quality fees. It isimportant both that this choice remains for familiesand that the provision on offer is high quality.
� The reformed Childcare Tax Credit (CCTC) is the routeby which we ensure those on lowest income canafford ECEC. In its current form, despite being a muchmore generous contribution towards childcare coststhan has existed previously, CCTC is very poorlytargeted at the bottom two income quintiles (see table6.7). This is in part due to the requirement that parentsmust be in paid work for 16 hours or more per week.Consistency is one of the features of high quality ECECand breaking the connection between help with ECECcosts and work also provides security for children;
Table 7.2: Summary of costs to parents and government of ECEC in England
(£bn/yr) Parents Total Of which: TotalGov’t Early CCTC for New quality (parents
education families with subsidy andentitlement children to providers Gov’t)
under 5 for ECECfor under 3s
Current level of spend, existing CCTC 2.6 1.6–1.8 1.2–1.4 0.4 0.0 4.2–4.4Additional costs of high quality
Increased EEE subsidy to providers forunder 3s, and reformed CCTC -0.7 5.7 4.2 0.5 1.0 4.9144
Total costsFuture level of spend 1.9 7.3–7.5 5.4–5.6 0.9 1.0 9.2–9.4

041
they will be far less likely to have to leave their nurseryif a parent loses a job. In addition under the currentscheme even those on the lowest income have to pay20 per cent of the ECEC costs themselves, which canleave them worse off in paid work. Our proposedreforms addresses both these issues – removing CCTCfrom Working Tax Credit and paying up to 100% ECECcosts – and is very well targeted at families on thelowest incomes.145
Currently, parents are paying approximately 60 per centof the cost of ECEC. After this full package of reforms,parents would be paying approximately 20 per cent ofthe total increased spend. This is much more in line withother countries offering high quality ECEC provision.
Without this level of subsidy it is most unlikely that highquality ECEC provision will ever be delivered consistentlyacross England. The failure to achieve this would leavechildren failing to fulfil their full potential and the attainmentgap remaining between the children of disadvantagedfamilies and others. This is not a price worth paying.
These recommendations begin from the existing mixedmarket. This pragmatic approach has in part restrictedthe project’s ability to make more radical suggestions –such as the transfer of all group provision into themaintained sector, although this might follow if theGovernment were ever to take over fundingresponsibility for all ECEC provision. Daycare Trust hassome sympathy for this proposition given the evidencethat the maintained sector is generally currently ofhigher quality than the private, voluntary andindependent (PVI) sector and, indeed, its staffing is veryclose to that in the Daycare Trust quality model.However there is an argument that the PVI sector hasnot had the funding to be able to prove itself the equalof the maintained sector in terms of quality, andtherefore it is reasonable to give settings the chance todevelop their services with the help of better qualifiedstaff before rushing to any more revolutionaryproposals. The PVI representatives have been lobbyingfor a ‘level playing field’ on funding for some time but infact it is the maintained sector which is discriminatedagainst in the Childcare Act 2006. Daycare Trustrecommends that the section which states thatmaintained provision should be the provision of lastresort146 should be removed so that it does not actagainst the quest to improve quality which DaycareTrust believes is paramount.
Milestones for phasing in high qualityECEC provisionAs much as Daycare Trust would like to see high qualityECEC provision for all pre-school children tomorrow, thisis impractical. Given the scale of this endeavour and thecurrent economic context, rather than expecting themove to the high quality model to happen immediately,Daycare Trust suggests a timetable of introducing thislevel of quality over the next ten years to 2020. Thisallows both for the public expenditure to be found forthis important task, but also for a new generation ofgraduates to be recruited to the profession and forsettings to be able to train current staff.
Childcare Tax Credit:2011: Increase cap from 80% to 90% of childcare costs.2012: Remove 90% cap, allowing 100% of costs to beincluded in the means-test.2014: Decoupling CCTC from Working tax Credit andhence the ‘work test’.
Quality premium and increased hourly rates for freeplaces for two-year-olds:Although these should begin as soon as possible, theexpenditure in the first instance would be negligible asthe vast majority of settings would not be able to meetthe qualifications criteria. As the qualifications of theworkforce improve, more settings would becomeentitled to the payments and Government expenditurewould increase.
Increased hours for extension of free places:2010: Extend free hours for three- and four-year-olds to15 per week (already budgeted).2012: Extend free hours for one-third of two-year-olds to10 hours per week (already in budget – but difficult toensure that sector will be ready as can only be given to‘good’ and ‘outstanding’ settings).2014: Extend free hours to all two-year-olds for 12 and ahalf hours per week (again only in ‘good’ and‘outstanding’ settings).
At 2015 a review of progress of the improvements inquality, the capacity in the sector and the demand fromparents could be undertaken to determine the schedulefor the next five years, and the priority in terms ofextending the free hours for three- and four-year-olds to20 per week, and extending free hours for two-year-oldsto 15 per week.
042 Quality costs: paying for Early Childhood Education and Care
Invest to SaveDaycare Trust is acutely aware that it is announcing theneed to invest a large sum of money to bring the UK’sECEC provision up to the Daycare Trust high qualitymodel during a recession – when the political talk is allabout public expenditure cuts. However, we contend thatinvestment in ECEC is wise as it provides children withthe grounding to reach their potential later in life, as wellas providing an investment on jobs in the short-term.There have been some attempts to quantify futuresavings to the public purse from investment in goodquality ECEC provision. Although they are not applicableto every child, they do give an indication of the paybackfor this investment in high quality ECEC fordisadvantaged children. For example, the PerryHighScope pre-school project in USA showed that, foreach $1 invested, $16 was saved by the age of 40,147 andit can be argued that this is a better return than otherprogrammes, such as Head Start, with smaller effectswhich do not last as long.148 A recent report published byAction for Children and the New Economics Foundationstated that investing in early intervention and universalservices, including ECEC, for children and families wouldsave the UK economy £486bn over the next 20 years andimprove child well-being.149
The implementation of Daycare Trust’s package wouldleave the expenditure on ECEC at around 1% GDP, stillbelow countries such as Sweden and Denmark, butmeeting levels of funding recommended by the OECDand Unicef as an initial target. Furthemore, we considerthat closing the gap between the outcomes of the mostand least advantaged children will contribute towards areduction in inequality, enhanced social mobility andincreased prosperity.
043
Parental leaveParental leave is a very relevant policy issue,especially for the first 18 months of a child’s life.Daycare Trust would like to see links being madebetween ECEC policy and parental leave. Howeverthis is outside the scope of this project, but it isrecommended that interested parties take a look atthe Equality and Human Rights Commission’sWorking Better project which will be attempting totake these discussions further in 2010.
ChildmindersThe Daycare Trust quality model cannot apply tochildminders – it only applies to group care. There wasnot the research evidence to draw upon regardingquality and childminders. There might be a way inwhich the model could be adapted for childminderswithin a credited network if led by a graduate, but thisis a separate piece of work. However the costs wouldnot necessarily be as high as group care. There iscertainly a role for childminders across the age groups,and Daycare Trust would not want this omission fromthe project to infer otherwise.
Childcare for the children of studentsThere is currently an issue with many students andpotential students being unable to afford ECEC. This isdespite New Deal for Lone Parents and numerousschemes by this Government, including the recent FreeChildcare for Training and Learning for Work. One of theproblems is the myriad of complicated schemes, usuallywith limited funds, and between which some studentsstill fall. If parents are to be able to take up employment inthe future it is important that this is solved in a way whichis not over-complicated. Daycare Trust suggests that bothincreasing free places and de-coupling CCTC from the‘work test’ would remove this problem in the future.
Alternative means-tested schemesIn Sweden parents pay a contribution to the cost of thechildcare they use but it is capped at 3 per cent of theirgross income. However the stakeholders in this projectfelt that this was not appropriate for the UK’s mixedmarket. Furthermore, the general consensus was that,although there were many problems with theadministration of tax credits, for the foreseeable future
these could be reformed in such a way as to allowthem to continue to be the vehicle for the means-tested element of support for ECEC. Wholesalechange was not welcomed at this time.
Contributions by employersThe contribution made by employers is not significantat the moment, as even the vast majority of so-called‘employer-supported childcare’ is in fact paid for by theGovernment through forgone Income Tax and NationalInsurance Contributions. Yet one the beneficiaries ofECEC are employers, who gain in terms of staff whowould otherwise be occupied with caring for theirchildren. Although the aim of employer-supportedchildcare was to encourage employers to contribute tochildcare costs, in reality the vast majority of employersgain financially from the tax arrangements. Indeed,even the threat of a very small contribution to somemothers on additional maternity leave was enough forsome employers to review existing voucher schemes.Daycare Trust and other stakeholders consulted in thisproject felt that is was extremely unlikely thatemployers could be persuaded to contribute to ECECcosts directly. However the Government might want totake into account the gain to employers when decidingon ways in which to raise the revenue to improve thequality in ECEC.
As mentioned in Chapter 5, Gordon Brown announcedearlier this year that tax breaks for employer-supported childcare will be withdrawn to new entrantsfrom 2011 and entirely in 2015. Despite theGovernment asserting that many parents affected bythis change will be able to receive the childcareelement of Working Tax Credit, many families will notbenefit from the childcare element at all. DaycareTrust will be encouraging those parents to take-upvouchers before 2011: for further details seehttp://www.daycaretrust.org.uk. At the time of writing,there is a campaign to save childcare vouchers andthere have been press reports that the tax breaks mayonly be withdrawn for higher rate taxpayers. However,there has been no announcement. For the purposes ofthis project it has not been assumed they will remainand therefore vouchers have not been included in thecosted landscape for the future.
Avenues that have not been pursued
044 Quality costs: paying for Early Childhood Education and Care
Appendix A:Membership of project advisory boardKathy Sylva University of OxfordAllan Dodd Mouchel Consulting Ltd.Paul Gregg University of BristolIvana La Valle National Children’s Bureau
(previously of National Centre forSocial Research)Department for Children, Schoolsand Families
Laura Mountford HM TreasuryPauline Jones Children’s Workforce Development
CouncilCaroline Bryson Nuffield FoundationDavid Wilkinson National Institute of Economic and
Social Research
Appendix BRoundtable 1: what is high qualityearly childhood education and care?Attendees included representatives from:Department for Children, Schools and FamiliesEarly Childhood ForumHM TreasuryInternational Centre for the Mixed Economy ofChildcare, University of East LondonNational Centre for Social ResearchNational Childminding AssociationNational Children’s BureauNational Day Nurseries AssociationNational Institute of Social and Economic ResearchNuffield FoundationOfstedPre-School Learning AllianceSocial Market FoundationUniversity of Oxford
Roundtable 2: Funding high qualityearly childhood education and careAttendees included representatives from:Department for Children, Schools and FamiliesDepartment for Work and PensionsGingerbreadHMRCHM TreasuryICMEC, University of East LondonInstitute for Fiscal StudiesLondon CouncilsLondon Development AgencyLondon Borough of Tower HamletsRochdale Metropolitan Borough CouncilMouchel Consulting LtdNational Centre for Social ResearchNational Children’s BureauNational Day Nurseries AssociationNational Institute for Economic and Social ResearchSocial Market FoundationUniversity of Oxford
References
045
1 DfES et al (2004) Choice for parents, the best start forchildren: a ten year strategy for childcare, DfES: London2 DfES et al (2004) ibid3 The Childcare Act 2006, available at http://www.opsi.gov.uk/acts/acts2006/pdf/ukpga_20060021_en.pdf4 Nicholson et al (2008) Childcare and Early Years ProvidersSurvey 2007, Research Report DCSF-RR047, DCSF: London.The 2008 data was published in 2009 near the end of theQuality costs project, so 2007 data from the 2008 report hasbeen used.5 Ofsted (2008) The Annual Report of Her Majesty’s ChiefInspector of Education, Children’s Services and Skills 2007/08.The Stationery Office.6 Nicholson et al (2008) op cit (note 4)7 See eg, Sylva, K et al (2004) The Effective Provision of Pre-School Education (EPPE) Project: Final Report, DfES: London;and Sylva, K et al (2004b) The Effective Provision of Pre-SchoolEducation (EPPE) Project: Findings from the Early PrimaryYears, DfES: London8 Olmsted and Montie (2001) Early childhood settings in 15countries: What are their structural characteristics? HighScopeEducational Research Foundation: Michigan9 Mooney, A et al (2003) Early Years and Childcare InternationalEvidence Project, Summary and associated seminar papers,DfES, London; Mooney, A et al (2003b) Family day care:international perspectives on policy, practice and quality,Jessica Kingsley Publishers Ltd, London10 OECD (2006) Starting strong II: early childhood educationand care, p.128, OECD: Paris11 Hill, M and Knights, E (2009) Quality costs working paper 1:what is high quality early childhood education and care?Daycare Trust, page 8.12 Melhuish, EC (2004) A literature review of the impact of earlyyears provision on young children, with emphasis given tochildren from disadvantaged backgrounds, prepared for theNational Audit Office, Institute for the Study of Children,Families and Social Issues, Birkbeck College13 Sylva, K and Roberts, F, ‘Quality in early childhood education:evidence for long-term effects’, in Pugh, G, Contemporaryissues in the early years (in press)14 For a fuller discussion, see Leach, P (2009) Child Care Today:What We Know and What We Need to Know, chapter 13,Polity: Cambridge15 See eg, Garces, Thomas and Currie (2002) Longer termeffects of Head Start, NBER Working Paper 8054; Sylva, K et al(2004) op cit (note 7)16 Hill, M and Knights, E (2009) op cit (note 11)17 Melhuish, EC (2004) op cit (note 12)18 Melhuish, EC (2004b) Child benefits: The importance ofinvesting in quality childcare, Daycare Trust: London19 Sylva, K et al (2004) op cit (note 7)20 Mathers, S and Sylva, K (2007) National evaluation of theNeighbourhood Nurseries Initiative: The relationship betweenquality and children’s behavioural development, ResearchReport SSU/2007/FR/022, DCSF: London
21 Melhuish, EC (2004) op cit (note 12)22 Melhuish, EC (2004b) op cit (note 18)23 There is further detail on how poor quality childcareincreases the risk of producing poorer outcomes in theaccompanying Working Paper 1: What is high quality earlychildhood education and care?; it is difficult to summarisedefinitively in terms of hours as different studies aremeasuring slightly different behaviours24 Smith, R et al (2009) Early education pilot for two year oldchildren: evaluation, Research Report DCSF-RR134, DCSF:London25 Belsky et al (2007) The NICHD early child care researchnetwork: are there long-term effects of early child care? ChildDevelopment, vol.78, issue 2, pp.687–70126 Smith, Speight and La Valle (2009) Fitting it all together: howfamilies arrange their childcare and the influence on homelearning DCSF Research Report RR090; DCSF, London.27 Hansen, K and Hawkes, D (2009) Early childcare and childdevelopment, Journal of Social Policy vol.38, issue 2, p.21128 See eg, NICHD Early Child Care Research Network (2000)The relation of child care to cognitive and languagedevelopment, Child Development, vol.71, issue 4, pp.960–980;and Munton, Mooney and Rowland (1995) Deconstructingquality: A conceptual framework for the new paradigm in daycare provision for the under 8s, Early Childhood Developmentand Care, vol.114, pp.11–2329 Melhuish, EC (2004) op cit (note 12)30 Melhuish, EC (2004b) op cit (note 18)31 For example Melhuish, EC (2004b) op cit (note 18)32 Melhuish, EC (2004b) op cit (note 18)33 Sylva, K et al (2004) op cit (note 7)34 Melhuish (2004b) op cit (note 18) page 6.35 Waldfogel, J (2006), What Children Need, Harvard UniversityPress, Massachusetts36 Hill, M and Knights, E (2009) op cit (note 11)37 Sylva, K et al (2004) op cit (note 7)38 Mathers, S and Sylva, K (2007) op cit (note 20)39 Ruopp, R et al (1979) Children at the Centre: Final report ofthe National Day Care Study, Abt Book: Cambridge, Mass;Howes, C, Smith, E and Galinsky, E (1995) The FloridaChildcare Improvement Study, Family and Work Institute: NewYork40 Melhuish, EC (2004b) op cit (note 18)41 Siraj-Blatchford (2002) Researching Effective Pedagogy in theEarly Years, DfES Research Report 356, DfES: London42 Mathers, S and Sylva, K (2007) op cit (note 16)43 Melhuish, EC (2004b) op cit (note 20)44 Melhuish, EC (2004b) op cit (note 18)45 Phillips, D et al (2002) Within and Beyond the ClassroomDoor: Assessing quality in child care centres, Early ChildhoodResearch Quarterly, vol.15, issue 4, pp. 475–49646 Cooke, G and Lawton, K (2008) For love or money: payprogression and professionalisation in the early yearsworkforce, IPPR: London
046 Quality costs: paying for Early Childhood Education and Care
47 See eg, Melhuish EC (2004b) op cit (note 18); Mooney, A etal (2003) op cit (note 9); and Munton et al (2002) Research onratios, group size and staff qualifications training in early yearsand childcare settings, Research Report RR320, DfES: London48 Sylva, K et al (2004) op cit (note 7)49 Mooney, A et al (2003) op cit (note 9)50 Munton et al (2002) op cit (note 47)51 The welfare requirements in EYFS state that ‘Whereverpossible, there should be access to an outdoor play area, andthis is the expected norm for providers. In provision whereoutdoor play space cannot be provided, outings should beplanned and taken on a daily basis (unless circumstances makethis inappropriate, for example unsafe weather conditions).’52 Sylva, K et al (2004) op cit (note 7)53 Munton et al (2002) op cit (note 47)54 OECD (2006) op cit (note 10)55 Nicholson et al (2008) op cit. (note 4)56 Daycare Trust (2008) Raising the bar: What next for the earlychildhood education and care workforce? Daycare Trust:London57 Further requirements are also included relating to thequalification levels of additional staff and the times at whichthese ratios apply58 Melhuish, EC (2004) op cit (note 12); Munton et al (1995) opcit (note 24); Bertram, T, presentation entitled ‘AlternativeNarratives of Quality’ to NIESR conference Measuring theQuality of Early Years Provision, 10 October 200859 Melhuish, EC (2004) op cit (note12)60 Eg HEDRA Consulting (2007) What is the impact and costimplication of extending the free early education entitlement?:Final report, DCSF: London; Daycare Trust (2009) SingleFunding Formula for early education for three- and four- yearolds in Bromley, Daycare Trust: London61 In the first iteration of the model it was suggested to setother costs as half of the staff costs (ie 33% of total costs) asthere were some examples where this was the case, but thislevel was felt by participants at the roundtable in September2009 to be a little too high. Therefore a figure was used whichis more typical, rather than at the top end of the current costs.62 Nicholson et al (2008) op cit (note 4); at the time of themodelling, the 2008 data was not available63 For more detail on the calculations involved in the number ofplaces per age group, and the numbers for different types ofECEC settings, please refer to Working Paper 2: What is thecost of quality?64 Costs for full daycare are shown here as an example. Thefinal tables below give the costs for all settings65 Gruescu, S (2009) Quality costs Working paper 2: what is thecost of quality? Daycare Trust66 The relevant figures for Model 2 are contained in the Appendixto Working Paper 2: What is the cost of quality? (note 65)67 Some staff in full daycare in children’s centres will receive alocal authority pension but as a significant minority of fulldaycare in children’s centres is run by PVI providers (39% in2007), this has not been included and so it may slightly under-represent the current cost in children’s centres68 Nicholson et al (2008) op cit. (note 4)69 Phillips, R et al (2009) Childcare and Early Years ProvidersSurvey 2008, Research Report DCSF-RB164, DCSF: London
70 For more detail on these surveys and their methodologies,please refer to Working Paper 3: What do parents pay? TheNational Childminding Association Membership Survey wasalso reviewed, but, as this project went on to consider groupcare only, the NCMA’s findings are not discussed here.71 Daycare Trust (2009) Childcare Costs Survey 2009, DaycareTrust: London72 Speight et al (2009) Childcare and Early Years Survey ofParents 2008, Research Report DCSF-RR136, DCSF: London;and Kazimirski et al (2008) Childcare and Early Years Survey2007: Parents’ Use, Views and Experiences, Research ReportDCSF-RR025, DCSF: London73 Nicholson et al (2008) op cit (note 4)74 Conolly, A and Kerr, J (2008) Families with Children in Britain:Findings from the 2006 Families and Children’s Study (FACS),DWP Research Report No.486, DWP: London75 Butt, Goddard, La Valle and Hill (2007) Childcare nation?:Progress on the childcare strategy and priorities for the future,Daycare Trust/National Centre for Social Research76 HMRC (2009) Child and Working Tax Credit Statistics: April2009, HMRC; online at http://www.hmrc.gov.uk/stats/personal-tax-credits/cwtc-apr09.pdf77 DWP (2009) Family Resources Survey United Kingdom 2007–08, DWP; online at http://research.dwp.gov.uk/asd/frs/index/publications.asp78 Blackburn, P (2008) Children’s Nurseries: UK Market Report2008, Laing & Buisson: London79 For further detail, see Gruescu, S (2009) Quality CostsWorking Paper 4: International comparisons of high qualityearly childhood education and care80 As at exchange rate on 11 November 200981 This lower figure was taken from the Laing and Buissonreport, which reports ‘full time’ provision. It has been assumedthat this is for 50 hours per week, but if the number of hoursrequested was lower, this would give a higher hourly fee82 Smith, R et al (2009) op cit (note 24)83 DCSF (2009) Statistical First Release: Provision for childrenunder five years of age in England: January 2009, SFR/2009,DCSF; http://www.dcsf.gov.uk/rsgateway/DB/SFR/s000848/SFR11_2009.pdf84 Speight et al (2009) op cit (note 72)85 Butt et al (2007) op cit (note 75)86 Pre-school Learning Alliance (2007) Nursery EducationFunding and the Extension of the Free Entitlement: Findings ofa Pre-school Alliance Survey, Pre-school Learning Alliance87 NDNA (2006) The Free Entitlement and the Real Cost ofChildcare in Day Nurseries, NDNA88 Under section 52 of the School Standards and FrameworkAct 1998, all local authorities must complete budget returnsfor their education spending89 Section 52 Benchmarking 2008/09: Free entitlement to EarlyYears Provision Table, http://www.dcsf.gov.uk/localauthorities/section52/subPage.cfm?action=section52.default&ID=8990 Data is not available for every local authority so it is notpossible to get a total figure for spend. Also local authoritieswill often use a small percentage of the money foradministration91 Research undertaken by Mouchel Management Consultingon 2008-09 Section 52 Statements as a part of its work on the
047
Single Funding Formula for the Government Office for London92 DCSF (2009) Implementing the Early Years Single FundingFormula: Practice Guidance July 2009, DCSF93 DCSF (2009) ibid, p.3194 HMRC (2009) Child and Working Tax Credit Statistics:December 2008, HMRC; http://www.hmrc.gov.uk/stats/personal-tax-credits/cwtc-dec08.pdf95 HMRC (2009) op cit (note 76)96 HMRC (2008) op cit (note 94)97 Average fees for a full time nursery place for a child agedover 2 from 2009 Daycare Trust childcare costs survey98 Millar, J (2008) ‘Making work pay, making tax credits work:An assessment with specific reference to lone-parentemployment’, International Social Security Review, vol. 61,issue 2, p.2199 We are still awaiting the publication of the CAP05 evaluation100 Speight et al (2009) op cit (note 72)101 If both direct payments and direct provision had grown atthe same rate as the childcare vouchers compared to the 2005figures from Kazimirski et al (note 102 below), there would bean estimated 11,199 employers offering direct payments tochildcare providers and 15,231 offering direct provision ofchildcare102 Kazimirski, A et al (2006) Monitoring of the reform of theIncome Tax and National Insurance rules for employer-supported childcare: A study of provision and experiences ofemployers, HMRC103 Speight et al (2009) op cit (note 72)104 Details available on request from [email protected] Further information and references are available in WorkingPaper 4: International comparisons of high quality earlychildhood education and care services106 OECD (2006) op cit (note 10), p.114107 Spending on the childcare element of WTC in England is83% of the UK spending of £1,360m (see Working Paper 5:Funding options for high quality early childhood education andcare), thus the figures have been adjusted accordingly.108 The 83% spend in England on the childcare element abovehas also been applied to employer-supported childcare: thismay not be the precise figure but allows us to recognise thatsome spending on employer-supported childcare occurs in theother UK countries109 GDP at 2008 levels: £1,275,175 million. The Office for NationalStatistics estimate that England’s share of gross value added(GVA) is 85.9% of the UK's total. GVA is similar to GDP, thereforeit can be assumed that England’s share of GDP is 85.9%110 OECD (2006) op cit. (note 10)111 Adamson (2008) The child care transition: A league table ofearly childhood education and care in economically advancedcountries, UNICEF Innocenti Research Centre Report Card 8,UNICEF112 NAO (2004) Early Years: Progress in Developing High QualityChildcare and Early Education Accessible to All, HC268,Session 2003–04, HMSO113 Brewer, M. (2009) Quality costs Working paper 5: fundingoptions for high quality early childhood education and care,Daycare Trust114 See DCSF press release dated 19 October 2009, online athttp://www.dcsf.gov.uk/pns/DisplayPN.cgi?pn_id=2009_0193
115 The data used for this calculation pre-dates the piloting offree places for two-year-olds; although the Prime Minister hadannounced the extension of this provision, as no firmtimetable exists at the time of writing, these have beenignored for the purposes of the calculation116 These calculations are based on the top of the range ofhourly costs for each age group, and using the 1:13 ratio forthree- and four-year-olds as the staff in the high quality modelmeet the qualifications requirement117 The number of families within these quintiles is not thesame as the income quintiles groups which are definedrelative to income distribution of all families in England with achild under five (as estimated by IFS’s model TAXBEN) basedon net income NOT deducting childcare costs. Based on FRS2006–07 data and 2009–10 tax and benefit system118 ‘Net income’ here does deduct childcare costs119 The percentage used was that required to increase currentcosts as 1:8 ratio to high quality costs at 1:13120 Adamson (2008) op cit (note 111)121 This is the allocation made from DCSF to local authoritiesoutside London (not the hourly payment made by localauthorities which varies); the allocation for London authoritiesis £6 per hour122 If the top of the high quality range - £4.50 per hour forthree- and four-year-olds and £10.40 for two-year-olds were tobe paid, this could mean that some payments for nurseryschools would be in danger of being reduced from theircurrent levels of £5–£7; Daycare Trust suggests some furtherwork needs to be done to work out if settings currentreceiving this higher rate do actually need it to cover theircosts. The use of the 1:8 ratio for three-year-olds should alsobe considered as otherwise there is a large reduction offunding on a child’s third birthday as the ratios fall from 1:4 to1:13. However although adopting the payment associated withthe1:8 ratio would give more to settings, it would alsoincrease the Government contribution required over theamounts reported in this chapter.123 Social Market Foundation, with assistance from DaycareTrust, attempted to compare the results from the costsmodelling with the actual costs of existing provision. It wasextremely difficult to obtain precise costings information directfrom settings. Other sources such as those available fromproviders’ representative organisations, local authorities orDCSF were also considered. However none of the informationwhich was gathered led to the conclusion that the currentpayments could not cover the costs of providing ECEC.124 Brewer, M. (2009) op cit. (note 113)125 Lobbying has been undertaken over a number of years onthis point (as well as on the levels being paid by some localauthorities); see for example http://www.dailymail.co.uk/news/article-412595/Nursery-places-jeopardy-government-plan-stop-fees.html; http://www.guardian.co.uk/education/2009/nov/02/state-nurseries-funding-education;http://www.cypnow.co.uk/Archive/965906/Early-years---Nurseries-air-funding-formula-fears/126 There may have to be a right of appeal for those withpremises costs higher than the 33% staff costs used in thehigh quality model (additional premises costs would only bepayable where this was deemed reasonable given the localmarket). Alternatively some more high cost local authoritiesmight want to increase the basic rate of their SFF paymentsabove 33%
048 Quality costs: paying for Early Childhood Education and Care
127 Early Education (2009) Implementing the Single FundingFormula: How is it affecting you? A progress report on how theimplementation of the Single Funding Formula is impacting onMaintained Nursery Provision and Children’s Centres inEngland: September 2009, Early Education;http://www.cypnow.co.uk/Archive/965906/Early-years---Nurseries-air-funding-formula-fears/128 As explained in the Minister of State for Children, YoungPeople and Families’ letter to Directors of Children’s Services,28 October 2009129 Ofsted (2008) The Annual Report of Her Majesty’s ChiefInspector of Education, Children’s Services and Skills 2007/08,The Stationery Office: London130 However there is no way to know whether families willincrease their use of childcare as a result of the increasednumber of hours of free places131 At present, those in the middle income quintile group pay,on average, a lower hourly rate for centre-based care thanthose in the higher income group; under the high qualitymodel, all families are assumed to pay the same rate, so thismeans that the absolute and percentage rise in spending isnecessarily greater for those in the lower income quintiles. Itwas also considered whether such a subsidy was necessaryfor three- and four-year-olds; however the increase in pricecaused by the high quality model is not nearly as significant asfor those under three and, coupled with the free places beingextended to 20 hours, means that parents would notnecessarily pay more than currently132 This is the cost in England for families with children underthe age of five; it is not the total CCTC spend in the UK134 Some members of the advisory group were concerned thatpaying at 100% costs level would mean that parents wouldnot ‘shop around’ for provision. There is no evidence that thatwould be the case; earlier increases to this percentage werenot examined in this way. However there are currently twopilots being run to examine the effect of paying 100% costs –one as part of the Childcare Affordability Pilot and the other byDurham County Council (http://www.durham.gov.uk/pages/pressrelease.aspx?pid=109&archive=1) which may provideinformation on this point135 This does not include children in reception classes. Asdiscussed in Chapter 5, existing spend on the free entitlementis taken from Section 52 returns for 2007/8 for comparisonwith FRS and DCSF Providers’ Survey data used in this project.136 The current Government has announced ambitions toincrease the early education entitlement, including extending itto two-year-olds from low income families by 2015. If such anextension were to arise, then it would reduce the cost to theGovernment of implementing the increased early educationentitlement presented in some of the scenarios in this report,and it would increase the cost to the Government of thescenarios which involve no change in early educationentitlement policy (because the Government would have toprovide high quality care for more hours per year). However, asno reliable estimates are available of the cost to theGovernment of providing additional early educationentitlement at current levels of quality, and no firm timetableexists, these have been ignored137 The reforms included in this summary table are paying up to100% of costs (but with no change to the ceilings) and givingto all on tax credits. The estimated cost of the reforms to thechildcare element of the WTC assumed they would apply tofamilies with children under five only. The cost would clearly
be higher if it applied to all families currently receiving thechildcare element of the WTC, but it has not been possible toestimate what this cost would be. However, there is no reasonwhy any reform need affect families without children under theage of five.138 See tables 6.1; 6.2 and 6.8139 The Cambridge Primary Review has suggested debating thecompulsory school starting age; Daycare Trust is concernedthat if the starting age for compulsory education were to bemoved to age six or seven that this could serve to increase theattainment gap. It could also delay the beginning of freeeducation which would be very difficult for parents. What isimportant is what the children do while they are engaged in‘compulsory’ education – so we are in favour of extending theprinciples of the Early Years Foundation Stage into year one, ineffect delaying the start of more formal education.140 Daycare Trust does support having some flexibility forparents to decide when their child is ready to begin inreception; for example allowing parents of younger children tostart when they are five, rather than four. Similarly somechildren born in the autumn might be ready to begin inreception a year early141 HM Government (2009) Next steps for early learning andchildcare: Building on the 10-year strategy, page 10, DCSF:London142 http://www.hesa.ac.uk/index.php?option=com_datatables&Itemid=121&task=show_category&catdex=1143 http://www.teachernet.gov.uk/docbank/index.cfm?id=12220144 This does not add up due to rounding145 Daycare Trust is holding a seminar on the reform of CCTC inFebruary 2010 to debate these and other options, and wouldwelcome feedback.146 Childcare Act (2006) Section 8(3)147. http://www.highscope.org/Content.asp?ContentId=282;Schweinhart, L. J et al (2004) Lifetime Effects: The High/ScopePerry Preschool Study Through Age 40,HighScope EducationalResearch Foundation: Michigan148 http://www.preventionaction.org/comment/pros-and-cons-early-years-programs-where-start149 Spratt, S et al (2009), Backing the Future: Why investing inchildren is good for us all, Action for Children and NewEconomics Foundation150 See the Working Better pages on EHRC’s website athttp://edit.equalityhumanrights.com/en/projects/workingbetter/Pages/WorkingBetter.aspx.151 This can be further tested at Daycare Trust’s forthcomingseminar on tax credits.
Daycare Trust, the national childcare charity, iscampaigning for quality, accessible, affordablechildcare for all and raising the voices of children,parents and carers. We lead the national childcarecampaign by producing high quality research,developing credible policy recommendationsthrough publications and the media, and by workingwith others. Our advice and information on childcareassists parents and carers, providers, employers andtrade unions and policymakers.
Established in 1986, Daycare Trust has seen itscampaigning translate into policy change, includingthe establishment of the national childcare strategy.However, access to quality childcare services is stilldependent on where families live and on theirincome. Daycare Trust is uniquely qualified to give avoice to parents facing a multiple range ofchallenges. Please support our campaign foruniversal quality affordable childcare.Daycare Trust offers a range of services whichincludes:� Childcare Information line – 0845 872 6251� Consultancy and training� Membership
To find out more about these services visitwww.daycaretrust.org.uk
November 2009ISBN: 978-1-907305-00-9Price: £25.00
Daycare Trust is a registered charity: 327279and a company limited by guarantee: 02063604,registered in England and Wales.VAT registered: 830 9847 06.
All rights reserved. © Daycare Trust 2009
Daycare Trust21 St George’s RoadLondonSE1 6ESTel: 020 7840 3350Fax: 020 7840 3355
Email: [email protected]: www.daycaretrust.org.uk
The Nuffield Foundation is a charitable trustwith the aim of advancing social well-being. It
funds research and provides expertise,predominantly in social policy and education.It has supported this project, but the viewsexpressed are those of the authors and not
necessarily those of the Foundation.More information is available atwww.nuffieldfoundation.org