Embed Size (px)
Citation preview
�
Center for Immigration StudiesBackgrounder November 2007
Immigrants in the United States, 2007A Profile of America’s Foreign-Born Population
By Steven A. Camarota
Steven A. Camarota is the Director of Research at the Center for Immigration Studies.
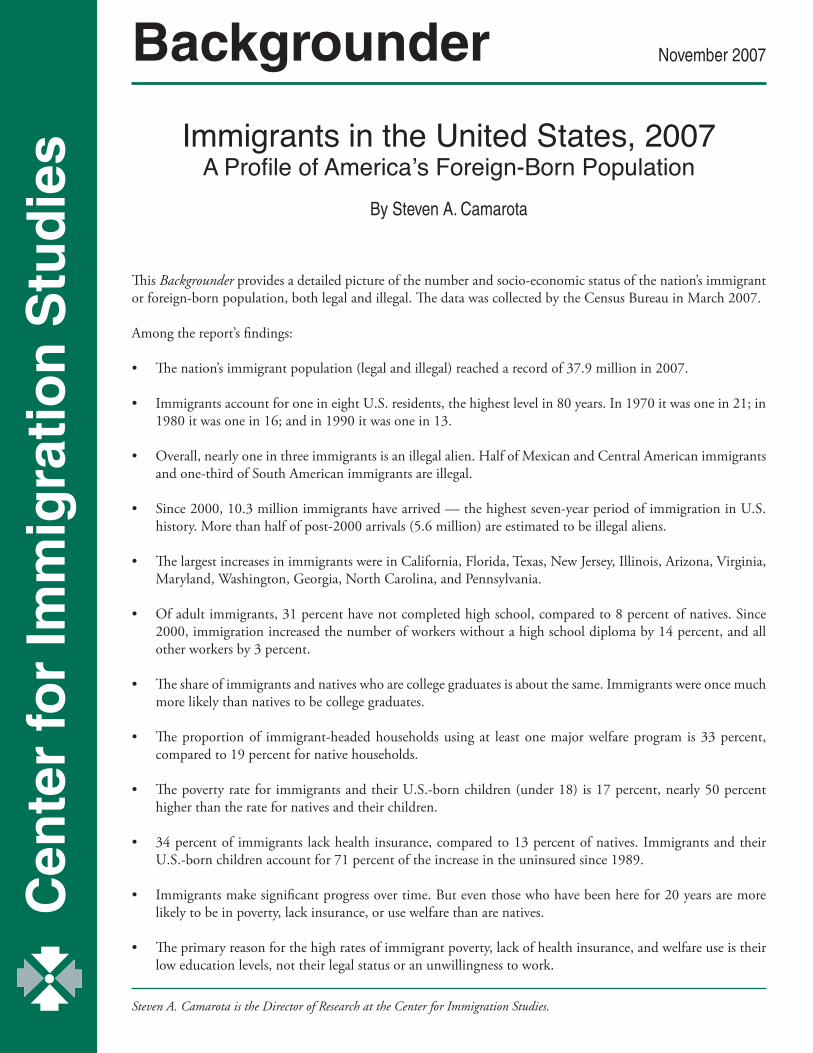
This Backgrounder provides a detailed picture of the number and socio-economic status of the nation’s immigrant or foreign-born population, both legal and illegal. The data was collected by the Census Bureau in March 2007.
Among the report’s findings:
• The nation’s immigrant population (legal and illegal) reached a record of 37.9 million in 2007.
• Immigrants account for one in eight U.S. residents, the highest level in 80 years. In 1970 it was one in 21; in 1980 it was one in 16; and in 1990 it was one in 13.
• Overall, nearly one in three immigrants is an illegal alien. Half of Mexican and Central American immigrants and one-third of South American immigrants are illegal.
• Since 2000, 10.3 million immigrants have arrived — the highest seven-year period of immigration in U.S. history. More than half of post-2000 arrivals (5.6 million) are estimated to be illegal aliens.
• The largest increases in immigrants were in California, Florida, Texas, New Jersey, Illinois, Arizona, Virginia,
Maryland, Washington, Georgia, North Carolina, and Pennsylvania. • Of adult immigrants, 31 percent have not completed high school, compared to 8 percent of natives. Since
2000, immigration increased the number of workers without a high school diploma by 14 percent, and all other workers by 3 percent.
• The share of immigrants and natives who are college graduates is about the same. Immigrants were once much
more likely than natives to be college graduates.
• The proportion of immigrant-headed households using at least one major welfare program is 33 percent, compared to 19 percent for native households.
• The poverty rate for immigrants and their U.S.-born children (under 18) is 17 percent, nearly 50 percent higher than the rate for natives and their children.
• 34 percent of immigrants lack health insurance, compared to 13 percent of natives. Immigrants and their U.S.-born children account for 71 percent of the increase in the uninsured since 1989.
• Immigrants make significant progress over time. But even those who have been here for 20 years are more likely to be in poverty, lack insurance, or use welfare than are natives.
• The primary reason for the high rates of immigrant poverty, lack of health insurance, and welfare use is their low education levels, not their legal status or an unwillingness to work.
2
Center for Immigration Studies
• Of immigrant households, 82 percent have at least one worker compared to 73 percent of native households.
• There is a worker present in 78 percent of immigrant households using at least one welfare program.
• Immigration accounts for virtually all of the national increase in public school enrollment over the last two decades. In 2007, there were 10.8 million school-age children from immigrant families in the United States.
• Immigrants and natives have similar rates of entrepreneurship — 13 percent of natives and 11 percent of im-migrants are self-employed.
• Recent immigration has had no significant impact on the nation’s age structure. Without the 10.3 million post-2000 immigrants, the average age in America would be virtually unchanged at 36.5 years.
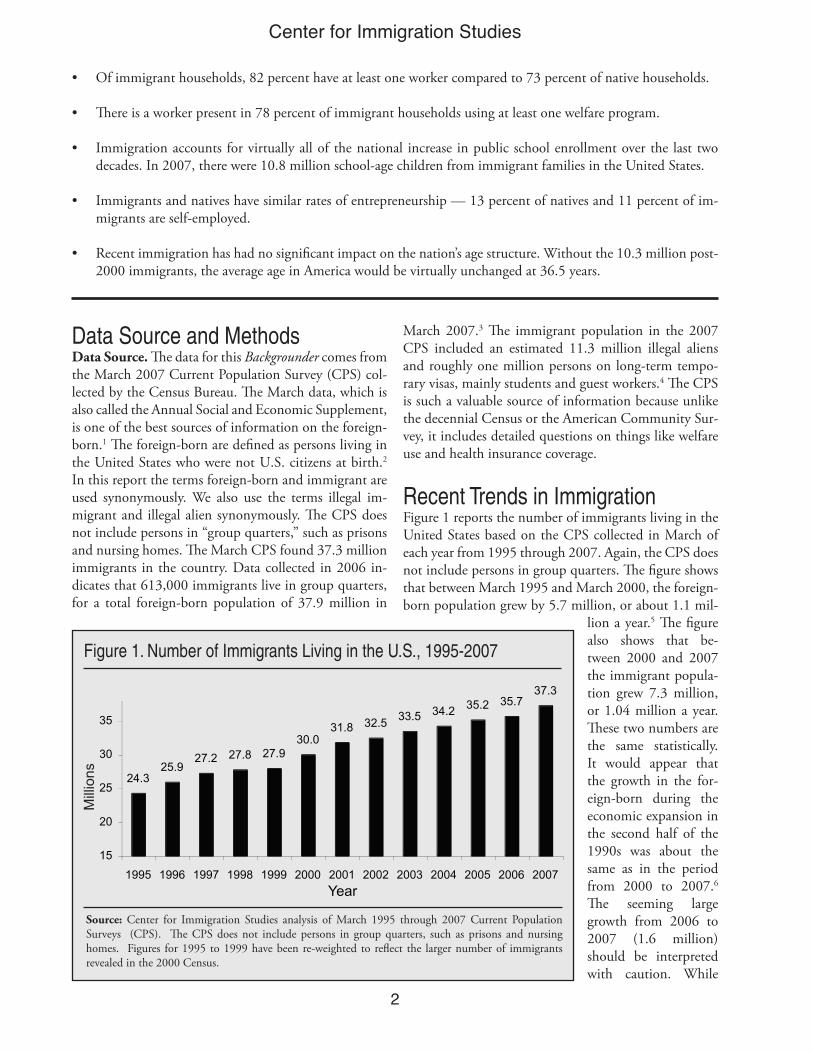
Data Source and Methods Data Source. The data for this Backgrounder comes from the March 2007 Current Population Survey (CPS) col-lected by the Census Bureau. The March data, which is also called the Annual Social and Economic Supplement, is one of the best sources of information on the foreign-born.1 The foreign-born are defined as persons living in the United States who were not U.S. citizens at birth.2 In this report the terms foreign-born and immigrant are used synonymously. We also use the terms illegal im-migrant and illegal alien synonymously. The CPS does not include persons in “group quarters,” such as prisons and nursing homes. The March CPS found 37.3 million immigrants in the country. Data collected in 2006 in-dicates that 613,000 immigrants live in group quarters, for a total foreign-born population of 37.9 million in
March 2007.3 The immigrant population in the 2007 CPS included an estimated 11.3 million illegal aliens and roughly one million persons on long-term tempo-rary visas, mainly students and guest workers.4 The CPS is such a valuable source of information because unlike the decennial Census or the American Community Sur-vey, it includes detailed questions on things like welfare use and health insurance coverage.
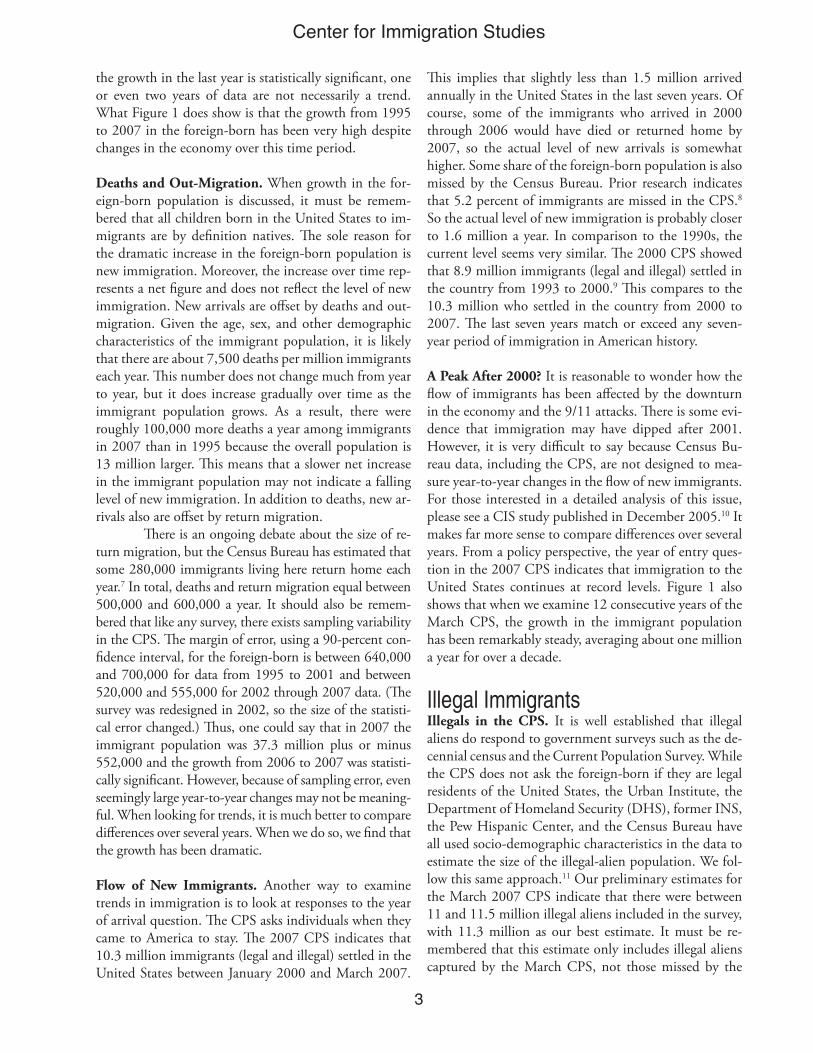
Recent Trends in ImmigrationFigure 1 reports the number of immigrants living in the United States based on the CPS collected in March of each year from 1995 through 2007. Again, the CPS does not include persons in group quarters. The figure shows that between March 1995 and March 2000, the foreign-born population grew by 5.7 million, or about 1.1 mil-
lion a year.5 The figure also shows that be-tween 2000 and 2007 the immigrant popula-tion grew 7.3 million, or 1.04 million a year. These two numbers are the same statistically. It would appear that the growth in the for-eign-born during the economic expansion in the second half of the 1990s was about the same as in the period from 2000 to 2007.6 The seeming large growth from 2006 to 2007 (1.6 million) should be interpreted with caution. While
Figure 1. Number of Immigrants Living in the U.S., 1995-2007
Source: Center for Immigration Studies analysis of March 1995 through 2007 Current Population Surveys (CPS). The CPS does not include persons in group quarters, such as prisons and nursing homes. Figures for 1995 to 1999 have been re-weighted to reflect the larger number of immigrants revealed in the 2000 Census.
�
Center for Immigration Studies
the growth in the last year is statistically significant, one or even two years of data are not necessarily a trend. What Figure 1 does show is that the growth from 1995 to 2007 in the foreign-born has been very high despite changes in the economy over this time period.
Deaths and Out-Migration. When growth in the for-eign-born population is discussed, it must be remem-bered that all children born in the United States to im-migrants are by definition natives. The sole reason for the dramatic increase in the foreign-born population is new immigration. Moreover, the increase over time rep-resents a net figure and does not reflect the level of new immigration. New arrivals are offset by deaths and out-migration. Given the age, sex, and other demographic characteristics of the immigrant population, it is likely that there are about 7,500 deaths per million immigrants each year. This number does not change much from year to year, but it does increase gradually over time as the immigrant population grows. As a result, there were roughly 100,000 more deaths a year among immigrants in 2007 than in 1995 because the overall population is 13 million larger. This means that a slower net increase in the immigrant population may not indicate a falling level of new immigration. In addition to deaths, new ar-rivals also are offset by return migration. There is an ongoing debate about the size of re-turn migration, but the Census Bureau has estimated that some 280,000 immigrants living here return home each year.7 In total, deaths and return migration equal between 500,000 and 600,000 a year. It should also be remem-bered that like any survey, there exists sampling variability in the CPS. The margin of error, using a 90-percent con-fidence interval, for the foreign-born is between 640,000 and 700,000 for data from 1995 to 2001 and between 520,000 and 555,000 for 2002 through 2007 data. (The survey was redesigned in 2002, so the size of the statisti-cal error changed.) Thus, one could say that in 2007 the immigrant population was 37.3 million plus or minus 552,000 and the growth from 2006 to 2007 was statisti-cally significant. However, because of sampling error, even seemingly large year-to-year changes may not be meaning-ful. When looking for trends, it is much better to compare differences over several years. When we do so, we find that the growth has been dramatic.
Flow of New Immigrants. Another way to examine trends in immigration is to look at responses to the year of arrival question. The CPS asks individuals when they came to America to stay. The 2007 CPS indicates that 10.3 million immigrants (legal and illegal) settled in the United States between January 2000 and March 2007.
This implies that slightly less than 1.5 million arrived annually in the United States in the last seven years. Of course, some of the immigrants who arrived in 2000 through 2006 would have died or returned home by 2007, so the actual level of new arrivals is somewhat higher. Some share of the foreign-born population is also missed by the Census Bureau. Prior research indicates that 5.2 percent of immigrants are missed in the CPS.8 So the actual level of new immigration is probably closer to 1.6 million a year. In comparison to the 1990s, the current level seems very similar. The 2000 CPS showed that 8.9 million immigrants (legal and illegal) settled in the country from 1993 to 2000.9 This compares to the 10.3 million who settled in the country from 2000 to 2007. The last seven years match or exceed any seven-year period of immigration in American history.
A Peak After 2000? It is reasonable to wonder how the flow of immigrants has been affected by the downturn in the economy and the 9/11 attacks. There is some evi-dence that immigration may have dipped after 2001. However, it is very difficult to say because Census Bu-reau data, including the CPS, are not designed to mea-sure year-to-year changes in the flow of new immigrants. For those interested in a detailed analysis of this issue, please see a CIS study published in December 2005.10 It makes far more sense to compare differences over several years. From a policy perspective, the year of entry ques-tion in the 2007 CPS indicates that immigration to the United States continues at record levels. Figure 1 also shows that when we examine 12 consecutive years of the March CPS, the growth in the immigrant population has been remarkably steady, averaging about one million a year for over a decade.
Illegal Immigrants Illegals in the CPS. It is well established that illegal aliens do respond to government surveys such as the de-cennial census and the Current Population Survey. While the CPS does not ask the foreign-born if they are legal residents of the United States, the Urban Institute, the Department of Homeland Security (DHS), former INS, the Pew Hispanic Center, and the Census Bureau have all used socio-demographic characteristics in the data to estimate the size of the illegal-alien population. We fol-low this same approach.11 Our preliminary estimates for the March 2007 CPS indicate that there were between 11 and 11.5 million illegal aliens included in the survey, with 11.3 million as our best estimate. It must be re-membered that this estimate only includes illegal aliens captured by the March CPS, not those missed by the
�
Center for Immigration Studies
survey. By design, this estimate is consistent with those prepared by the Census Bureau, DHS, Urban Institute, and Pew Hispanic Center.12 Our estimate for the num-ber of illegals included in the 2000 CPS is 7.3 million. This means that the illegal-alien population in the CPS grew by four million between 2000 and 2007. Figure 1, which compares CPS to CPS, shows a total increase in the immigrant population (both legal and illegal) of 7.3 million from 2000 to 2007. This means that growth in the illegal immigrant population accounted for at least half of the growth in the total immigrant population. We also estimate that 5.6 million of the 10.3 million immigrants in the March 2007 CPS who indicated that they arrived in 2000 or later are illegal aliens.
We estimate that 57 percent of the illegal alien population comes from Mexico, 11 percent is from Cen-tral America, 9 percent is from East Asia, 8 percent is from South America, and Europe and the Caribbean ac-count for 4 percent. Of all immigrants from Mexico, 55 percent are illegal; for Central Americans it is 47 percent; and it is 33 percent for South Americans. Again these figures do not adjust for undercount of the legal or illegal populations in the CPS. If we did make this adjustment, it would mean that an even larger share of all immigrants from these regions are illegal because the undercount of illegal immigrants is much larger than the undercount of
legal immigrants. Al-though these estimates are consistent with other research findings, including those pro-duced by the federal government, it should be obvious that there is no definitive means of determining whether a respondent in the sur-vey is an illegal alien with 100 percent cer-tainty.
Illegals as a Share of Growth. The fact that illegals account for at least half of the over-all growth in the im-migrant population may seem surprising to some, especially since illegal aliens account
for 30 percent of the total foreign-born population. There are several reasons for this. First, prior to the mid-1970s, there was little illegal immigration to the United States, thus older immigrants who entered at that time and are still here are almost all legal residents. Because long-time residents are almost entirely legal immigrants, they are older on average than illegal immigrants. There-fore they account for most of the deaths among the for-eign-born. Moreover, the United States has conducted broad amnesties for illegal aliens in the past and also each year grants tens of thousands of illegal aliens legal status as part of the normal “legal” immigration pro-cess. For example, 2.6 million illegals were given green cards (permanent residency) in the late 1980s and early 1990s as part of the Immigration Reform and Control Act (IRCA). The immigration service also estimated that during just the 1990s, 1.5 million illegal aliens received green cards, not including IRCA.13 Because there is this constant movement out of illegal status to legal status, the size of the existing legal population is much bigger than the existing illegal population. Finally, it must be remembered that although the number of illegal aliens entering and remaining in the country is now enormous, the level of legal immigration is also very high, adding to a very large legal immigrant population.
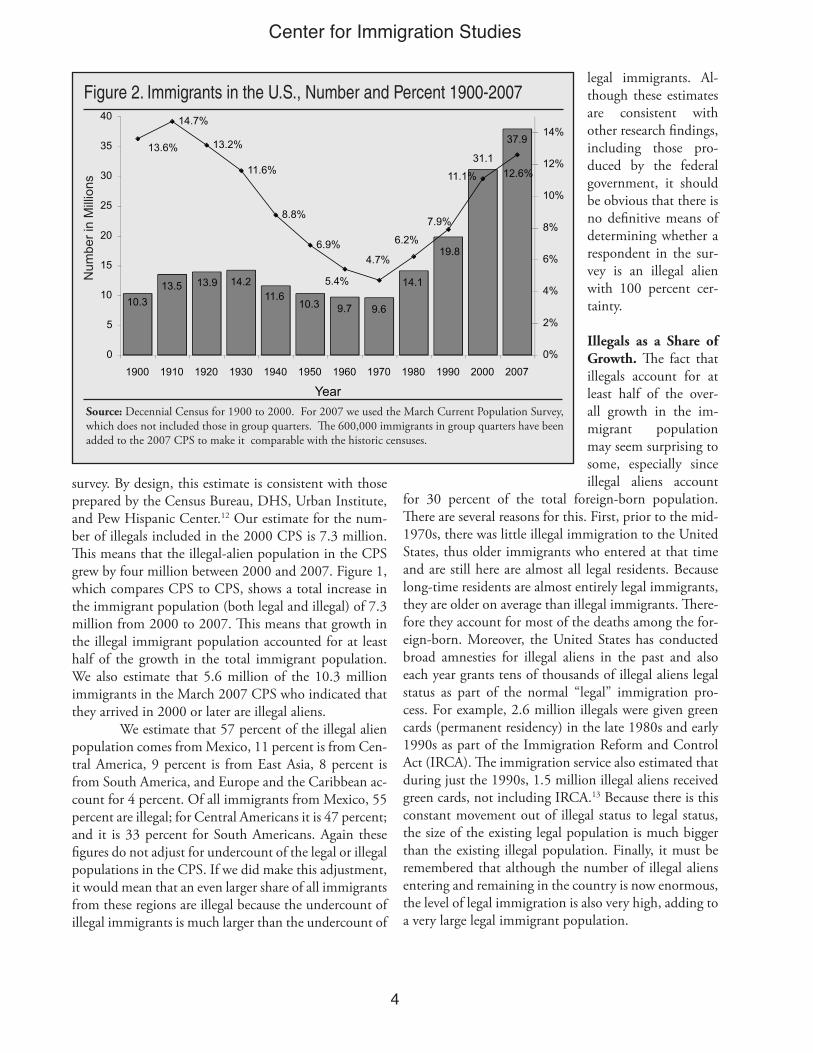
Figure 2. Immigrants in the U.S., Number and Percent 1900-2007
Source: Decennial Census for 1900 to 2000. For 2007 we used the March Current Population Survey, which does not included those in group quarters. The 600,000 immigrants in group quarters have been added to the 2007 CPS to make it comparable with the historic censuses.
�
Center for Immigration Studies
Historical PerspectiveWhile immigration has played an important role in American history, the level of immigration and the size of the immigrant population has varied considerably. Figure 2 shows the number of immigrants living in the United States over the course of the last 100 years. The figures 1900 to 2000 are from the decennial census. A question on whether a respondent was foreign-born was not included in the CPS on a regular basis until the mid-1990s, so the decennial census is the only historical data source for the size of the immigrant population prior to that date. In order to make the CPS comparable to decennial census data, it is necessary to include persons in group quarters such as prisons and nursing homes, which are not part of the CPS. Data collected in 2006 indicate that 614,000 immigrants lived in institutions. Adding this to the 37.3 million found in the 2007 CPS creates a total immigrant population 37.9 million in March 2007, assuming no immigrants (legal or illegal) are missed by the survey.14
Figure 2 shows that the 37.9 million immi-grants residing in the United States in 2007 is by far the most ever recorded. Even during the great wave of immigration at the turn of the 19th century, the im-migrant population was much less than half what it is today. The figure shows that after growing in the early part of this century, the immigrant population stabilized at around 10 or 11 million for about four decades. In the mid-1960s, changes in immigration law and other factors caused the annual level of legal immigration to rise steadily, from about 300,000 a year in the 1960s to nearly a million today. The latest data indicates that this rapid growth has continued into the first decade of the 21st century, adding 6.8 million in the last seven years. This is slightly lower than the 7.2 million growth found in Figure 1, which compared the 2000 CPS to the 2007 CPS . The foreign-born population’s growth rate in ev-ery decade since 1970 has been higher than at any other time in history, surpassing the 31 percent increase be-tween 1900 and 1910.
Unlike in the past, the growth in the immigrant population now accounts for a large share of the increase in the size of the U.S. population. Even during the first decade of the last century, the 3.2 million increase in the size of the immigrant population accounted for only 20 percent of the total increase in the U.S. population. In contrast, the 11.3 million increase in the immigrant population from 1990 to 2000 accounted for 35 percent of U.S. population growth in the 1990s. And the 6.8 million increase in the size of the immigrant population in the last seven years equals 34 percent of U.S. popula-
tion growth between 2000 and 2007.15 It should noted that the 34 percent does not represent the full impact on population growth in the United States because it in-cludes deaths. Net immigration is the way one measures the impact of immigration on population growth, not the net increase in the size of the immigrant population. To measure the full impact of immigration on popula-tion growth it also would be necessary to include births to immigrants.
Population growth is measured by taking the number of births minus the number of deaths and then adding net immigration (the difference between people coming and going). The U.S. population is growing by 2.9 million a year according to the Census Bureau.16 The growth in the foreign-born reflects deaths as well as net immigration. Thus, using growth in the foreign-born to measure immigration’s impact on population would be double counting immigrant deaths. For this reason, net immigration is used when estimating the impact of im-migration on population growth. As already discussed, annual net immigration is 1.25 million or 1.15 million, depending on how it is calculated. When this is added to the 950,000 births to immigrants each year, the total impact of immigrations is equal about three-fourths of U.S. population growth.
Immigration now accounts for such a large per-centage of population because the fertility of natives was much higher in the early 1900s, during the last great wave of immigration. As a result, the U.S. population grew regardless of immigration. Today, natives have only about two children on average, with the result that with-out immigration the U.S. population would very slowly move to stabilization.17 Also, in contrast to the past, a higher percentage of today’s immigrants remain in the United States rather than returning home. Because so many immigrants in the early 20th century eventually returned to their home countries, immigration at that time did not add permanently to the overall size of the U.S. population in the way that it does today.18
Immigrants as a Share of the Population. While the number of immigrants and the growth rate of the immi-grant population are higher now than at any other time in the last 100 years, Figure 2 shows that the foreign-born percentage of the population was higher in the first few decades of the 1900s, reaching 14.7 percent of the total U.S. population in 1910. As a result of World War I and changes in immigration law in the early 1920s, the level of immigration fell significantly. The 1920 cen-sus was the last time the percentage of immigrants was higher than it is today.
�
Center for Immigration Studies
In terms of the impact of im-migrants on the United States, both the percentage of the population made up of immigrants and the number of im-migrants are clearly important. The abil-ity to assimilate and incorporate immi-grants is partly de-pendent on the rela-tive sizes of the na-tive and immigrant populations. On the other hand, absolute numbers also clearly matter. A large num-ber of immigrants can create the criti-cal mass necessary to foster linguistic and cultural isolation. Whether the immi-grants in question represent 10 percent or 30 percent of a city or state’s popu-lation may not be so important; it’s the raw numbers that may be the most meaningful. And the current numbers are approaching triple what they were in 1910.19 Moreover, absent a change in policy, the number and immigrant-share of the population will continue to in-crease rapidly for the foreseeable future.
Table 1. Immigrants by State, 2007 (thousands)
1
2
3456789
101112131415161718192021222324252627282930313233343536373839404142434445464748495051
Number of Immigrants
9,980 3,629 4,105 2,918 3,453 3,438 1,869 1,702
953 897 891 856 731 722 623 581 493 457 443 435 421 375 357 286 257 239 236 226 208 190 179 148 144 140 132 113 113 111 111 110 83 78 77 72 66 39 34 30 19 15 15 14 13
37,280
Source: Center for Immigration Studies analysis of March 2007 Current Population Survey. 1 Indicates the year that immigrants said they came to the United States. Included in totals are a tiny number of people who did not indicate a year of arrival. 2 Includes all children of immigrant fathers under age 18, including those born in the United States.
Share of Pop. that Is Immigrant
27.6 %36.6 %21.6 %36.0 %19.1 %14.8 %21.6 %13.5 %10.2 %14.2 %14.2 %11.4 %13.0 %11.4 %7.0 %4.7 %4.9 %
18.0 %12.8 %9.1 %3.7 %7.3 %9.6 %4.8 %4.7 %9.4 %3.7 %
18.0 %3.6 %4.2 %9.2 %5.4 %3.4 %
13.3 %4.5 %2.7 %6.4 %4.0 %3.2 %2.7 %6.3 %
13.7 %8.9 %4.9 %2.3 %5.9 %2.6 %4.8 %2.5 %1.6 %0.8 %2.7 %2.1 %
12.6 %
Immigrants Who Arrived
2000 to 20071
2,022 602 877 593
1,068 1,071
501 491 383 203 284 276 276 239 282 154 113 105 134 124 139 135 107 144 81 79 93 47 77 99 68 66 67 21 49 37 30 37 26 67 29 30 35 17 26 11 6
10 8 4 1 7 2
10,258
Immigrants and Their U.S.-Born Children (Under 18)
as a Share of Population2
37.9 %50.0 %27.9 %46.7 %23.8 %21.0 %27.5 %18.3 %13.3 %17.4 %19.7 %14.8 %16.3 %14.7 %9.4 %6.0 %6.9 %
25.2 %15.9 %12.1 %5.2 %9.8 %
13.3 %5.5 %6.1 %
14.1 %5.0 %
22.2 %4.4 %5.1 %
12.5 %7.8 %4.5 %
17.7 %5.9 %3.4 %9.4 %5.5 %4.4 %3.4 %7.8 %
16.5 %11.6 %7.3 %2.6 %7.7 %3.1 %5.8 %3.5 %1.7 %1.2 %3.7 %2.8 %
16.7 %
California Los Angles CountyNew York New York CityFloridaTexasNew JerseyIllinoisGeorgiaMassachusettsArizonaVirginiaMarylandWashingtonNorth CarolinaPennsylvaniaMichiganNevadaConnecticutColoradoOhioMinnesotaOregonTennesseeWisconsinUtahIndianaHawaiiMissouriAlabamaNew MexicoKansasSouth CarolinaRhode IslandIowaLouisianaNebraskaArkansasOklahomaKentuckyNew HampshireD.C.DelawareIdahoMississippiAlaskaMaineVermontSouth DakotaMontanaWest VirginiaWyomingNorth DakotaNation
7
Center for Immigration Studies
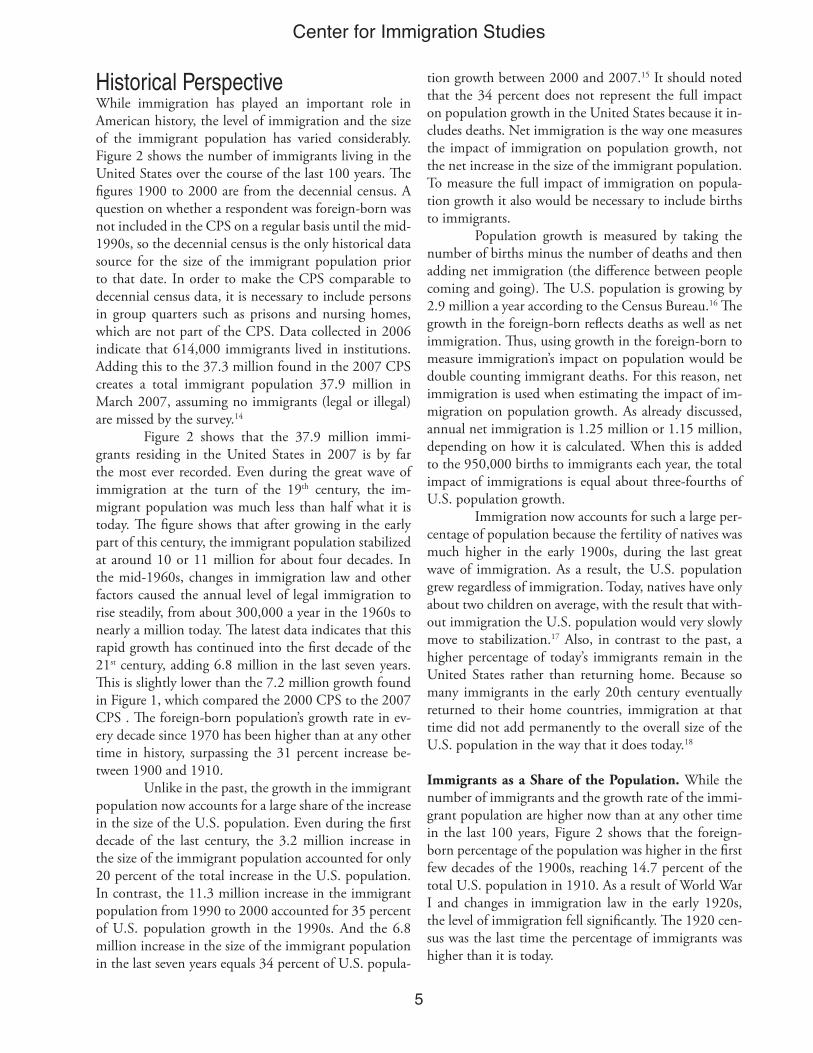
State Numbers Number of Immigrants by State. Table 1 ranks the states by the size of their immigrant populations. It also shows the number of immigrants who reported arriv-ing in 2000 or later. California clearly has the largest immigrant population; New York, the state with next largest number of immigrants, has fewer than half as many. Table 1 shows how concentrated the immigrant population is: Only a few states represent the majority of the foreign-born population. In 2007, the nearly 10 million immigrants in California account for 27 percent of the nation’s total immigrant population, followed by New York with 11 percent, Florida and Texas with 10 percent each, and New Jersey with 5 percent. These five states account for 61 percent of the nation’s total foreign-born population, but only 32 percent of the native-born population. The table also shows evidence that the im-migrant population is becoming more dispersed. Table 1 indicates that although the top-five states account for 61 percent of the total immigrant population, only 54 percent of post-2000 arrivals went to these states.
Share of State That Is Immigrant. Table 1 also shows the share of each state’s population that is foreign-born. While many states with a large number of immigrants are also states where their percentage is high, there are some differences. Because of their relatively small total populations several states with high percentages of im-migrants, such as Hawaii and Nevada, rank lower in terms of number of immigrants. It is very likely that the impact of immigration will be significant in these states even though the size of the immigrant population is much smaller than in a state like California.
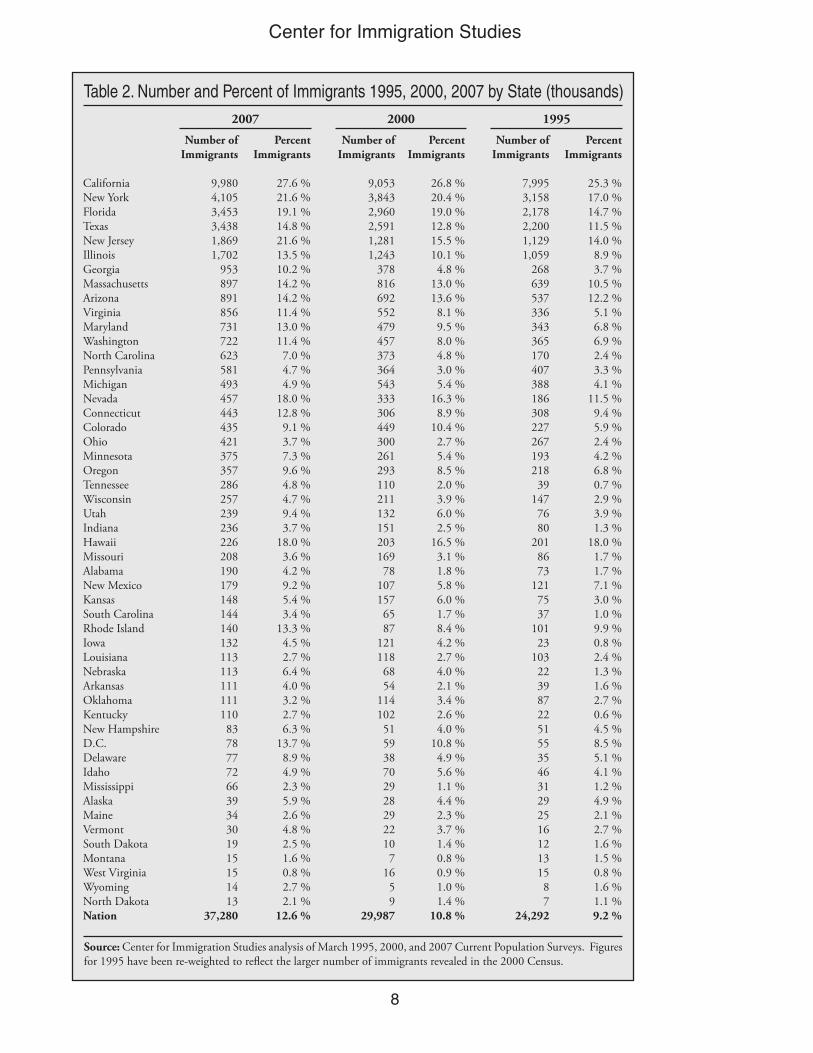
Growth in the Immigrant Population by State. Table 2 compares the number of immigrants in 1995, 2000, and 2007 for each state.20 It also shows the share of the population that was foreign-born in each of these years. As already discussed, immigrants tend to be concentrat-ed. However, Table 2 also shows that this has become less the case over time. In 1995, the top-five states ac-counted for 69 percent of the total foreign-born popula-tion, in 2000 these same states accounted for 66 percent of the foreign-born and this had dropped to 61 percent by 2007. Or looked at in a different way, these five states accounted for 69 percent of the total immigrant popula-tion in 1995, but only 48 percent of the growth in the immigrant population between 1995 and 2007 occurred in these five states. The increasing dispersion of immi-grants can be exaggerated; in 2007 the top-10 states of settlement accounted for 75 percent of immigrants,
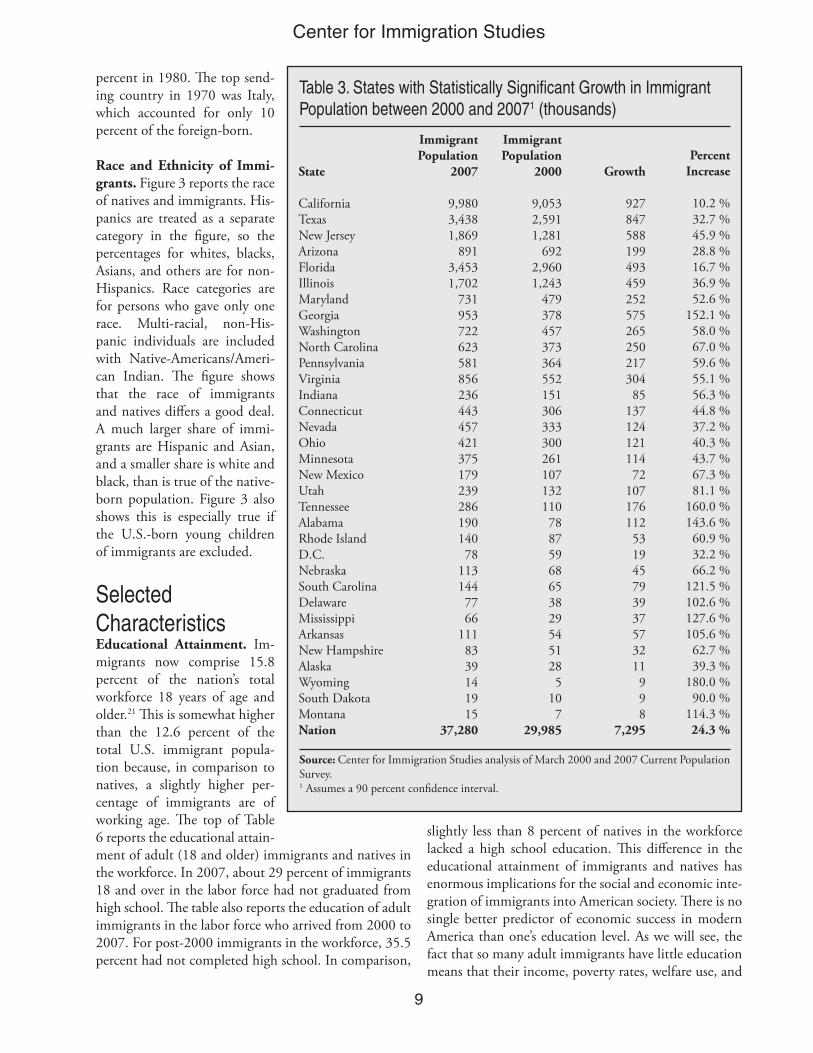
these same states accounted for 80 in 1995. A change to be sure, but not a huge change. Table 2 also shows different patterns for different states. In New York, for example, the number of immi-grants increased 585,000 between 1995 and 2000, but in the seven years after 2000 it grew by 262,000. New Jersey, which is right next to New York, is quite different. The numerical increase in that state was larger between 2000 and 2007 than between 1995 and 2000. The same holds true for Texas. Perhaps the most dramatic increases can be found in Georgia and North Carolina, where the immigrant population increased three and half times between 1995 and 2007. The key point to take from Table 2 is that there is no one pattern that reflects the entire country. The pace and scale varies by state and by time period as well. Table 3 shows the 32 states plus the District of Columbia, where the growth was statistically significant between 2000 and 2007.
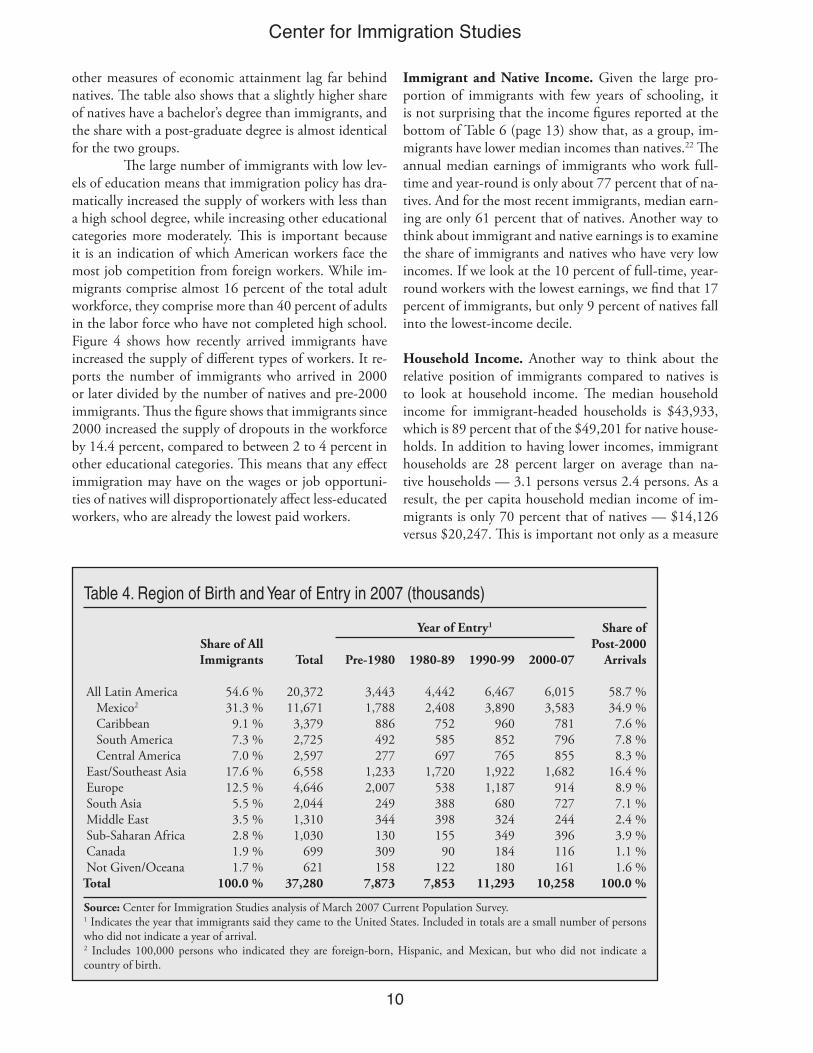
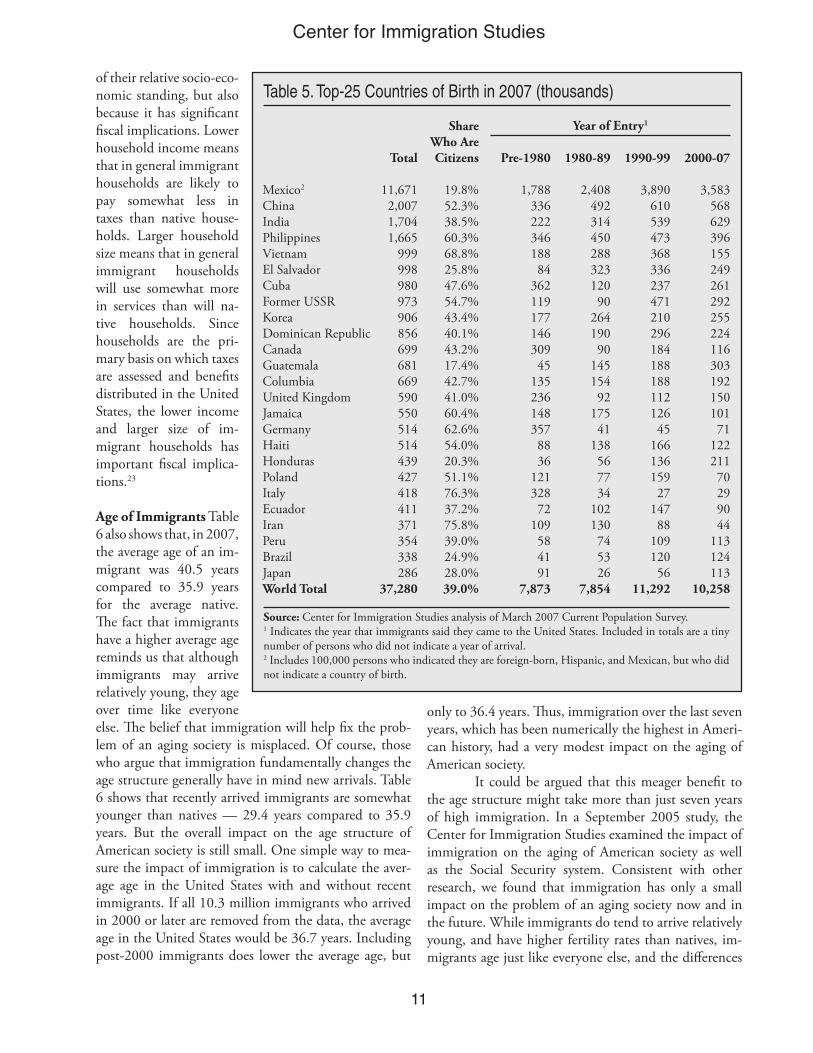
Region and Country of OriginSending Regions. Table 4 shows the distribution of immigrants by region of the world, with Mexico and Canada broken out separately. Mexico accounts for 31.3 percent of all immigrants, with 11.7 million immigrants living in United States, more than the number of im-migrants from any other region of the world. Immi-grants from Latin America (Mexico, Central and South America, and the Caribbean) account for the majority of immigrants, with 54.6 percent of the foreign-born com-ing from these areas. East Asia/Southeast Asia also makes up a significant share of the total, accounting for 17.6 percent of immigrants. This is similar to the combined total for Europe and the Middle East. The importance of the Western Hemisphere, excluding Canada, is even more striking when we look at recent arrivals. Of those who arrived from 2000 to 2007, 58.7 percent are from Latin America.
Top Sending Countries. Table 5 ranks the top-25 immi-grant-sending countries by the number of immigrants as of March 2007. Mexico is, of course, the largest sending country, accounting for almost six times as many immi-grants as the next largest country, China, which includes Taiwan and Hong Kong. As is clear from Table 4, Latin American and Caribbean countries dominate the list of immigrant-sending countries, accounting for almost half of the top-25 countries. One of the striking things about contemporary immigration is that there has been a sig-nificant decline in the diversity of immigrants: Mexico accounts for 31 percent of all immigrants in 2007, up from 28 percent in 2000, 22 percent in 1990, and 16
�
Center for Immigration Studies
Table 2. Number and Percent of Immigrants 1995, 2000, 2007 by State (thousands)
Number of Immigrants
9,980 4,105 3,453 3,438 1,869 1,702
953 897 891 856 731 722 623 581 493 457 443 435 421 375 357 286 257 239 236 226 208 190 179 148 144 140 132 113 113 111 111 110 83 78 77 72 66 39 34 30 19 15 15 14 13
37,280
Source: Center for Immigration Studies analysis of March 1995, 2000, and 2007 Current Population Surveys. Figures for 1995 have been re-weighted to reflect the larger number of immigrants revealed in the 2000 Census.
PercentImmigrants
27.6 %21.6 %19.1 %14.8 %21.6 %13.5 %10.2 %14.2 %14.2 %11.4 %13.0 %11.4 %7.0 %4.7 %4.9 %
18.0 %12.8 %9.1 %3.7 %7.3 %9.6 %4.8 %4.7 %9.4 %3.7 %
18.0 %3.6 %4.2 %9.2 %5.4 %3.4 %
13.3 %4.5 %2.7 %6.4 %4.0 %3.2 %2.7 %6.3 %
13.7 %8.9 %4.9 %2.3 %5.9 %2.6 %4.8 %2.5 %1.6 %0.8 %2.7 %2.1 %
12.6 %
CaliforniaNew YorkFloridaTexasNew JerseyIllinoisGeorgiaMassachusettsArizonaVirginiaMarylandWashingtonNorth CarolinaPennsylvaniaMichiganNevadaConnecticutColoradoOhioMinnesotaOregonTennesseeWisconsinUtahIndianaHawaiiMissouriAlabamaNew MexicoKansasSouth CarolinaRhode IslandIowaLouisianaNebraskaArkansasOklahomaKentuckyNew HampshireD.C.DelawareIdahoMississippiAlaskaMaineVermontSouth DakotaMontanaWest VirginiaWyomingNorth DakotaNation
Number of Immigrants
9,053 3,843 2,960 2,591 1,281 1,243
378 816 692 552 479 457 373 364 543 333 306 449 300 261 293 110 211 132 151 203 169 78
107 157 65 87
121 118 68 54
114 102 51 59 38 70 29 28 29 22 10 7
16 5 9
29,987
PercentImmigrants
26.8 %20.4 %19.0 %12.8 %15.5 %10.1 %4.8 %
13.0 %13.6 %8.1 %9.5 %8.0 %4.8 %3.0 %5.4 %
16.3 %8.9 %
10.4 %2.7 %5.4 %8.5 %2.0 %3.9 %6.0 %2.5 %
16.5 %3.1 %1.8 %5.8 %6.0 %1.7 %8.4 %4.2 %2.7 %4.0 %2.1 %3.4 %2.6 %4.0 %
10.8 %4.9 %5.6 %1.1 %4.4 %2.3 %3.7 %1.4 %0.8 %0.9 %1.0 %1.4 %
10.8 %
Number of Immigrants
7,995 3,158 2,178 2,200 1,129 1,059
268 639 537 336 343 365 170 407 388 186 308 227 267 193 218 39
147 76 80
201 86 73
121 75 37
101 23
103 22 39 87 22 51 55 35 46 31 29 25 16 12 13 15 8 7
24,292
PercentImmigrants
25.3 %17.0 %14.7 %11.5 %14.0 %8.9 %3.7 %
10.5 %12.2 %5.1 %6.8 %6.9 %2.4 %3.3 %4.1 %
11.5 %9.4 %5.9 %2.4 %4.2 %6.8 %0.7 %2.9 %3.9 %1.3 %
18.0 %1.7 %1.7 %7.1 %3.0 %1.0 %9.9 %0.8 %2.4 %1.3 %1.6 %2.7 %0.6 %4.5 %8.5 %5.1 %4.1 %1.2 %4.9 %2.1 %2.7 %1.6 %1.5 %0.8 %1.6 %1.1 %9.2 %
2007 2000 1995
�
Center for Immigration Studies
percent in 1980. The top send-ing country in 1970 was Italy, which accounted for only 10 percent of the foreign-born.
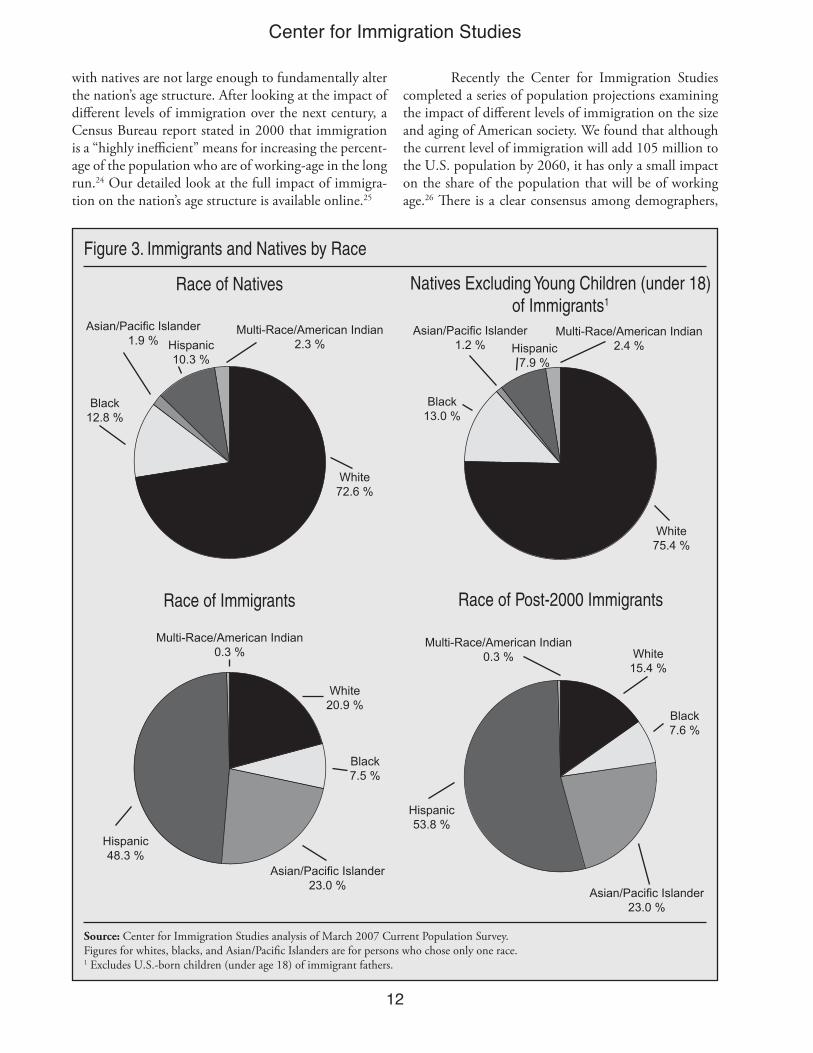
Race and Ethnicity of Immi-grants. Figure 3 reports the race of natives and immigrants. His-panics are treated as a separate category in the figure, so the percentages for whites, blacks, Asians, and others are for non-Hispanics. Race categories are for persons who gave only one race. Multi-racial, non-His-panic individuals are included with Native-Americans/Ameri-can Indian. The figure shows that the race of immigrants and natives differs a good deal. A much larger share of immi-grants are Hispanic and Asian, and a smaller share is white and black, than is true of the native-born population. Figure 3 also shows this is especially true if the U.S.-born young children of immigrants are excluded.
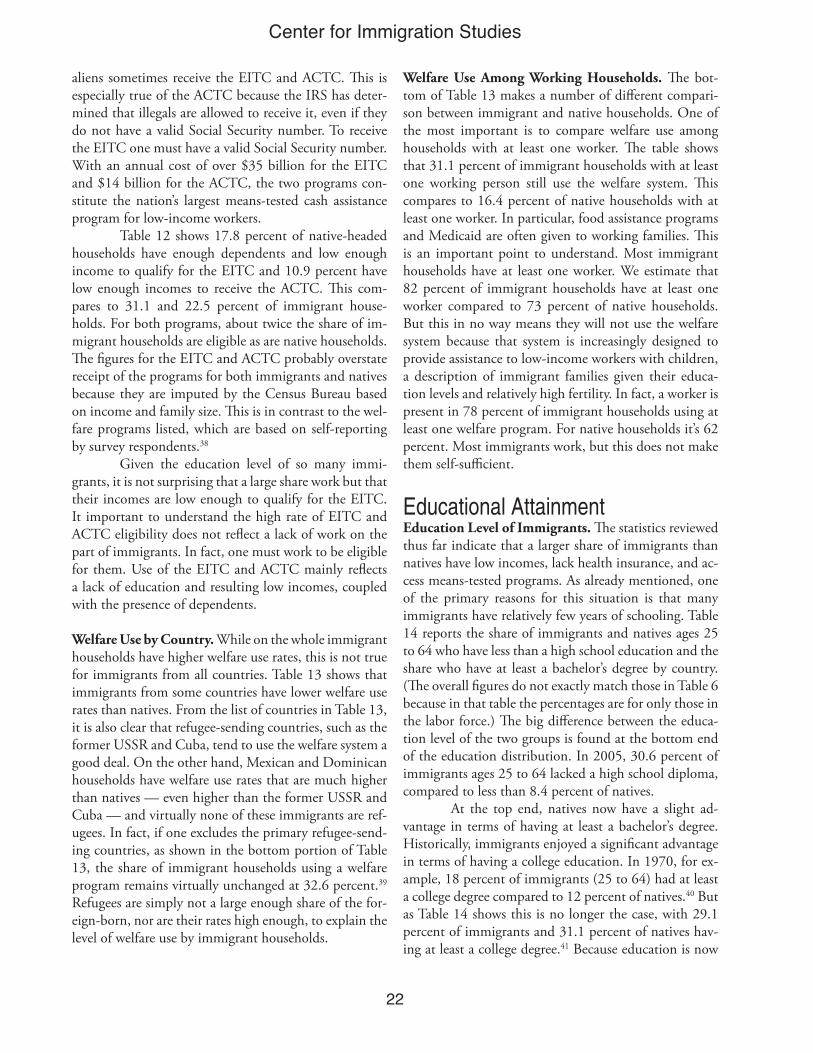
Selected Characteristics Educational Attainment. Im-migrants now comprise 15.8 percent of the nation’s total workforce 18 years of age and older.21 This is somewhat higher than the 12.6 percent of the total U.S. immigrant popula-tion because, in comparison to natives, a slightly higher per-centage of immigrants are of working age. The top of Table 6 reports the educational attain-ment of adult (18 and older) immigrants and natives in the workforce. In 2007, about 29 percent of immigrants 18 and over in the labor force had not graduated from high school. The table also reports the education of adult immigrants in the labor force who arrived from 2000 to 2007. For post-2000 immigrants in the workforce, 35.5 percent had not completed high school. In comparison,
slightly less than 8 percent of natives in the workforce lacked a high school education. This difference in the educational attainment of immigrants and natives has enormous implications for the social and economic inte-gration of immigrants into American society. There is no single better predictor of economic success in modern America than one’s education level. As we will see, the fact that so many adult immigrants have little education means that their income, poverty rates, welfare use, and
Table 3. States with Statistically Significant Growth in Immigrant Population between 2000 and 20071 (thousands)
ImmigrantPopulation
2007
9,980 3,438 1,869
891 3,453 1,702
731 953 722 623 581 856 236 443 457 421 375 179 239 286 190 140 78
113 144 77 66
111 83 39 14 19 15
37,280
Source: Center for Immigration Studies analysis of March 2000 and 2007 Current Population Survey. 1 Assumes a 90 percent confidence interval.
ImmigrantPopulation
2000
9,053 2,591 1,281
692 2,960 1,243
479 378 457 373 364 552 151 306 333 300 261 107 132 110 78 87 59 68 65 38 29 54 51 28 5
10 7
29,985
Growth
927 847 588 199 493 459 252 575 265 250 217 304 85
137 124 121 114 72
107 176 112 53 19 45 79 39 37 57 32 11 9 9 8
7,295
Percent Increase
10.2 %32.7 %45.9 %28.8 %16.7 %36.9 %52.6 %
152.1 %58.0 %67.0 %59.6 %55.1 %56.3 %44.8 %37.2 %40.3 %43.7 %67.3 %81.1 %
160.0 %143.6 %60.9 %32.2 %66.2 %
121.5 %102.6 %127.6 %105.6 %62.7 %39.3 %
180.0 %90.0 %
114.3 %24.3 %
State
CaliforniaTexasNew JerseyArizonaFloridaIllinoisMarylandGeorgiaWashingtonNorth CarolinaPennsylvaniaVirginiaIndianaConnecticutNevadaOhioMinnesotaNew MexicoUtahTennesseeAlabamaRhode IslandD.C.NebraskaSouth CarolinaDelawareMississippiArkansasNew HampshireAlaskaWyomingSouth DakotaMontanaNation
�0
Center for Immigration Studies
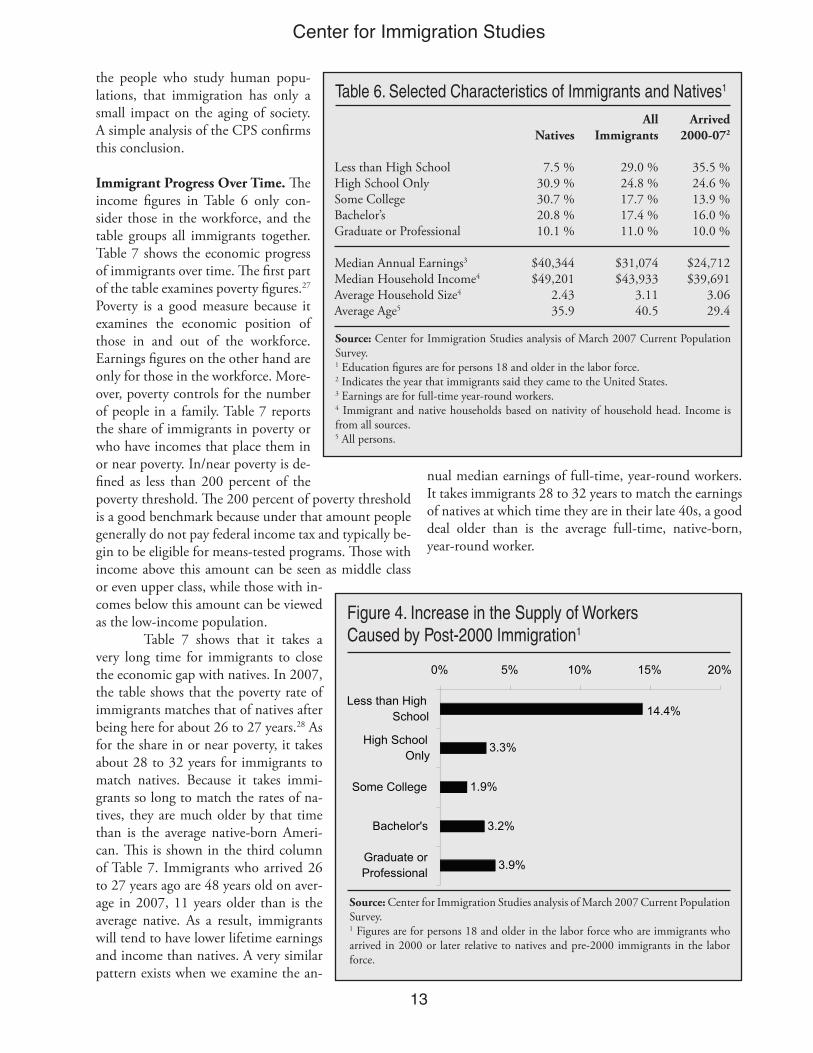
other measures of economic attainment lag far behind natives. The table also shows that a slightly higher share of natives have a bachelor’s degree than immigrants, and the share with a post-graduate degree is almost identical for the two groups. The large number of immigrants with low lev-els of education means that immigration policy has dra-matically increased the supply of workers with less than a high school degree, while increasing other educational categories more moderately. This is important because it is an indication of which American workers face the most job competition from foreign workers. While im-migrants comprise almost 16 percent of the total adult workforce, they comprise more than 40 percent of adults in the labor force who have not completed high school. Figure 4 shows how recently arrived immigrants have increased the supply of different types of workers. It re-ports the number of immigrants who arrived in 2000 or later divided by the number of natives and pre-2000 immigrants. Thus the figure shows that immigrants since 2000 increased the supply of dropouts in the workforce by 14.4 percent, compared to between 2 to 4 percent in other educational categories. This means that any effect immigration may have on the wages or job opportuni-ties of natives will disproportionately affect less-educated workers, who are already the lowest paid workers.
Immigrant and Native Income. Given the large pro-portion of immigrants with few years of schooling, it is not surprising that the income figures reported at the bottom of Table 6 (page 13) show that, as a group, im-migrants have lower median incomes than natives.22 The annual median earnings of immigrants who work full-time and year-round is only about 77 percent that of na-tives. And for the most recent immigrants, median earn-ing are only 61 percent that of natives. Another way to think about immigrant and native earnings is to examine the share of immigrants and natives who have very low incomes. If we look at the 10 percent of full-time, year-round workers with the lowest earnings, we find that 17 percent of immigrants, but only 9 percent of natives fall into the lowest-income decile.
Household Income. Another way to think about the relative position of immigrants compared to natives is to look at household income. The median household income for immigrant-headed households is $43,933, which is 89 percent that of the $49,201 for native house-holds. In addition to having lower incomes, immigrant households are 28 percent larger on average than na-tive households — 3.1 persons versus 2.4 persons. As a result, the per capita household median income of im-migrants is only 70 percent that of natives — $14,126 versus $20,247. This is important not only as a measure
Table 4. Region of Birth and Year of Entry in 2007 (thousands)
Share of All Immigrants
54.6 %31.3 %9.1 %7.3 %7.0 %
17.6 %12.5 %5.5 %3.5 %2.8 %1.9 %1.7 %
100.0 %
Source: Center for Immigration Studies analysis of March 2007 Current Population Survey. 1 Indicates the year that immigrants said they came to the United States. Included in totals are a small number of persons who did not indicate a year of arrival. 2 Includes 100,000 persons who indicated they are foreign-born, Hispanic, and Mexican, but who did not indicate a country of birth.
Total
20,372 11,671 3,379 2,725 2,597 6,558 4,646 2,044 1,310 1,030
699 621
37,280
All Latin America Mexico2
Caribbean South America Central America East/Southeast Asia Europe South Asia Middle East Sub-Saharan Africa Canada Not Given/Oceana Total
Pre-1980
3,443 1,788
886 492 277
1,233 2,007
249 344 130 309 158
7,873
1980-89
4,442 2,408
752 585 697
1,720 538 388 398 155 90
122 7,853
2000-07
6,015 3,583
781 796 855
1,682 914 727 244 396 116 161
10,258
Share of Post-2000
Arrivals
58.7 %34.9 %7.6 %7.8 %8.3 %
16.4 %8.9 %7.1 %2.4 %3.9 %1.1 %1.6 %
100.0 %
Year of Entry1
1990-99
6,467 3,890
960 852 765
1,922 1,187
680 324 349 184 180
11,293
��
Center for Immigration Studies
of their relative socio-eco-nomic standing, but also because it has significant fiscal implications. Lower household income means that in general immigrant households are likely to pay somewhat less in taxes than native house-holds. Larger household size means that in general immigrant households will use somewhat more in services than will na-tive households. Since households are the pri-mary basis on which taxes are assessed and benefits distributed in the United States, the lower income and larger size of im-migrant households has important fiscal implica-tions.23
Age of Immigrants Table 6 also shows that, in 2007, the average age of an im-migrant was 40.5 years compared to 35.9 years for the average native. The fact that immigrants have a higher average age reminds us that although immigrants may arrive relatively young, they age over time like everyone else. The belief that immigration will help fix the prob-lem of an aging society is misplaced. Of course, those who argue that immigration fundamentally changes the age structure generally have in mind new arrivals. Table 6 shows that recently arrived immigrants are somewhat younger than natives — 29.4 years compared to 35.9 years. But the overall impact on the age structure of American society is still small. One simple way to mea-sure the impact of immigration is to calculate the aver-age age in the United States with and without recent immigrants. If all 10.3 million immigrants who arrived in 2000 or later are removed from the data, the average age in the United States would be 36.7 years. Including post-2000 immigrants does lower the average age, but
only to 36.4 years. Thus, immigration over the last seven years, which has been numerically the highest in Ameri-can history, had a very modest impact on the aging of American society. It could be argued that this meager benefit to the age structure might take more than just seven years of high immigration. In a September 2005 study, the Center for Immigration Studies examined the impact of immigration on the aging of American society as well as the Social Security system. Consistent with other research, we found that immigration has only a small impact on the problem of an aging society now and in the future. While immigrants do tend to arrive relatively young, and have higher fertility rates than natives, im-migrants age just like everyone else, and the differences
Table 5. Top-25 Countries of Birth in 2007 (thousands)
Total
11,671 2,007 1,704 1,665
999 998 980 973 906 856 699 681 669 590 550 514 514 439 427 418 411 371 354 338 286
37,280
Source: Center for Immigration Studies analysis of March 2007 Current Population Survey. 1 Indicates the year that immigrants said they came to the United States. Included in totals are a tiny number of persons who did not indicate a year of arrival. 2 Includes 100,000 persons who indicated they are foreign-born, Hispanic, and Mexican, but who did not indicate a country of birth.
Share Who Are Citizens
19.8%52.3%38.5%60.3%68.8%25.8%47.6%54.7%43.4%40.1%43.2%17.4%42.7%41.0%60.4%62.6%54.0%20.3%51.1%76.3%37.2%75.8%39.0%24.9%28.0%39.0%
Mexico2
ChinaIndiaPhilippinesVietnamEl SalvadorCubaFormer USSRKoreaDominican RepublicCanadaGuatemalaColumbiaUnited KingdomJamaicaGermanyHaitiHondurasPolandItalyEcuadorIranPeruBrazilJapanWorld Total
Pre-1980
1,788 336 222 346 188 84
362 119 177 146 309 45
135 236 148 357 88 36
121 328 72
109 58 41 91
7,873
1980-89
2,408 492 314 450 288 323 120 90
264 190 90
145 154 92
175 41
138 56 77 34
102 130 74 53 26
7,854
2000-07
3,583 568 629 396 155 249 261 292 255 224 116 303 192 150 101 71
122 211 70 29 90 44
113 124 113
10,258
Year of Entry1
1990-99
3,890 610 539 473 368 336 237 471 210 296 184 188 188 112 126 45
166 136 159 27
147 88
109 120 56
11,292
�2
Center for Immigration Studies
with natives are not large enough to fundamentally alter the nation’s age structure. After looking at the impact of different levels of immigration over the next century, a Census Bureau report stated in 2000 that immigration is a “highly inefficient” means for increasing the percent-age of the population who are of working-age in the long run.24 Our detailed look at the full impact of immigra-tion on the nation’s age structure is available online.25
Recently the Center for Immigration Studies completed a series of population projections examining the impact of different levels of immigration on the size and aging of American society. We found that although the current level of immigration will add 105 million to the U.S. population by 2060, it has only a small impact on the share of the population that will be of working age.26 There is a clear consensus among demographers,
Figure 3. Immigrants and Natives by Race
Race of Post-2000 ImmigrantsRace of Immigrants
Natives Excluding Young Children (under 18) of Immigrants1
Race of Natives
Source: Center for Immigration Studies analysis of March 2007 Current Population Survey. Figures for whites, blacks, and Asian/Pacific Islanders are for persons who chose only one race.1 Excludes U.S.-born children (under age 18) of immigrant fathers.
White20.9 %
Black7.5 %
Asian/Pacific Islander23.0 %
Hispanic48.3 %
Multi-Race/American Indian0.3 %
White72.6 %
Black12.8 %
Asian/Pacific Islander1.9 % Hispanic
10.3 %
Multi-Race/American Indian2.3 %
White75.4 %
Black13.0 %
Asian/Pacific Islander1.2 % Hispanic
7.9 %
Multi-Race/American Indian2.4 %
White15.4 %
Black7.6 %
Asian/Pacific Islander23.0 %
Hispanic53.8 %
Multi-Race/American Indian0.3 %
��
Center for Immigration Studies
the people who study human popu-lations, that immigration has only a small impact on the aging of society. A simple analysis of the CPS confirms this conclusion.
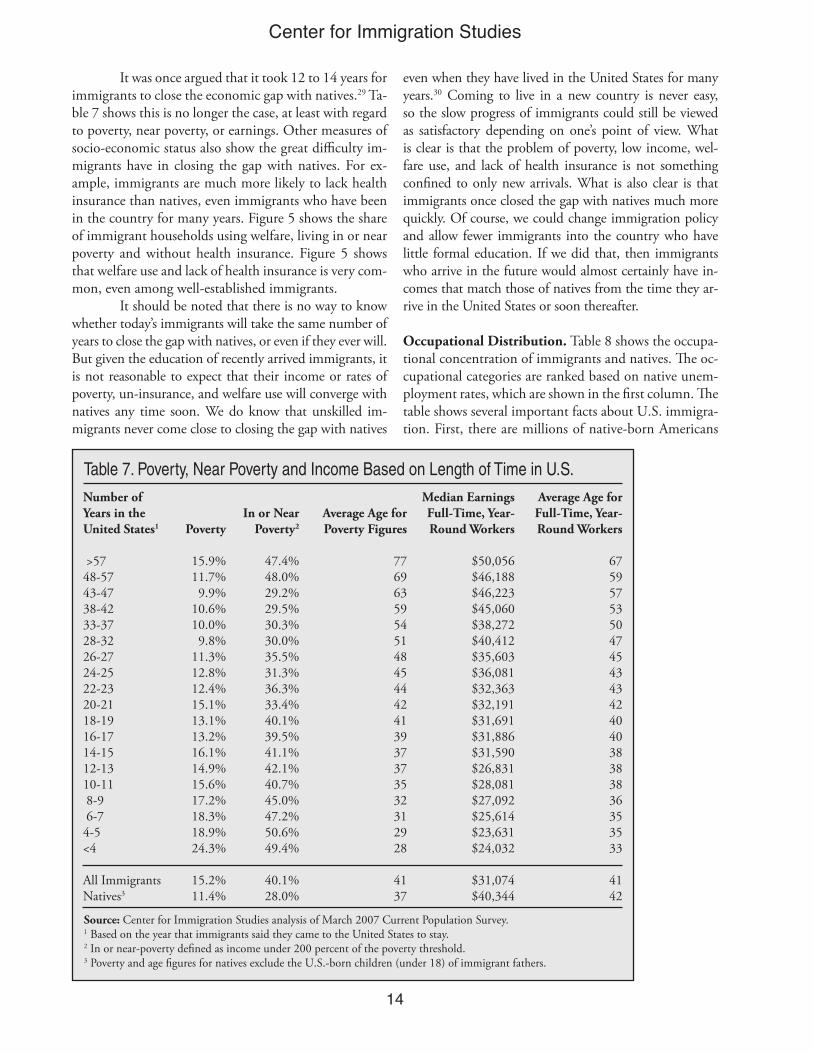
Immigrant Progress Over Time. The income figures in Table 6 only con-sider those in the workforce, and the table groups all immigrants together. Table 7 shows the economic progress of immigrants over time. The first part of the table examines poverty figures.27 Poverty is a good measure because it examines the economic position of those in and out of the workforce. Earnings figures on the other hand are only for those in the workforce. More-over, poverty controls for the number of people in a family. Table 7 reports the share of immigrants in poverty or who have incomes that place them in or near poverty. In/near poverty is de-fined as less than 200 percent of the poverty threshold. The 200 percent of poverty threshold is a good benchmark because under that amount people generally do not pay federal income tax and typically be-gin to be eligible for means-tested programs. Those with income above this amount can be seen as middle class or even upper class, while those with in-comes below this amount can be viewed as the low-income population. Table 7 shows that it takes a very long time for immigrants to close the economic gap with natives. In 2007, the table shows that the poverty rate of immigrants matches that of natives after being here for about 26 to 27 years.28 As for the share in or near poverty, it takes about 28 to 32 years for immigrants to match natives. Because it takes immi-grants so long to match the rates of na-tives, they are much older by that time than is the average native-born Ameri-can. This is shown in the third column of Table 7. Immigrants who arrived 26 to 27 years ago are 48 years old on aver-age in 2007, 11 years older than is the average native. As a result, immigrants will tend to have lower lifetime earnings and income than natives. A very similar pattern exists when we examine the an-
nual median earnings of full-time, year-round workers. It takes immigrants 28 to 32 years to match the earnings of natives at which time they are in their late 40s, a good deal older than is the average full-time, native-born, year-round worker.
Table 6. Selected Characteristics of Immigrants and Natives1
Source: Center for Immigration Studies analysis of March 2007 Current Population Survey. 1 Education figures are for persons 18 and older in the labor force. 2 Indicates the year that immigrants said they came to the United States.3 Earnings are for full-time year-round workers.4 Immigrant and native households based on nativity of household head. Income is from all sources. 5 All persons.
Less than High SchoolHigh School OnlySome CollegeBachelor’s Graduate or Professional
Median Annual Earnings3
Median Household Income4
Average Household Size4
Average Age5
Natives
7.5 %30.9 %30.7 %20.8 %10.1 %
$40,344$49,201
2.4335.9
Arrived2000-072
35.5 %24.6 %13.9 %16.0 %10.0 %
$24,712 $39,691
3.0629.4
All Immigrants
29.0 %24.8 %17.7 %17.4 %11.0 %
$31,074$43,933
3.1140.5
Figure 4. Increase in the Supply of Workers Caused by Post-2000 Immigration1
Source: Center for Immigration Studies analysis of March 2007 Current Population Survey. 1 Figures are for persons 18 and older in the labor force who are immigrants who arrived in 2000 or later relative to natives and pre-2000 immigrants in the labor force.
��
Center for Immigration Studies
It was once argued that it took 12 to 14 years for immigrants to close the economic gap with natives.29 Ta-ble 7 shows this is no longer the case, at least with regard to poverty, near poverty, or earnings. Other measures of socio-economic status also show the great difficulty im-migrants have in closing the gap with natives. For ex-ample, immigrants are much more likely to lack health insurance than natives, even immigrants who have been in the country for many years. Figure 5 shows the share of immigrant households using welfare, living in or near poverty and without health insurance. Figure 5 shows that welfare use and lack of health insurance is very com-mon, even among well-established immigrants. It should be noted that there is no way to know whether today’s immigrants will take the same number of years to close the gap with natives, or even if they ever will. But given the education of recently arrived immigrants, it is not reasonable to expect that their income or rates of poverty, un-insurance, and welfare use will converge with natives any time soon. We do know that unskilled im-migrants never come close to closing the gap with natives
even when they have lived in the United States for many years.30 Coming to live in a new country is never easy, so the slow progress of immigrants could still be viewed as satisfactory depending on one’s point of view. What is clear is that the problem of poverty, low income, wel-fare use, and lack of health insurance is not something confined to only new arrivals. What is also clear is that immigrants once closed the gap with natives much more quickly. Of course, we could change immigration policy and allow fewer immigrants into the country who have little formal education. If we did that, then immigrants who arrive in the future would almost certainly have in-comes that match those of natives from the time they ar-rive in the United States or soon thereafter.
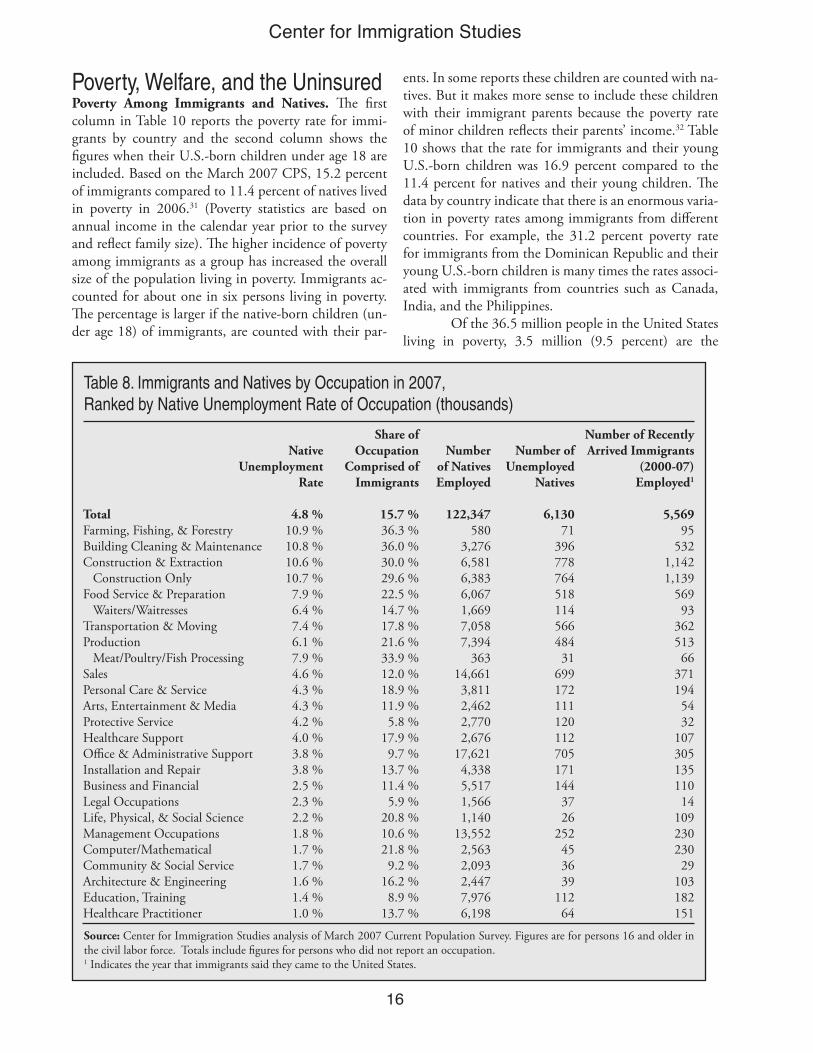
Occupational Distribution. Table 8 shows the occupa-tional concentration of immigrants and natives. The oc-cupational categories are ranked based on native unem-ployment rates, which are shown in the first column. The table shows several important facts about U.S. immigra-tion. First, there are millions of native-born Americans
Table 7. Poverty, Near Poverty and Income Based on Length of Time in U.S.
Source: Center for Immigration Studies analysis of March 2007 Current Population Survey. 1 Based on the year that immigrants said they came to the United States to stay.2 In or near-poverty defined as income under 200 percent of the poverty threshold.3 Poverty and age figures for natives exclude the U.S.-born children (under 18) of immigrant fathers.
Number of Years in the United States1
>57 48-5743-4738-4233-3728-3226-2724-2522-2320-2118-1916-1714-1512-1310-11 8-9 6-7 4-5<4
All ImmigrantsNatives3
Poverty
15.9%11.7%9.9%
10.6%10.0%9.8%
11.3%12.8%12.4%15.1%13.1%13.2%16.1%14.9%15.6%17.2%18.3%18.9%24.3%
15.2%11.4%
Average Age for Poverty Figures
77696359545148454442413937373532312928
4137
In or Near Poverty2
47.4%48.0%29.2%29.5%30.3%30.0%35.5%31.3%36.3%33.4%40.1%39.5%41.1%42.1%40.7%45.0%47.2%50.6%49.4%
40.1%28.0%
Median Earnings Full-Time, Year-Round Workers
$50,056 $46,188 $46,223 $45,060 $38,272 $40,412 $35,603 $36,081 $32,363 $32,191 $31,691 $31,886 $31,590 $26,831 $28,081 $27,092 $25,614 $23,631 $24,032
$31,074$40,344
Average Age for Full-Time, Year-Round Workers
67595753504745434342404038383836353533
4142

��
Center for Immigration Studies
employed in occupations that have high concentrations of immigrants. While immigrants certainly are concen-trated in particular occupations, it’s simply not correct to say that immigrants only do jobs natives don’t want. The occupational categories of farming/fishing/forestry, construction, building cleaning/maintenance, and food service and preparation currently employ 16.5 million native-born Americans. The second interesting finding in Table 8 is that in the occupations just listed there are nearly 1.8 million unemployed natives. Moreover, na-tive unemployment averages 10 percent in these occupa-tions. Perhaps the labor is not where employers wanted, or there is some other reason businesses find these unem-ployed natives unacceptable in some way, but on its face Table 8 indicates that there is quite a lot of unutilized labor of this kind in the United States. Its also worth considering that the correlation between native unemployment rates and the share of an occupation that is comprised of immigrants is .80. The square of a correlation, in this case .63, can be interpreted to mean that the presence of immigrants in an occupa-tion explains 63 percent of the variation in native unem-ployment rates across occupations. Of course, a correlation does not prove that immigration adversely impacts the employment prospects of natives. It would be a mistake to think that every job taken by an immigrant is a job lost by a native. Many fac-tors impact unemploy-ment rates across occu-pations. But it would also be a mistake to as-sume that dramatically increasing the number of workers in these oc-cupations as a result of immigration policy has no impact on the employment prospects of some natives. Given the large number of na-tives employed in these immigrant-heavy occu-pations, it would be in-
correct to argue that immigrants only do jobs American don’t want.
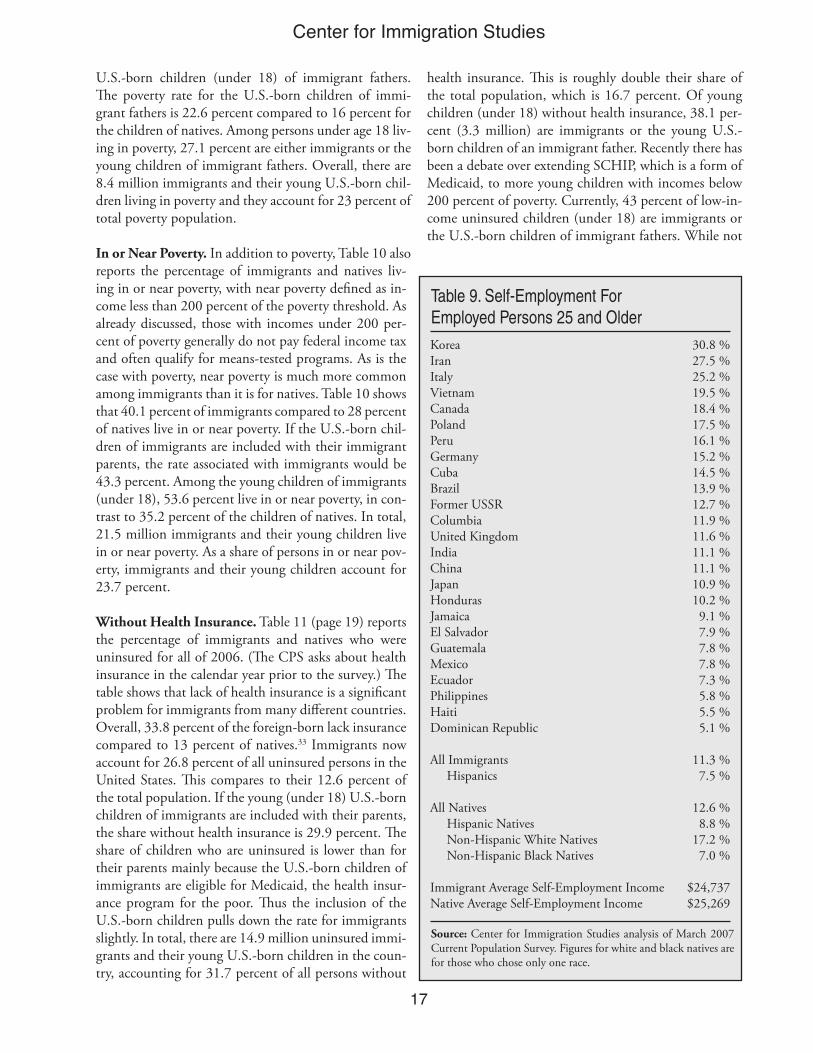
Self Employment. Table 9 examines the self-employ-ment rates of immigrants and natives. The table shows that immigrants and natives exhibit remarkably similar levels of entrepreneurship. The table shows that 11.3 percent of immigrants and 12.6 percent of natives are self-employed. Turning to self-employment income re-ported at the bottom of Table 9, we see that the average self-employment income (revenue minus expenses) for both immigrants and natives is virtually identical. While immigrants overall are not more entrepreneurial than natives, immigrants from such countries as Korea, Iran, Italy, and Vietnam are significantly more likely than na-tives to be self-employed. But, overall entrepreneurship is neither lacking nor a distinguishing characteristic of the nation’s immigrants. If one removed immigrants from the data, the overall rate of self-employment in the United States would be about the same.
Figure 5. Well-established immigrants still have higher rates of welfare use, poverty, and lack of heath insurance than natives.1
Source: Center for Immigration Studies analysis of March 2007 Current Population Survey. 1 Welfare use based on nativity of household head. Figures for use of any welfare include use of public/rent subsidized housing in addition to cash assistance, food assistance, and Medicaid. 2 Anyone in the household using TANF, SSI, or state general assistance programs.3 Anyone in the household using food stamps, WIC, or free school lunch.4 Anyone in the household using Medicaid.5 U.S.-born children (under 18) of immigrant fathers are included with immigrants.6 In or near poverty defined as less than 200 percent of poverty threshold.
��
Center for Immigration Studies
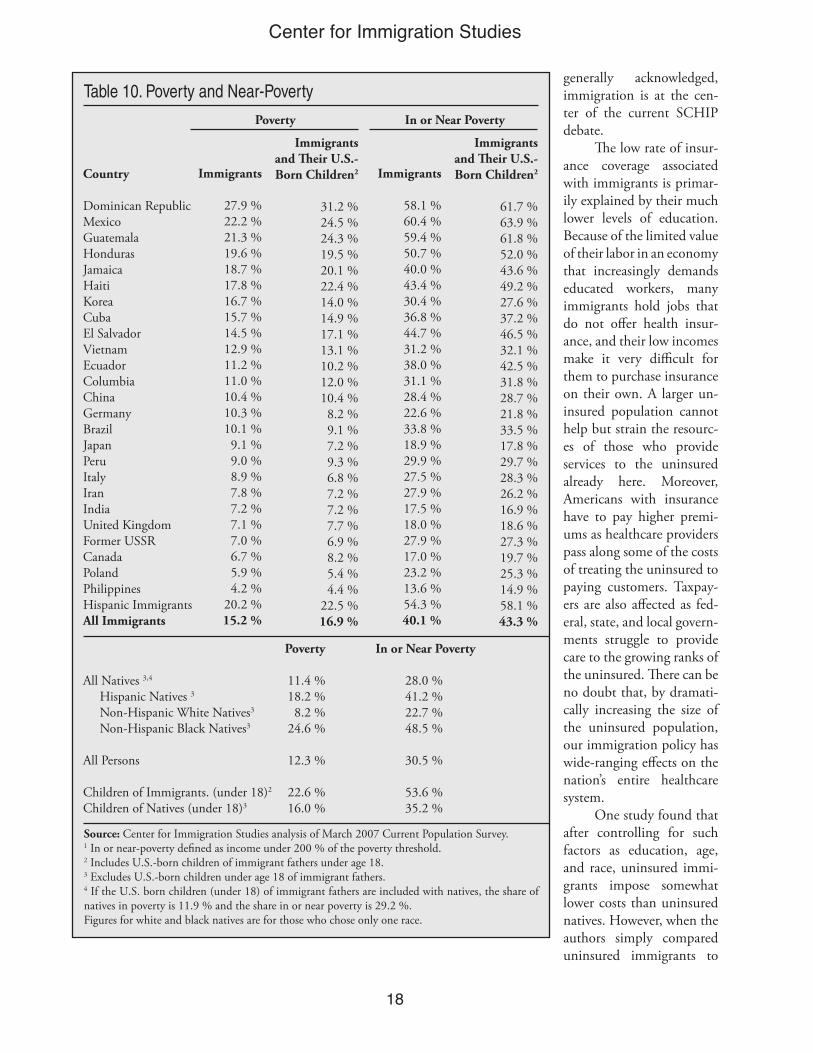
Poverty, Welfare, and the UninsuredPoverty Among Immigrants and Natives. The first column in Table 10 reports the poverty rate for immi-grants by country and the second column shows the figures when their U.S.-born children under age 18 are included. Based on the March 2007 CPS, 15.2 percent of immigrants compared to 11.4 percent of natives lived in poverty in 2006.31 (Poverty statistics are based on annual income in the calendar year prior to the survey and reflect family size). The higher incidence of poverty among immigrants as a group has increased the overall size of the population living in poverty. Immigrants ac-counted for about one in six persons living in poverty. The percentage is larger if the native-born children (un-der age 18) of immigrants, are counted with their par-
ents. In some reports these children are counted with na-tives. But it makes more sense to include these children with their immigrant parents because the poverty rate of minor children reflects their parents’ income.32 Table 10 shows that the rate for immigrants and their young U.S.-born children was 16.9 percent compared to the 11.4 percent for natives and their young children. The data by country indicate that there is an enormous varia-tion in poverty rates among immigrants from different countries. For example, the 31.2 percent poverty rate for immigrants from the Dominican Republic and their young U.S.-born children is many times the rates associ-ated with immigrants from countries such as Canada, India, and the Philippines. Of the 36.5 million people in the United States living in poverty, 3.5 million (9.5 percent) are the
Table 8. Immigrants and Natives by Occupation in 2007, Ranked by Native Unemployment Rate of Occupation (thousands)
Source: Center for Immigration Studies analysis of March 2007 Current Population Survey. Figures are for persons 16 and older in the civil labor force. Totals include figures for persons who did not report an occupation. 1 Indicates the year that immigrants said they came to the United States.
Total Farming, Fishing, & ForestryBuilding Cleaning & MaintenanceConstruction & Extraction Construction OnlyFood Service & Preparation Waiters/WaitressesTransportation & MovingProduction Meat/Poultry/Fish ProcessingSalesPersonal Care & ServiceArts, Entertainment & MediaProtective ServiceHealthcare SupportOffice & Administrative SupportInstallation and RepairBusiness and FinancialLegal OccupationsLife, Physical, & Social ScienceManagement OccupationsComputer/MathematicalCommunity & Social ServiceArchitecture & EngineeringEducation, TrainingHealthcare Practitioner
Share of Occupation
Comprised of Immigrants
15.7 %36.3 %36.0 %30.0 %29.6 %22.5 %14.7 %17.8 %21.6 %33.9 %12.0 %18.9 %11.9 %5.8 %
17.9 %9.7 %
13.7 %11.4 %5.9 %
20.8 %10.6 %21.8 %9.2 %
16.2 %8.9 %
13.7 %
Native Unemployment
Rate
4.8 %10.9 %10.8 %10.6 %10.7 %7.9 %6.4 %7.4 %6.1 %7.9 %4.6 %4.3 %4.3 %4.2 %4.0 %3.8 %3.8 %2.5 %2.3 %2.2 %1.8 %1.7 %1.7 %1.6 %1.4 %1.0 %
Number of Natives Employed
122,347 580
3,276 6,581 6,383 6,067 1,669 7,058 7,394
363 14,661 3,811 2,462 2,770 2,676
17,621 4,338 5,517 1,566 1,140
13,552 2,563 2,093 2,447 7,976 6,198
Number of Recently Arrived Immigrants
(2000-07) Employed1
5,569 95
532 1,142 1,139
569 93
362 513 66
371 194 54 32
107 305 135 110 14
109 230 230 29
103 182 151
Number of Unemployed
Natives
6,130 71
396 778 764 518 114 566 484 31
699 172 111 120 112 705 171 144 37 26
252 45 36 39
112 64
�7
Center for Immigration Studies
U.S.-born children (under 18) of immigrant fathers. The poverty rate for the U.S.-born children of immi-grant fathers is 22.6 percent compared to 16 percent for the children of natives. Among persons under age 18 liv-ing in poverty, 27.1 percent are either immigrants or the young children of immigrant fathers. Overall, there are 8.4 million immigrants and their young U.S.-born chil-dren living in poverty and they account for 23 percent of total poverty population.
In or Near Poverty. In addition to poverty, Table 10 also reports the percentage of immigrants and natives liv-ing in or near poverty, with near poverty defined as in-come less than 200 percent of the poverty threshold. As already discussed, those with incomes under 200 per-cent of poverty generally do not pay federal income tax and often qualify for means-tested programs. As is the case with poverty, near poverty is much more common among immigrants than it is for natives. Table 10 shows that 40.1 percent of immigrants compared to 28 percent of natives live in or near poverty. If the U.S.-born chil-dren of immigrants are included with their immigrant parents, the rate associated with immigrants would be 43.3 percent. Among the young children of immigrants (under 18), 53.6 percent live in or near poverty, in con-trast to 35.2 percent of the children of natives. In total, 21.5 million immigrants and their young children live in or near poverty. As a share of persons in or near pov-erty, immigrants and their young children account for 23.7 percent.
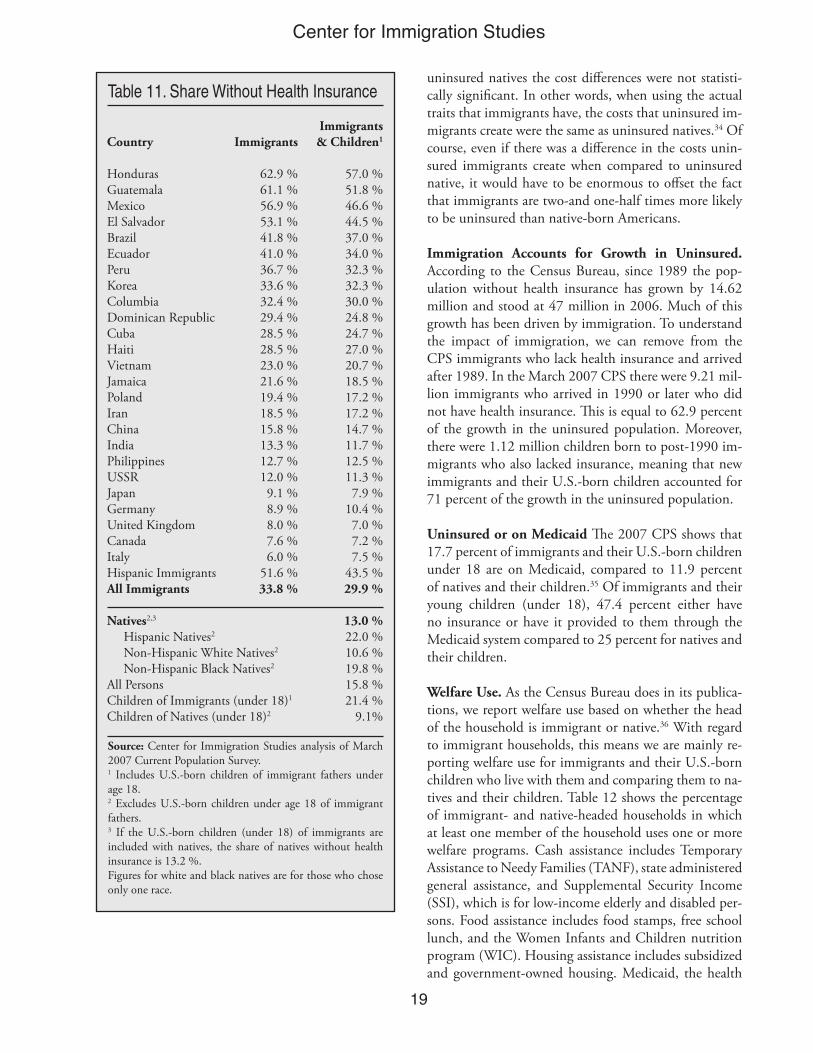
Without Health Insurance. Table 11 (page 19) reports the percentage of immigrants and natives who were uninsured for all of 2006. (The CPS asks about health insurance in the calendar year prior to the survey.) The table shows that lack of health insurance is a significant problem for immigrants from many different countries. Overall, 33.8 percent of the foreign-born lack insurance compared to 13 percent of natives.33 Immigrants now account for 26.8 percent of all uninsured persons in the United States. This compares to their 12.6 percent of the total population. If the young (under 18) U.S.-born children of immigrants are included with their parents, the share without health insurance is 29.9 percent. The share of children who are uninsured is lower than for their parents mainly because the U.S.-born children of immigrants are eligible for Medicaid, the health insur-ance program for the poor. Thus the inclusion of the U.S.-born children pulls down the rate for immigrants slightly. In total, there are 14.9 million uninsured immi-grants and their young U.S.-born children in the coun-try, accounting for 31.7 percent of all persons without
health insurance. This is roughly double their share of the total population, which is 16.7 percent. Of young children (under 18) without health insurance, 38.1 per-cent (3.3 million) are immigrants or the young U.S.-born children of an immigrant father. Recently there has been a debate over extending SCHIP, which is a form of Medicaid, to more young children with incomes below 200 percent of poverty. Currently, 43 percent of low-in-come uninsured children (under 18) are immigrants or the U.S.-born children of immigrant fathers. While not
Table 9. Self-Employment For Employed Persons 25 and Older
Source: Center for Immigration Studies analysis of March 2007 Current Population Survey. Figures for white and black natives are for those who chose only one race.
KoreaIranItalyVietnamCanadaPolandPeruGermanyCubaBrazilFormer USSRColumbiaUnited KingdomIndiaChinaJapanHondurasJamaicaEl SalvadorGuatemalaMexicoEcuadorPhilippinesHaitiDominican Republic
All Immigrants Hispanics
All Natives Hispanic Natives Non-Hispanic White Natives Non-Hispanic Black Natives
Immigrant Average Self-Employment IncomeNative Average Self-Employment Income
30.8 %27.5 %25.2 %19.5 %18.4 %17.5 %16.1 %15.2 %14.5 %13.9 %12.7 %11.9 %11.6 %11.1 %11.1 %10.9 %10.2 %9.1 %7.9 %7.8 %7.8 %7.3 %5.8 %5.5 %5.1 %
11.3 %7.5 %
12.6 %8.8 %
17.2 %7.0 %
$24,737 $25,269
��
Center for Immigration Studies
generally acknowledged, immigration is at the cen-ter of the current SCHIP debate. The low rate of insur-ance coverage associated with immigrants is primar-ily explained by their much lower levels of education. Because of the limited value of their labor in an economy that increasingly demands educated workers, many immigrants hold jobs that do not offer health insur-ance, and their low incomes make it very difficult for them to purchase insurance on their own. A larger un-insured population cannot help but strain the resourc-es of those who provide services to the uninsured already here. Moreover, Americans with insurance have to pay higher premi-ums as healthcare providers pass along some of the costs of treating the uninsured to paying customers. Taxpay-ers are also affected as fed-eral, state, and local govern-ments struggle to provide care to the growing ranks of the uninsured. There can be no doubt that, by dramati-cally increasing the size of the uninsured population, our immigration policy has wide-ranging effects on the nation’s entire healthcare system. One study found that after controlling for such factors as education, age, and race, uninsured immi-grants impose somewhat lower costs than uninsured natives. However, when the authors simply compared uninsured immigrants to
Table 10. Poverty and Near-Poverty
Source: Center for Immigration Studies analysis of March 2007 Current Population Survey. 1 In or near-poverty defined as income under 200 % of the poverty threshold. 2 Includes U.S.-born children of immigrant fathers under age 18.3 Excludes U.S.-born children under age 18 of immigrant fathers.4 If the U.S. born children (under 18) of immigrant fathers are included with natives, the share of natives in poverty is 11.9 % and the share in or near poverty is 29.2 %. Figures for white and black natives are for those who chose only one race.
Country
Dominican RepublicMexicoGuatemalaHondurasJamaicaHaitiKoreaCubaEl SalvadorVietnamEcuadorColumbiaChinaGermanyBrazilJapanPeruItalyIranIndiaUnited KingdomFormer USSRCanadaPolandPhilippinesHispanic ImmigrantsAll Immigrants
Immigrants
27.9 %22.2 %21.3 %19.6 %18.7 %17.8 %16.7 %15.7 %14.5 %12.9 %11.2 %11.0 %10.4 %10.3 %10.1 %9.1 %9.0 %8.9 %7.8 %7.2 %7.1 %7.0 %6.7 %5.9 %4.2 %
20.2 %15.2 %
Poverty
Immigrants and Their U.S.-Born Children2
31.2 %24.5 %24.3 %19.5 %20.1 %22.4 %14.0 %14.9 %17.1 %13.1 %10.2 %12.0 %10.4 %8.2 %9.1 %7.2 %9.3 %6.8 %7.2 %7.2 %7.7 %6.9 %8.2 %5.4 %4.4 %
22.5 %16.9 %
Immigrants
58.1 %60.4 %59.4 %50.7 %40.0 %43.4 %30.4 %36.8 %44.7 %31.2 %38.0 %31.1 %28.4 %22.6 %33.8 %18.9 %29.9 %27.5 %27.9 %17.5 %18.0 %27.9 %17.0 %23.2 %13.6 %54.3 %40.1 %
In or Near Poverty
Immigrants and Their U.S.-Born Children2
61.7 %63.9 %61.8 %52.0 %43.6 %49.2 %27.6 %37.2 %46.5 %32.1 %42.5 %31.8 %28.7 %21.8 %33.5 %17.8 %29.7 %28.3 %26.2 %16.9 %18.6 %27.3 %19.7 %25.3 %14.9 %58.1 %43.3 %
All Natives 3,4
Hispanic Natives 3
Non-Hispanic White Natives3
Non-Hispanic Black Natives3
All Persons
Children of Immigrants. (under 18)2
Children of Natives (under 18)3
Poverty
11.4 %18.2 %8.2 %
24.6 %
12.3 %
22.6 %16.0 %
28.0 %41.2 %22.7 %48.5 %
30.5 %
53.6 %35.2 %
In or Near Poverty
��
Center for Immigration Studies
uninsured natives the cost differences were not statisti-cally significant. In other words, when using the actual traits that immigrants have, the costs that uninsured im-migrants create were the same as uninsured natives.34 Of course, even if there was a difference in the costs unin-sured immigrants create when compared to uninsured native, it would have to be enormous to offset the fact that immigrants are two-and one-half times more likely to be uninsured than native-born Americans.
Immigration Accounts for Growth in Uninsured. According to the Census Bureau, since 1989 the pop-ulation without health insurance has grown by 14.62 million and stood at 47 million in 2006. Much of this growth has been driven by immigration. To understand the impact of immigration, we can remove from the CPS immigrants who lack health insurance and arrived after 1989. In the March 2007 CPS there were 9.21 mil-lion immigrants who arrived in 1990 or later who did not have health insurance. This is equal to 62.9 percent of the growth in the uninsured population. Moreover, there were 1.12 million children born to post-1990 im-migrants who also lacked insurance, meaning that new immigrants and their U.S.-born children accounted for 71 percent of the growth in the uninsured population.
Uninsured or on Medicaid The 2007 CPS shows that 17.7 percent of immigrants and their U.S.-born children under 18 are on Medicaid, compared to 11.9 percent of natives and their children.35 Of immigrants and their young children (under 18), 47.4 percent either have no insurance or have it provided to them through the Medicaid system compared to 25 percent for natives and their children.
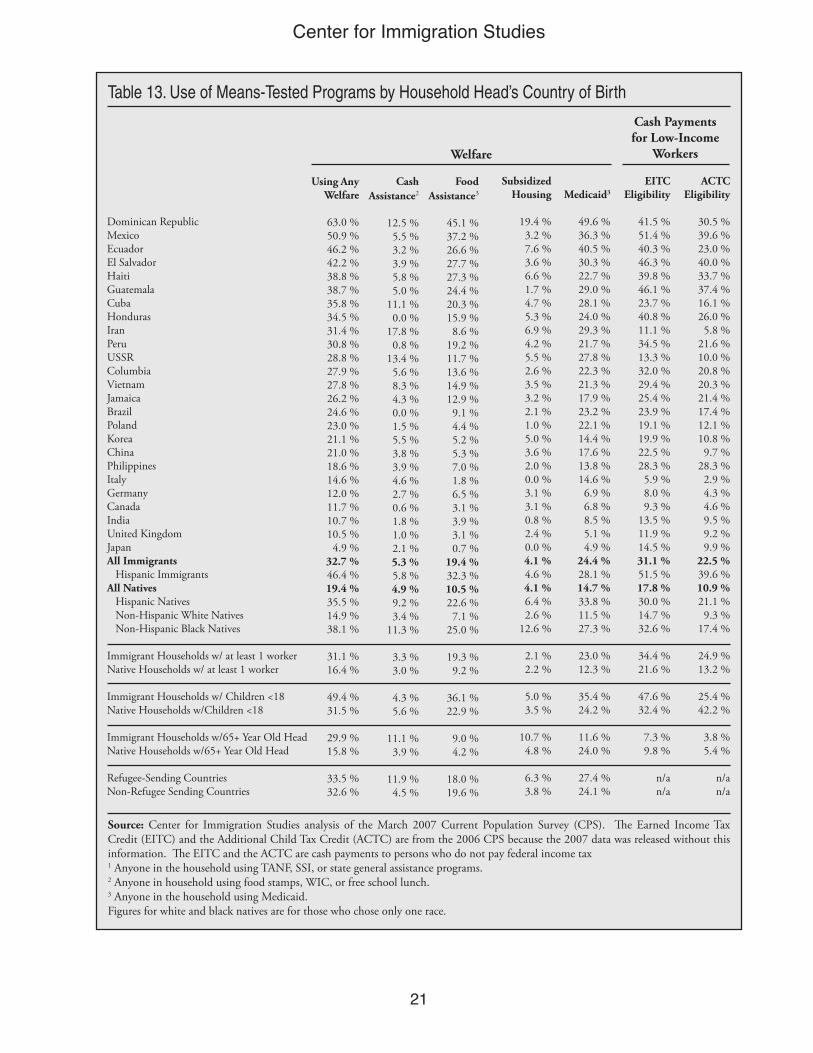
Welfare Use. As the Census Bureau does in its publica-tions, we report welfare use based on whether the head of the household is immigrant or native.36 With regard to immigrant households, this means we are mainly re-porting welfare use for immigrants and their U.S.-born children who live with them and comparing them to na-tives and their children. Table 12 shows the percentage of immigrant- and native-headed households in which at least one member of the household uses one or more welfare programs. Cash assistance includes Temporary Assistance to Needy Families (TANF), state administered general assistance, and Supplemental Security Income (SSI), which is for low-income elderly and disabled per-sons. Food assistance includes food stamps, free school lunch, and the Women Infants and Children nutrition program (WIC). Housing assistance includes subsidized and government-owned housing. Medicaid, the health
Table 11. Share Without Health Insurance
Immigrants
62.9 %61.1 %56.9 %53.1 %41.8 %41.0 %36.7 %33.6 %32.4 %29.4 %28.5 %28.5 %23.0 %21.6 %19.4 %18.5 %15.8 %13.3 %12.7 %12.0 %9.1 %8.9 %8.0 %7.6 %6.0 %
51.6 %33.8 %
Source: Center for Immigration Studies analysis of March 2007 Current Population Survey. 1 Includes U.S.-born children of immigrant fathers under age 18.2 Excludes U.S.-born children under age 18 of immigrant fathers.3 If the U.S.-born children (under 18) of immigrants are included with natives, the share of natives without health insurance is 13.2 %.
Figures for white and black natives are for those who chose only one race.
Immigrants & Children1
57.0 %51.8 %46.6 %44.5 %37.0 %34.0 %32.3 %32.3 %30.0 %24.8 %24.7 %27.0 %20.7 %18.5 %17.2 %17.2 %14.7 %11.7 %12.5 %11.3 %7.9 %
10.4 %7.0 %7.2 %7.5 %
43.5 %29.9 %
13.0 %22.0 %10.6 %19.8 %15.8 %21.4 %
9.1%
Country
HondurasGuatemalaMexicoEl SalvadorBrazilEcuadorPeruKoreaColumbiaDominican RepublicCubaHaitiVietnamJamaicaPolandIranChinaIndiaPhilippinesUSSRJapanGermanyUnited KingdomCanadaItalyHispanic ImmigrantsAll Immigrants
Natives2,3
Hispanic Natives2
Non-Hispanic White Natives2
Non-Hispanic Black Natives2
All PersonsChildren of Immigrants (under 18)1
Children of Natives (under 18)2
20
Center for Immigration Studies
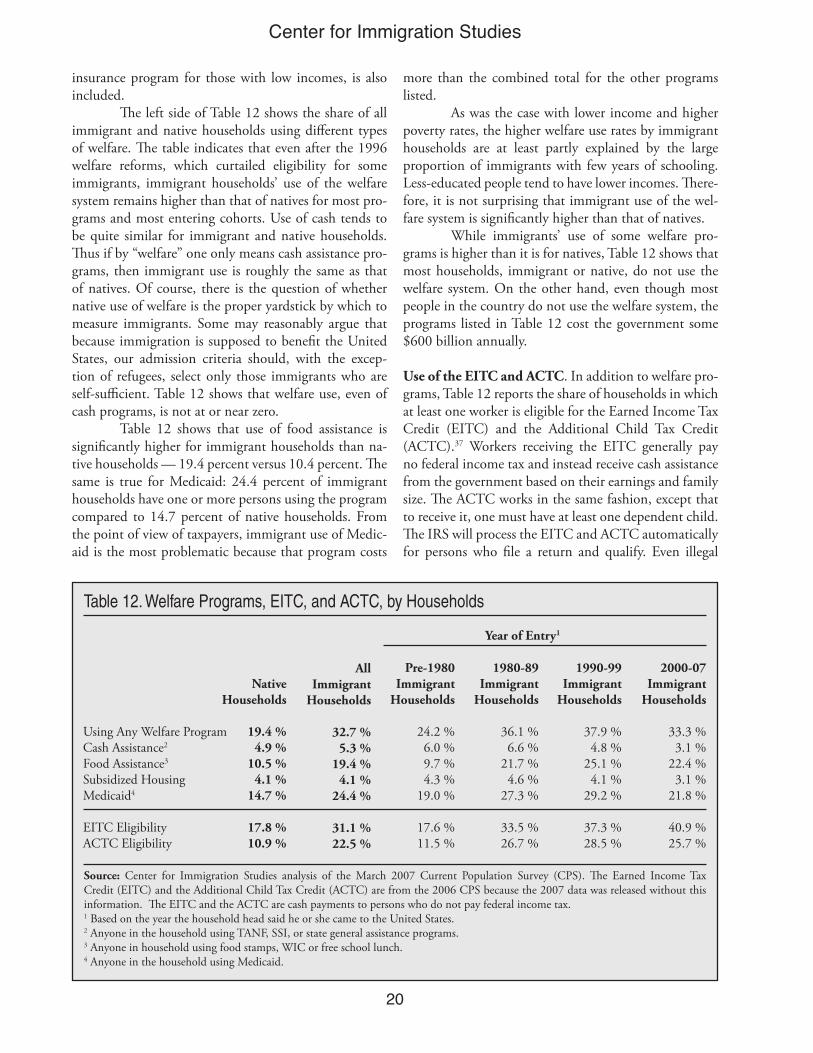
insurance program for those with low incomes, is also included. The left side of Table 12 shows the share of all immigrant and native households using different types of welfare. The table indicates that even after the 1996 welfare reforms, which curtailed eligibility for some immigrants, immigrant households’ use of the welfare system remains higher than that of natives for most pro-grams and most entering cohorts. Use of cash tends to be quite similar for immigrant and native households. Thus if by “welfare” one only means cash assistance pro-grams, then immigrant use is roughly the same as that of natives. Of course, there is the question of whether native use of welfare is the proper yardstick by which to measure immigrants. Some may reasonably argue that because immigration is supposed to benefit the United States, our admission criteria should, with the excep-tion of refugees, select only those immigrants who are self-sufficient. Table 12 shows that welfare use, even of cash programs, is not at or near zero.
Table 12 shows that use of food assistance is significantly higher for immigrant households than na-tive households — 19.4 percent versus 10.4 percent. The same is true for Medicaid: 24.4 percent of immigrant households have one or more persons using the program compared to 14.7 percent of native households. From the point of view of taxpayers, immigrant use of Medic-aid is the most problematic because that program costs
more than the combined total for the other programs listed. As was the case with lower income and higher poverty rates, the higher welfare use rates by immigrant households are at least partly explained by the large proportion of immigrants with few years of schooling. Less-educated people tend to have lower incomes. There-fore, it is not surprising that immigrant use of the wel-fare system is significantly higher than that of natives. While immigrants’ use of some welfare pro-grams is higher than it is for natives, Table 12 shows that most households, immigrant or native, do not use the welfare system. On the other hand, even though most people in the country do not use the welfare system, the programs listed in Table 12 cost the government some $600 billion annually.
Use of the EITC and ACTC. In addition to welfare pro-grams, Table 12 reports the share of households in which at least one worker is eligible for the Earned Income Tax Credit (EITC) and the Additional Child Tax Credit (ACTC).37 Workers receiving the EITC generally pay no federal income tax and instead receive cash assistance from the government based on their earnings and family size. The ACTC works in the same fashion, except that to receive it, one must have at least one dependent child. The IRS will process the EITC and ACTC automatically for persons who file a return and qualify. Even illegal
Table 12. Welfare Programs, EITC, and ACTC, by Households
Native Households
19.4 %4.9 %
10.5 %4.1 %
14.7 %
17.8 %10.9 %
Source: Center for Immigration Studies analysis of the March 2007 Current Population Survey (CPS). The Earned Income Tax Credit (EITC) and the Additional Child Tax Credit (ACTC) are from the 2006 CPS because the 2007 data was released without this information. The EITC and the ACTC are cash payments to persons who do not pay federal income tax.1 Based on the year the household head said he or she came to the United States. 2 Anyone in the household using TANF, SSI, or state general assistance programs.3 Anyone in household using food stamps, WIC or free school lunch. 4 Anyone in the household using Medicaid.
All Immigrant
Households
32.7 %5.3 %
19.4 %4.1 %
24.4 %
31.1 %22.5 %
Using Any Welfare ProgramCash Assistance2
Food Assistance3
Subsidized HousingMedicaid4
EITC EligibilityACTC Eligibility
Pre-1980 Immigrant
Households
24.2 %6.0 %9.7 %4.3 %
19.0 %
17.6 %11.5 %
1980-89 Immigrant
Households
36.1 %6.6 %
21.7 %4.6 %
27.3 %
33.5 %26.7 %
2000-07 Immigrant
Households
33.3 %3.1 %
22.4 %3.1 %
21.8 %
40.9 %25.7 %
Year of Entry1
1990-99 Immigrant
Households
37.9 %4.8 %
25.1 %4.1 %
29.2 %
37.3 %28.5 %
2�
Center for Immigration Studies
Table 13. Use of Means-Tested Programs by Household Head’s Country of Birth
Using Any Welfare
63.0 %50.9 %46.2 %42.2 %38.8 %38.7 %35.8 %34.5 %31.4 %30.8 %28.8 %27.9 %27.8 %26.2 %24.6 %23.0 %21.1 %21.0 %18.6 %14.6 %12.0 %11.7 %10.7 %10.5 %4.9 %
32.7 %46.4 %19.4 %35.5 %14.9 %38.1 %
31.1 %16.4 %
49.4 %31.5 %
29.9 %15.8 %
33.5 %32.6 %
Source: Center for Immigration Studies analysis of the March 2007 Current Population Survey (CPS). The Earned Income Tax Credit (EITC) and the Additional Child Tax Credit (ACTC) are from the 2006 CPS because the 2007 data was released without this information. The EITC and the ACTC are cash payments to persons who do not pay federal income tax1 Anyone in the household using TANF, SSI, or state general assistance programs.2 Anyone in household using food stamps, WIC, or free school lunch.3 Anyone in the household using Medicaid. Figures for white and black natives are for those who chose only one race.
Cash Assistance2
12.5 %5.5 %3.2 %3.9 %5.8 %5.0 %
11.1 %0.0 %
17.8 %0.8 %
13.4 %5.6 %8.3 %4.3 %0.0 %1.5 %5.5 %3.8 %3.9 %4.6 %2.7 %0.6 %1.8 %1.0 %2.1 %5.3 %5.8 %4.9 %9.2 %3.4 %
11.3 %
3.3 %3.0 %
4.3 %5.6 %
11.1 %3.9 %
11.9 %4.5 %
Dominican RepublicMexicoEcuadorEl SalvadorHaitiGuatemalaCubaHondurasIranPeruUSSRColumbiaVietnamJamaicaBrazilPolandKoreaChinaPhilippinesItalyGermanyCanadaIndiaUnited KingdomJapanAll Immigrants Hispanic ImmigrantsAll Natives Hispanic Natives Non-Hispanic White Natives Non-Hispanic Black Natives
Immigrant Households w/ at least 1 workerNative Households w/ at least 1 worker
Immigrant Households w/ Children <18Native Households w/Children <18
Immigrant Households w/65+ Year Old HeadNative Households w/65+ Year Old Head
Refugee-Sending CountriesNon-Refugee Sending Countries
Subsidized Housing
19.4 %3.2 %7.6 %3.6 %6.6 %1.7 %4.7 %5.3 %6.9 %4.2 %5.5 %2.6 %3.5 %3.2 %2.1 %1.0 %5.0 %3.6 %2.0 %0.0 %3.1 %3.1 %0.8 %2.4 %0.0 %4.1 %4.6 %4.1 %6.4 %2.6 %
12.6 %
2.1 %2.2 %
5.0 %3.5 %
10.7 %4.8 %
6.3 %3.8 %
Medicaid3
49.6 %36.3 %40.5 %30.3 %22.7 %29.0 %28.1 %24.0 %29.3 %21.7 %27.8 %22.3 %21.3 %17.9 %23.2 %22.1 %14.4 %17.6 %13.8 %14.6 %6.9 %6.8 %8.5 %5.1 %4.9 %
24.4 %28.1 %14.7 %33.8 %11.5 %27.3 %
23.0 %12.3 %
35.4 %24.2 %
11.6 %24.0 %
27.4 %24.1 %
ACTC Eligibility
30.5 %39.6 %23.0 %40.0 %33.7 %37.4 %16.1 %26.0 %5.8 %
21.6 %10.0 %20.8 %20.3 %21.4 %17.4 %12.1 %10.8 %9.7 %
28.3 %2.9 %4.3 %4.6 %9.5 %9.2 %9.9 %
22.5 %39.6 %10.9 %21.1 %9.3 %
17.4 %
24.9 %13.2 %
25.4 %42.2 %
3.8 %5.4 %
n/an/a
Welfare
EITC Eligibility
41.5 %51.4 %40.3 %46.3 %39.8 %46.1 %23.7 %40.8 %11.1 %34.5 %13.3 %32.0 %29.4 %25.4 %23.9 %19.1 %19.9 %22.5 %28.3 %5.9 %8.0 %9.3 %
13.5 %11.9 %14.5 %31.1 %51.5 %17.8 %30.0 %14.7 %32.6 %
34.4 %21.6 %
47.6 %32.4 %
7.3 %9.8 %
n/an/a
Food Assistance3
45.1 %37.2 %26.6 %27.7 %27.3 %24.4 %20.3 %15.9 %8.6 %
19.2 %11.7 %13.6 %14.9 %12.9 %9.1 %4.4 %5.2 %5.3 %7.0 %1.8 %6.5 %3.1 %3.9 %3.1 %0.7 %
19.4 %32.3 %10.5 %22.6 %7.1 %
25.0 %
19.3 %9.2 %
36.1 %22.9 %
9.0 %4.2 %
18.0 %19.6 %
Cash Payments for Low-Income
Workers
22
Center for Immigration Studies
aliens sometimes receive the EITC and ACTC. This is especially true of the ACTC because the IRS has deter-mined that illegals are allowed to receive it, even if they do not have a valid Social Security number. To receive the EITC one must have a valid Social Security number. With an annual cost of over $35 billion for the EITC and $14 billion for the ACTC, the two programs con-stitute the nation’s largest means-tested cash assistance program for low-income workers.
Table 12 shows 17.8 percent of native-headed households have enough dependents and low enough income to qualify for the EITC and 10.9 percent have low enough incomes to receive the ACTC. This com-pares to 31.1 and 22.5 percent of immigrant house-holds. For both programs, about twice the share of im-migrant households are eligible as are native households. The figures for the EITC and ACTC probably overstate receipt of the programs for both immigrants and natives because they are imputed by the Census Bureau based on income and family size. This is in contrast to the wel-fare programs listed, which are based on self-reporting by survey respondents.38
Given the education level of so many immi-grants, it is not surprising that a large share work but that their incomes are low enough to qualify for the EITC. It important to understand the high rate of EITC and ACTC eligibility does not reflect a lack of work on the part of immigrants. In fact, one must work to be eligible for them. Use of the EITC and ACTC mainly reflects a lack of education and resulting low incomes, coupled with the presence of dependents.
Welfare Use by Country. While on the whole immigrant households have higher welfare use rates, this is not true for immigrants from all countries. Table 13 shows that immigrants from some countries have lower welfare use rates than natives. From the list of countries in Table 13, it is also clear that refugee-sending countries, such as the former USSR and Cuba, tend to use the welfare system a good deal. On the other hand, Mexican and Dominican households have welfare use rates that are much higher than natives — even higher than the former USSR and Cuba — and virtually none of these immigrants are ref-ugees. In fact, if one excludes the primary refugee-send-ing countries, as shown in the bottom portion of Table 13, the share of immigrant households using a welfare program remains virtually unchanged at 32.6 percent.39 Refugees are simply not a large enough share of the for-eign-born, nor are their rates high enough, to explain the level of welfare use by immigrant households.
Welfare Use Among Working Households. The bot-tom of Table 13 makes a number of different compari-son between immigrant and native households. One of the most important is to compare welfare use among households with at least one worker. The table shows that 31.1 percent of immigrant households with at least one working person still use the welfare system. This compares to 16.4 percent of native households with at least one worker. In particular, food assistance programs and Medicaid are often given to working families. This is an important point to understand. Most immigrant households have at least one worker. We estimate that 82 percent of immigrant households have at least one worker compared to 73 percent of native households. But this in no way means they will not use the welfare system because that system is increasingly designed to provide assistance to low-income workers with children, a description of immigrant families given their educa-tion levels and relatively high fertility. In fact, a worker is present in 78 percent of immigrant households using at least one welfare program. For native households it’s 62 percent. Most immigrants work, but this does not make them self-sufficient.
Educational AttainmentEducation Level of Immigrants. The statistics reviewed thus far indicate that a larger share of immigrants than natives have low incomes, lack health insurance, and ac-cess means-tested programs. As already mentioned, one of the primary reasons for this situation is that many immigrants have relatively few years of schooling. Table 14 reports the share of immigrants and natives ages 25 to 64 who have less than a high school education and the share who have at least a bachelor’s degree by country. (The overall figures do not exactly match those in Table 6 because in that table the percentages are for only those in the labor force.) The big difference between the educa-tion level of the two groups is found at the bottom end of the education distribution. In 2005, 30.6 percent of immigrants ages 25 to 64 lacked a high school diploma, compared to less than 8.4 percent of natives. At the top end, natives now have a slight ad-vantage in terms of having at least a bachelor’s degree. Historically, immigrants enjoyed a significant advantage in terms of having a college education. In 1970, for ex-ample, 18 percent of immigrants (25 to 64) had at least a college degree compared to 12 percent of natives.40 But as Table 14 shows this is no longer the case, with 29.1 percent of immigrants and 31.1 percent of natives hav-ing at least a college degree.41 Because education is now
2�
Center for Immigration Studies
so important to economic success, the large share of im-migrants with relatively little education has enormous implications for their economic and social integration into American society. Table 14 shows that there is great variation in the education level of immigrants by coun-try. As we have seen, there is also great variation in the poverty, welfare use, and health insurance coverage rates by country. Comparing the education levels found in Table 14 with prior tables shows that, in general, coun-tries with the lowest levels of education are also the ones with highest rates of poverty, welfare use, and lack of health insurance.
Importance of Education. To see just how impor-tant education is to economic success, Table 15 re-ports income, welfare use, poverty, and health insur-ance rates for immigrants and natives by education level. Turning first to annual earnings of year-round, full-time workers, the median earnings of these immi-grant workers is 77 percent that of natives. But Table 15 shows that the median annual earnings of immi-grants without a high school degree who work full-time, year-round is 87 percent that of natives with the same education. For those with only a high school degree and no additional schooling, immigrants earn 84 percent of what natives earn. Immigrants with some college earn 94 percent of what natives with the same education earn, and those with at least a college degree earn 98 percent of what natives earn. Overall, the differences by education are much less than is the overall difference. This means that a large share of the difference in the median earnings of natives and im-migrants is explained by the low educational attain-ment of many immigrants. Table 15 also shows that for welfare use, poverty, and health insurance rates, immigrants tend to do somewhat worse than natives with the same education. But more importantly, the table indicates that how well immigrants do is heavily dependent on their education level. This is consistent both with common sense and a very large body of research. The current immigration system allows most legal immigrants into the country through family re-unification channels primarily based on whether they have a relative here. This fact, coupled with widespread tolerance of illegal immigration, means the foreign-born population as a whole is much less educated than the native-born population. Given the nature of the modern American economy and the existence of a well-developed welfare state, it seems unavoidable that less-educated immigrants will tend to have lower incomes, make heavier use of means-
tested programs, and be more likely to lack health insur-ance than natives.
Characteristics by StateIn this section we examine the demographic character-istics of immigrants by state. Since the sample is much smaller than for the nation as the whole, the results should be interpreted with caution, especially for the smaller states.
Table 14. Educational Attainment, Ages 25 to 64
Percent Less Than High
School
64.4 %60.0 %54.7 %53.8 %38.0 %26.9 %26.7 %21.3 %19.7 %19.0 %17.6 %16.0 %15.8 %11.9 %11.9 %7.7 %7.7 %4.9 %3.6 %2.9 %2.7 %2.6 %2.3 %2.3 %1.1 %
30.6 %50.8 %8.4 %
18.7 %6.6 %
13.1 %
Source: Center for Immigration Studies analysis of the March 2007 Current Population Survey. Figures for white and black natives are for those who chose only one race.
Percent College or More
4.0 %5.8 %7.2 %7.1 %
10.0 %31.4 %15.8 %31.7 %20.2 %21.8 %23.8 %28.1 %54.8 %37.4 %54.2 %26.3 %28.3 %59.6 %80.6 %57.8 %51.7 %50.0 %55.7 %54.4 %63.6 %
29.1 %9.8 %
31.1 %17.9 %34.4 %18.7 %
GuatemalaMexicoEl SalvadorHondurasDominican RepublicBrazilEcuadorVietnamItalyCubaHaitiJamaicaChinaColumbiaIranPolandPeruUSSRIndiaKoreaPhilippinesGermanyUnited KingdomCanadaJapan
Immigrants Hispanic ImmigrantsNatives Hispanic Natives Non-Hispanic White Natives Non-Hispanic Black Natives

2�
Center for Immigration Studies
Table 15. Socio-Economic Status by Education Level
Nativity
ImmigrantNative
ImmigrantNative
ImmigrantNative
ImmigrantNative
ImmigrantNative
Source: Center for Immigration Studies analysis of the March 2007 Current Population Survey. 1 Persons who worked full-time year-round in 2006.2 Based on nativity and education level of household head. See Table 12 for welfare programs.3 In or near poverty defined as income under 200 percent of the poverty threshold.
Median Income1
$31,074 $40,344
$21,176 $24,402
$26,459 $31,486
$35,010 $37,096
$55,582 $56,583
Education Level
Overall
Less Than High School
High School Only
Some College
College or Graduate Degree
Welfare Use2
32.7 %19.4 %
53.8 %41.3 %
36.1 %23.4 %
27.8 %19.0 %
12.5 %6.8 %
In or Near Poverty (Persons
18 & Over)3
38.7 %25.7 %
60.2 %53.0 %
41.8 %31.1 %
28.7 %22.8 %
15.5 %9.5 %
Without Health Ins. (Persons 18
& Over)
33.9 %14.2 %
51.0 %22.1 %
37.9 %17.8 %
26.0 %13.8 %
13.9 %12.1 %
Table 16. Household Income and Size by State
Immigrant
$30,590 $35,430 $32,988 $47,292 $43,618 $41,634 $41,301 $46,863 $49,115 $41,212 $38,116 $48,965 $41,230 $66,170 $64,160 $56,605 $43,933
Source: Center for Immigration Studies analysis of the March 2007 Current Population Survey.
ArizonaColoradoTexasCalifornia L.A. CountyMassachusettsFloridaNevadaGeorgiaNew York New York CityIllinoisNorth CarolinaNew JerseyMarylandVirginiaNation
Median Household Income
Native
$51,087 $57,891 $46,332 $60,011 $55,087 $59,446 $47,050 $54,766 $50,758 $51,052 $41,688 $48,866 $39,750 $68,988 $64,273 $57,536 $49,201
Immigrant
3.2 3.2 3.3 3.4 3.3 2.9 3.2 3.1 3.4 2.8 2.8 3.2 3.3 3.1 3.2 3.1 3.1
Number of Persons Per Household
Native
2.5 2.5 2.5 2.5 2.4 2.5 2.3 2.4 2.4 2.4 2.2 2.4 2.4 2.5 2.5 2.5 2.4
Immigrant
$9,559 $11,072 $9,996
$13,909 $13,218 $14,357 $12,907 $15,117 $14,446 $14,719 $13,613 $15,302 $12,494 $21,345 $20,050 $18,260 $14,172
Per-Person Median Household Income
Native
$20,435 $23,156 $18,533 $24,004 $22,953 $23,778 $20,457 $22,819 $21,149 $21,272 $18,949 $20,361 $16,563 $27,595 $25,709 $23,014 $20,500
Percent Native Per-Person Income is
Higher than Immigrant
114 %109 %85 %73 %74 %66 %58 %51 %46 %45 %39 %33 %33 %29 %28 %26 %45 %
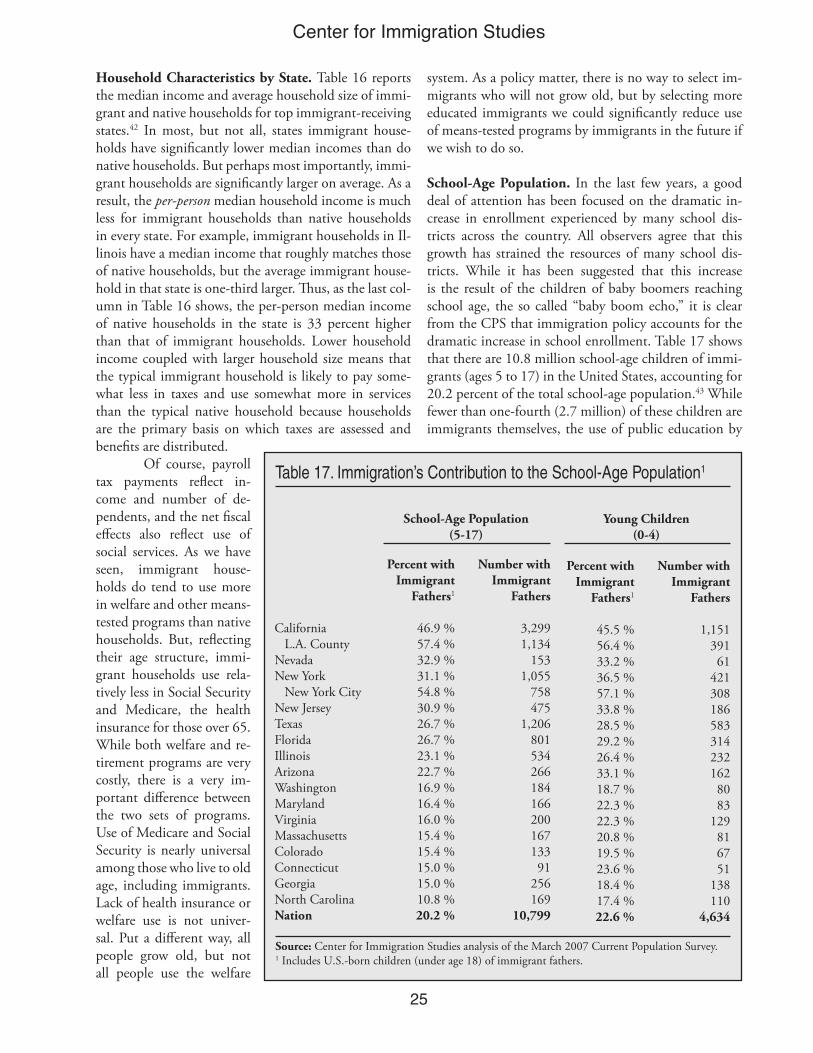
2�
Center for Immigration Studies
Household Characteristics by State. Table 16 reports the median income and average household size of immi-grant and native households for top immigrant-receiving states.42 In most, but not all, states immigrant house-holds have significantly lower median incomes than do native households. But perhaps most importantly, immi-grant households are significantly larger on average. As a result, the per-person median household income is much less for immigrant households than native households in every state. For example, immigrant households in Il-linois have a median income that roughly matches those of native households, but the average immigrant house-hold in that state is one-third larger. Thus, as the last col-umn in Table 16 shows, the per-person median income of native households in the state is 33 percent higher than that of immigrant households. Lower household income coupled with larger household size means that the typical immigrant household is likely to pay some-what less in taxes and use somewhat more in services than the typical native household because households are the primary basis on which taxes are assessed and benefits are distributed.
Of course, payroll tax payments reflect in-come and number of de-pendents, and the net fiscal effects also reflect use of social services. As we have seen, immigrant house-holds do tend to use more in welfare and other means-tested programs than native households. But, reflecting their age structure, immi-grant households use rela-tively less in Social Security and Medicare, the health insurance for those over 65. While both welfare and re-tirement programs are very costly, there is a very im-portant difference between the two sets of programs. Use of Medicare and Social Security is nearly universal among those who live to old age, including immigrants. Lack of health insurance or welfare use is not univer-sal. Put a different way, all people grow old, but not all people use the welfare
system. As a policy matter, there is no way to select im-migrants who will not grow old, but by selecting more educated immigrants we could significantly reduce use of means-tested programs by immigrants in the future if we wish to do so.
School-Age Population. In the last few years, a good deal of attention has been focused on the dramatic in-crease in enrollment experienced by many school dis-tricts across the country. All observers agree that this growth has strained the resources of many school dis-tricts. While it has been suggested that this increase is the result of the children of baby boomers reaching school age, the so called “baby boom echo,” it is clear from the CPS that immigration policy accounts for the dramatic increase in school enrollment. Table 17 shows that there are 10.8 million school-age children of immi-grants (ages 5 to 17) in the United States, accounting for 20.2 percent of the total school-age population.43 While fewer than one-fourth (2.7 million) of these children are immigrants themselves, the use of public education by
Table 17. Immigration’s Contribution to the School-Age Population1
Percent withImmigrant
Fathers1
46.9 %57.4 %32.9 %31.1 %54.8 %30.9 %26.7 %26.7 %23.1 %22.7 %16.9 %16.4 %16.0 %15.4 %15.4 %15.0 %15.0 %10.8 %20.2 %
Source: Center for Immigration Studies analysis of the March 2007 Current Population Survey.1 Includes U.S.-born children (under age 18) of immigrant fathers.
California L.A. CountyNevadaNew York New York CityNew JerseyTexasFloridaIllinoisArizonaWashingtonMarylandVirginiaMassachusettsColoradoConnecticutGeorgiaNorth CarolinaNation
School-Age Population (5-17)
Number withImmigrant
Fathers
3,299 1,134
153 1,055
758 475
1,206 801 534 266 184 166 200 167 133 91
256 169
10,799
Percent withImmigrant
Fathers1
45.5 %56.4 %33.2 %36.5 %57.1 %33.8 %28.5 %29.2 %26.4 %33.1 %18.7 %22.3 %22.3 %20.8 %19.5 %23.6 %18.4 %17.4 %22.6 %
Young Children (0-4)
Number withImmigrant
Fathers
1,151 391 61
421 308 186 583 314 232 162 80 83
129 81 67 51
138 110
4,634
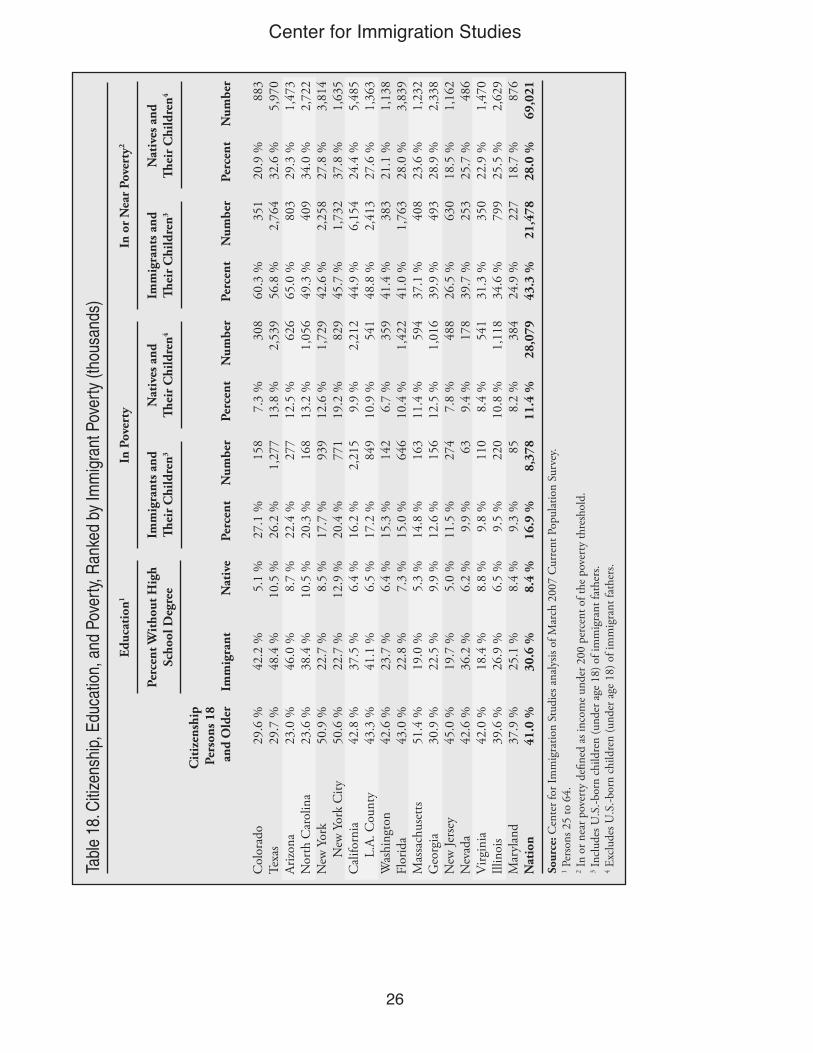
2�
Center for Immigration Studies
Tabl
e 18
. Citi
zens
hip,
Edu
catio
n, a
nd P
over
ty, R
anke
d by
Imm
igra
nt P
over
ty (t
hous
ands
)
Cit
izen
ship
Pe
rson
s 18
and
Old
er
29.6
%29
.7 %
23.0
%23
.6 %
50.9
%50
.6 %
42.8
%43
.3 %
42.6
%43
.0 %
51.4
%30
.9 %
45.0
%42
.6 %
42.0
%39
.6 %
37.9
%41
.0 %
Sour
ce: C
ente
r for
Imm
igra
tion
Stud
ies a
naly
sis o
f Mar
ch 2
007
Cur
rent
Pop
ulat
ion
Surv
ey.
1 Per
sons
25
to 6
4.
2 In
or n
ear p
over
ty d
efine
d as
inco
me
unde
r 200
per
cent
of t
he p
over
ty th
resh
old.
3 Inc
lude
s U.S
.-bor
n ch
ildre
n (u
nder
age
18)
of i
mm
igra
nt fa
ther
s.4 E
xclu
des U
.S.-b
orn
child
ren
(und
er a
ge 1
8) o
f im
mig
rant
fath
ers.
Col
orad
oTe
xas
Arizo
naN
orth
Car
olin
aN
ew Y
ork
N
ew Y
ork
City
Cal
iforn
ia
L.A
. Cou
nty
Was
hing
ton
Flor
ida
Mas
sach
uset
tsG
eorg
iaN
ew Je
rsey
Nev
ada
Virg
inia
Illin
ois
Mar
ylan
dN
atio
n
Perc
ent W
itho
ut H
igh
Scho
ol D
egre
e
Imm
igra
nt
42.
2 %
48.4
%46
.0 %
38.4
%22
.7 %
22.7
%37
.5 %
41.1
%23
.7 %
22.8
%19
.0 %
22.5
%19
.7 %
36.2
%18
.4 %
26.9
%25
.1 %
30.6
%
Nat
ive
5.1
%10
.5 %
8.7
%10
.5 %
8.5
%12
.9 %
6.4
%6.
5 %
6.4
%7.
3 %
5.3
%9.
9 %
5.0
%6.
2 %
8.8
%6.
5 %
8.4
%8.
4 %
In P
over
ty
Perc
ent
27.1
%26
.2 %
22.4
%20
.3 %
17.7
%20
.4 %
16.2
%17
.2 %
15.3
%15
.0 %
14.8
%12
.6 %
11.5
%9.
9 %
9.8
%9.
5 %
9.3
%16
.9 %
Num
ber
158
1,27
727
716
893
977
12,
215
849
142
646
163
156
274 63 110
220 85
8,3
78
Perc
ent
7.3
%13
.8 %
12.5
%13
.2 %
12.6
%19
.2 %
9.9
%10
.9 %
6.7
%10
.4 %
11.4
%12
.5 %
7.8
%9.
4 %
8.4
%10
.8 %
8.2
%11
.4 %
Num
ber
308
2
,539
6
26
1,0
56
1,7
29
829
2
,212
5
41
359
1
,422
5
94
1,0
16
488
1
78
541
1
,118
3
84
28,
079
Imm
igra
nts a
nd
Thei
r C
hild
ren3
Nat
ives
and
Th
eir
Chi
ldre
n4
Educ
atio
n1In
or
Nea
r Po
vert
y2
Perc
ent
60.3
%56
.8 %
65.0
%49
.3 %
42.6
%45
.7 %
44.9
%48
.8 %
41.4
%41
.0 %
37.1
%39
.9 %
26.5
%39
.7 %
31.3
%34
.6 %
24.9
%43
.3 %
Num
ber
351
2
,764
8
03
409
2
,258
1
,732
6
,154
2
,413
3
83
1,7
63
408
4
93
630
2
53
350
7
99
227
2
1,47
8
Perc
ent
20.9
%32
.6 %
29.3
%34
.0 %
27.8
%37
.8 %
24.4
%27
.6 %
21.1
%28
.0 %
23.6
%28
.9 %
18.5
%25
.7 %
22.9
%25
.5 %
18.7
%28
.0 %
Num
ber
883
5
,970
1
,473
2
,722
3
,814
1
,635
5
,485
1
,363
1
,138
3
,839
1
,232
2
,338
1
,162
4
86
1,4
70
2,6
29
876
6
9,02
1
Imm
igra
nts a
nd
Thei
r C
hild
ren3
Nat
ives
and
Th
eir
Chi
ldre
n4
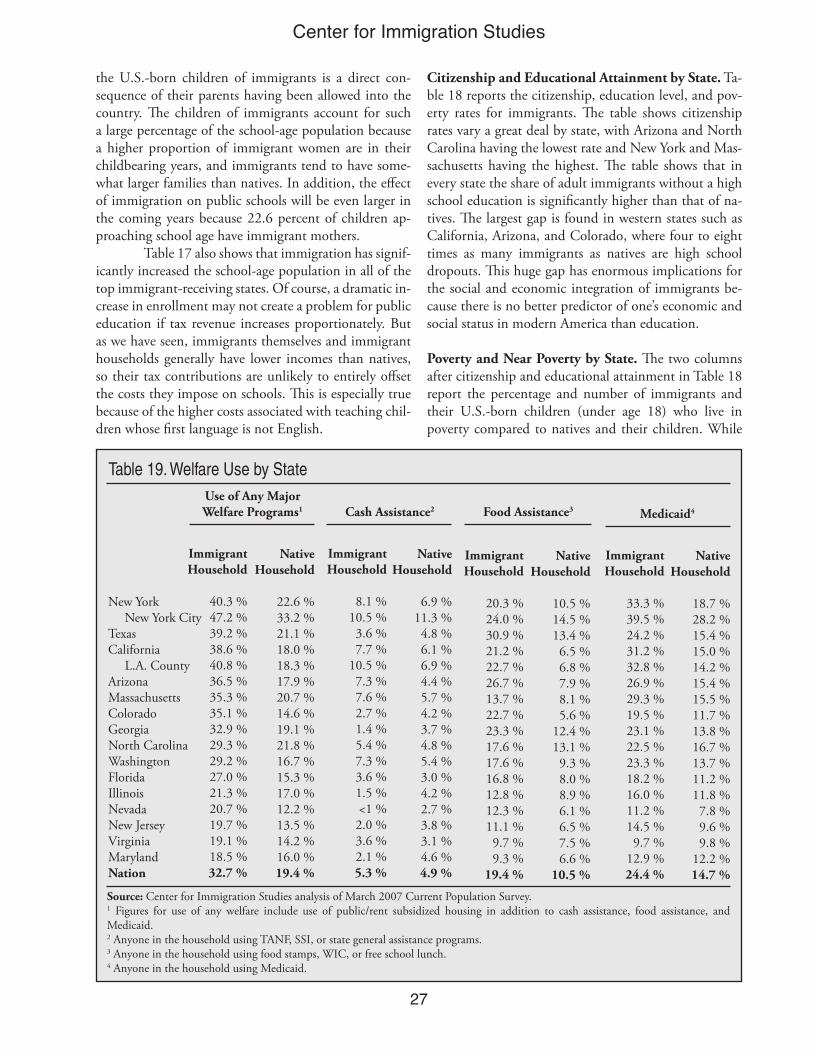
27
Center for Immigration Studies
the U.S.-born children of immigrants is a direct con-sequence of their parents having been allowed into the country. The children of immigrants account for such a large percentage of the school-age population because a higher proportion of immigrant women are in their childbearing years, and immigrants tend to have some-what larger families than natives. In addition, the effect of immigration on public schools will be even larger in the coming years because 22.6 percent of children ap-proaching school age have immigrant mothers. Table 17 also shows that immigration has signif-icantly increased the school-age population in all of the top immigrant-receiving states. Of course, a dramatic in-crease in enrollment may not create a problem for public education if tax revenue increases proportionately. But as we have seen, immigrants themselves and immigrant households generally have lower incomes than natives, so their tax contributions are unlikely to entirely offset the costs they impose on schools. This is especially true because of the higher costs associated with teaching chil-dren whose first language is not English.
Citizenship and Educational Attainment by State. Ta-ble 18 reports the citizenship, education level, and pov-erty rates for immigrants. The table shows citizenship rates vary a great deal by state, with Arizona and North Carolina having the lowest rate and New York and Mas-sachusetts having the highest. The table shows that in every state the share of adult immigrants without a high school education is significantly higher than that of na-tives. The largest gap is found in western states such as California, Arizona, and Colorado, where four to eight times as many immigrants as natives are high school dropouts. This huge gap has enormous implications for the social and economic integration of immigrants be-cause there is no better predictor of one’s economic and social status in modern America than education.
Poverty and Near Poverty by State. The two columns after citizenship and educational attainment in Table 18 report the percentage and number of immigrants and their U.S.-born children (under age 18) who live in poverty compared to natives and their children. While
Table 19. Welfare Use by State
Source: Center for Immigration Studies analysis of March 2007 Current Population Survey.1 Figures for use of any welfare include use of public/rent subsidized housing in addition to cash assistance, food assistance, and Medicaid.2 Anyone in the household using TANF, SSI, or state general assistance programs.3 Anyone in the household using food stamps, WIC, or free school lunch.4 Anyone in the household using Medicaid.
New York New York CityTexasCalifornia L.A. CountyArizonaMassachusettsColoradoGeorgiaNorth CarolinaWashingtonFloridaIllinoisNevadaNew JerseyVirginiaMarylandNation
Use of Any Major Welfare Programs1
ImmigrantHousehold
40.3 %47.2 %39.2 %38.6 %40.8 %36.5 %35.3 %35.1 %32.9 %29.3 %29.2 %27.0 %21.3 %20.7 %19.7 %19.1 %18.5 %32.7 %
NativeHousehold
22.6 %33.2 %21.1 %18.0 %18.3 %17.9 %20.7 %14.6 %19.1 %21.8 %16.7 %15.3 %17.0 %12.2 %13.5 %14.2 %16.0 %19.4 %
Cash Assistance2
ImmigrantHousehold
8.1 %10.5 %3.6 %7.7 %
10.5 %7.3 %7.6 %2.7 %1.4 %5.4 %7.3 %3.6 %1.5 %<1 %2.0 %3.6 %2.1 %5.3 %
NativeHousehold
6.9 %11.3 %4.8 %6.1 %6.9 %4.4 %5.7 %4.2 %3.7 %4.8 %5.4 %3.0 %4.2 %2.7 %3.8 %3.1 %4.6 %4.9 %
Food Assistance3
ImmigrantHousehold
20.3 %24.0 %30.9 %21.2 %22.7 %26.7 %13.7 %22.7 %23.3 %17.6 %17.6 %16.8 %12.8 %12.3 %11.1 %9.7 %9.3 %
19.4 %
NativeHousehold
10.5 %14.5 %13.4 %6.5 %6.8 %7.9 %8.1 %5.6 %
12.4 %13.1 %9.3 %8.0 %8.9 %6.1 %6.5 %7.5 %6.6 %
10.5 %
Medicaid4
ImmigrantHousehold
33.3 %39.5 %24.2 %31.2 %32.8 %26.9 %29.3 %19.5 %23.1 %22.5 %23.3 %18.2 %16.0 %11.2 %14.5 %9.7 %
12.9 %24.4 %
NativeHousehold
18.7 %28.2 %15.4 %15.0 %14.2 %15.4 %15.5 %11.7 %13.8 %16.7 %13.7 %11.2 %11.8 %7.8 %9.6 %9.8 %
12.2 %14.7 %
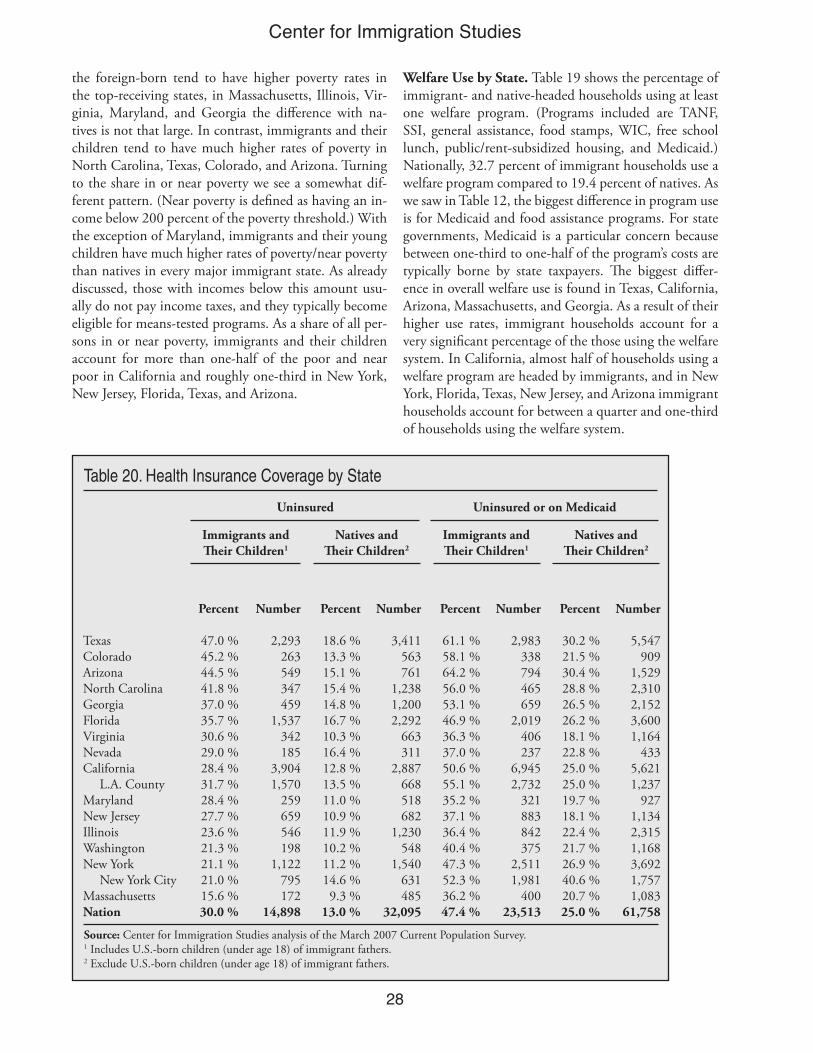
2�
Center for Immigration Studies
the foreign-born tend to have higher poverty rates in the top-receiving states, in Massachusetts, Illinois, Vir-ginia, Maryland, and Georgia the difference with na-tives is not that large. In contrast, immigrants and their children tend to have much higher rates of poverty in North Carolina, Texas, Colorado, and Arizona. Turning to the share in or near poverty we see a somewhat dif-ferent pattern. (Near poverty is defined as having an in-come below 200 percent of the poverty threshold.) With the exception of Maryland, immigrants and their young children have much higher rates of poverty/near poverty than natives in every major immigrant state. As already discussed, those with incomes below this amount usu-ally do not pay income taxes, and they typically become eligible for means-tested programs. As a share of all per-sons in or near poverty, immigrants and their children account for more than one-half of the poor and near poor in California and roughly one-third in New York, New Jersey, Florida, Texas, and Arizona.
Welfare Use by State. Table 19 shows the percentage of immigrant- and native-headed households using at least one welfare program. (Programs included are TANF, SSI, general assistance, food stamps, WIC, free school lunch, public/rent-subsidized housing, and Medicaid.) Nationally, 32.7 percent of immigrant households use a welfare program compared to 19.4 percent of natives. As we saw in Table 12, the biggest difference in program use is for Medicaid and food assistance programs. For state governments, Medicaid is a particular concern because between one-third to one-half of the program’s costs are typically borne by state taxpayers. The biggest differ-ence in overall welfare use is found in Texas, California, Arizona, Massachusetts, and Georgia. As a result of their higher use rates, immigrant households account for a very significant percentage of the those using the welfare system. In California, almost half of households using a welfare program are headed by immigrants, and in New York, Florida, Texas, New Jersey, and Arizona immigrant households account for between a quarter and one-third of households using the welfare system.
Table 20. Health Insurance Coverage by State
Source: Center for Immigration Studies analysis of the March 2007 Current Population Survey.1 Includes U.S.-born children (under age 18) of immigrant fathers.2 Exclude U.S.-born children (under age 18) of immigrant fathers.
TexasColoradoArizonaNorth CarolinaGeorgiaFloridaVirginiaNevadaCalifornia L.A. CountyMarylandNew JerseyIllinoisWashingtonNew York New York CityMassachusettsNation
Immigrants and Their Children1
Percent
47.0 %45.2 %44.5 %41.8 %37.0 %35.7 %30.6 %29.0 %28.4 %31.7 %28.4 %27.7 %23.6 %21.3 %21.1 %21.0 %15.6 %30.0 %
Number
2,293 263 549 347 459
1,537 342 185
3,904 1,570
259 659 546 198
1,122 795 172
14,898
Uninsured or on Medicaid
Percent
18.6 %13.3 %15.1 %15.4 %14.8 %16.7 %10.3 %16.4 %12.8 %13.5 %11.0 %10.9 %11.9 %10.2 %11.2 %14.6 %9.3 %
13.0 %
Number
3,411 563 761
1,238 1,200 2,292
663 311
2,887 668 518 682
1,230 548
1,540 631 485
32,095
Percent
61.1 %58.1 %64.2 %56.0 %53.1 %46.9 %36.3 %37.0 %50.6 %55.1 %35.2 %37.1 %36.4 %40.4 %47.3 %52.3 %36.2 %47.4 %
Number
2,983 338 794 465 659
2,019 406 237
6,945 2,732
321 883 842 375
2,511 1,981
400 23,513
Natives and Their Children2
Immigrants and Their Children1
Uninsured
Percent
30.2 %21.5 %30.4 %28.8 %26.5 %26.2 %18.1 %22.8 %25.0 %25.0 %19.7 %18.1 %22.4 %21.7 %26.9 %40.6 %20.7 %25.0 %
Number
5,547 909
1,529 2,310 2,152 3,600 1,164
433 5,621 1,237
927 1,134 2,315 1,168 3,692 1,757 1,083
61,758
Natives and Their Children2
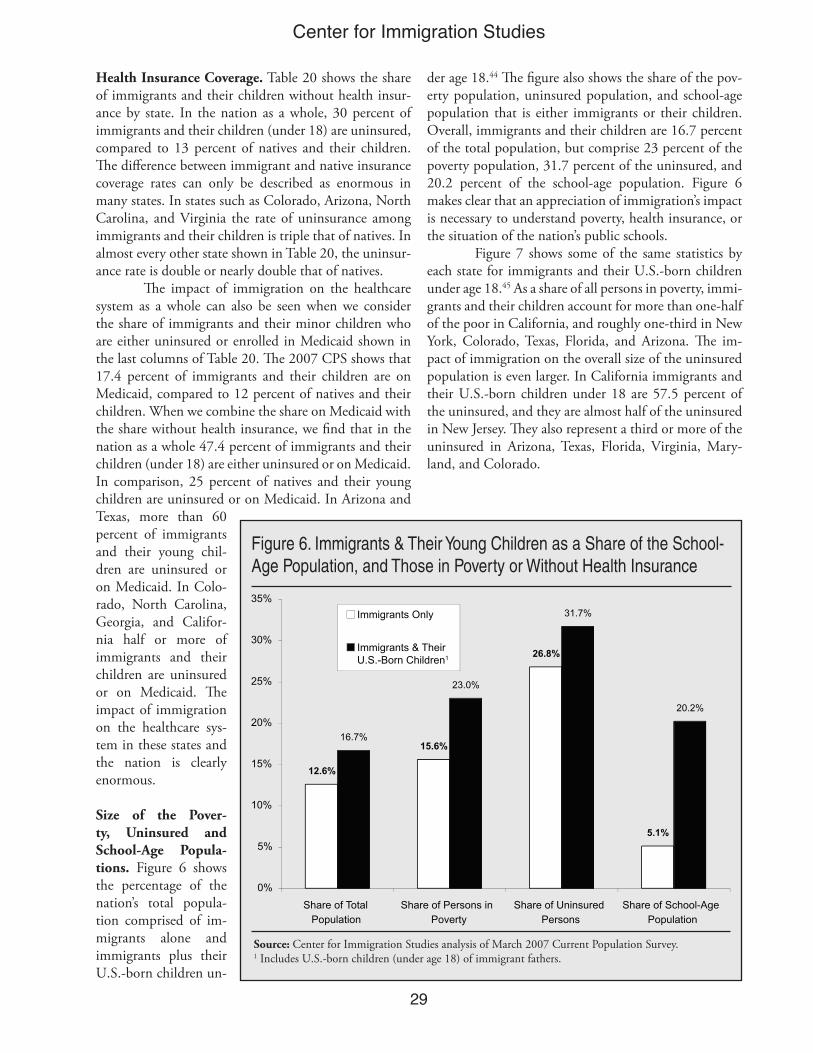
2�
Center for Immigration Studies
Health Insurance Coverage. Table 20 shows the share of immigrants and their children without health insur-ance by state. In the nation as a whole, 30 percent of immigrants and their children (under 18) are uninsured, compared to 13 percent of natives and their children. The difference between immigrant and native insurance coverage rates can only be described as enormous in many states. In states such as Colorado, Arizona, North Carolina, and Virginia the rate of uninsurance among immigrants and their children is triple that of natives. In almost every other state shown in Table 20, the uninsur-ance rate is double or nearly double that of natives. The impact of immigration on the healthcare system as a whole can also be seen when we consider the share of immigrants and their minor children who are either uninsured or enrolled in Medicaid shown in the last columns of Table 20. The 2007 CPS shows that 17.4 percent of immigrants and their children are on Medicaid, compared to 12 percent of natives and their children. When we combine the share on Medicaid with the share without health insurance, we find that in the nation as a whole 47.4 percent of immigrants and their children (under 18) are either uninsured or on Medicaid. In comparison, 25 percent of natives and their young children are uninsured or on Medicaid. In Arizona and Texas, more than 60 percent of immigrants and their young chil-dren are uninsured or on Medicaid. In Colo-rado, North Carolina, Georgia, and Califor-nia half or more of immigrants and their children are uninsured or on Medicaid. The impact of immigration on the healthcare sys-tem in these states and the nation is clearly enormous.
Size of the Pover-ty, Uninsured and School-Age Popula-tions. Figure 6 shows the percentage of the nation’s total popula-tion comprised of im-migrants alone and immigrants plus their U.S.-born children un-
der age 18.44 The figure also shows the share of the pov-erty population, uninsured population, and school-age population that is either immigrants or their children. Overall, immigrants and their children are 16.7 percent of the total population, but comprise 23 percent of the poverty population, 31.7 percent of the uninsured, and 20.2 percent of the school-age population. Figure 6 makes clear that an appreciation of immigration’s impact is necessary to understand poverty, health insurance, or the situation of the nation’s public schools.
Figure 7 shows some of the same statistics by each state for immigrants and their U.S.-born children under age 18.45 As a share of all persons in poverty, immi-grants and their children account for more than one-half of the poor in California, and roughly one-third in New York, Colorado, Texas, Florida, and Arizona. The im-pact of immigration on the overall size of the uninsured population is even larger. In California immigrants and their U.S.-born children under 18 are 57.5 percent of the uninsured, and they are almost half of the uninsured in New Jersey. They also represent a third or more of the uninsured in Arizona, Texas, Florida, Virginia, Mary-land, and Colorado.
Figure 6. Immigrants & Their Young Children as a Share of the School-Age Population, and Those in Poverty or Without Health Insurance
Source: Center for Immigration Studies analysis of March 2007 Current Population Survey. 1 Includes U.S.-born children (under age 18) of immigrant fathers.
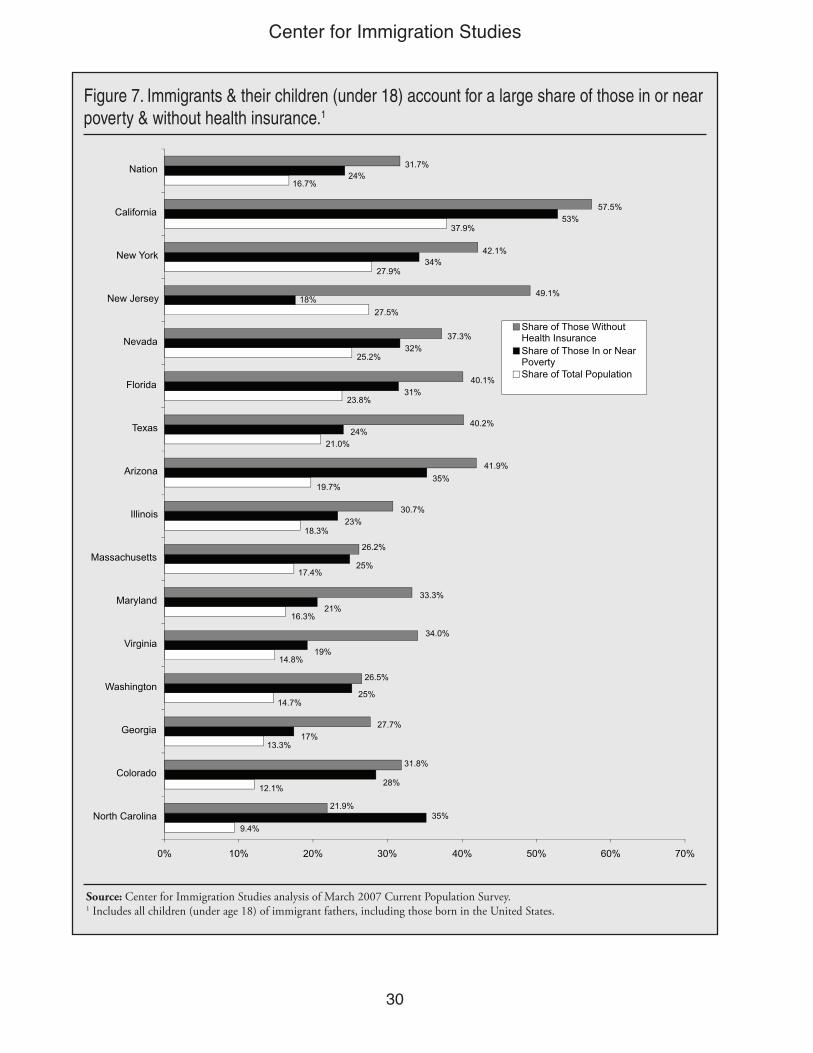
�0
Center for Immigration Studies
Figure 7. Immigrants & their children (under 18) account for a large share of those in or near poverty & without health insurance.1
Source: Center for Immigration Studies analysis of March 2007 Current Population Survey.1 Includes all children (under age 18) of immigrant fathers, including those born in the United States.
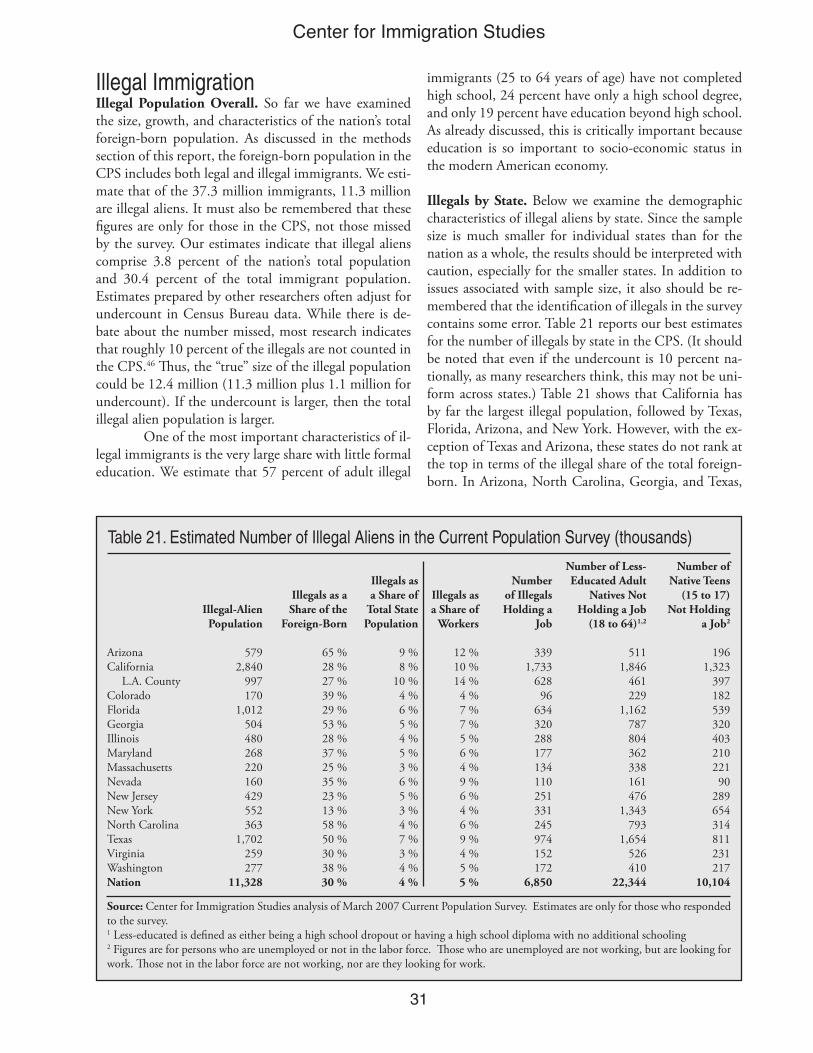
��
Center for Immigration Studies
Illegal ImmigrationIllegal Population Overall. So far we have examined the size, growth, and characteristics of the nation’s total foreign-born population. As discussed in the methods section of this report, the foreign-born population in the CPS includes both legal and illegal immigrants. We esti-mate that of the 37.3 million immigrants, 11.3 million are illegal aliens. It must also be remembered that these figures are only for those in the CPS, not those missed by the survey. Our estimates indicate that illegal aliens comprise 3.8 percent of the nation’s total population and 30.4 percent of the total immigrant population. Estimates prepared by other researchers often adjust for undercount in Census Bureau data. While there is de-bate about the number missed, most research indicates that roughly 10 percent of the illegals are not counted in the CPS.46 Thus, the “true” size of the illegal population could be 12.4 million (11.3 million plus 1.1 million for undercount). If the undercount is larger, then the total illegal alien population is larger. One of the most important characteristics of il-legal immigrants is the very large share with little formal education. We estimate that 57 percent of adult illegal
immigrants (25 to 64 years of age) have not completed high school, 24 percent have only a high school degree, and only 19 percent have education beyond high school. As already discussed, this is critically important because education is so important to socio-economic status in the modern American economy.
Illegals by State. Below we examine the demographic characteristics of illegal aliens by state. Since the sample size is much smaller for individual states than for the nation as a whole, the results should be interpreted with caution, especially for the smaller states. In addition to issues associated with sample size, it also should be re-membered that the identification of illegals in the survey contains some error. Table 21 reports our best estimates for the number of illegals by state in the CPS. (It should be noted that even if the undercount is 10 percent na-tionally, as many researchers think, this may not be uni-form across states.) Table 21 shows that California has by far the largest illegal population, followed by Texas, Florida, Arizona, and New York. However, with the ex-ception of Texas and Arizona, these states do not rank at the top in terms of the illegal share of the total foreign-born. In Arizona, North Carolina, Georgia, and Texas,
Table 21. Estimated Number of Illegal Aliens in the Current Population Survey (thousands)
Illegal-Alien Population
579 2,840
997 170
1,012 504 480 268 220 160 429 552 363
1,702 259 277
11,328
Source: Center for Immigration Studies analysis of March 2007 Current Population Survey. Estimates are only for those who responded to the survey. 1 Less-educated is defined as either being a high school dropout or having a high school diploma with no additional schooling2 Figures are for persons who are unemployed or not in the labor force. Those who are unemployed are not working, but are looking for work. Those not in the labor force are not working, nor are they looking for work.
Illegals as a Share of the
Foreign-Born
65 %28 %27 %39 %29 %53 %28 %37 %25 %35 %23 %13 %58 %50 %30 %38 %30 %
Illegals as a Share of
Total State Population
9 %8 %
10 %4 %6 %5 %4 %5 %3 %6 %5 %3 %4 %7 %3 %4 %4 %
Illegals as a Share of
Workers
12 %10 %14 %4 %7 %7 %5 %6 %4 %9 %6 %4 %6 %9 %4 %5 %5 %
ArizonaCalifornia L.A. CountyColoradoFloridaGeorgiaIllinoisMarylandMassachusettsNevadaNew JerseyNew YorkNorth CarolinaTexasVirginiaWashingtonNation
Number of Illegals Holding a
Job
339 1,733
628 96
634 320 288 177 134 110 251 331 245 974 152 172
6,850
Number of Less-Educated Adult
Natives Not Holding a Job
(18 to 64)1,2
511 1,846
461 229
1,162 787 804 362 338 161 476
1,343 793
1,654 526 410
22,344
Number of Native Teens
(15 to 17) Not Holding
a Job2
196 1,323
397 182 539 320 403 210 221 90
289 654 314 811 231 217
10,104
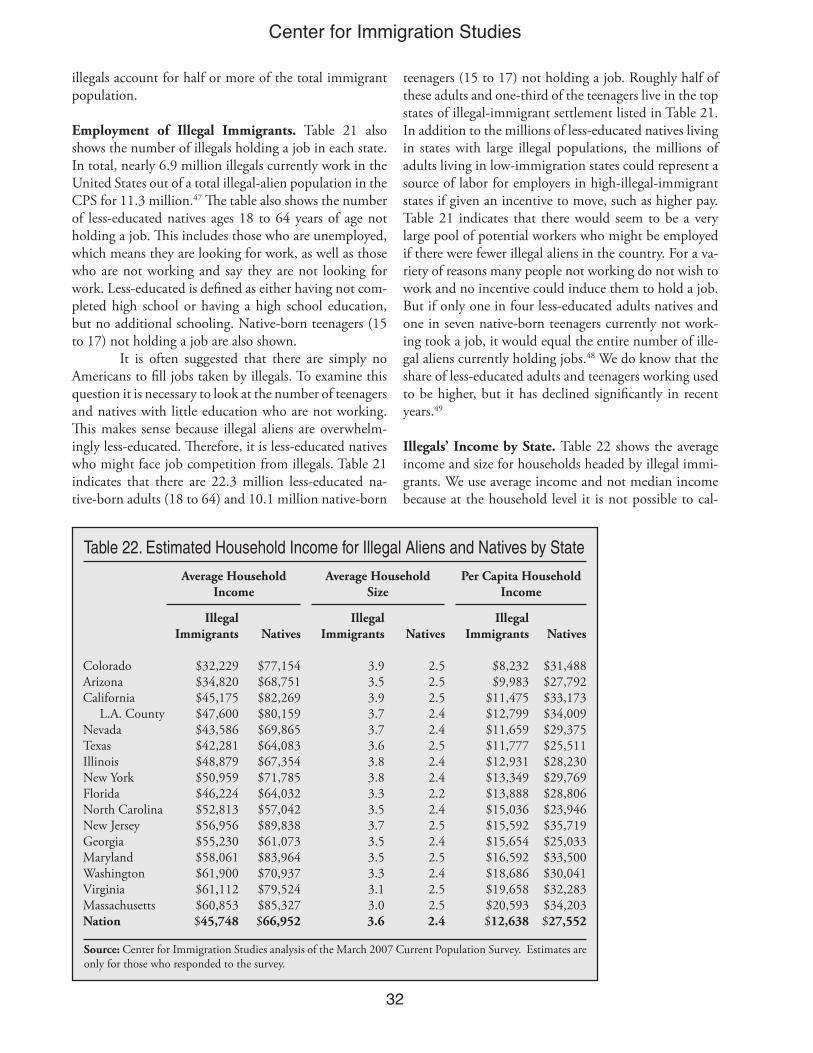
�2
Center for Immigration Studies
illegals account for half or more of the total immigrant population.
Employment of Illegal Immigrants. Table 21 also shows the number of illegals holding a job in each state. In total, nearly 6.9 million illegals currently work in the United States out of a total illegal-alien population in the CPS for 11.3 million.47 The table also shows the number of less-educated natives ages 18 to 64 years of age not holding a job. This includes those who are unemployed, which means they are looking for work, as well as those who are not working and say they are not looking for work. Less-educated is defined as either having not com-pleted high school or having a high school education, but no additional schooling. Native-born teenagers (15 to 17) not holding a job are also shown.
It is often suggested that there are simply no Americans to fill jobs taken by illegals. To examine this question it is necessary to look at the number of teenagers and natives with little education who are not working. This makes sense because illegal aliens are overwhelm-ingly less-educated. Therefore, it is less-educated natives who might face job competition from illegals. Table 21 indicates that there are 22.3 million less-educated na-tive-born adults (18 to 64) and 10.1 million native-born
teenagers (15 to 17) not holding a job. Roughly half of these adults and one-third of the teenagers live in the top states of illegal-immigrant settlement listed in Table 21. In addition to the millions of less-educated natives living in states with large illegal populations, the millions of adults living in low-immigration states could represent a source of labor for employers in high-illegal-immigrant states if given an incentive to move, such as higher pay. Table 21 indicates that there would seem to be a very large pool of potential workers who might be employed if there were fewer illegal aliens in the country. For a va-riety of reasons many people not working do not wish to work and no incentive could induce them to hold a job. But if only one in four less-educated adults natives and one in seven native-born teenagers currently not work-ing took a job, it would equal the entire number of ille-gal aliens currently holding jobs.48 We do know that the share of less-educated adults and teenagers working used to be higher, but it has declined significantly in recent years.49
Illegals’ Income by State. Table 22 shows the average income and size for households headed by illegal immi-grants. We use average income and not median income because at the household level it is not possible to cal-
Table 22. Estimated Household Income for Illegal Aliens and Natives by State
Source: Center for Immigration Studies analysis of the March 2007 Current Population Survey. Estimates are only for those who responded to the survey.
ColoradoArizonaCalifornia L.A. CountyNevadaTexasIllinoisNew YorkFloridaNorth CarolinaNew JerseyGeorgiaMarylandWashingtonVirginiaMassachusettsNation
Average Household Income
Illegal Immigrants
$32,229 $34,820 $45,175 $47,600 $43,586 $42,281 $48,879 $50,959 $46,224 $52,813 $56,956 $55,230 $58,061 $61,900 $61,112 $60,853 $45,748
Natives
$77,154 $68,751 $82,269 $80,159 $69,865 $64,083 $67,354 $71,785 $64,032 $57,042 $89,838 $61,073 $83,964 $70,937 $79,524 $85,327 $66,952
Illegal Immigrants
3.93.53.93.73.73.63.83.83.33.53.73.53.53.33.13.03.6
Natives
2.52.52.52.42.42.52.42.42.22.42.52.42.52.42.52.52.4
Average Household Size
Illegal Immigrants
$8,232 $9,983
$11,475 $12,799 $11,659 $11,777 $12,931 $13,349 $13,888 $15,036 $15,592 $15,654 $16,592 $18,686 $19,658 $20,593 $12,638
Natives
$31,488 $27,792 $33,173 $34,009 $29,375 $25,511 $28,230 $29,769 $28,806 $23,946 $35,719 $25,033 $33,500 $30,041 $32,283 $34,203 $27,552
Per Capita Household Income

��
Center for Immigration Studies
culate median income figures due to sample size in most states.50 Not surprisingly, Table 22 shows that the mean income of illegal households is much smaller than the mean income of native households. At the same time these households are much larger on average than na-tive households. In most states, illegals have household incomes that are between 25 and 50 percent less than native households. At the same time, illegal alien house-holds are at least 40 percent larger than native house-holds in most states. As already discussed, lower house-hold income coupled with larger household size means that, on average, illegal-alien households will pay less in taxes and use more in services than native households because households are the primary basis on which taxes are assessed and benefits distributed in the United States. Even assuming that illegals pay all the taxes they are sup-posed to, it is difficult, given their average household income and size, for illegals not to create a significant fiscal drain.
But again, it must be pointed out that this situ-ation arises because of the education level of illegals and not because they do not work. The vast majority of work-ing-age illegals work. In fact, we estimate that 92 per-
cent of illegal-alien households have at least one person working. This compares to 73 percent of native-headed households. But because of their education levels, a very large share of illegal households have low incomes, and very low per capita household income.
Illegals and the School-Age Population. One advan-tage of not adjusting for undercount is that it is possible to see what share of those in poverty, without health in-surance, or in public schools are illegal immigrants in the CPS. If we had adjusted upward for those illegal missed in the CPS, then figures would no longer match the survey, which is the primary source for government statistics on things like poverty or the uninsured. Not adjusting makes it possible to estimate what share of the poverty or uninsured populations, as shown in of-ficial government publications, are illegal immigrants.51 Table 23 reports the estimated number and share of the school-age population in the United States that is com-prised of illegal immigrants. Overall illegals account for 1.5 million school-age children or 2.8 percent of all 5 to 17 year olds. This is smaller than the 3.8 percent illegals represent of the nation’s total population because im-
Table 23. Estimated Impact of Illegal Immigration on the School-Age (5-17) Population (thousands)
PercentIllegal
6 %5 %5 %5 %5 %4 %4 %4 %3 %3 %3 %3 %3 %3 %3 %2 %3 %
Source: Center for Immigration Studies analysis of March 2007 Current Population Survey. Estimates are only for those who responded to the survey. 1 Includes U.S.-born children of illegal aliens.
Number Illegal
8823561
1553398739641527343644295861
1,510
Percent Illegal and Their U.S.-Born Children1
8 %13 %16 %9 %
13 %16 %6 %7 %
10 %8 %7 %5 %5 %4 %7 %3 %6 %
Number Illegal and Their U.S.-Born Children1
12757118528090932157
115486676598043
155117
3,301
New JerseyTexasArizonaFloridaCalifornia L.A. CountyMarylandGeorgiaNevadaColoradoWashingtonVirginiaNorth CarolinaMassachusettsIllinoisNew YorkNation
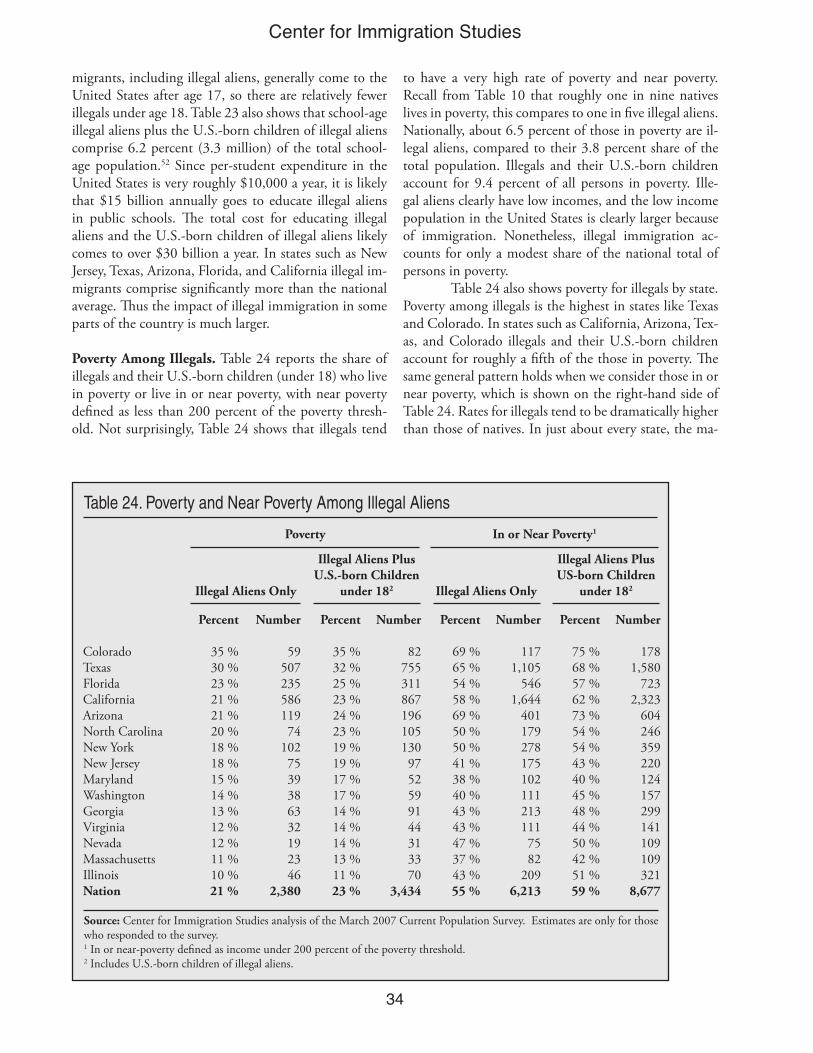
��
Center for Immigration Studies
migrants, including illegal aliens, generally come to the United States after age 17, so there are relatively fewer illegals under age 18. Table 23 also shows that school-age illegal aliens plus the U.S.-born children of illegal aliens comprise 6.2 percent (3.3 million) of the total school-age population.52 Since per-student expenditure in the United States is very roughly $10,000 a year, it is likely that $15 billion annually goes to educate illegal aliens in public schools. The total cost for educating illegal aliens and the U.S.-born children of illegal aliens likely comes to over $30 billion a year. In states such as New Jersey, Texas, Arizona, Florida, and California illegal im-migrants comprise significantly more than the national average. Thus the impact of illegal immigration in some parts of the country is much larger.
Poverty Among Illegals. Table 24 reports the share of illegals and their U.S.-born children (under 18) who live in poverty or live in or near poverty, with near poverty defined as less than 200 percent of the poverty thresh-old. Not surprisingly, Table 24 shows that illegals tend
to have a very high rate of poverty and near poverty. Recall from Table 10 that roughly one in nine natives lives in poverty, this compares to one in five illegal aliens. Nationally, about 6.5 percent of those in poverty are il-legal aliens, compared to their 3.8 percent share of the total population. Illegals and their U.S.-born children account for 9.4 percent of all persons in poverty. Ille-gal aliens clearly have low incomes, and the low income population in the United States is clearly larger because of immigration. Nonetheless, illegal immigration ac-counts for only a modest share of the national total of persons in poverty. Table 24 also shows poverty for illegals by state. Poverty among illegals is the highest in states like Texas and Colorado. In states such as California, Arizona, Tex-as, and Colorado illegals and their U.S.-born children account for roughly a fifth of the those in poverty. The same general pattern holds when we consider those in or near poverty, which is shown on the right-hand side of Table 24. Rates for illegals tend to be dramatically higher than those of natives. In just about every state, the ma-
Table 24. Poverty and Near Poverty Among Illegal Aliens
Source: Center for Immigration Studies analysis of the March 2007 Current Population Survey. Estimates are only for those who responded to the survey. 1 In or near-poverty defined as income under 200 percent of the poverty threshold.2 Includes U.S.-born children of illegal aliens.
ColoradoTexasFloridaCaliforniaArizonaNorth CarolinaNew YorkNew JerseyMarylandWashingtonGeorgiaVirginiaNevadaMassachusettsIllinoisNation
Illegal Aliens Only
Percent
35 %30 %23 %21 %21 %20 %18 %18 %15 %14 %13 %12 %12 %11 %10 %21 %
Number
5950723558611974
1027539386332192346
2,380
In or Near Poverty1
Percent
35 %32 %25 %23 %24 %23 %19 %19 %17 %17 %14 %14 %14 %13 %11 %23 %
Number
827553118671961051309752599144313370
3,434
Percent
69 %65 %54 %58 %69 %50 %50 %41 %38 %40 %43 %43 %47 %37 %43 %55 %
Number
117 1,105
546 1,644
401 179 278 175 102 111 213 111 75 82
209 6,213
Illegal Aliens Plus U.S.-born Children
under 182 Illegal Aliens Only
Poverty
Percent
75 %68 %57 %62 %73 %54 %54 %43 %40 %45 %48 %44 %50 %42 %51 %59 %
Number
178 1,580
723 2,323
604 246 359 220 124 157 299 141 109 109 321
8,677
Illegal Aliens Plus US-born Children
under 182

��
Center for Immigration Studies
jority of illegals and their minor children live in or near poverty. And illegal immigrants account for a large share of the overall low-income population. However, its is worth noting that of all immigrants and their children who live in or near poverty, only about 41 percent are illegal aliens or the young children of illegal aliens. Most low-income immigrants are not illegal aliens.
Welfare Among Illegals by State. Table 25 shows the share of households headed by illegal aliens using various welfare programs. It shows that a large share of illegal alien households use the food assistance programs (food stamps, WIC, and free lunch) and Medicaid. But use of cash assistance (TANF, State General Assistance, and SSI) is generally very low. It should also be added that the share of households headed by illegals in public or rent subsidized housing is virtually zero. It must be re-membered that, in general, illegals cannot use the welfare system themselves. But their U.S.-born children can be enrolled in Medicaid and receive food assistance. Table 25 reflects the fact that a very large share of illegals have low incomes and as a result their children can enroll in
means-tested programs. This is important for a number of reasons, not the least of which because it means that efforts to bar illegals from using welfare programs will be ineffective. Their U.S.-citizen children will continue to enjoy the same welfare eligibility as any other American citizen. Or put a different way, as long as illegals are al-lowed to stay in the country, their children will continue to access the welfare system at very high rates, at least for some programs. It should also be noted that this situation is not caused by an unwillingness to work on the part of il-legals. In fact, as already mentioned more than 90 per-cent of illegal households have at least one worker, much higher than the rate for native households. Rather, with 57 percent of adult illegals lacking even a high school degree, their average incomes in the modern economy will be very low. The American welfare system is geared toward helping low-income workers, especially those with children. Since a very large share of illegals work, have low income, and have children, most of whom were born here, it should be no surprise that many il-legal households use the welfare system. Use of means-
Figure 8. Illegal Aliens as a Share of the School-Age Population, & Those in Poverty or Without Health Insurance
Source: Center for Immigration Studies analysis of March 2007 Current Population Survey. Estimates are only for those who responded to the survey. 1 Includes all illegal aliens and their U.S.-born children under age 18.
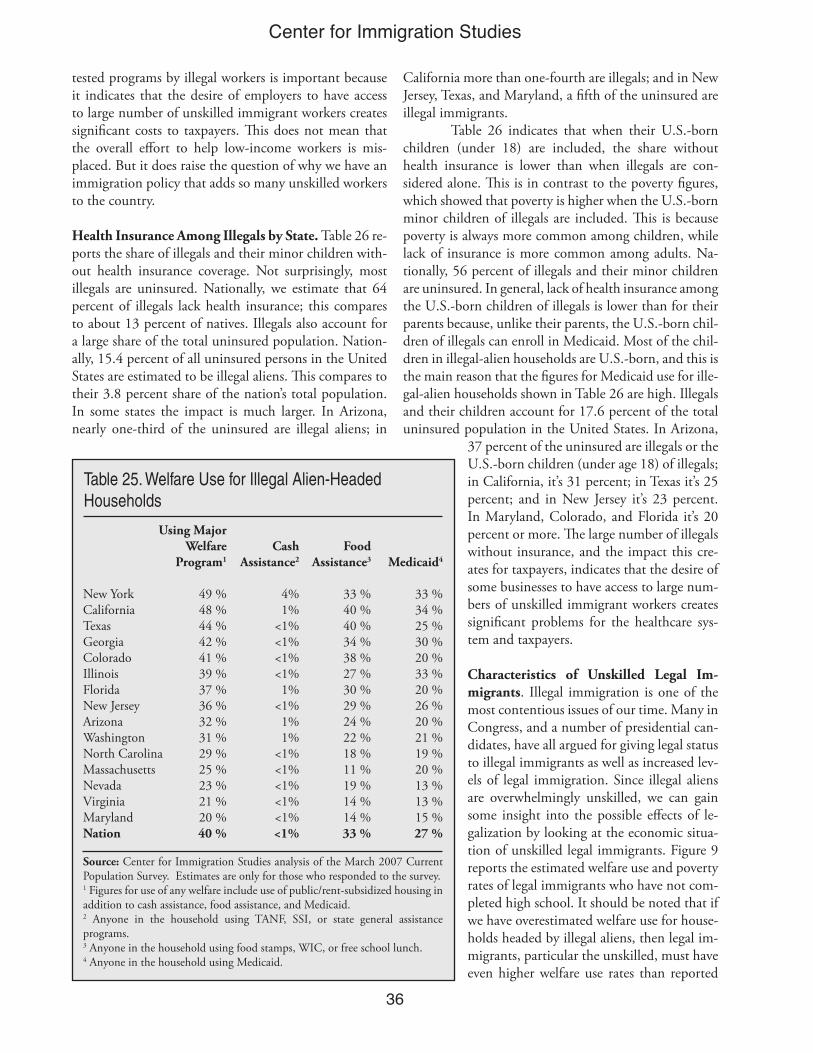
��
Center for Immigration Studies
tested programs by illegal workers is important because it indicates that the desire of employers to have access to large number of unskilled immigrant workers creates significant costs to taxpayers. This does not mean that the overall effort to help low-income workers is mis-placed. But it does raise the question of why we have an immigration policy that adds so many unskilled workers to the country.
Health Insurance Among Illegals by State. Table 26 re-ports the share of illegals and their minor children with-out health insurance coverage. Not surprisingly, most illegals are uninsured. Nationally, we estimate that 64 percent of illegals lack health insurance; this compares to about 13 percent of natives. Illegals also account for a large share of the total uninsured population. Nation-ally, 15.4 percent of all uninsured persons in the United States are estimated to be illegal aliens. This compares to their 3.8 percent share of the nation’s total population. In some states the impact is much larger. In Arizona, nearly one-third of the uninsured are illegal aliens; in
California more than one-fourth are illegals; and in New Jersey, Texas, and Maryland, a fifth of the uninsured are illegal immigrants.
Table 26 indicates that when their U.S.-born children (under 18) are included, the share without health insurance is lower than when illegals are con-sidered alone. This is in contrast to the poverty figures, which showed that poverty is higher when the U.S.-born minor children of illegals are included. This is because poverty is always more common among children, while lack of insurance is more common among adults. Na-tionally, 56 percent of illegals and their minor children are uninsured. In general, lack of health insurance among the U.S.-born children of illegals is lower than for their parents because, unlike their parents, the U.S.-born chil-dren of illegals can enroll in Medicaid. Most of the chil-dren in illegal-alien households are U.S.-born, and this is the main reason that the figures for Medicaid use for ille-gal-alien households shown in Table 26 are high. Illegals and their children account for 17.6 percent of the total uninsured population in the United States. In Arizona,
37 percent of the uninsured are illegals or the U.S.-born children (under age 18) of illegals; in California, it’s 31 percent; in Texas it’s 25 percent; and in New Jersey it’s 23 percent. In Maryland, Colorado, and Florida it’s 20 percent or more. The large number of illegals without insurance, and the impact this cre-ates for taxpayers, indicates that the desire of some businesses to have access to large num-bers of unskilled immigrant workers creates significant problems for the healthcare sys-tem and taxpayers.
Characteristics of Unskilled Legal Im-migrants. Illegal immigration is one of the most contentious issues of our time. Many in Congress, and a number of presidential can-didates, have all argued for giving legal status to illegal immigrants as well as increased lev-els of legal immigration. Since illegal aliens are overwhelmingly unskilled, we can gain some insight into the possible effects of le-galization by looking at the economic situa-tion of unskilled legal immigrants. Figure 9 reports the estimated welfare use and poverty rates of legal immigrants who have not com-pleted high school. It should be noted that if we have overestimated welfare use for house-holds headed by illegal aliens, then legal im-migrants, particular the unskilled, must have even higher welfare use rates than reported
Table 25. Welfare Use for Illegal Alien-Headed Households
Using Major Welfare
Program1
49 %48 %44 %42 %41 %39 %37 %36 %32 %31 %29 %25 %23 %21 %20 %40 %
Source: Center for Immigration Studies analysis of the March 2007 Current Population Survey. Estimates are only for those who responded to the survey. 1 Figures for use of any welfare include use of public/rent-subsidized housing in addition to cash assistance, food assistance, and Medicaid. 2 Anyone in the household using TANF, SSI, or state general assistance programs. 3 Anyone in the household using food stamps, WIC, or free school lunch.4 Anyone in the household using Medicaid.
Cash Assistance2
4%1%
<1%<1%<1%<1%1%
<1%1%1%
<1%<1%<1%<1%<1%<1%
Food Assistance3
33 %40 %40 %34 %38 %27 %30 %29 %24 %22 %18 %11 %19 %14 %14 %33 %
Medicaid4
33 %34 %25 %30 %20 %33 %20 %26 %20 %21 %19 %20 %13 %13 %15 %27 %
New YorkCaliforniaTexasGeorgiaColoradoIllinoisFloridaNew JerseyArizonaWashingtonNorth CarolinaMassachusettsNevadaVirginiaMarylandNation

�7
Center for Immigration Studies
here. This would mean that legalization would be even more costly because the difference between what illegals currently use and what they would use once legalized is even larger than we have estimated. This has to be the case mathematically because immigrant households ac-cessing the welfare system can only be either legal immi-grants or illegal aliens and we simply take the welfare use rates for the foreign-born as reported in the CPS. We do not impute welfare use or change the share using welfare for the foreign-born in any way. Figure 9 shows that unskilled legal immigrants make extensive use of the welfare system. In fact, our estimate is that more than half (56 percent) of house-holds headed by unskilled legal immigrants use at least one major welfare program. Their use of welfare pro-grams is much higher than that of illegal aliens for every type of program. In contrast to welfare use, the share of unskilled legal immigrants and their children living in or near poverty is very similar to illegal aliens and their children. One area where unskilled legal immigrants are much better off than illegal aliens is in health insurance
coverage. But this is partly due to the fact that such a large share of unskilled legal immigrants and their chil-dren use Medicaid, which is very costly to taxpayers. Figure 9 indicates that legalization will not solve the problems of welfare use or low income associated with illegal immigration. In fact, legalization will in-crease use of welfare programs. Whether this is a better or worse situation depends on one’s point of view. Of course, not all illegal aliens are unskilled. We estimate 57 percent of illegal immigrants (18 to 64 year of age) lack a high school education. Those with more education can be expected to do better than unskilled legal immigrants. On the other hand, legal unskilled immigrants in the CPS have lived in the United States significantly lon-ger than the average illegal immigrant, the majority of whom have lived here for less than 10 years. Over time income rises with greater workforce experience. The es-timates for unskilled legal immigrants reflect this fact. Thus, unskilled legal immigrants in the CPS have higher incomes than would be expected for legalized unskilled illegal aliens, at least at the onset of any amnesty.
Table 26. Illegal Alien Health Insurance Coverage
Illegals Percent
69 %65 %67 %70 %59 %59 %68 %55 %79 %40 %57 %64 %52 %67 %25 %64 %
Source: Center for Immigration Studies analysis of the March 2007 Current Population Survey. Estimates are only for those who responded to the survey. 1 Includes U.S.-born children of Illegal Immigrants.
Illegals Number
403 1,858
288 1,197
157 94
685 279 134 110 148 232 251 371 56
7,251
Illegals and Their U.S.-Born
Children Percent1
58 %55 %61 %62 %53 %53 %61 %51 %70 %34 %53 %58 %42 %59 %23 %56 %
Illegals and Their U.S.-Born
Children Number1
4802,081
3141,450
16511577932116612017126526639761
8,267
ArizonaCaliforniaNew JerseyTexasMarylandNevadaFloridaGeorgiaColoradoWashingtonVirginiaNorth CarolinaIllinoisNew YorkMassachusettsNation
Uninsured (thousands)
Illegals
31 %27 %21 %21 %20 %19 %18 %17 %16 %15 %15 %15 %14 %14 %9 %
15 %
Illegals and Their U.S.-Born
Children
37 %31 %23 %25 %21 %23 %20 %19 %20 %16 %17 %17 %15 %15 %9 %
18 %
Share of State Uninsured

��
Center for Immigration Studies
Legal Status No Guarantee of Success. Figure 9 makes clear that immigrants who have legal status, but little education, generally have low incomes and make heavy use of welfare programs. If we decide to legalize illegal immigrants, we should at least understand that it will not result in dramatically lower welfare use or poverty for most illegal aliens. This does not mean legalization is
necessarily a bad idea. But it does mean that those who advocate such a policy need to acknowledge this problem and not argue that legalization will save taxpayers money or result in a vast improvement in the income of ille-gal aliens. Legalized illegals will still be overwhelmingly uneducated and this fact has enormous implications for their income, welfare use, health insurance coverage, and the effect on American taxpayers.
Figure 9. Unskilled legal immigrants have high rates of welfare use, poverty, and uninsurance, so legalizing illegals would not solve these problems.
Source: Center for Immigration Studies analysis of March 2007 Current Population Survey. Estimates are only for those who responded to the survey.1 Unskilled immigrants defined as not having completed high school. 2 Figures for native excluded U.S.-born children (under age 18) of Immigrant fathers.3 Welfare use based on nativity of household head. Figures for use of any welfare includes use of public/rent subsidized housing, in addition to cash assistance, food assistance and Medicaid. 4 Anyone in the household using TANF, SSI or state general assistance programs. 5 Anyone in household using food stamps, WIC or free school lunch. 6 Anyone in the household using Medicaid.7 Figure for immigrants (legal & illegal) Include their US-born children under age 18.8 In or near poverty defined as less than 200 percent of poverty threshold.

��
Center for Immigration Studies
Conclusion The latest data collected by the Census Bureau shows that the last seven years have been the highest period of im-migration in American history. Immigration continues to be the subject of intense national debate. The roughly 1.5 million immigrants arriving each year (1.6 million if you count those missed by the Census Bureau) have a very significant effect on many areas of American life. Immigrants and their young children (under 18) now account for one-fifth of the school-age population, one-fourth of those in poverty, and nearly one-third of those without health insurance, creating enormous challenges for the nation’s schools, healthcare system, and physical infrastructure. The low educational attainment of many immigrants, 31 percent of whom have not completed high school, is the primary reason so many live in pov-erty, use welfare programs, or lack health insurance, not their legal status or an unwillingness to work. A central question for immigration policy is whether we should allow in so many people with little education — increas-ing job competition for the poorest American workers and the population needing government assistance.
Setting aside the lower socio-economic status of immigrants, no nation has ever attempted to incorporate nearly 38 million newcomers into its society. Whatever one thinks of contemporary immigration, it is critically important to understand that its effect on America rep-resents a choice. Selection criteria can be altered, as can the total number of people allowed into the country le-gally. Moreover, the level of resources devoted to reduc-ing illegal immigration can also be reduced or increased. With illegal aliens accounting for nearly one in three im-migrants, their effect on the nation by themselves is now very large. The goal of this Backgrounder has been to pro-vide information about the impact of immigration on American society to better inform the policy discussion about what kind of immigration policy should be ad-opted in the future. Absent a change in policy, 15 mil-lion additional legal and illegal immigrants will likely ar-rive in the next 10 years. Thus immigration’s impact will continue to grow if current trends continue.
�0
Center for Immigration Studies
End Notes1 The survey is considered such an accurate source of in-formation on the foreign-born because, unlike the decen-nial census, each household in the CPS receives an in-per-son interview from a Census Bureau employee. It also includes an extra-large sample of minorities. The 207,000 persons in the survey, 25,000 of whom are foreign-born, are weighted to reflect the actual size of the total U.S. population. However, it must be remembered that some percentage of the foreign-born (especially illegal aliens) are missed by government surveys of this kind, thus the actual size of this population is almost certainly larger. Of course, this was also true in past years.
2 This includes naturalized American citizens, legal per-manent residents (green card holders), illegal aliens, and people on long-term temporary visas such as students or guest workers, who responded to the CPS. It does not include those born abroad of American parents or those born in outlying territories of the United States such as Puerto Rico.
3 The 2006 American Community Survey (ACS) col-lected in 2006 includes persons in group quarters. While it does not have the detail of the CPS, it does distinguish the foreign-born.
4 The Department of Homeland Security (DHS) estimate of illegal immigrants can be found at www.dhs.gov/xli-brary/assets/statistics/publications/ill_pe_2006.pdf. Table 2 in the report includes an estimate of non-immigrants and illegals in the American Community Survey (ACS). The population totals and coverage ratio of the ACS and CPS are very similar.
5 Figure 1 reports the number of immigrants living in the country from 1995 through 2007 from the March CPS. The data for 1995 to 1999 was originally weighted based on the results of the 1990 Census carried forward. This was also true for the March 2000 and 2001 CPS. After the 2000 Census, which was conducted in April, the Cen-sus Bureau re-weighted the March 2000 and 2001 CPSs based on the results from the 2000 Census. This had the effect of increasing the size of the foreign-born popula-tion in the March 2000 CPS by 5.659 percent. While the Census Bureau has not re-weighted the 1995 through 1999 CPSs, it is very reasonable to assume that the un-dercount was similar in those years. If we adjust the 1995 through 1999 March CPSs by the same amount it pro-duces the results found in Figure 1.
6 If the original weights (based on the 1990 census) are used for the 1996 through 2000 data, then the foreign-born grew from 23 million in 1995 to 28.38 million in 2000 — 5.38 million. This is less than the 5.7 million growth reported for this time period shown in Figure 1.
7 Unlike deaths, out-migration may or may not rise with the size of the immigrant population. Also, unlike deaths, it can fluctuate from year to year. While the potential pool of return migrants obviously grows as the immigrant population grows, this does not necessarily mean that more will choose to go home, or in the case of illegals, be forced to do so. Put simply, out-migration usually is vol-untary and can fluctuate; deaths on the other hand are not voluntary and therefore occur at a predictable rate. This does not mean that out-migration cannot be estimated. See Census Bureau publication www.census.gov/popula-tion/documentation twps0051/twps0051.pdf. In a recent report we estimated that between 2000 and 2005 new immigrant arrivals averaged 1.6 million a year and out-migration was 350,000. The 1.6 million figure assumes a 5.2 percent (roughly 100,000) undercount among re-cent arrivals. The Center for Immigration Studies report is entitled “100 Million More: Projecting the Impact of Immigration On the U.S. Population, 2007 to 2060” and can be found at www.cis.org/articles/2007/back707.html. The Census Bureau’s 280,000 out-migration figure as-sumes no immigrants are missed by the Census Bureau.
8 The Pew Hispanic Center assumes a 5.2 percent under-count of the total foreign-born population in the 2005 CPS. See Figure 3, page 4, in their March 2006 estimate of the illegal population, http://pewhispanic.org/files/re-ports/61.pdf. Pew bases its 5.2 percent estimate on work done by Passel, Van Hook, and Bean. Their paper is en-titled “Narrative Profile with Adjoining Tables of Unau-thorized Migrants and Other Immigrants, Based on Cen-sus 2000: Characteristics and Methods,” which was done for Sabre Systems as part of a contract with the Census Bureau.
9 In order to preserve anonymity, the Census Bureau groups several different years of arrival together in the public use CPS. In the March 2000 CPS, for example, those who arrived in 1992 and 1993 are grouped together. We split the 1992-93 group by dividing it in two, so we can compare the seven-year period prior to 2000 with the last seven years. (Even if the 1992-1993 group is not split it still shows that fewer than 10 million immigrants ar-rived from 1992 to 2000.) The 2001 CPS shows that 9.7 million immigrants arrived from 1994 to 2001. Thus the
��
Center for Immigration Studies
last seven years match or exceed the number of new im-migrant in any seven-year period. Immigration during the great wave of immigration 100 years ago showed a level well below 10.3 million for any seven-year period.
10 The report, “Immigrants at Mid-Decade: A Snapshot of American’s Foreign-Born Population in 2005,” can be found at www.cis.org/articles/2005/back1405.pdf. Pages 2 through 4 and endnotes 6 through 14 explain why esti-mating individual year flows of immigrants is so difficult.
11 To distinguish legal and illegal immigrants in the sur-vey, this report uses citizenship status, year of arrival in the United States, age, country of birth, educational at-tainment, sex, receipt of welfare programs, receipt of So-cial Security, veteran status, and marital status. We use these variables to assign probabilities to each respondent. Those individuals who have a cumulative probability of 1 or higher are assumed to be illegal aliens. The probabilities are assigned so that both the total number of illegal aliens and the characteristics of the illegal population closely match other research in the field, particularly the esti-mates developed by the Department of Homeland Securi-ty/legacy INS, the Urban Institute, and the Pew Hispanic Center. This method is based on some very well-estab-lished facts about the characteristics of the illegal popula-tion. For example, it is well known that illegal aliens are disproportionately male, unmarried, under age 40, have few years of schooling, etc. Thus, we assign probabilities to these and other factors in order to select the likely il-legal population. In some cases, we assume that there is no probability that an individual is an illegal alien.
12 The Department of Homeland Security (DHS) esti-mate of 11.6 million illegal immigrants in January 2006 can be found at: www.dhs.gov/xlibrary/assets/statistics/publications/ill_pe_2006.pdf. That estimate includes an adjustment for those missed in Census Bureau data. The Pew Hispanic Center has estimated an 11.5 to 12 million illegal immigrant population as of March 2006 based on the CPS. This includes an adjustment for those missed by the survey. The Pew report can be found at http://pewhis-panic.org/reports/report.php?ReportID=61. The Urban Institute also has made estimates by legal status. Urban estimates that in March of 2002, 8.3 million illegal aliens were counted in the CPS, with an additional one million being missed. Urban’s estimates based on the March 2002 CPS can be found at: http://www.urban.org/publica-tions/1000587.html. Older studies by the INS and Cen-sus Bureau are also available. The INS report which found seven million illegal aliens in 2000 and an annual increase of about 500,000, can be found at: www.immigration.gov/graphics/aboutus/statistics/Ill_Report_1211.pdf. The
Census Bureau estimate of eight million illegals in 2000 can be found at www.census.gov/dmd/www/ReportRec2.htm (Appendix A of Report 1 contains the estimates).
13 Table C in the INS report on illegal immigration shows the number of non-IRCA legalizations in the 1990s. It can be found at: http://www.dhs.gov/xlibrary/assets/sta-tistics/publications/Ill_Report_1211.pdf
14 As discussed in note 8, some research indicates that 5.2 percent of immigrants are missed in the CPS, if this is correct then the actual size of the foreign-born population is 39.9 million. Assuming the immigrant population con-tinued to grow after March 2007 at its prior pace, then the total foreign-born population stands at 40.5 million as of November 2007. This is triple the size of the foreign-born in 1910 (13.5 million), during the peak of the last great wave of immigration.
15 The total population in the 2000 Census was 281.4 million. The newest population estimates released by the Census Bureau can be found at www.census.gov/popest/states/tables/NST-EST2006-01.xls We carry the esti-mates forward to March 2007 and find a total population growth of 20.0 million since the 2000 Census.
16 See note 15 for newest Census Bureau’s population estimates from 2000 to 2006.
17 In a study published earlier this year, the Center for Immigration Studies projected that even if there was no immigration over the next 53 years, in 2060 the U.S. population would still be growing by 800,00 a year. If the current level of net immigration continued it would be growing by 3.3 million a year in 2060. See: http://www.cis.org/articles/2007/back707.html
18 See Robert Warren and Ellen Percy Kraly, 1985, “The Elusive Exodus: Emigration from the United States.” Oc-casional Paper #8. Population Reference Bureau, Wash-ington, D.C.
19 As discussed in note 8, if one adjusts for undercount in the CPS and assumes that growth continued through November of this year, then the total immigrant popula-tion now stands at over 40 million, triple the 13.5 million in 1910.
20 So that comparisons can be made between 1995 and 2000 and 2007, we have attempted to adjust figures for 1995 to reflect the results of the 2000 Census. However, the effects of these adjustments increase the foreign-born by only a small amount.

�2
Center for Immigration Studies
21 This figure refers to persons aged 18 or older who are in the workforce. To be in the workforce one has to be either employed or actively looking for work. Persons actively looking for work are considered unemployed.
22 The median figures in Table 6 and all subsequent ta-bles, including those for households, are calculated using the Census Bureau method of grouping data into $2,500 cells. While the median figures in this Backgrounder close-ly match median figures published by the Census Bureau, they may not exactly match in all cases because the Bu-reau top-codes income figures in the public use file of the CPS.
23 When considering immigrant household income, it should be noted that the average household income for immigrants is much closer to that of natives than is the median household income of immigrants — $66,952 for natives and $64,114 for immigrants. This is because there are a number of very high income immigrant households that pull up the average household income of immigrants. Nevertheless, the income of immigrant households is still 4 percent less on average that native households, and at the same time their households are 28 percent larger. These two facts are the source of any potential fiscal prob-lems immigrants may create for public coffers.
24 See page 21 of the Census Bureau’s “Methodology and Assumptions for the Population Projections of the United States: 1999 to 2100” The report can be found at www.census.gov/population/www/documentation/twps0038.pdf
25 The Backgrounder, “Immigration in an Aging Society Workers, Birth Rates, and Social Security,” can be found at www.cis.org/articles/2005/back505.html
26 The Backgrounder, “100 Million More: Projecting the Impact of Immigration on the U.S. Population, 2007 to 2060,” can be found at www.cis.org/articles/2007/back707.html.
27 Official government poverty statistics do not include the small number of unrelated individuals under age 15 (mostly foster children) and they are therefore not in-cluded in Table 7 and all subsequent tables dealing with poverty.
28 It should be noted that year of arrival data is grouped in the CPS to preserve the anonymity of respondents. Table 7 reports figures in as detailed a manner as possible given this grouping.
29 See, for example, the Urban Institute study “Immigra-tion and Immigrants: Setting the Record Straight,” which can be found at: www.urban.org/publications/305184.html#III
30 Of immigrants who did not have a high school degree and had lived in the country 20 or more years, one-fifth lived in poverty and 54 percent lived in or near poverty. Both rates are substantially above that of natives.
31 Figures for natives exclude the young (under 18) U.S.-born children of immigrant fathers.
32 We report poverty for children born in the United States who have immigrant fathers and are under the age of 18. This has the effect of counting children who have two parents who are foreign-born or just those whose fa-ther is foreign-born. Those who have only foreign-born mothers are not counted. In this way, we avoid double counting. If we report figures for children with two for-eign-born parents or just an immigrant mother the results are very similar.
33 As is the case for poverty figures, the rate for natives excludes the U.S.-born children (under 18) of immigrant fathers.
34 The article, “Healthcare Expenditures of Immigrants in the United States: A Nationally Representative Analy-sis,” by Sarita A. Mohanty, Steffie Woolhandler, David U. Himmelstein, Susmita Pati, Olveen Carrasquillo, and Da-vid H. Bor, appeared in the August 2005 American Jour-nal of Public Health.
35 Figures for immigrants include the U.S.-born children (under 18) of immigrant fathers. Figures for natives ex-clude these children.
36 See, for example, Figures 20-1, 20-2, and 20-3 in “Pro-files of the Foreign-born Population in the United States 2000,” by Dianne A. Schmidley. U.S. Government Print-ing Office. Series P23-206.
37 The Census Bureau released the 2007 CPS without figures for the EITC and ACTC, so the figures for both are from the 2006 CPS. The ACTC also can be referred to as the refundable portion of the Child Tax Credit. Ta-bles 12 and 13 report those who are eligible for cash from the government, not just a refund of money they paid as taxes.
��
Center for Immigration Studies
38 Use of welfare for both immigrants and natives in the CPS is understated because people forget about services when answering the survey. This is particularly true for use of Medicaid and cash assistance programs, which administrative data shows is somewhat higher than the numbers found in the CPS.
39 The primary refugee sending countries that can be iden-tified in the CPS are Albania, the former Yugoslavia, the former USSR, Afghanistan, Iraq, Cuba, Ethiopia, Eritrea, Liberia, Sierra Leone, Somalia, Sudan, Vietnam, Cambo-dia, Laos, and Nicaragua.
40 For a discussion of the decline in immigrant educa-tion relative to natives, see “The Slowing Progress of Im-migrants: An Examination of Income, Home Ownership, and Citizenship, 1970-2000,” which can be found at: www.cis.org/articles/2001/back401.html.
41 If we divide those with at least a bachelor’s degree between those with a four-year degree and those with a graduate or professional degree, we find that 10.2 percent of natives and 10.8 percent of immigrants have a post-graduate degree of some kind.
42 As already discussed in note 23, the average household income of immigrants is not as different as the median household income.
43 Figures for the school-age population are not for those actually enrolled in public school because the March CPS does not ask a question about enrollment. How-ever, the American Community Survey (ACS) does ask such a question. The 2006 ACS shows that of school-age children (5 to 17) living in immigrant households, 88.6 percent were enrolled in public school, 7.6 percent were in private school, and 3.8 percent were not enrolled in any school. For school-age children in native households, 84.3 percent were in public school, 11.9 percent were in private school, and 3.8 percent were not enrolled in any school. The higher rate of public school enrollment among the school-age children of immigrants means that their impact on public schools is actually slightly larger than that shown in the Table 17.
44 Figures include immigrants and the U.S.-born children (under age 18) of immigrant fathers.
45 Figures include immigrants and the U.S.-born children (under age 18) of immigrant fathers.
46 Both DHS estimates and Pew Hispanic estimates as-sume this level of undercount in the Census Bureau data.
47 We also estimate that there are an additional 400,000 illegal immigrants who are unemployed. This means that the total number of illegals in the labor force is 7.3 mil-lion. Again it must be remembered these figures are only for those who responded to the CPS.
48 None of the above figures include the roughly four million college students who are not working, nor does it include individuals over age 64 who are not working and who might be induced to rejoin the labor force.
49 The CPS shows that in 2000 the share of native-born teens holding a job was 25 percent compared to 18 per-cent in 2007. For less-educated adult natives (18 to 64), 69 percent were holding a job in 2000 compared to 66 percent in 2007.
50 To calculate median income in the way that the Cen-sus Bureau does, it is necessary to group data into cells. But the number of illegal alien households, which is much smaller than the number of illegal alien individuals, is not large enough in most states to do this and still produce reliable results. In contrast, a mean or average figure does not require the grouping of data so it is possible to calcu-late average income for smaller states. The median income of illegal households is much lower than the mean figure. For the nation as a whole, we estimate that the median income of households headed by illegal aliens is $35,966, compared the $49,201 median income of native-headed households, which is shown in Tables 6, 17, and 22. This means that the median income for illegal households is 73 percent that of natives households. The average income for illegal households ($45,748) is 68 percent that of na-tive households ($66,952), which is shown in Table 22.
51 Each year the Census Bureau publishes income, pov-erty, and health insurance statistics from the CPS. The lat-est version of the publication can be found at http://www.census.gov/prod/2007pubs/p60-233.pdf.
52 In total, we estimate that there are 3.4 million U.S.-born children (under age 18) of illegals in the March 2007 CPS. We also estimate that there are 1.7 million illegal aliens who are under age 18.

��
Center for Immigration StudiesCenter for Immigration Studies1522 K Street, NW, Suite 820Washington, DC 20005-1202(202) [email protected]
Bac
kgro
un
der
NON-PROFITU.S. POSTAGE
PAIDPERMIT # 6117
WASHINGTON, DC
10-0
7
Imm
igra
nts
in th
e U
nite
d St
ates
, 200
7A
Profi
le o
f Am
eric
a’s
Fore
ign-
Born
Pop
ulat
ion
By S
teve
n A.
Cam
arot
a
This
Back
grou
nder
pro
vide
s a d
etai
led
pict
ure
of th
e nu
mbe
r and
soci
o-ec
o-no
mic
stat
us o
f the
nat
ion’s
imm
igra
nt o
r for
eign
-bor
n po
pula
tion,
bot
h le
gal
and
illeg
al. Th
e da
ta w
as c
olle
cted
by
the
Cen
sus B
urea
u in
Mar
ch 2
007.
Amon
g th
e re
port’
s find
ings
:
• Th
e na
tion’s
imm
igra
nt p
opul
atio
n (le
gal a
nd il
lega
l) re
ache
d a
reco
rd o
f 37
.9 m
illio
n in
200
7.
• Im
mig
rant
s acc
ount
for o
ne in
eig
ht U
.S. r
esid
ents,
the
high
est l
evel
in
80 y
ears
. In
1970
it w
as o
ne in
21;
in 1
980
it w
as o
ne in
16;
and
in 1
990
it w
as o
ne in
13.
• O
vera
ll, n
early
one
in th
ree
imm
igra
nts i
s an
illeg
al a
lien.
Hal
f of M
exi-
can
and
Cen
tral
Am
eric
an im
mig
rant
s and
one
-third
of S
outh
Am
eric
an
imm
igra
nts a
re il
lega
l.
Cen
ter f
or Im
mig
ratio
n St
udie
s15
22 K
Stre
et, N
W, S
uite
820
Was
hing
ton,
DC
200
05-1
202
(202
) 466
-818
5 • (
202)
466
-807
6ce
nter
@ci
s.or
g • w
ww.
cis.
org