Embed Size (px)
Citation preview

1
THE ANNIE E. CASEY FOUNDATION
WEBINAR
identifying community priorities JULY 21, 2016
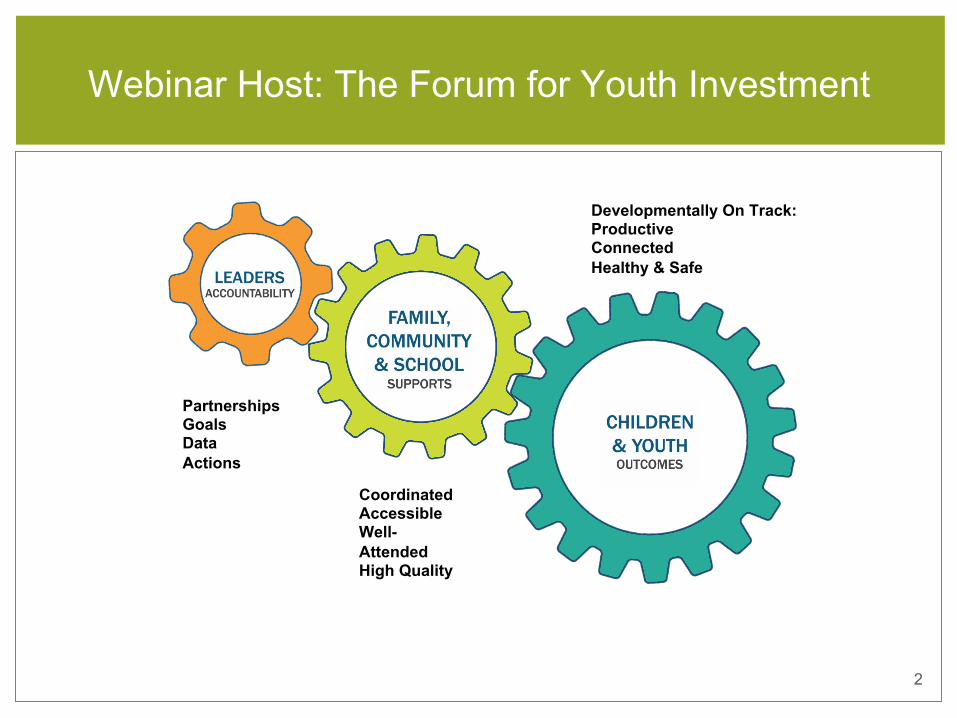
Partnerships Goals Data Actions
Coordinated Accessible Well-Attended High Quality
Developmentally On Track: Productive Connected Healthy & Safe
Webinar Host: The Forum for Youth Investment
2

Programs and
Services
Leaders
Child and Youth
Outcomes
The Need for Alignment and Precision
3

Today’s Presenters
4
Thaddeus Ferber,
The Forum for Youth
Investment (Host and moderator)
Ilene Berman,
The Annie E. Casey
Foundation
Kevin Haggerty,
Social Development
Research Group
Jeremiah Newell,
Mobile Area Education
Foundation
Rebecca Boxx,
Providence Children and
Youth Cabinet

5
Communicate with us using the Q&A window at the right of the presentation window.
• Type questions for the panel at any time during thewebinar.
• Use the box to let us know if you are havingtechnical difficulties.
Communicating During the Webinar

Ilene Berman The tools of Evidence2Success
6

The Annie E. Casey Foundation develops solutions to build a brighter future for children, families and communities.
7
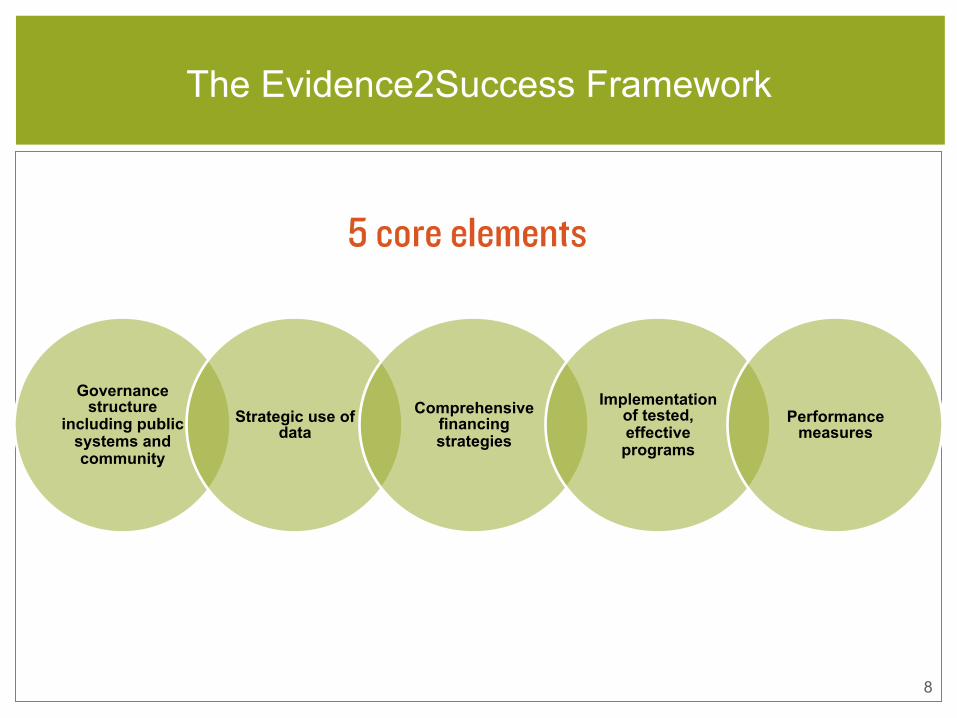
Governance structure
including public systems and community
Strategic use of data
Comprehensive financing strategies
Implementation of tested, effective programs
Performance measures
8
The Evidence2Success Framework
9
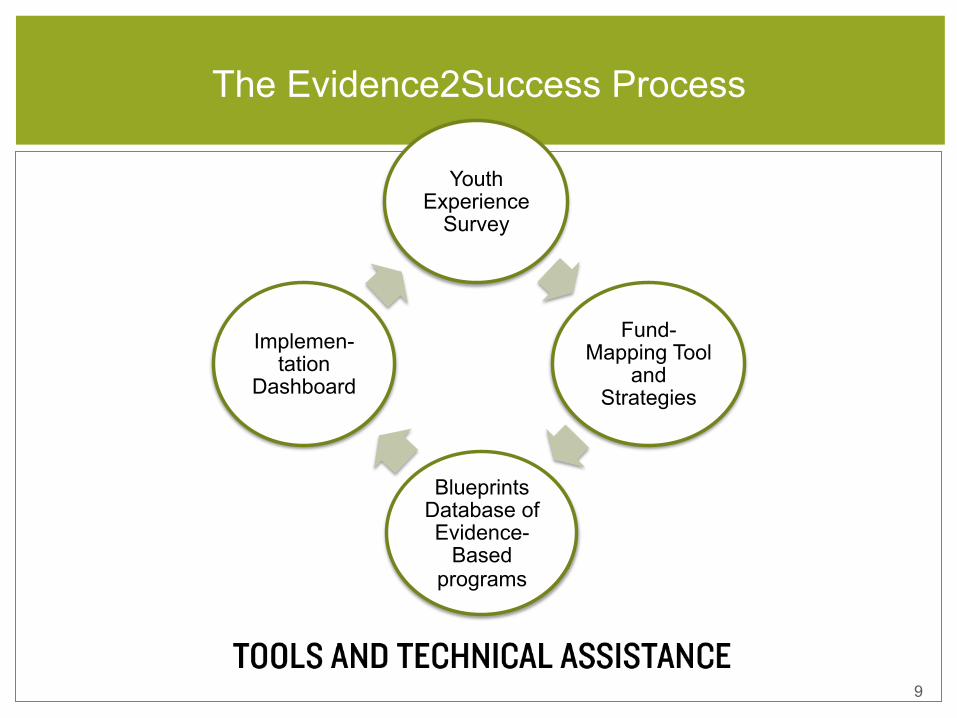
The Evidence2Success Process
Youth Experience
Survey
Fund-Mapping Tool
and Strategies
Blueprints Database of Evidence-
Based programs
Implemen-tation
Dashboard
10
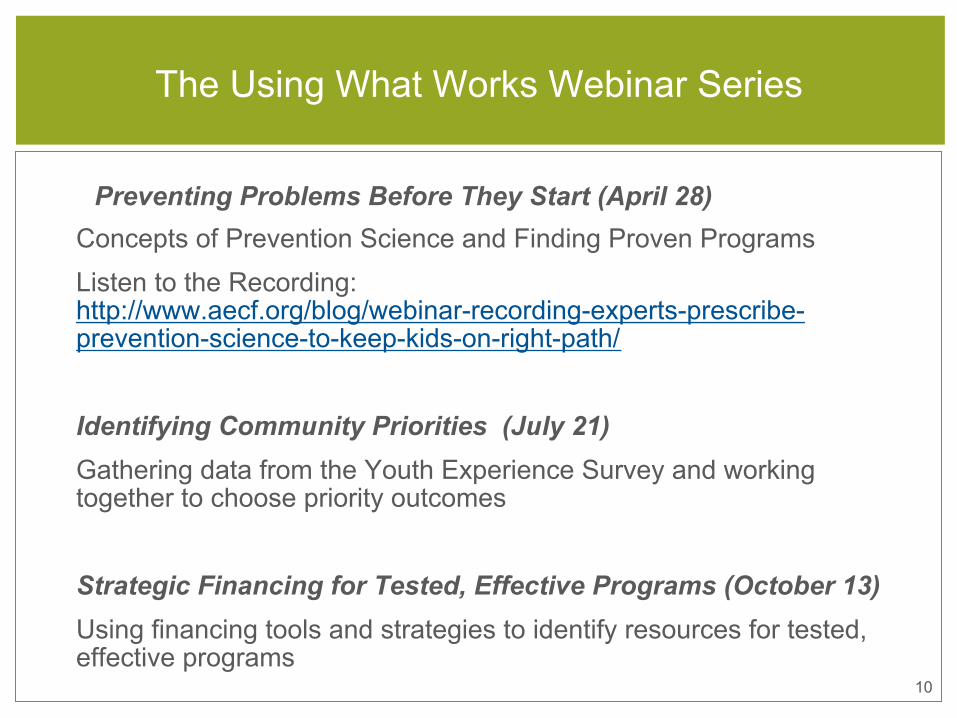
Preventing Problems Before They Start (April 28) Concepts of Prevention Science and Finding Proven Programs Listen to the Recording: http://www.aecf.org/blog/webinar-recording-experts-prescribe-prevention-science-to-keep-kids-on-right-path/
Identifying Community Priorities (July 21) Gathering data from the Youth Experience Survey and working together to choose priority outcomes
Strategic Financing for Tested, Effective Programs (October 13) Using financing tools and strategies to identify resources for tested, effective programs
The Using What Works Webinar Series
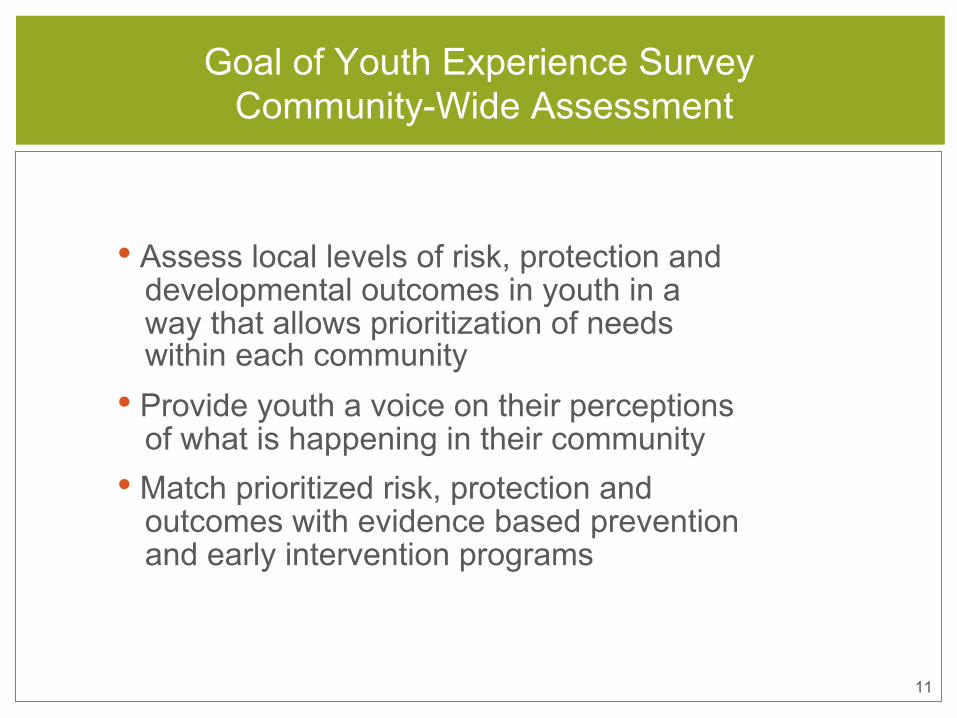
• Assess local levels of risk, protection anddevelopmental outcomes in youth in a way that allows prioritization of needs within each community
• Provide youth a voice on their perceptionsof what is happening in their community
• Match prioritized risk, protection andoutcomes with evidence based prevention and early intervention programs
Goal of Youth Experience Survey Community-Wide Assessment
11

12
• Data from Youth ExperienceSurvey
– Developmental outcomes
– Risk and protectivefactors
• National and state comparisondata
• Administrative data — tocomplement outcome data,e.g., graduation rates
Types of Data Used in Community Assessment

13
Q. Do you use survey data todetermine community priorities for young people?
Check “yes” or “no” in the polling area to the right.
Answer the Poll!

Kevin Haggerty About the Youth Experience Survey
14
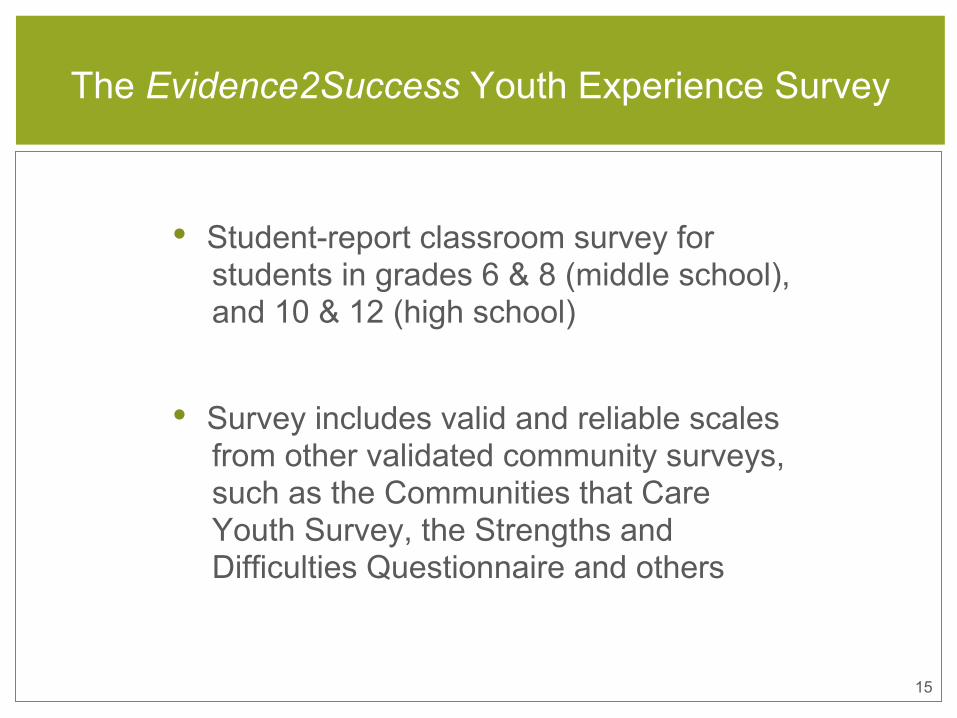
The Evidence2Success Youth Experience Survey
• Student-report classroom survey forstudents in grades 6 & 8 (middle school), and 10 & 12 (high school)
• Survey includes valid and reliable scalesfrom other validated community surveys, such as the Communities that Care Youth Survey, the Strengths and Difficulties Questionnaire and others
15

Common risk factors can predict multiple outcomes
P
16
P
P
17
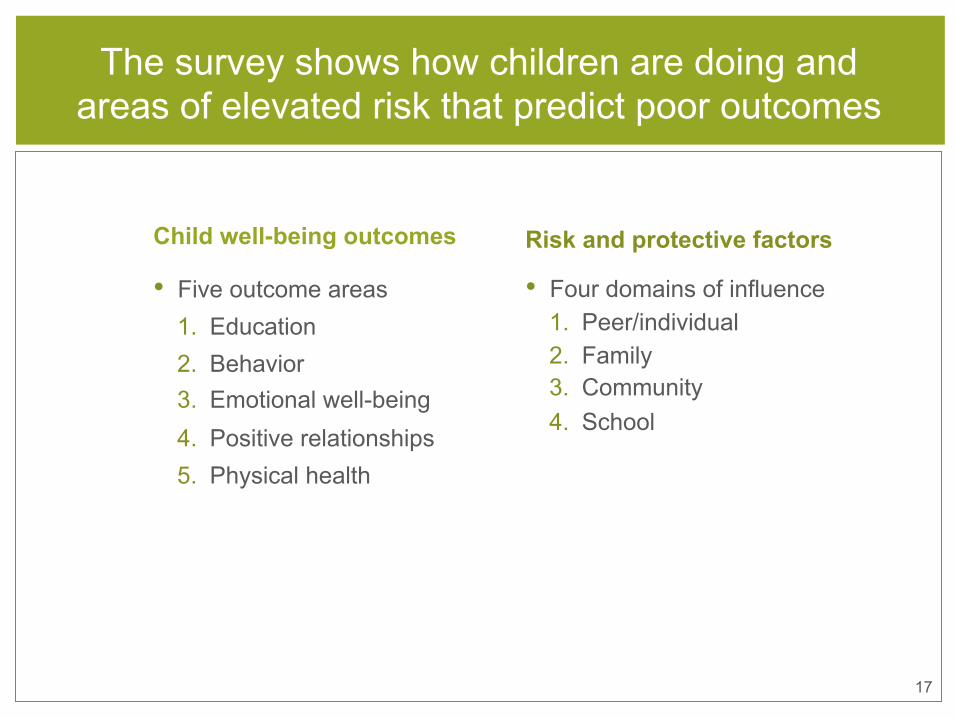
Child well-being outcomes
• Five outcome areas1. Education2. Behavior3. Emotional well-being4. Positive relationships5. Physical health
The survey shows how children are doing and areas of elevated risk that predict poor outcomes
Risk and protective factors
• Four domains of influence1. Peer/individual2. Family3. Community4. School
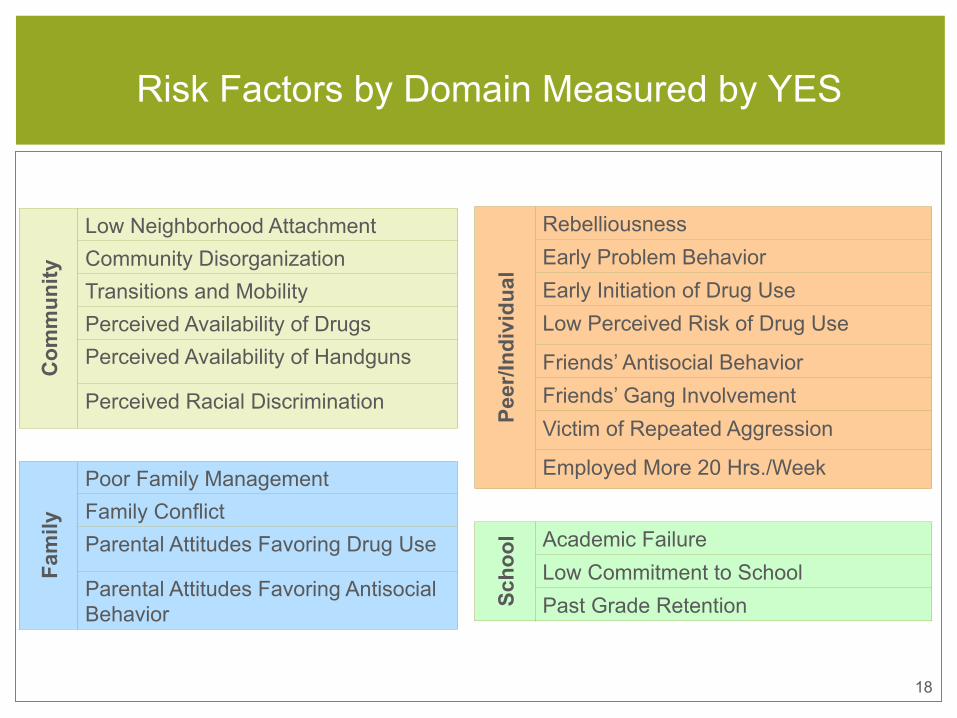
Risk Factors by Domain Measured by YES C
omm
unity
Low Neighborhood Attachment Community Disorganization Transitions and Mobility Perceived Availability of Drugs Perceived Availability of Handguns
Perceived Racial Discrimination
Fam
ily
Poor Family Management Family Conflict Parental Attitudes Favoring Drug Use
Parental Attitudes Favoring Antisocial Behavior
Peer
/Indi
vidu
al
Rebelliousness Early Problem Behavior Early Initiation of Drug Use Low Perceived Risk of Drug Use
Friends’ Antisocial Behavior Friends’ Gang Involvement Victim of Repeated Aggression
Employed More 20 Hrs./Week
Scho
ol Academic Failure
Low Commitment to School Past Grade Retention
18
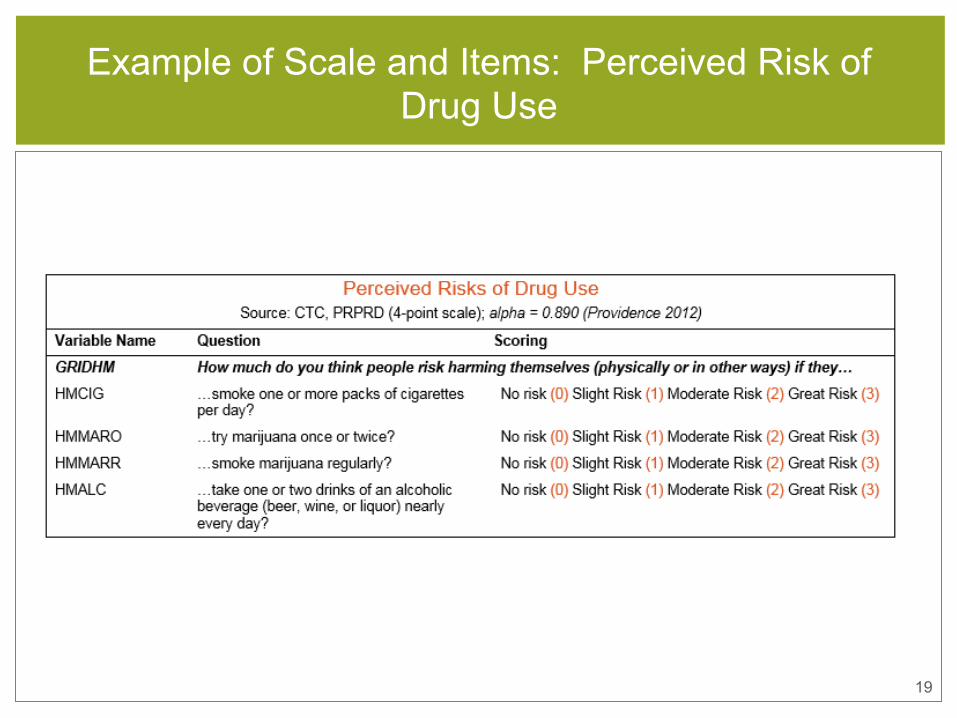
Example of Scale and Items: Perceived Risk of Drug Use
19
0%
10%
20%
30%
40%
50%
60%
70%
80%
90%
100%
Per
cent
Rep
ortin
g R
isk
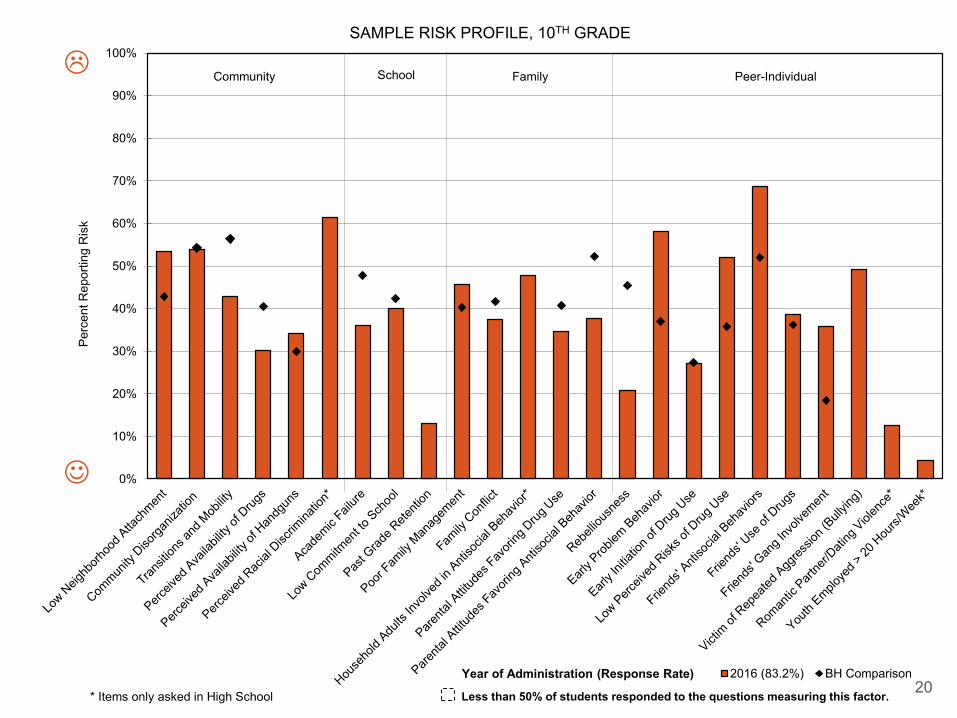
2016 (83.2%) BH Comparison
Community FamilySchool Peer-Individual
Year of Administration (Response Rate)
Less than 50% of students responded to the questions measuring this factor.* Items only asked in High School
J
L
20
SAMPLE RISK PROFILE, 10TH GRADE

Protective Factors by Domain Measured by YES C
omm
unity
Opportunities for prosocial involvement in the community Recognition for prosocial involvement in the community Collective efficacy
Fam
ily
Attachment to parents
Family opportunities for prosocial involvement Family recognition for prosocial involvement Parental use of positive discipline strategies Parental involvement in education
Peer
/Indi
vidu
al
Social skills
Clear standards for behavior
Prosocial friends
Rewards for prosocial involvement
Prosocial Involvement
Physical activity
Scho
ol
Academic self-efficacy
School opportunities for prosocial involvement School recognition for prosocial involvement
21
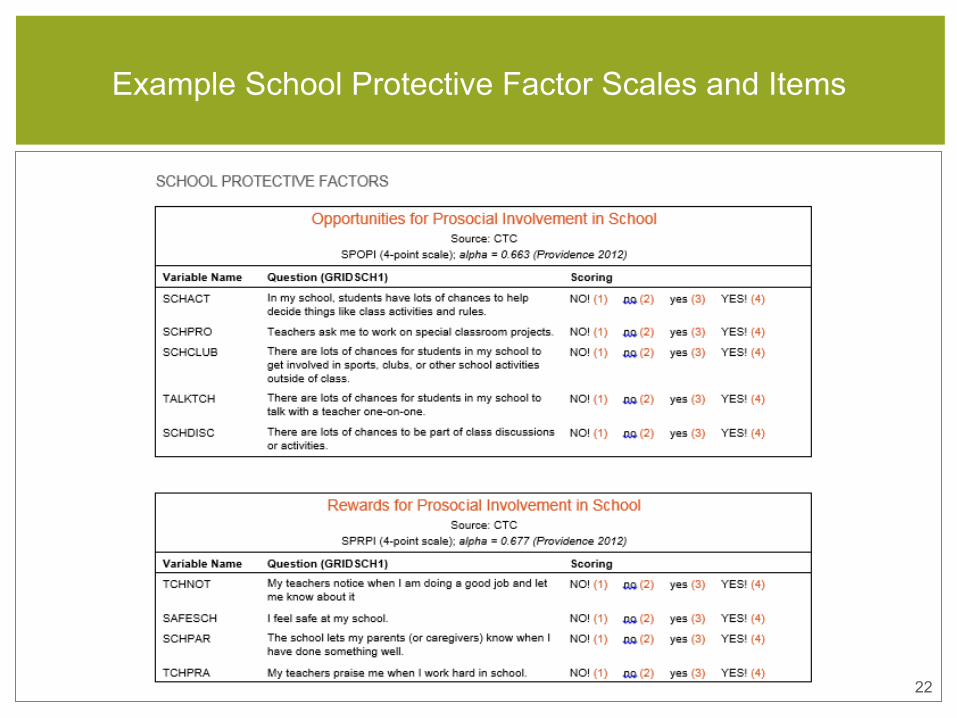
22
Example School Protective Factor Scales and Items
23
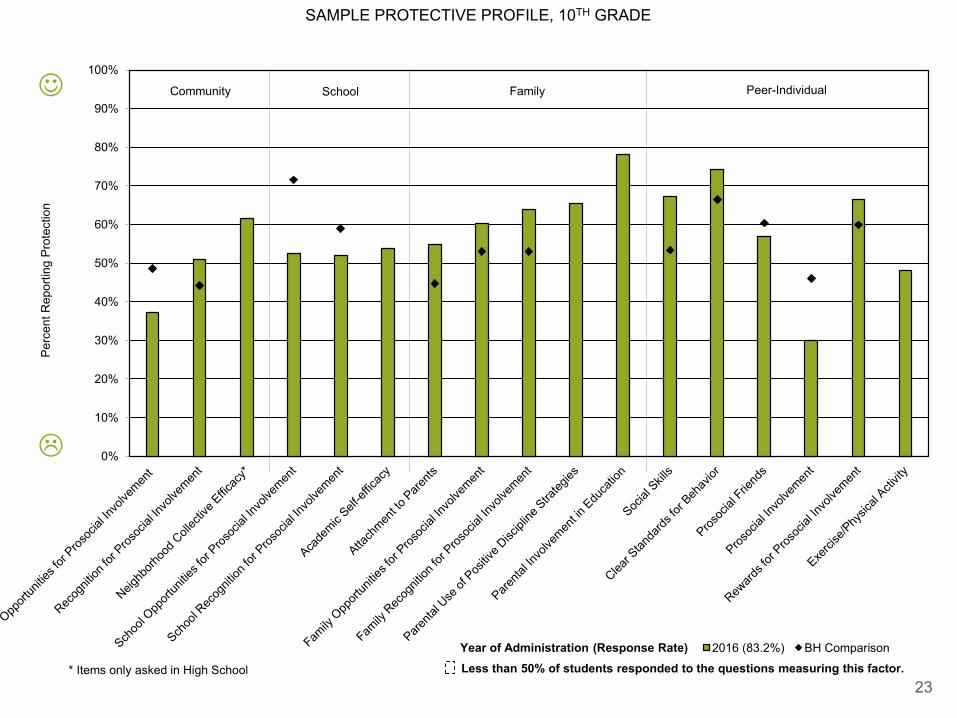
SAMPLE PROTECTIVE PROFILE, 10TH GRADE
0%
10%
20%
30%
40%
50%
60%
70%
80%
90%
100%
Per
cent
Rep
ortin
g P
rote
ctio
n
2016 (83.2%) BH Comparison
Community School Family Peer-Individual
Year of Administration (Response Rate)Less than 50% of students responded to the questions measuring this factor.* Items only asked in High School
L
J

Outcomes Measured by YES
Behaviors Prosocial behavior
Antisocial behavior (delinquency, conduct problems, gang involvement) Sexual behavior (risky sexual behavior, STI, pregnancy)
Substance use (alcohol, tobacco, other drugs)
Education Academic performance (self-reported grades)
School suspensions/expulsions
Emotional wellbeing Emotional regulation
Anxiety and depression
Suicidal thoughts
Relationships With peers, parents/caregivers and other adults
Physical health Chronic health problems (e.g., asthma, ADHD)
Sick days past month
24
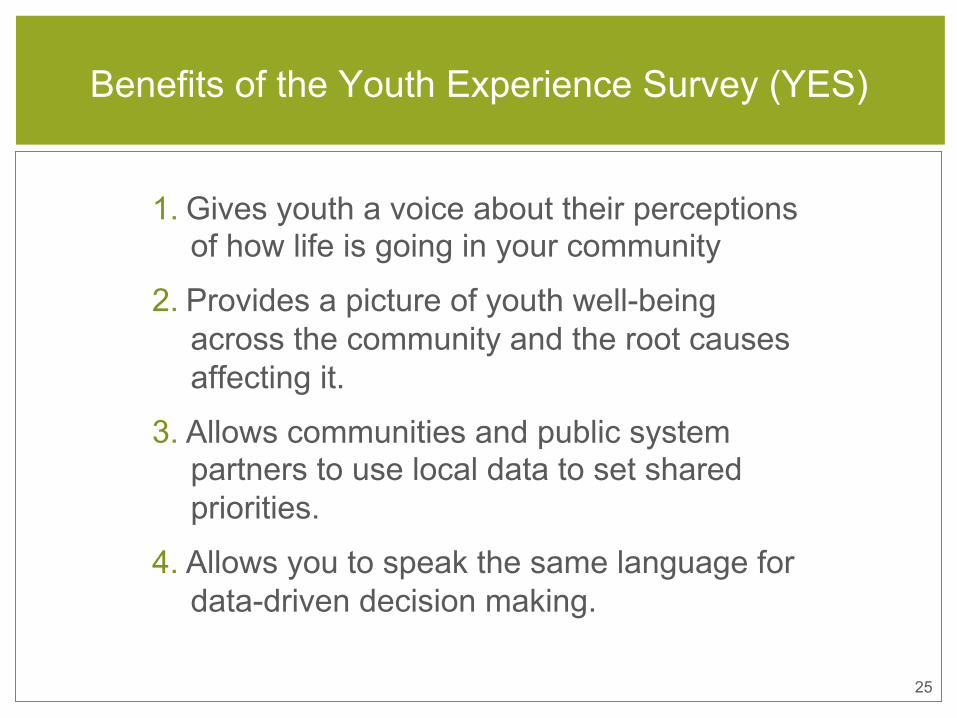
1. Gives youth a voice about their perceptionsof how life is going in your community
2. Provides a picture of youth well-beingacross the community and the root causes affecting it.
3. Allows communities and public systempartners to use local data to set shared priorities.
4. Allows you to speak the same language fordata-driven decision making.
Benefits of the Youth Experience Survey (YES)
25
26
Q. Do you gather survey data onthe risk and protective factors for young people in your community?
Check “yes” or “no” in the polling area to the right.
Answer the Poll!
Jeremiah Newell Launching the Youth Experience Survey
in Mobile
27

28
Why Evidence2Success for Mobile?
Mobile joined Evidence2Success because…
• We need to focus on needs of youth and families inour community.
• We believe in multi-agency and authentic communitycollaboration.
• We want to ensure we are using tested, provenprograms and practices.
• We must use data on strengths and needs todetermine priorities and track progress.
29
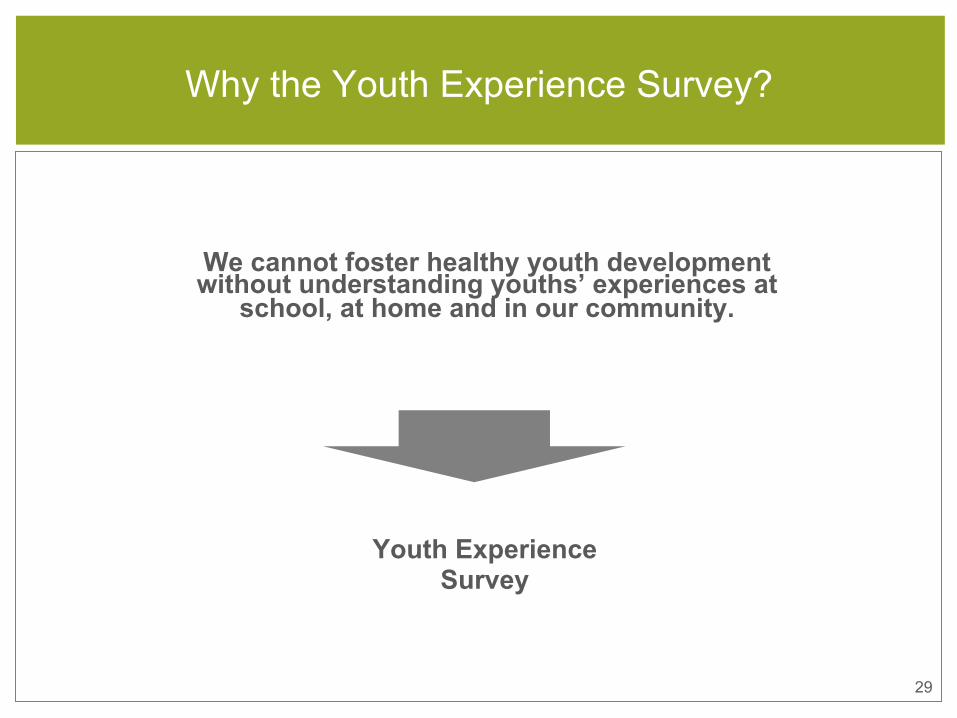
Why the Youth Experience Survey?
We cannot foster healthy youth development without understanding youths’ experiences at
school, at home and in our community.
Youth Experience Survey
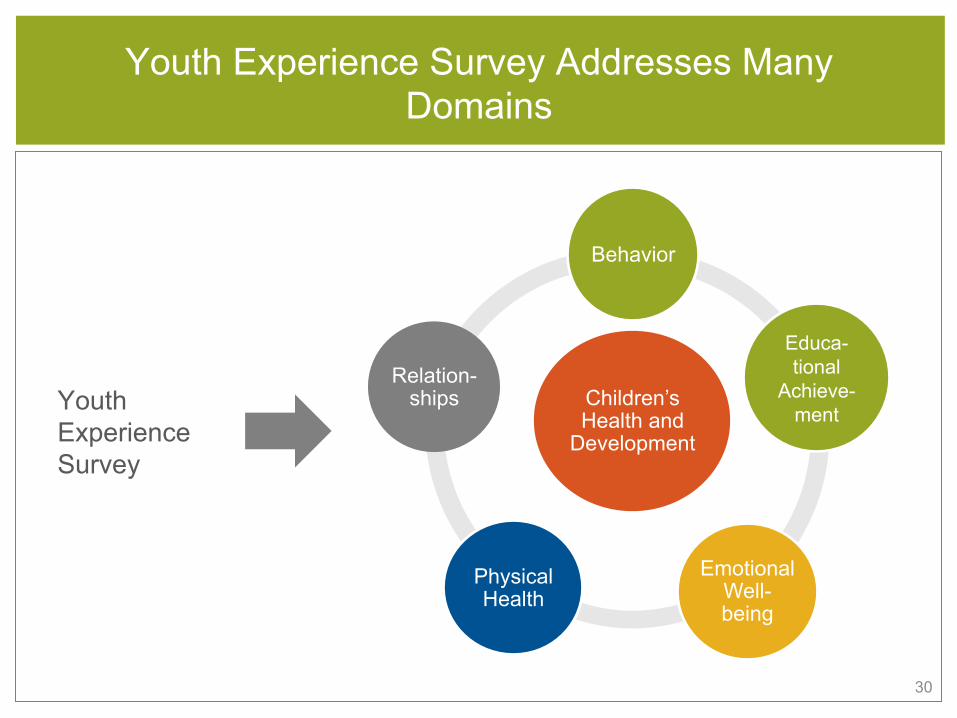
Youth Experience Survey Addresses Many Domains
30
Children’s Health and
Development
Behavior
Educa-tional
Achieve-ment
Emotional Well-being
Physical Health
Relation-ships Youth
Experience Survey
31
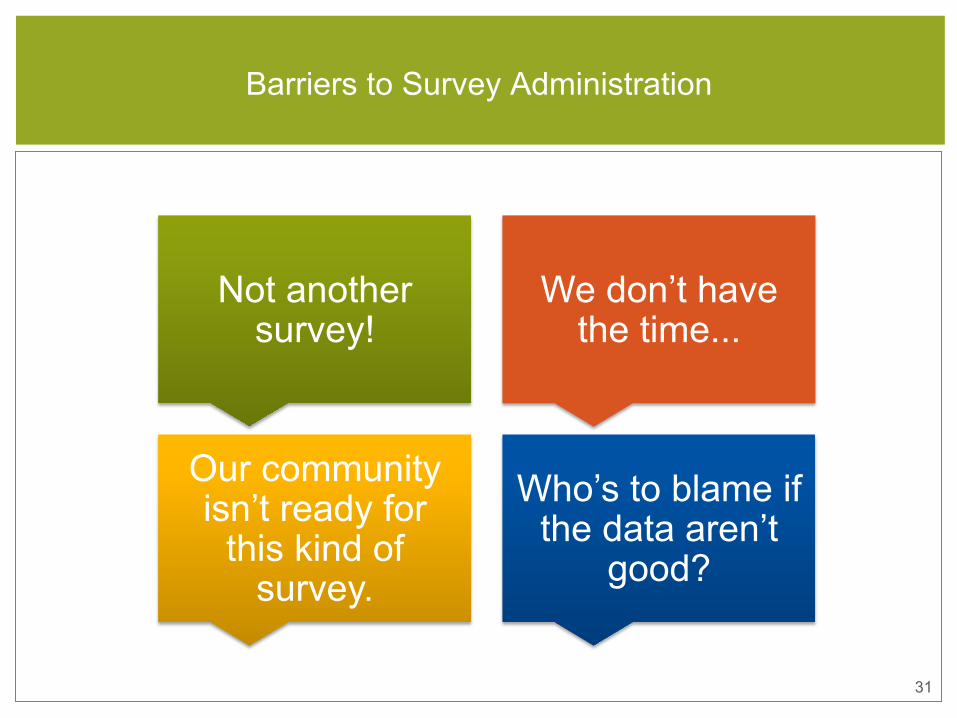
Barriers to Survey Administration
Not another survey!
We don’t have the time...
Our community isn’t ready for
this kind of survey.
Who’s to blame if the data aren’t
good?
32
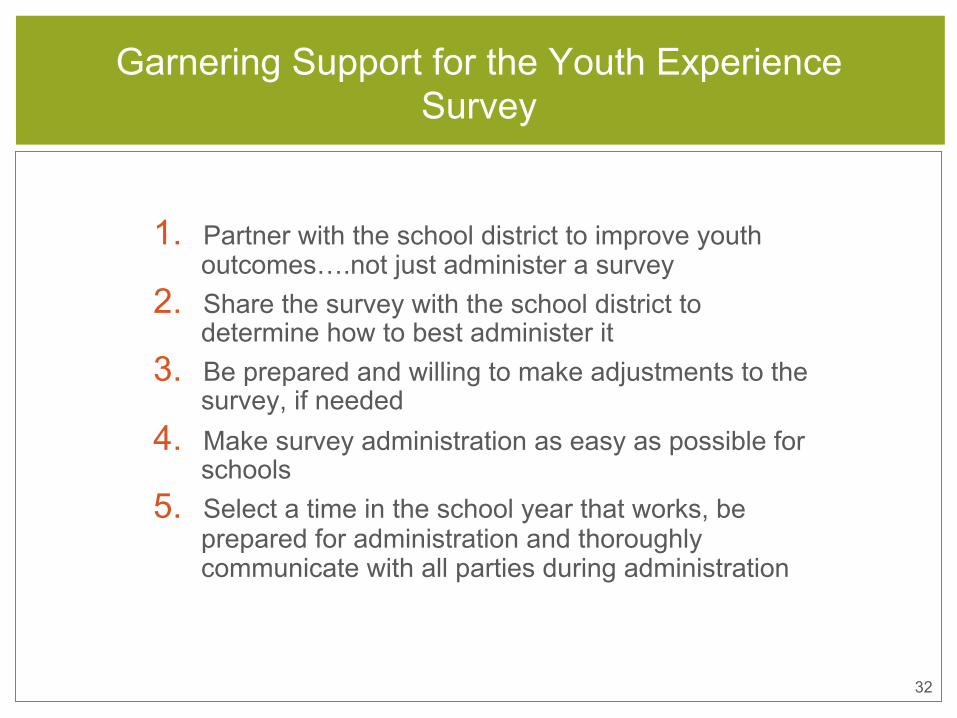
Garnering Support for the Youth Experience Survey
1. Partner with the school district to improve youthoutcomes….not just administer a survey
2. Share the survey with the school district todetermine how to best administer it
3. Be prepared and willing to make adjustments to thesurvey, if needed
4. Make survey administration as easy as possible forschools
5. Select a time in the school year that works, beprepared for administration and thoroughlycommunicate with all parties during administration
33
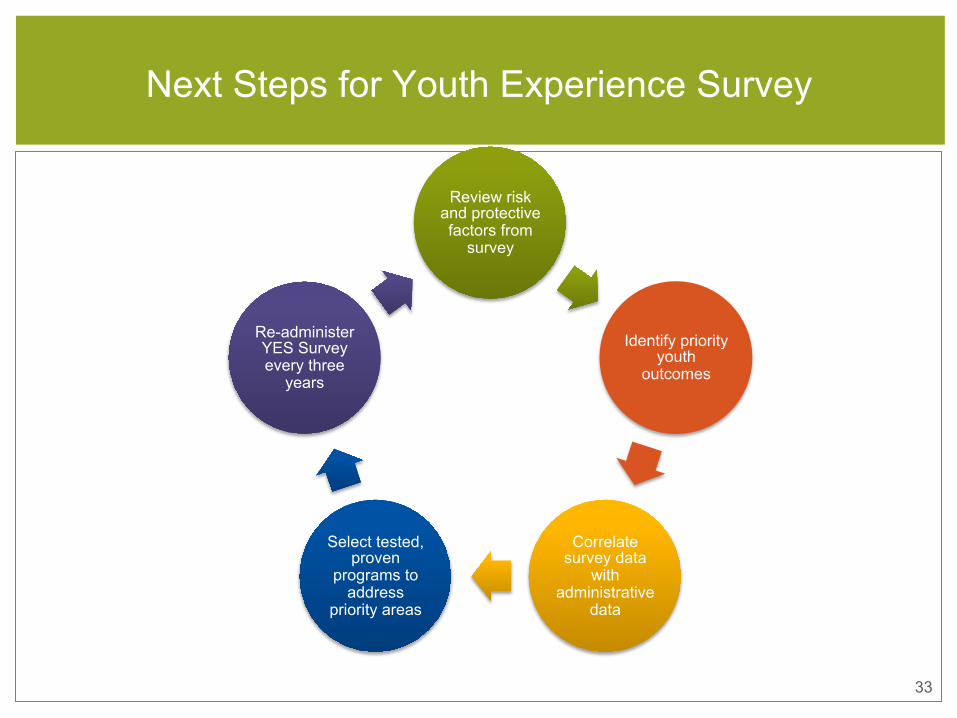
Next Steps for Youth Experience Survey
Review risk and protective factors from
survey
Identify priority youth
outcomes
Correlate survey data
with administrative
data
Select tested, proven
programs to address
priority areas
Re-administer YES Survey every three
years

34
Q. What are the benefits andbarriers you might face in trying to administer the Youth Experience Survey?
Enter your thoughts in the Chat box to your right.
Tell Us What You Think

Rebecca Boxx Continuous data collection in Providence
35
36
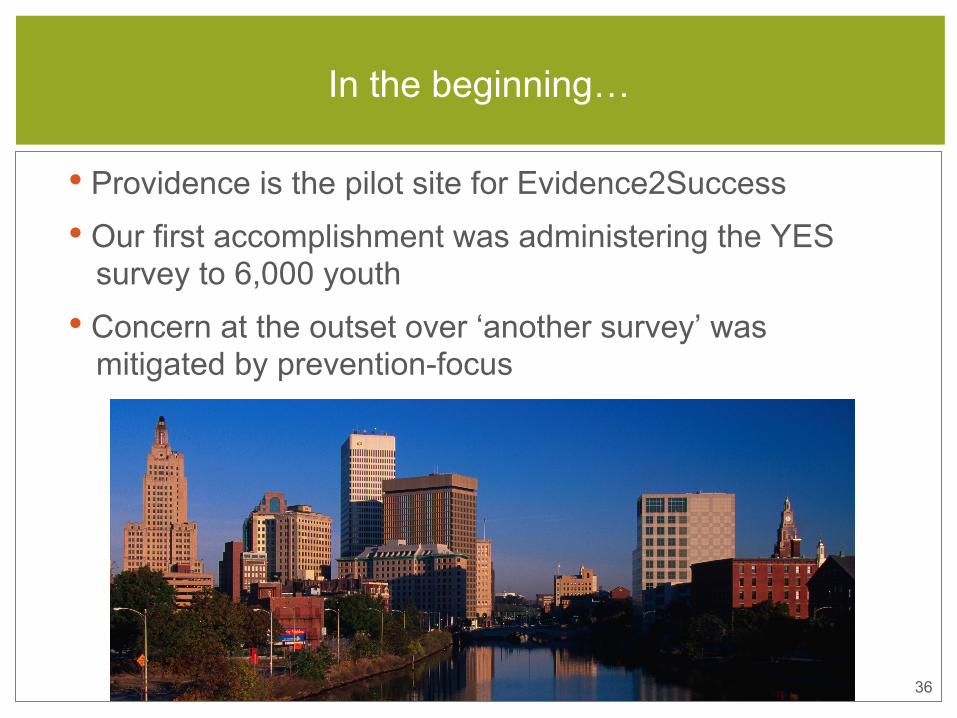
• Providence is the pilot site for Evidence2Success
• Our first accomplishment was administering the YES survey to 6,000 youth
• Concern at the outset over ‘another survey’ was mitigated by prevention-focus
In the beginning…
37
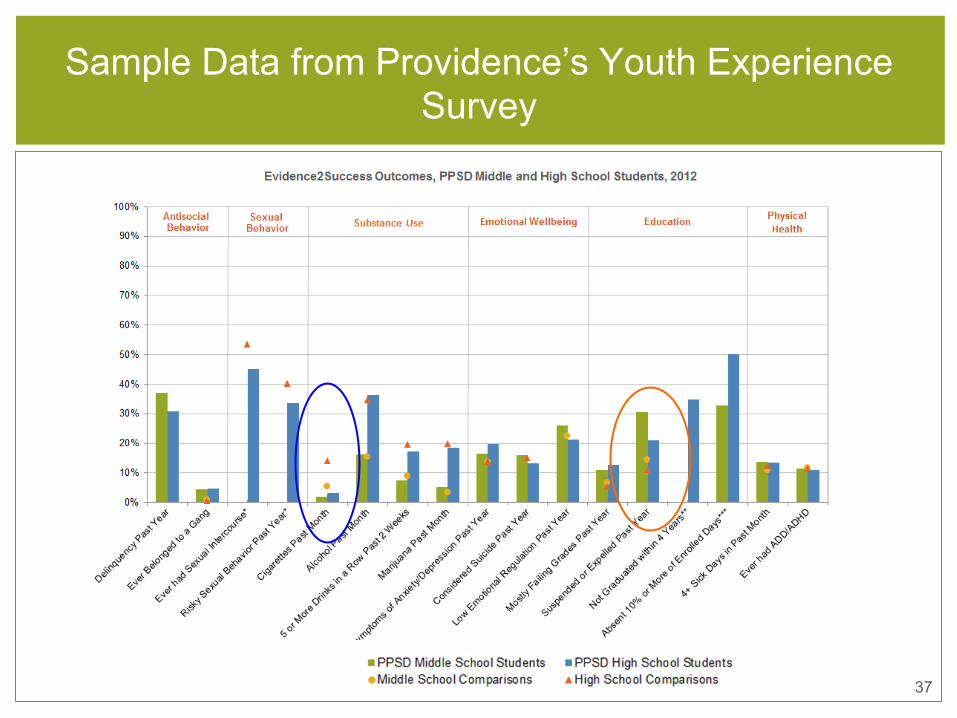
Sample Data from Providence’s Youth Experience Survey
38
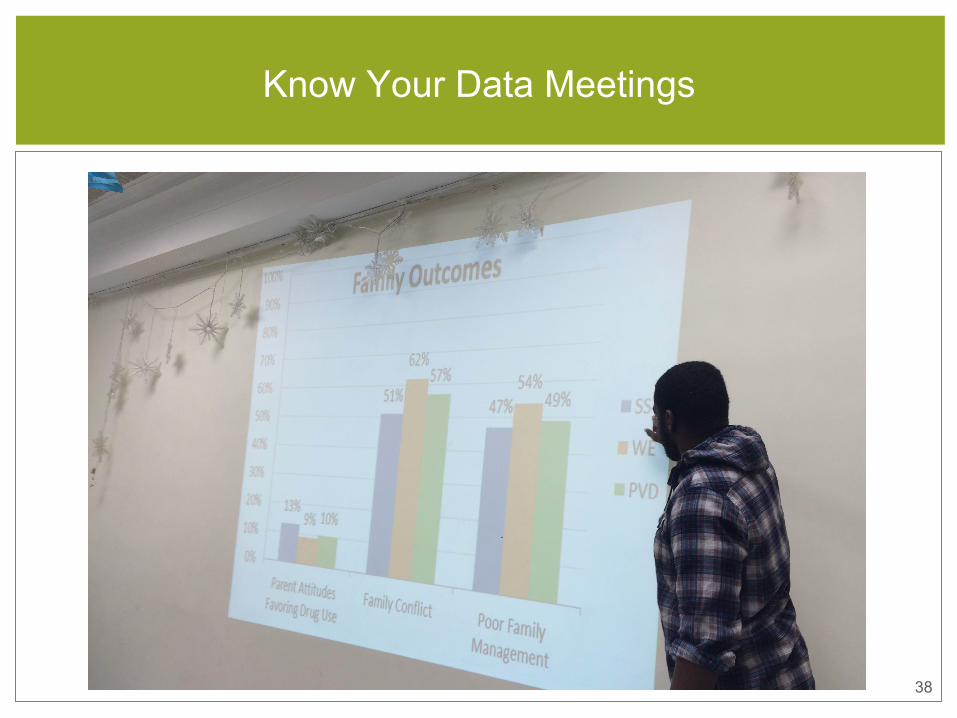
Know Your Data Meetings
39
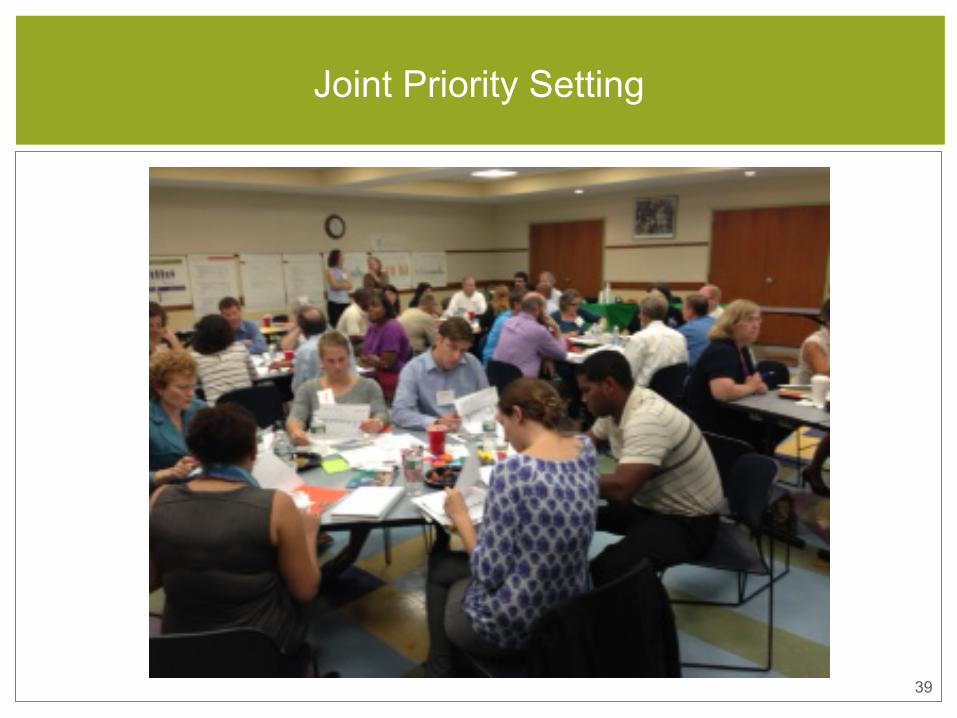
Joint Priority Setting
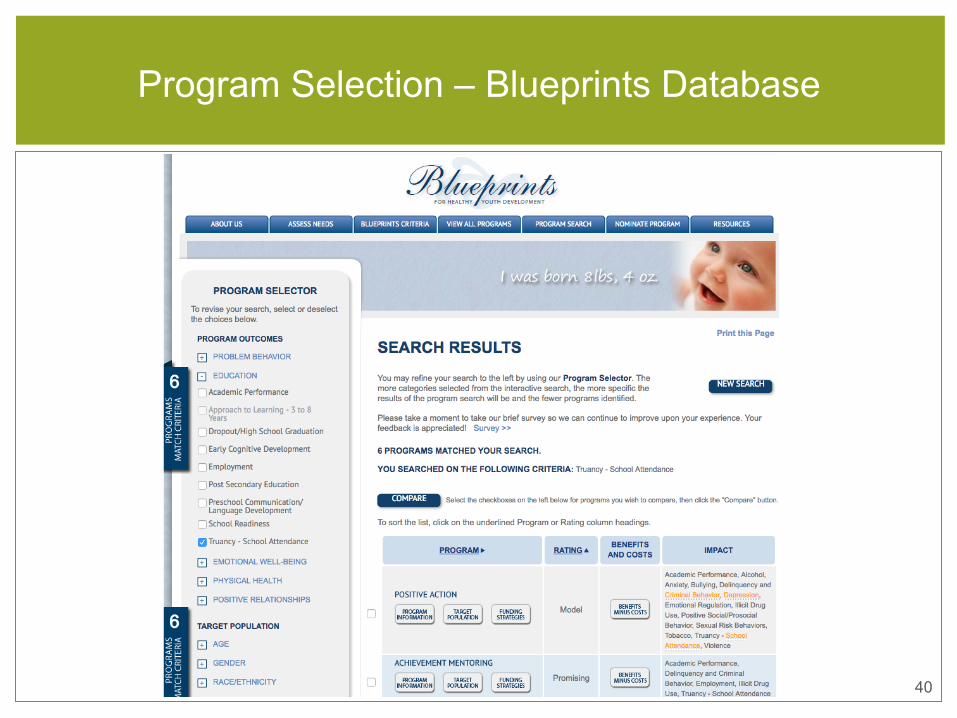
40
Program Selection – Blueprints Database
41
• We recently re-administeredthe YES Survey in March 2016!
• Using the data to make thecase for funding, allocating resources
• Continuing the practice ofpriority-setting based on voices of our youth
Gaining Traction, Ensuring Sustainability

42
Please use the Q&A function on your
screen to submit questions. A recording of this webinar will be sent to
those who registered and posted at www.aecf.org/blog.
Questions?

43
Strategic Financing for Tested, Effective Programs
2 p.m. — 3 p.m. ET
Thursday, Oct. 13, 2016
Register at http://bit.ly/29ZjEKP
For additional information after this webinar: Kate Shatzkin, [email protected]
For supplemental materials and more information about Evidence2Success tools: www.aecf.org
Next in Our Webinar Series