Embed Size (px)
Citation preview

HUMANITY DIVIDEDConfronting inequality in Developing Countries
Almudena Fernandez, Bureau for Policy and Programme Support, UNDP
Dialogue on Inequality, Istanbul
21 January 2015
1
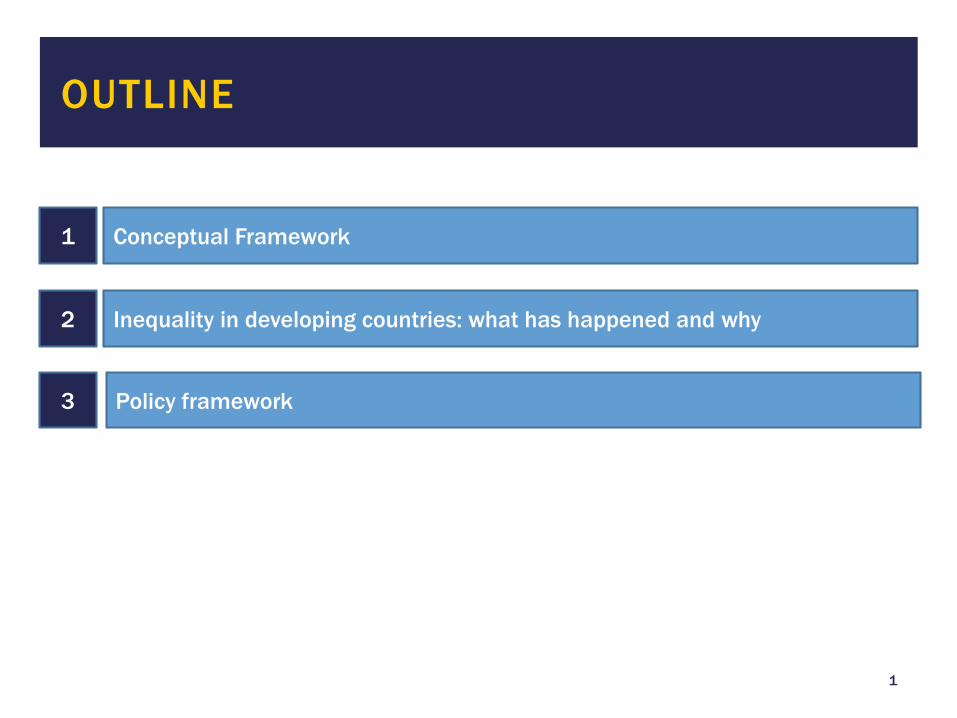
OUTLINE
1 Conceptual Framework
2 Inequality in developing countries: what has happened and why
3 Policy framework
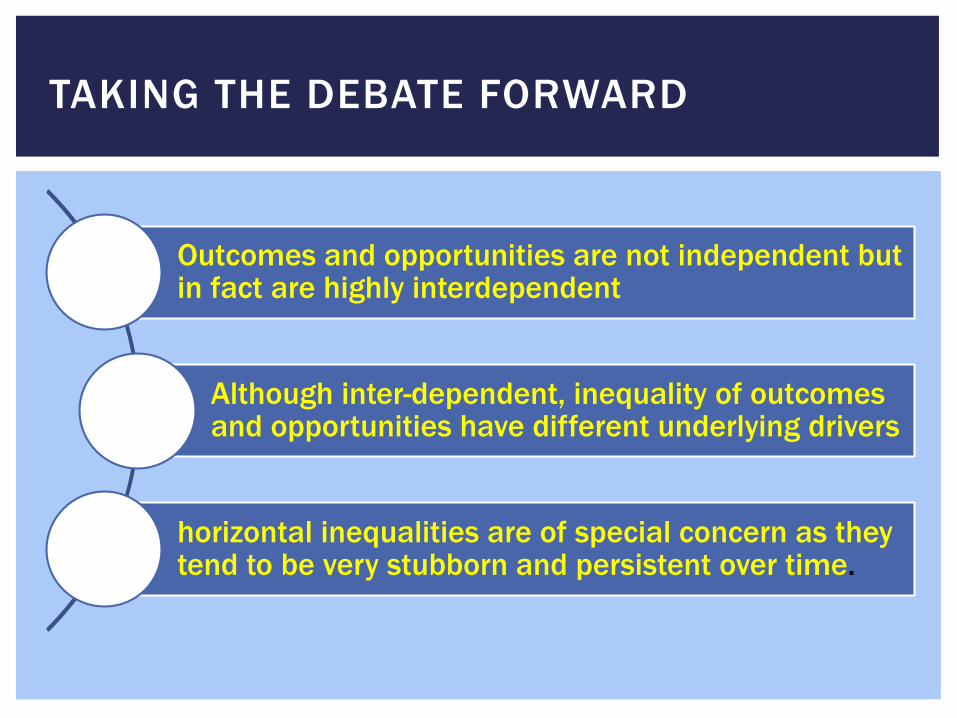
TAKING THE DEBATE FORWARD
Outcomes and opportunities are not independent but in fact are highly interdependent
Although inter-dependent, inequality of outcomes and opportunities have different underlying drivers
horizontal inequalities are of special concern as they tend to be very stubborn and persistent over time.
4/27/2015 Footer Text 4
?INEQUALITY: WHAT HAS
HAPPENED AND WHY
INCOME INEQUALITY CHANGES IN
DEVELOPING COUNTRIES
-7%
0%
13%
35%
-5%
11%
-10%
-5%
0%
5%
10%
15%
20%
25%
30%
35%
40%
Africa Arab Asia&Pacific
E&CIS LatinAmerica&Caribbean
Developingcountries
Ch
ange
%
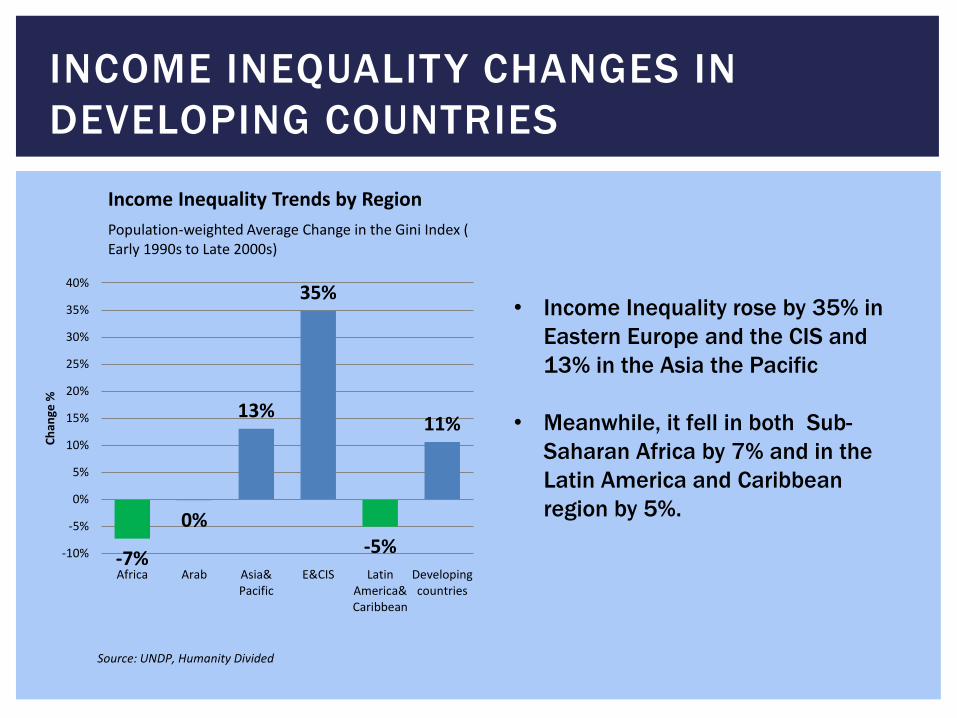
Income Inequality Trends by Region
Population-weighted Average Change in the Gini Index ( Early 1990s to Late 2000s)
• Income Inequality rose by 35% in
Eastern Europe and the CIS and
13% in the Asia the Pacific
• Meanwhile, it fell in both Sub-
Saharan Africa by 7% and in the
Latin America and Caribbean
region by 5%.
Source: UNDP, Humanity Divided
ECONOMIC PERFORMANCE AND INCOME
INEQUALITY
8%
17%
-3%
25%
21%
-7%
1%
-10%
-5%
0%
5%
10%
15%
20%
25%
30%
Low-income (Nochange)
Low-income (Movedto lower middle)
Lower-middleincome (No change)
Lower-middleincome (Moved to
upper middle)
Lower-middleincome (Moved to
high-income)
Upper-middleincome (No change)
Upper-middleincome (Moved to
high-income)
Ch
ange
%
Income Status Groups
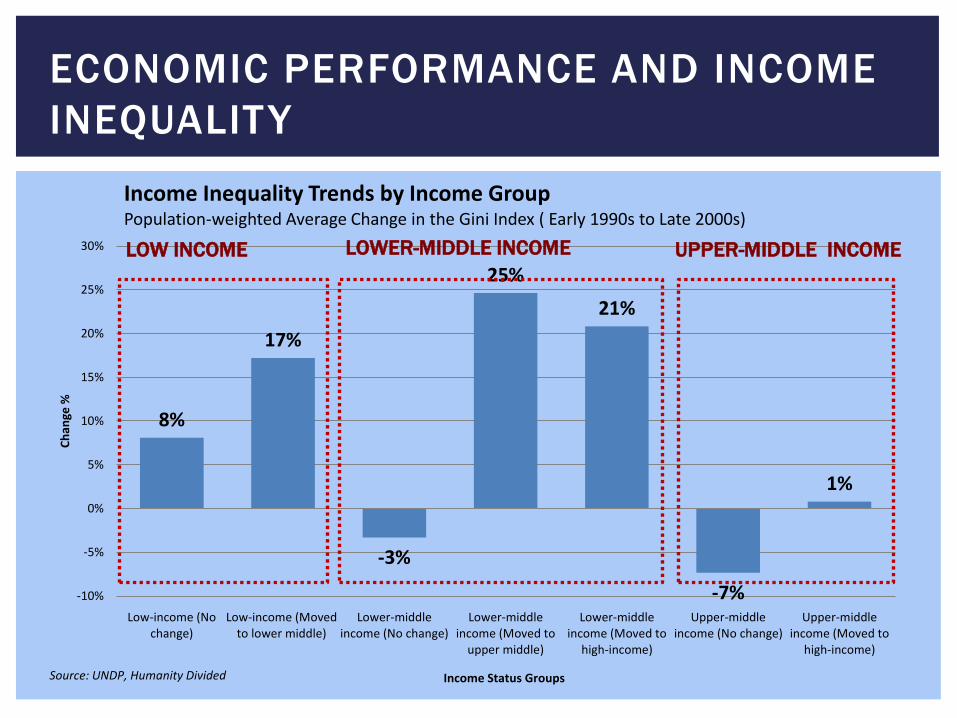
Income Inequality Trends by Income GroupPopulation-weighted Average Change in the Gini Index ( Early 1990s to Late 2000s)
Source: UNDP, Humanity Divided
LOW INCOME LOWER-MIDDLE INCOME UPPER-MIDDLE INCOME
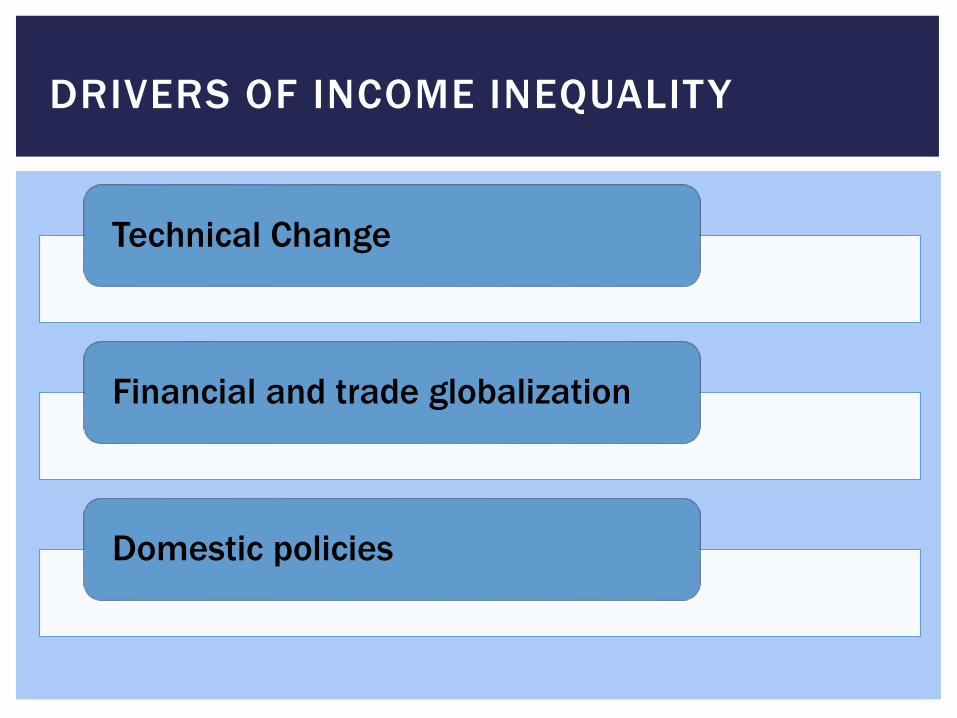
DRIVERS OF INCOME INEQUALITY
Technical Change
Financial and trade globalization
Domestic policies
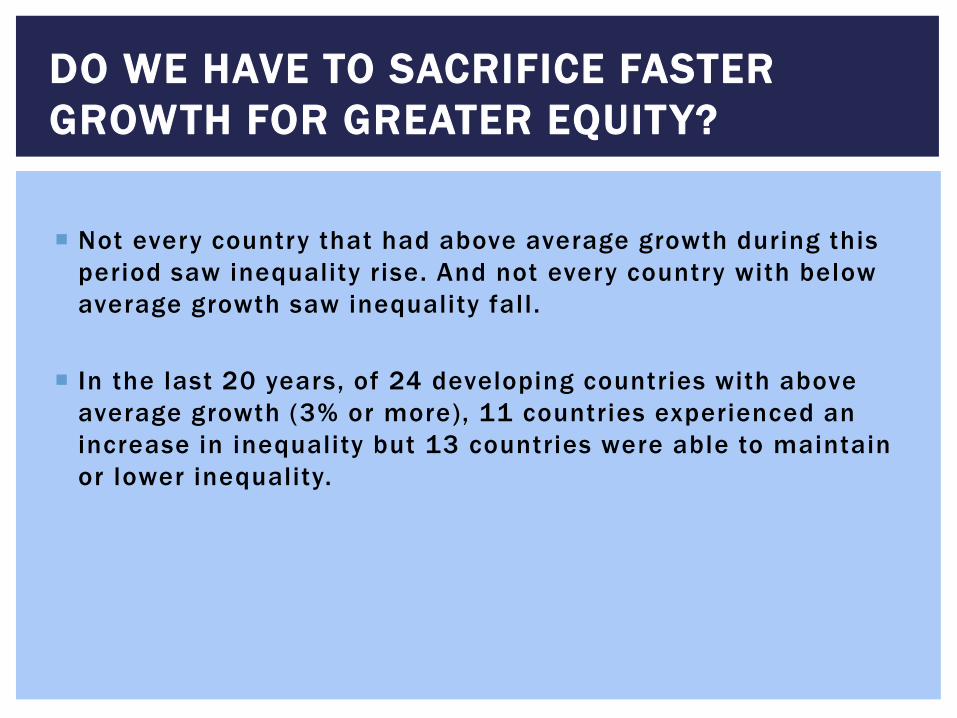
Not every country that had above average growth during this
period saw inequality rise. And not every country with below
average growth saw inequality fall.
In the last 20 years, of 24 developing countries with above
average growth (3% or more), 11 countries experienced an
increase in inequality but 13 countries were able to maintain
or lower inequality.
DO WE HAVE TO SACRIFICE FASTER
GROWTH FOR GREATER EQUITY?
THE REDISTRIBUTIVE IMPACT OF FISCAL
POLICY IN DEVELOPING COUNTRIES
-20%
-10%
0%
10%
20%
30%
40%
50%
Upper-middle Lower-middle Low
Ch
ange
in In
eq
ual
ity
(%)
Income group
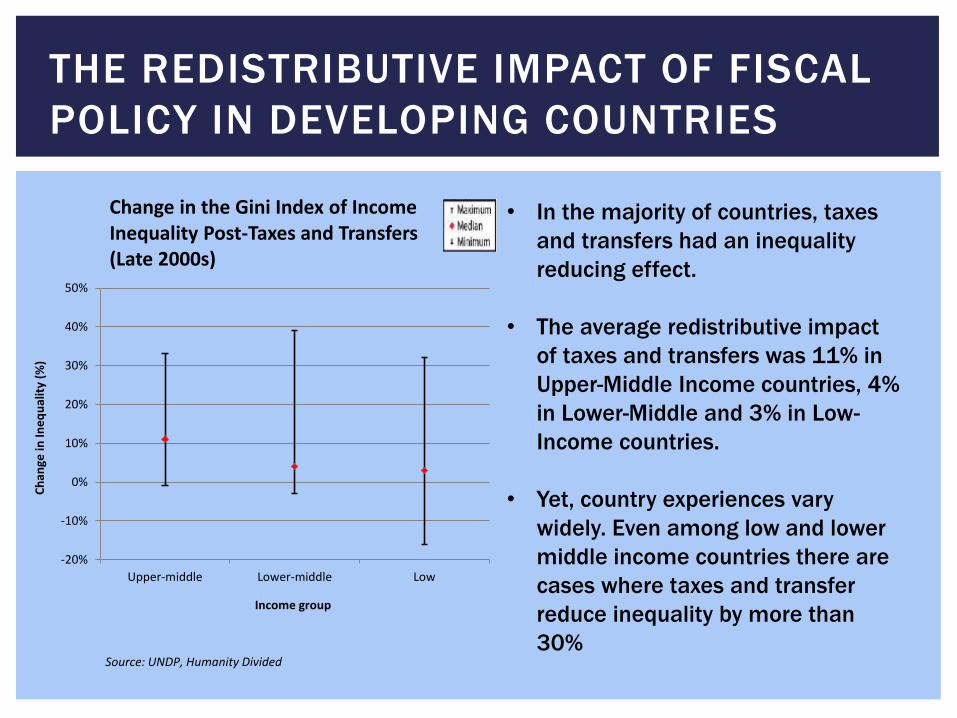
Change in the Gini Index of Income Inequality Post-Taxes and Transfers (Late 2000s)
• In the majority of countries, taxes
and transfers had an inequality
reducing effect.
• The average redistributive impact
of taxes and transfers was 11% in
Upper-Middle Income countries, 4%
in Lower-Middle and 3% in Low-
Income countries.
• Yet, country experiences vary
widely. Even among low and lower
middle income countries there are
cases where taxes and transfer
reduce inequality by more than
30%Source: UNDP, Humanity Divided
INCOME INEQUALITY IS RELATED TO
INEQUALITY IN WELL-BEING
0.0
1.0
2.0
3.0
4.0
5.0
6.0
7.0
8.0
9.0
10.0
Sub-SaharanAfrica
Middle East South Asia East Asia LatinAmerica &Caribbean
Rat
io o
f o
utc
om
es
by
qu
inti
le
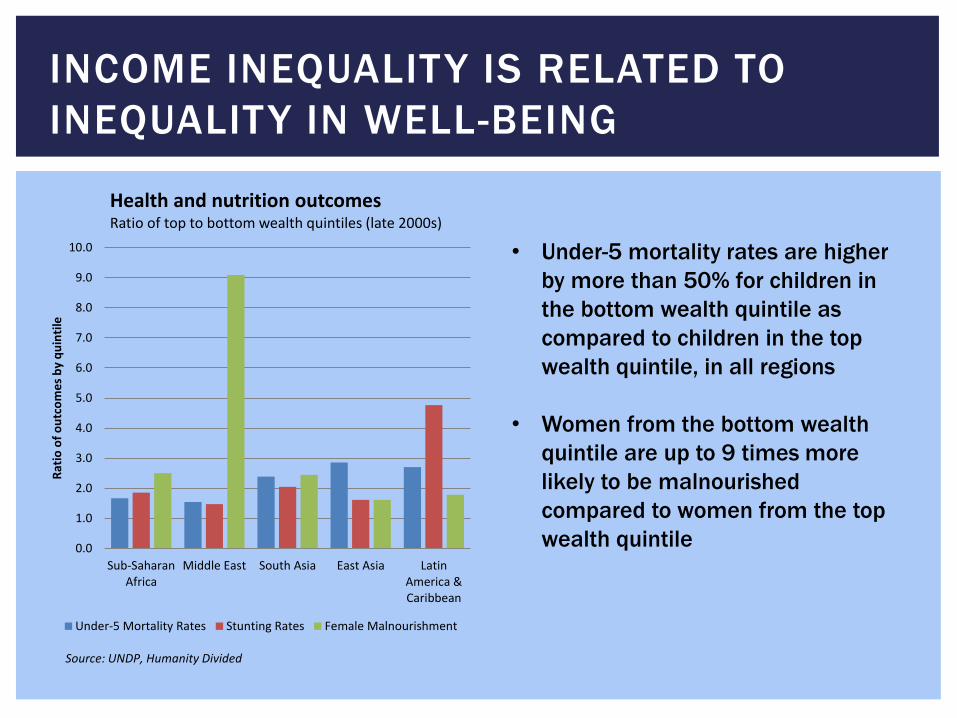
Health and nutrition outcomesRatio of top to bottom wealth quintiles (late 2000s)
Under-5 Mortality Rates Stunting Rates Female Malnourishment
• Under-5 mortality rates are higher
by more than 50% for children in
the bottom wealth quintile as
compared to children in the top
wealth quintile, in all regions
• Women from the bottom wealth
quintile are up to 9 times more
likely to be malnourished
compared to women from the top
wealth quintile
Source: UNDP, Humanity Divided
• Gender inequality has declined for some indicators.
• The F/M ratio of total years of education increased,
on average, from 82% in 1990 to 91% in 2010.
• The global ratio of F/M employment rates rose from
62% in 1990 to 70% in 2010.
• Exception:
• Worsening job segregation in industrial sector.
• Wage gaps remain large and widening in many
countries.4/27/2015 Footer Text 11
GENDER INEQUALITY
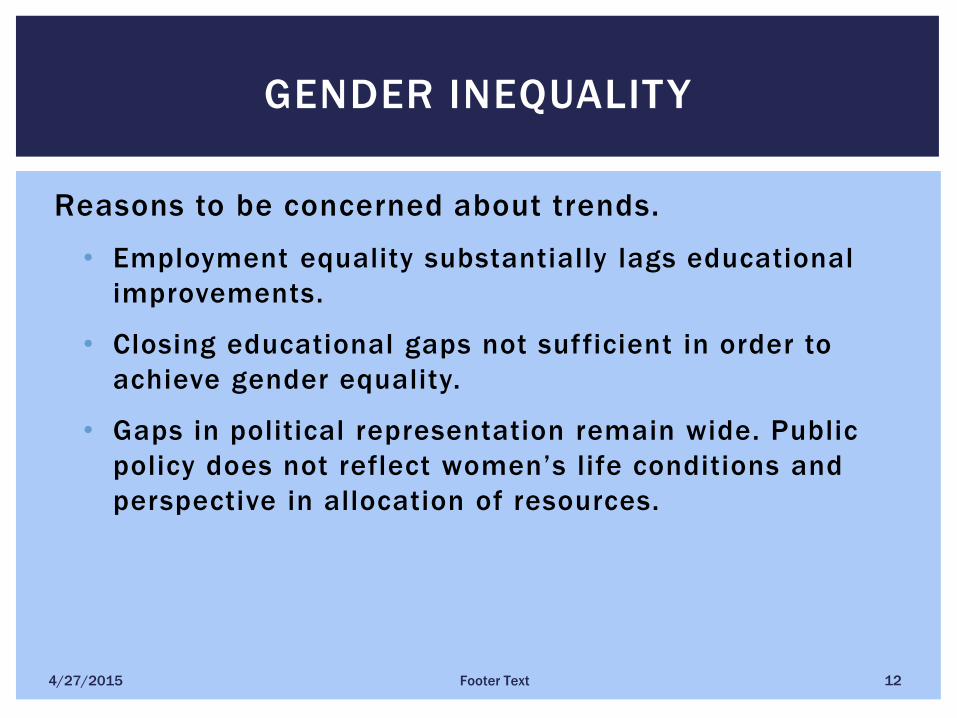
Reasons to be concerned about trends.
• Employment equality substantially lags educational
improvements.
• Closing educational gaps not sufficient in order to
achieve gender equality.
• Gaps in political representation remain wide. Public
policy does not reflect women’s life conditions and
perspective in allocation of resources.
4/27/2015 Footer Text 12
GENDER INEQUALITY

4/27/2015 Footer Text 13
?HOW TO ADDRESS INEQUALITY

A COMPREHENSIVE POLICY FRAMEWORK
You can download the report at:
http://on.undp.org/vLKqj
4/27/2015 Footer Text 15
THANK YOU