Embed Size (px)
Citation preview
Journal of Social Change 2017, Volume 9, Issue 1, Pages 4–31 ©Walden University, LLC, Minneapolis, MN DOI: 10.5590/JOSC.2017.09.1.02
Please address queries to: Laura Musikanski, Happiness Alliance. Email: [email protected]
Happiness Index Methodology
Laura Musikanski
Happiness Alliance
Scott Cloutier
Arizona State University
Erica Bejarano
Arizona State University
Davi Briggs
Arizona State University
Julia Colbert
Arizona State University
Gracie Strasser
Arizona State University
Steven Russell
Arizona State University
The Happiness Index is a comprehensive survey instrument that assesses happiness, well-
being, and aspects of sustainability and resilience. The Happiness Alliance developed the
Happiness Index to provide a survey instrument to community organizers, researchers, and
others seeking to use a subjective well-being index and data. It is the only instrument of its
kind freely available worldwide and translated into over ten languages. This instrument can
be used to measure satisfaction with life and the conditions of life. It can also be used to
define income inequality, trust in government, sense of community and other aspects of well-
being within specific demographics of a population. This manuscript documents the
development the Happiness Index between 2011 and 2015, and includes suggestions for
implementation.
Keywords: survey, questionnaire, subjective well-being indicators, sustainability indicators,
happiness, well-being, quality of life, beyond GDP, community indicators
Musikanski et al., 2017
Journal of Social Change 5
Introduction
The Happiness Alliance is a nonprofit organization envisioning a world where all beings can thrive,
founded on a mission to improve societal well-being by increasing public understanding and
appreciation of factors that lead to life satisfaction, resilience, and sustainability. The mission of the
organization is based on evidence that when people and society implement happiness measures then
the value of individual happiness, the well-being of others, and concern for the sustainability of the
planet increase (Cloutier, Jambeck, & Scott, 2014; Pfeiffer & Cloutier, 2016; Zidanšek, 2007). The
increase is reflected via changed mindsets, decisions, and behaviors that improve personal and
community happiness, ecological sustainability, and public policy (Frey & Stutzer, 2011). The
Happiness Alliance’s mission is implemented through: (1) the provision of social engagement tools
and resources; (2) the sharing of general knowledge of economic, social, environmental, and
governance indicators; and (3) the support for grassroots activism. Although the Happiness Alliance
initially used the 2010 Greater Victoria Well-Being Survey as its evaluative tool, in 2011, the
organization developed its own Happiness Index (Victoria Foundation, 2010; Happiness Alliance,
2014b), modeled after the Kingdom of Bhutan’s Gross National Happiness Index (GNHI)—an
alternative measure of progress to the frequently used gross domestic product (GDP).
The Concept of Gross National Happiness
The concept of gross national happiness (GNH) was developed of by the Kingdom of Bhutan in
response to pressures to use Gross National Product as the primary goal and metric for the
government (Ura et. al, 2012). In Bhutan, GNH is measured using the GNHI. The Bhutanese Gross
National Happiness Commission (n.d.), composed of the Prime Minister, Secretaries of all ministries
as well as other high level officials, has the mandate to “ensure all development policies and plans
are formulated and implemented in line with the principles of GNH” (p. 5). In 2015, the government
issued its third GNH report, Compass Towards a Just and Harmonious Society (The Center for
Bhutan Studies & GNH Research, 2015), finding that aspects of well-being that had improved
included mental well-being, physical health, youth literacy, participation in community events
countered by increases in working hours, satisfaction with government performance, and sense of
belonging. The sense in Bhutan is that the country’s development has been “comparatively
successful. Partly…due to the concept of GNH…” (p. 42).
The Concept of the Happiness Index
The Happiness Alliance took inspiration from Bhutan and followed suit. Between 2011 and 2016, the
Happiness Alliance’s survey instrument was called the Happiness Index and the GNHI
interchangeably. It was issued with a Creative Commons Attribution noncommercial
(https://creativecommons.org/licenses/) license; meaning users could use it for any noncommercial
purposes as long as they credit the Happiness Alliance.
Domains of Happiness
The Happiness Index measures life satisfaction, the feeling of happiness, and other happiness
domains: psychological well-being, health, time balance, community, social support, education, arts
and culture, environment, governance, material well-being, and work (Happiness Alliance, 2014c).
The qualities measured in the domains are as follows:
Musikanski et al., 2017
Journal of Social Change 6
● Psychological Well-Being: optimism, senses of purpose and of accomplishment; ● Health: energy level and ability to perform everyday activities; ● Time Balance: enjoyment, feeling rushed, and sense of leisure; ● Community: sense of belonging, volunteerism, and sense of safety; ● Social Support: satisfaction with friends and family, feeling loved, and feeling lonely; ● Education, Arts, and Culture: access to cultural and educational events and
diversity; ● Environment: access to nature, pollution, and conservation; ● Governance: trust in government, sense of corruption, and competency; ● Material Well-Being: financial security and meeting basic needs; and ● Work: compensation, autonomy, and productivity. (Happiness Alliance, 2014c)
Intended Uses of the Happiness Index
The Happiness Index is a tool for the use of researchers, community organizers and policy makers
seeking to understand and enhance individual happiness, community well-being, social justice,
economic equality, and environmental sustainability. The index was formed with the intent to
promote social change by making the survey instrument and data freely available to community
organizers, educators, researchers, students, organizations, government, and more. The index is
unique in that it is the only widely comprehensive index available for free online that survey takers
to access their own scores in comparison the entire data set, while also allowing users to customize
the tool for a target population, add their own questions to the survey instrument, and readily access
data for their own sample as well as comparison data to the entire data set.
Basis for Practical Utility The aims of this resource are to (a) explain how the Happiness Index was created and refined in
iterative rounds, and (b) describe how the Happiness Index can contribute to a new paradigm of
sustainability, social justice, and happiness. A robust statistical analysis of the Happiness Index over
time is in consideration for a future paper. However, with over 200 applications of the index to
groups to date, and over half a decade of development, it is reasonable to deem that the index has
passed the rigor of practical utility. The Happiness Alliance has worked with many of these
practitioners and academics to apply the index since 2011, and has integrated feedback to improve
the tool through iterations. Users of the survey instrument, including scholars, policy makers and
community organizers, generally agree that the index passes face validity and is effective in
measuring happiness in communities and for groups, as intended.
Literature Review
Historically, governments have used GDP as a primary indicator of national well-being and growth
(Ovaska & Takashima, 2006). This is an incomplete strategy due to the disconnect between GDP and
personal income, and the gap between personal income and happiness. Not only can a country’s GDP
grow while per capita income declines for the vast majority of a population (Layard, 2005) but
personal income is only one factor of personal happiness and well-being (Diener, Tay & Oishi, 2013).
Other happiness factors include, but are not limited to: personal relationships, economic freedom,
political freedom, health, education, and income distribution (Ovaska & Takashima, 2006); although
these factors vary between individuals and across cultures. Several countries have started to
measure happiness in addition to or in lieu of GDP (Musikanski & Polley, 2016).
Musikanski et al., 2017
Journal of Social Change 7
Happiness and the Economy
Generally, GDP cannot distinguish when economic activities have a positive or negative impact on
well-being (Ovaska & Takashima, 2006). For example, GDP does not take into account the hidden
costs of economic development, such as inflation and unemployment, and an overemphasis of GDP
diminishes the value of important well-being factors such as natural capital, knowledge, health, and
social capital (Frank, 1997; Ovaska & Takashima, 2006). Measuring happiness, therefore, should not
only consider observable objective well-being measures (e.g., health and socioeconomic status), but
also subjective well-being measures, such as domain satisfaction and quality of life. Easterlin (1974,
1995, 2001) argues that in the long-term monetary gains have relatively small effects on quality of
life.
Finally, as people may be the best judges of their own happiness, subjective well-being is measured
by asking individuals to assess their happiness by answering a single question or a multiple-item
survey (Frey & Luechinger, 2007; Diener & Pavot, 1993). The Happiness Alliance suggests that a
more holistic way to measure progress for governments and communities is by using a nonmonetary,
multidimensional approach that measures satisfaction and advancements across various life
domains, including economy, governance, environment, community, social support, culture, learning,
health, time-balance, and work. The Happiness Alliance considers the Happiness Index a holistic
measure, similar to alternative measures of progress employed by the Happy Planet Index and
GNHI (Marks, Abdallah, Simms, & Thompson, 2006; Ura, Alkire, Zangmo, & Wangdi, 2012).
The Happiness Index Development
While the use of a happiness metric is, in itself, a means to influence social change, the validity and
reliability of the survey and collected data is equally important. After working in communities, with
researchers, policy makers and others, the Happiness Alliance decided to publish this article as an
explanation of the development processes behind the Happiness Index. The goal is to inform users of
the index on the validity and reliability of the instrument and data collected to date. It is worth
reiterating here that the Happiness Alliance intends to undertake more robust statistical analyses in
future studies. But, the Happiness Alliance contends that the index, as it stands currently, has
established face validity through a cocreative iterative development process, spanning several years
of research by multiple academic and professional institutions.
The development process of the Happiness Index has been guided by the Happiness Alliance’s goals
of supporting positive social change, the quest for social justice, enhanced individual and societal
happiness and a sustainable future as well as governmental adoption of wider measures of well-
being to guide public policy. Modifications to the Happiness Index have been undertaken through an
organic and responsive process working with communities and community organizers since 2010.
The survey instrument is evolving, with core questions that do not change, much like the European
Social Survey (2006) and other instruments. The index is intended to be easily administered, quickly
completed by survey takers, while validly reflecting the main constructs that influence happiness. It
is also intended to produce data that community organizers and researchers can use to contribute to
a transformation of the economic and social paradigm. Examples of how researchers and community
organizers have used the survey instrument to gather data, analyzed and reported the data, and
used it to educate the public and inform policy can be seen on the Organization for Economic
Cooperation and Development’s Wikiprogress page dedicated to the Happiness Alliance
(http://wikiprogress.org/data/organization/happiness-alliance).
Musikanski et al., 2017
Journal of Social Change 8
Development Overview
The Happiness Alliance hired the Personality and Well-Being Lab at San Francisco State University
to develop the Happiness Index in 2011, which resulted in Round 1 of the instrument. The
subsequent rounds were undertaken by staff and advisors to the Happiness Alliance. The following
description of the development phases of the survey instrument concisely explains the process of the
survey and index development to date.
The development procedures are described so survey instrument users understand the history of
data collected by the Happiness Alliance and can use the information when analyzing data. The
information may serve researchers seeking to understand the historical context of their own data
collection and to compare their data to other collected by the Happiness Index and by other survey
instruments. The description of the development procedures also ensures the reliability and validity
of the survey instrument.
Data Sources The majority of the data collected by the Happiness Index are from convenience sampling that began
in January of 2011. A small portion of the data (less than 5%) was collected through random
samples. Most survey takers learned of the Happiness Index through word of mouth, media, or from
community organizers who took trainings from the Happiness Alliance on how to use the survey
instrument in their community, company, city, or state. The majority of survey takers come from the
United States (over 70%), with the balance from other countries. Over 85% of surveys are taken in
English, with the rest in certified translations of the survey instrument in Spanish, Chinese,
Japanese, Korean, French, Brazilian Portuguese, Italian, and other languages. Between 2011 and
2016, over 65,000 responses had been gathered at a rate of about 1,000–1,500 responses per month.
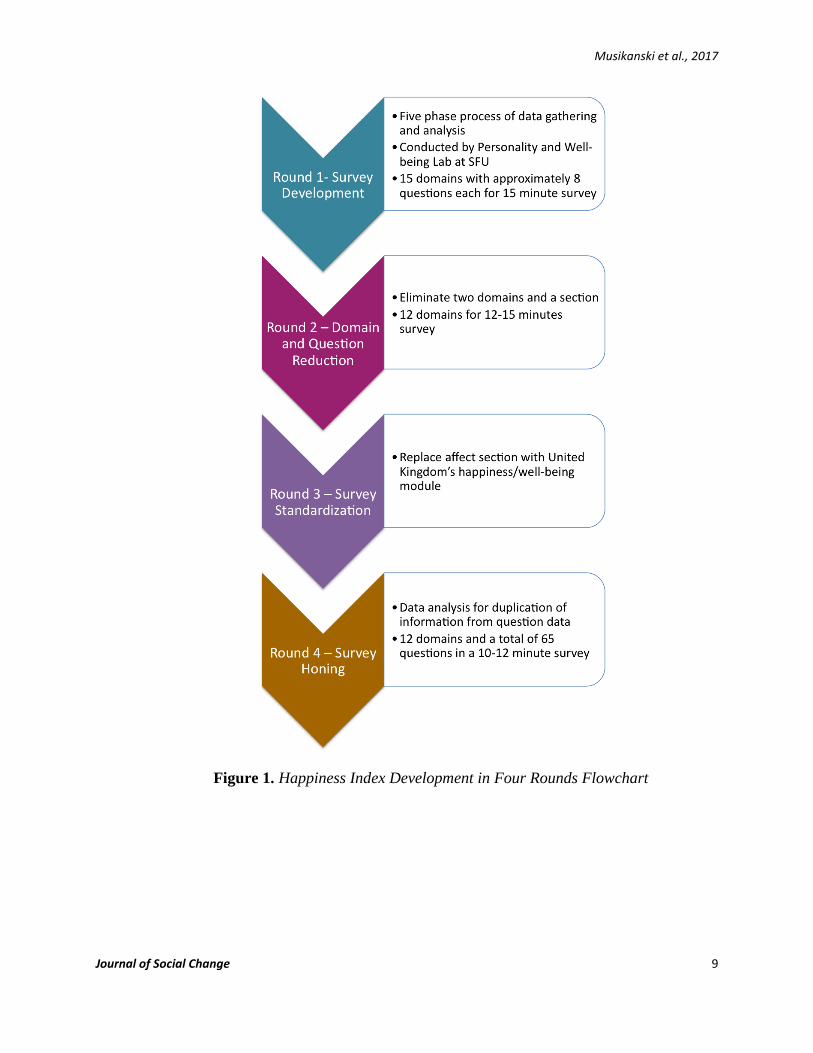
Survey Development Rounds The survey instrument was developed in four distinct rounds (see Figure 1).
Rounds of Development Round 1 of the Happiness Index assessed the relevance of the Bhutanese kingdom GNHI domains to
happiness, well-being, and quality of life. The GNHI domains include psychological well-being,
health, community vitality, living standard, governance, environment diversity, culture, education,
and time use (Ura et al., 2012). Round 2 focused on decreasing the time required to complete the
survey. Rounds 3 and 4 both focused on standardizing subjective well-being indicators and reducing
the survey length and time of completion.
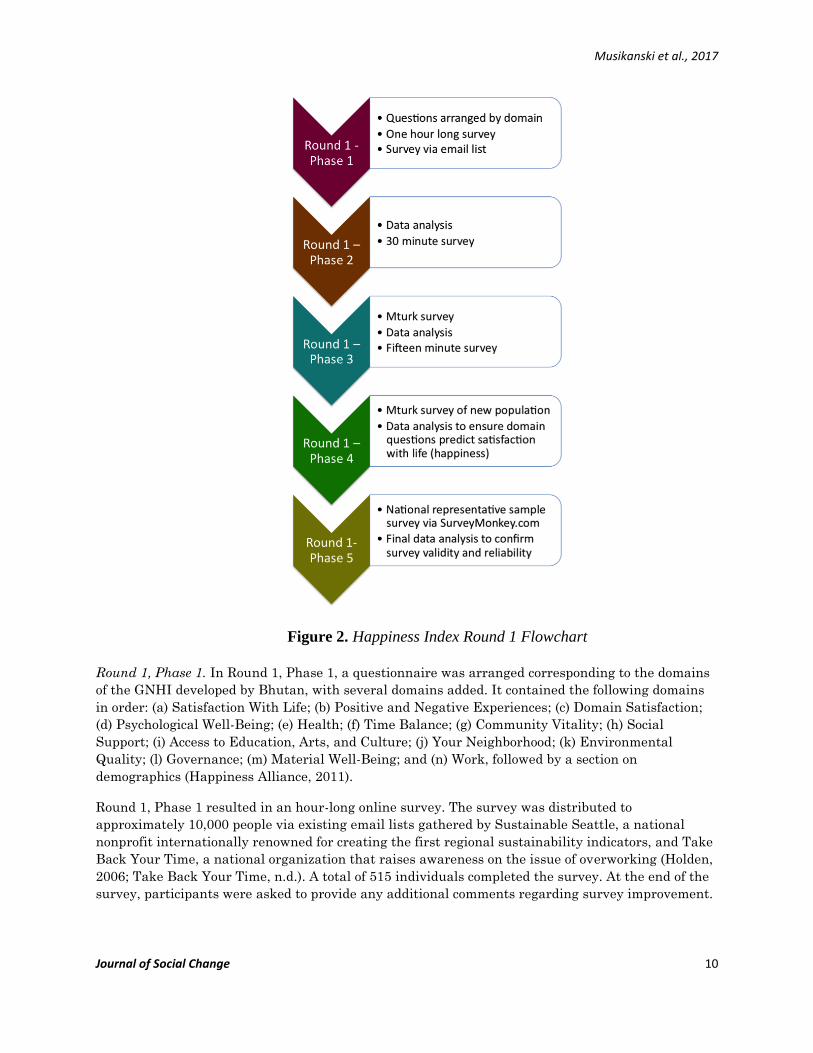
Round 1: Survey Development Round 1 of the survey was completed in five distinct phases (see Figure 2).
Musikanski et al., 2017
Journal of Social Change 9
Figure 1. Happiness Index Development in Four Rounds Flowchart
Musikanski et al., 2017
Journal of Social Change 10
Figure 2. Happiness Index Round 1 Flowchart
Round 1, Phase 1. In Round 1, Phase 1, a questionnaire was arranged corresponding to the domains
of the GNHI developed by Bhutan, with several domains added. It contained the following domains
in order: (a) Satisfaction With Life; (b) Positive and Negative Experiences; (c) Domain Satisfaction;
(d) Psychological Well-Being; (e) Health; (f) Time Balance; (g) Community Vitality; (h) Social
Support; (i) Access to Education, Arts, and Culture; (j) Your Neighborhood; (k) Environmental
Quality; (l) Governance; (m) Material Well-Being; and (n) Work, followed by a section on
demographics (Happiness Alliance, 2011).
Round 1, Phase 1 resulted in an hour-long online survey. The survey was distributed to
approximately 10,000 people via existing email lists gathered by Sustainable Seattle, a national
nonprofit internationally renowned for creating the first regional sustainability indicators, and Take
Back Your Time, a national organization that raises awareness on the issue of overworking (Holden,
2006; Take Back Your Time, n.d.). A total of 515 individuals completed the survey. At the end of the
survey, participants were asked to provide any additional comments regarding survey improvement.
Musikanski et al., 2017
Journal of Social Change 11
Round 1, Phase 2. Round 1, Phase 2 consisted of a factor analysis, corrected item-total correlation
analysis, reliability analyses, convergent correlation analysis, and analysis of participant feedback to
determine the questions that best fit each domain. (The Personality and Well-Being Lab at San
Francisco State University did not provide the results of the analysis to the Happiness Alliance, and
hence this data is not included in this resource. They did, however, provide assurance of validity
determined by their own analysis.) Results of Round 1, Phase 2 yielded 15 domains. After this phase,
the time it took to take the survey was reduced from approximately 1 hr to approximately 30 min.
Round 1, Phase 3. Next, Round 1, Phase 3 was initiated. During this phase, the refined survey was
shared through Amazon.com’s Mechanical Turk (MTurk) website. MTurk participants were paid a
nominal fee for their participation. The objective of Round 1, Phase 3 was to reduce the number of
items for the domains from approximately 14 to eight or less with the criteria that the items would
maximize the internal consistency and predictive validity of the Happiness Index survey while also
providing a breadth of coverage. The only sections that were not reduced during this phase were
Positive and Negative Experience, Domain Satisfaction, and Your Neighborhood. To better test for
convergent validity, the survey included a question asking each participant to indicate their level of
satisfaction with the operational definitions of the 10 Happiness Index domains. As a result of Round
1, Phase 3, the number of items for each domain was reduced to an average of eight and the survey
time decreased from approximately 30 min to approximately 15 min.
Round 1, Phase 4. Round 1, Phase 4 was subsequently implemented to test the new survey version.
The survey was reposted on Mturk and the original survey takers were excluded from participation.
Phase 4 included one additional modification: The response scales became 5-point Likert scales for
all domains except the first two, which were scaled between 0 and 10. The domains were then
assessed by the Personality and Well-Being Lab at San Francisco State University to ensure that (a)
they formed a single factor using factor analysis, (b) they were internally consistent with their alpha
coefficients being greater than .70, and (c) the sum of the scale significantly (p < .05) correlated with
the satisfaction rating at the beginning of the survey it was intended to predict.
Round 1, Phase 5. Finally, in Round 1, Phase 5, a nationally representative sample of adults was
recruited through SurveyMonkey.com. During this phase 578 participants completed the survey.
Subsequently, a factor analysis of variance, internal consistency of data, and correlation with the
satisfaction rating confirmed the validity of the survey.
Round 2: Domain and Question Reduction As with Round 1, Phase 3, the purpose of Round 2 was to reduce the time it took to take the survey.
The value that guided the shortening of the survey instrument was usefulness to community
organizers and professors administering the survey instrument for courses. Early conversations with
professional pollsters from Gallup (J. de Graff, personal communication, November 2, 2010) and
other polling companies (A. Davis, personal communication, November 11, 2011) confirmed that a
survey longer than 12 min to administer rendered the instrument overwhelming to most survey
takers. An aspect of usefulness considered was the applicability of the survey for random polling, in
which professional pollsters strongly advised the Happiness Alliance to ensure the survey
instrument took less than 12 min to complete or about 60 questions, not including demographic
questions.
Round 2: Domain and Question Reduction During Round 2, questions and domains were eliminated: four questions from the Access to
Education, Arts, and Culture section after a correlation analysis, and the two domains of Your
Neighborhood and Domain Satisfaction. The domains of Your Neighborhood and Domain
Musikanski et al., 2017
Journal of Social Change 12
Satisfaction had initially been included to verify that data gathered by convenience sampling
correlated to well-being. The Happiness Alliance conducted a statistical analysis of this correlation
during this phase and deemed that it was no longer necessary to gather the data from these
domains. Furthermore, survey participant feedback suggested that the data collected within these
domains does not necessarily bolster the survey’s intended purpose.
The second domain, Positive and Negative Experiences, was reduced from 12 to four questions. In
the end, Round 2 of the survey contained the same domains as Round 1, in the same order, with the
exclusion of Domain Satisfaction and Your Neighborhood. Round 2 resulted in the following domains
in order: (a) Satisfaction With Life; (b) Positive and Negative Experiences; (c) Psychological Well-
Being; (d) Health; (e) Time Balance; (f) Community Vitality; (g) Social Support; (h) Access to
Education, Arts, and Culture; (i) Environmental Quality; (j) Governance; (k) Material Well-Being; (l)
Work; and (m) Demographics.
Round 3: Survey Standardization The values that guided Round 3 were to foster standardization among subjective well-being
indicators and to further shorten survey time. The primary benefit of standardization among
indicators is that it allows comparability across geographic, demographics and time. While the
harmonization of subjective well-being indicators is important, whereby each population develops its
own indicators tailored to its own unique circumstances, the standardization of subjective well-being
indicators, in which each population shares a common set of indicators, is central to progress
towards the adoption of wider indicators of well-being by national and local governments seeking to
protect and secure people’s right to life, liberty and pursuit of happiness.
In Round 3, the second domain, Positive and Negative Experience, was replaced by questions from
the U.K. Office for National Statistics. This replacement was made in an effort to contribute to
progress in the happiness movement and to help standardize subjective well-being indicators.
Questions about fiscal and monetary policy, social policy, political orientation, household net wealth,
late payments to creditors, and methods for meeting unplanned expenses were eliminated from the
demographic section. The domains within the survey did not change.
Round 4: Survey Honing The purpose of Round 4 was to eliminate unnecessary questions and shorten the survey. Questions
were deemed unnecessary when they yielded the same statistical analysis as another question,
thereby not providing new information. Correlation analyses were conducted by staff and board
directors of the Happiness Alliance using data gathered through a convenience sampling conducted
between November 2011, and July 2014. Over 95% of the sampling was conducted online and
participants learned about the survey through media, word of mouth, and from grassroots activists
who had taken the trainings conducted by the Happiness Alliance and used the Happiness Index in
their work. More than 85% of the survey takers were from the United States, with the remainder
from around the world. The survey had been translated into Spanish, Chinese Traditional, Chinese
Simple, Vietnamese, Filipino (Tagalog), Romanian, Oromo, and Somali. All of the data were collated
in one database.
In total, 14 questions were eliminated resulting in a survey with 50 domain questions and 15
demographic questions, a total of 65 questions (see Appendices A and B). Additionally, in Round 4,
sections were renamed and section numbers revised so as to no longer contain references to
eliminated sections. Round 4 resulted in the following domains in the following order: (a) Cantril
Ladder; (b) Satisfaction With Life; (c) Psychological Well-Being; (d) Health; (e) Time Balance; (f)
Musikanski et al., 2017
Journal of Social Change 13
Lifelong Learning, Arts, and Culture; (g) Community; (h) Social Support; (i) Environment; (j)
Governance; (k) Standard of Living/Economy; (l) Work; and (m) Demographics.
Cantril Ladder The Happiness Index draws on well-known reliable and valid scales like the Cantril Ladder to assess
domains of happiness. The Cantril Ladder, also known as Cantril’s Self-Anchoring Ladder of Life
Satisfaction, measures life satisfaction by asking participants to imagine their ideal life and hopes
for the future as well as the worst future scenario of their lives and fears associated with that future.
They are then are presented with a series of pictures of a ladder and mark where they see
themselves in the past, present, and future (Cantril, 1965; Levin & Currie, 2014). The Cantril’s
Ladder method is frequently applied in the literature on well-being and is often used to test the
validity of other measures (Cramm, Starting, de Vreede, Steverink, & Nieboer, 2012; Oliver, Huxley,
Priebe & Kaiser, 1997). It has also been integrated widely into questionnaires and composite indexes
across disciplines (Jaarsma et al., 1999; Kahneman & Deaton, 2010; Levin & Currie, 2014;
Svindseth, Nøttestad, & Dahl, 2013; Szramka-Pawlak et al., 2014).
Providing a Comprehensive Survey Instrument
Through Rounds 2–4, the survey was shortened in an attempt to improve survey completion rates,
while also maintaining survey validity and reliability. Round 4 resulted in a survey instrument that
is shorter in length than the other rounds and offers a more precise measure for each domain of well-
being. Round 4 of the survey instrument provides continuity in the comprehensive measuring of
well-being as encompassed by all the domains.
Because the Happiness Index is primarily used for convenience sampling, and data is collected
without compensation, it is paramount that the survey be as attractive and easy to use for volunteer
participants as possible. Likewise, due to the fact that policy makers, community organizers,
academics, consultants, therapists, and others use data gathered through the Happiness Index, it is
vital that the questions measure well-being as accurately as possible. The refinement process
undertaken in rounds allowed the Happiness Alliance to balance brevity and precision within a
comprehensive survey instrument: the Happiness Index.
Suggestions for Implementing the Happiness Index
The Happiness Index was created as a tool for organizations, researchers, and social actors. Through
the refinement process and the use of the survey for groups by community organizers, researchers
and others since 2011, the Happiness Alliance has identified a number of functions the survey and
its data can serve: group assessment, individual assessment, identification of vulnerability in
populations, fundraising, policy and program guidance, resource allocation, awareness raising,
education and outreach, life-skill development, academic research, community engagement, and
program or project evaluation, among other functions.
Assessing and Using the Happiness Index
The Happiness Index can be readily accessed online and users can create a group for administering
the survey online (http://www.happycounts.org/how-happy-are-you-take-the-gross-national-
happiness-index-survey.html). When using the Happiness Index for a group, it is most facilely
distributed via online, such as web pages, social media cites, newsletters, memos, briefings, or other
media. In some cases, the survey is distributed in a paper form as survey takers do not have access
to the Internet. The Happiness Alliance provides a downloadable file for printing for these cases
Musikanski et al., 2017
Journal of Social Change 14
(http://www.happycounts.org/for-researchers.html). Guides, videos, presentations, and examples
based on prior use of the survey instrument by community organizers, researchers, media, nonprofits
and others are provided freely online by the Happiness Alliance (http://www.happycounts.org/happy-
community-toolkit.html).
Measuring for Positive Social Change The Happiness Index can be used to measure: the impact of social injustice, climate injustice, income
inequality, disengagement from the democratic process, loneliness, isolation, ill health, and other
aspects of human suffering within a population or within specific demographics of a population. The
data gathered by the index provides measurement of often-excluded concepts such as social justice,
where objective data does not always provide a complete picture. Moreover, analyses of varying
demographic aspects of a population often reveal unexpected information about who is suffering and
who is thriving within a population. The survey can be used, and has been used by communities to
measure gaps in well-being according to race, income level, zip code, education, age, gender, and
household characteristics. Finally, summarized data and recommendations can be, and has been,
shared with policy makers, and used to inform public conversations and policy makers’ decisions
about budgeting.
Measuring for Education In an educational setting, the Happiness Index can contribute to a variety of learning activities. For
example, lecturers can invite their audiences to take the survey before or after an event. If the
questionnaire is used before an event, the scores can be incorporated into a lecture or informal talk
and used for an interactive session with the audience. Explaining the relationship of the domains of
happiness to individual happiness can provide a personalized way to understand the concepts of
sustainability, well-being, quality of life, and happiness. The Happiness Index can also contribute to
class assignments and research projects and act as a qualitative methods learning tool. The
Happiness Alliance provides full data sets to students and researchers who agree to the protection of
personal data policy (however, emails and profile information are never shared). The survey has
undergone institutional review board reviews at several universities, and was included within course
curricula. It has been administered for a random sample on a campus by a student class learning the
concepts of survey development, random sampling, and data analysis. It has been used in classes as
extra-credit assignments where an institutional review board review process was not performed.
Finally, the data collected since 2011 has been used for analysis in master’s theses and doctoral
dissertations.
Conclusion
The Happiness Alliance’s Happiness Index has been used by over 200 groups since 2011. It was
developed out of a growing interest to (a) understand and evaluate personal and community well-
being as it relates to happiness, sustainability, and quality of life; (b) address the need for, and lack
of, existing freely available valid survey-based well-being measurement tools for community
organizers, researchers, and others; (c) shape personal, community, organizational, and societal
strategies and policies in a way that enhances the connected concepts of happiness, well-being,
quality of life, and sustainability; and, ultimately, (d) the adoption of wider measures of well-being
by governments protecting and securing people’s right to life, liberty, and pursuit of happiness. The
survey was developed over a series of four rounds, each of which sought to streamline and clarify the
measurement instrument. Based on experience gathered by the use of the Happiness Index for
groups since 2011, the Happiness Index has and can serve as a valuable tool for advancing
happiness, well-being, quality of life, sustainability, and social change. Researchers, teachers,
Musikanski et al., 2017
Journal of Social Change 15
students, policy makers, community organizers, managers and business leaders, therapists and
consultants, speakers and authors, and others are invited to use the Happiness Index in their work.
The Happiness Index is one piece of the puzzle that completes a picture conveying the importance of
happiness, and the happiness movement as a new environmental, social, and economic paradigm to
enhance quality of life and sustainability for all beings.
References
Cantril, H. (1965). The pattern of human concern. New Brunswick, NJ: Rutgers University Press.
Cloutier, S., Jambeck, J., & Scott, N. (2014). The sustainable neighborhoods for happiness index
(SNHI): A metric for assessing a community's sustainability and potential influence on
happiness. Ecological Indicators, 40, 147–152. doi:10.1016/j.ecolind.2014.01.012
Cramm, J., Starting, M., de Vreede, P., Steverink, N., & Nieboer, A. (2012). Validation of the self-
management ability scale (SMAS) and development and validation of a shorter scale (SMAS-
S) among older patients shortly after hospitalization. Health and Quality of Life Outcomes,
10, 9. doi:10.1186/1477-7525-10-9
Diener, E., & Pavot, W. (1993). The affective and cognitive context of self-reported measures of
subjective well-being. Social Indicators Research, 28, 1–20. doi:10.1007/BF01086714
Diener, E., Tay, L., & Oishi, S. (2013). Rising income and the subjective well-being of nations.
Journal of Personality and Social Psychology, 104, 267–276. doi:10.1037/a0030487
Easterlin, R. (1974). Does economic growth improve the human lot? In P. David & R. Reder (Eds.),
Nations and households in economic growth: Essays in honor of moses (pp. 89–125). New
York, NY: Academic Press. Retrieved from
http://graphics8.nytimes.com/images/2008/04/16/business/Easterlin1974.pdf
Easterlin, R. (1995). Will raising the incomes of all increase the happiness of all? Journal of
Economic Behavior and Organization, 27, 35–48. doi:10.1016/0167-2681(95)00003-B
Easterlin, R. (2001). Income and happiness: Towards a unified theory. The Economic Journal, 111,
465–484. doi:10.1111/1468-0297.00646
European Social Survey. (2006). Final source questionnaire (Round 3, 2006/7) amendment 03.
London, United Kingdom: Centre for Comparative Social Surveys, City University London.
Retrieved from
http://www.europeansocialsurvey.org/docs/round3/fieldwork/source/ESS3_source_main_quest
ionnaire.pdf
European Social Survey. (2011). ESS Round 5 source questionnaire. London, United Kingdom:
Centre for Comparative Social Surveys, City University London. Retrieved from
https://www.europeansocialsurvey.org/docs/round5/fieldwork/source/ESS5_source_main_ques
tionnaire.pdf
Frank, R. (1997). The frame of reference as a public good. Economic Journal, 107, 1832–1847.
Retrieved from http://www.robert-h-
frank.com/PDFs/The%20Frame%20of%20Reference%20as%20a%20Public%20Good.pdf
Frey, B., & Luechinger, S. (2007). Concepts of happiness and their measurement. Hessen, Germany:
Metropolis Verlag.
Musikanski et al., 2017
Journal of Social Change 16
Frey, B., & Stutzer, A. (2011). The use of happiness research for public policy. Social Choice and
Welfare, 38, 659–674. doi:10.1007/s00355-011-0629-z
Gallup. (2012, October). Global states of mind new metrics for world leaders. Retrieved from
http://allafrica.com/download/resource/main/main/idatcs/00050692:e395af671dee55626aaabb
7817184b80.pdf
Gallup World Poll. (2008). World poll questions. Retrieved from
http://media.gallup.com/dataviz/www/WP_Questions_WHITE.pdf
Gross National Happiness Commission. (n.d.). Mandate. Retrieved from
http://www.gnhc.gov.bt/mandate
Happiness Alliance. (2011). Gross National Happiness Index Round 1 – 2011. Retrieved from
http://www.slideshare.net/TheHappinessInitiative/happiness-initiativegnh-index2011
Happiness Alliance. (2014a). Gross National Happiness Index Round 4 – 2014. Retrieved from
http://www.slideshare.net/TheHappinessInitiative/gross-national-happiness-index-2015
Happiness Alliance. (2014b). Project history of the Happiness Alliance home of the Happiness Index
and Gross National Happiness Index. Retrieved from
http://www.slideshare.net/TheHappinessInitiative/happiness-alliance-home-of-the-
happiness-initiatives-project-history
Happiness Alliance. (2014c). The domains of happiness for the Gross National Happiness Index.
Retrieved from http://www.slideshare.net/TheHappinessInitiative/the-domains-of-happiness-
for-the-gross-national-happiness-index
Heartland Institute of Financial Education. (2006). Personal well-being scale and score
interpretation. Retrieved from http://www.hife-
classes.org/images/HIFE_Personal_Financial_Well-Being_Survey.pdf
Helliwell, J., & Wang, S. (2011). Trust and well-being. International Journal of Well-being, 1, 42–78.
Holden, M. (2006). Revisiting the local impact of community indicators projects: Sustainable Seattle
as prophet in its own land. Applied Research in Quality of Life, 1, 253–277.
doi:10.1007/s11482-007-9020-8
Hone, L., Jarden, A., Schofield, G., & & Duncan, S. (2014). Measuring flourishing: The impact of
operational definitions on the prevalence of high levels of well-being. International Journal of
Well-being, 4, 62–90. Retrieved from
http://www.internationaljournalofwellbeing.org/index.php/ijow/article/view/286
Huppert, F., Marks, N., Clark, A. E., Siegrist, J., Stutzer, A., Vitterso, J. & Wahrendorf, M. (2009).
Measuring well-being across Europe: description of the ESS well-being module and
preliminary findings. Social Indicators Research, 91, 301–315. doi: 10.1007/s11205-008-
9346-0
Huppert, F., & So, T. (2011). Flourishing across Europe: Application of a new conceptual framework
for defining well-being. Social Indicators Research, 110, 837–861. doi: 10.1007/s11205-011-
9966-7
International Well-Being Group. (2006). Personal Well-Being Index (4th ed.). Melbourne, Australia:
Deakin University Centre on Quality of Life. Retrieved May 26, 2016, from
http://www.deakin.edu.au/research/acqol/instruments/wellbeing-index/pwi-adult-english.pdf
Musikanski et al., 2017
Journal of Social Change 17
International Well-Being Group. (2013). Personal Well-Being Index (5th ed.). Melbourne, Australia:
Deakin University Centre on Quality of Life. Retrieved May 26, 2016, from
http://www.acqol.com.au/iwbg/wellbeing-index/pwi-a-english.pdf
Jaarsma, T., Halfens, R., Abu‐Saad, H., Dracup, K., Stappers, J., & Ree, J. (1999). Quality of life in
older patients with systolic and diastolic heart failure. European Journal of Heart Failure, 1,
151–160. doi:10.1016/S1388-9842(99)00007-0
Kahneman, D., & Deaton, A. (2010). High income improves evaluation of life but not emotional well-
being. Proceedings of the national academy of sciences, 107, 16489–16493.
doi:10.1073/pnas.1011492107
Kasser, T., & Sheldon, K. (2009). Time affluence as a path toward personal happiness and ethical
business practice: Empirical evidence from four studies. Journal of Business Ethics, 84, 243–
255. doi:10.1007/s10551-008-9696-1
Kessler, R., Mickelson, K., & Williams, D. (1999). The prevalence, distribution, and mental health
correlates of perceived discrimination in the United States. Journal of Health and Social
Behavior, 40, 208–230. Retrieved from https://www.ncbi.nlm.nih.gov/pubmed/28399649
Layard, R. (2005). Happiness: Lessons from a new science. New York, NY: Penguin.
Levin, K., & Currie, C. (2014). Reliability and validity of an adapted version of the Cantril ladder for
use with adolescent samples. Social Indicators Research, 119, 1047–1063.
doi:10.1007/s11205-013-0507-4
Marans, R. (2001). Detroit Area Study, 2001: Quality of life in the metro-Detroit area (ICPSR29441-
v1). Ann Arbor, MI: Inter-University Consortium for Political and Social Research.
doi:10.3886/ICPSR29441.v1
Marks, N., Abdallah, S., Simms, A., & Thompson, S. (2006). The (un) happy planet
index 2.0. Retrieved May 10, 2016, from http://www.neweconomics.org/page/-
/files/The_Happy_Planet_Index.pdf
Morton, A., & Edwards, L. (2012). Community well-being indicators, survey template for local
government. Sydney, Australia: University of Technology Australian Centre of Excellence for
Local Government. Retrieved May 26, 2016, from
http://www.acelg.org.au/file/1610/download?docId=206
Musikanski, L., & Polley, C. (2016). Life, liberty and pursuit of happiness: Measuring what matters.
Journal of Social Change, 7, 48–72. doi:10.5590/JOSC.2016.08.1.05
Oliver, J., Huxley, P., Priebe, S., & Kaiser, W. (1997). Measuring the quality of life of severely
mentally ill people using the Lancashire quality of life profile. Social Psychiatry and
Psychiatric Epidemiology, 32, 76–83. doi:10.1007/BF00788924
National Institute for Occupational Safety and Health (NIOSH). (n.d.). General Social Survey 2010:
SECTION D: Quality of Worklife Module: NIOSH. Retrieved from
http://www.cdc.gov/niosh/topics/stress/pdfs/qwl2010.pdf
Organisation for Economic Co-Operation and Development (OECD). (2013, March 20). OECD
guidelines on measuring subjective well-being. Paris, France: OECD Publishing.
doi:10.1787/9789264191655-en
Ovaska, T., & Takashima, R. (2006). Economic policy and the level of self-perceived well-being: An
international comparison. The Journal of Socio-Economics, 35, 308–325.
doi:10.1016/j.socec.2005.11.054
Musikanski et al., 2017
Journal of Social Change 18
Pfeiffer, D., & Cloutier, S. (2016). Planning for happy neighborhoods. Journal of the American
Planning Association, 83, 267–279. doi:10.1080/01944363.2016.1166347
Russell, D. (1996). The UCLA Loneliness Scale (Version 3): Reliability, validity, and factor
structure. Journal of Personality Assessment, 66, 20–40. doi:10.1207/s15327752jpa6601_2
Smith, T., Marsden, P., Hout, M., & Kim, J. (2013). General social surveys, 1972–2012 [cumulative
file]. Ann Arbor, MI: Inter-University Consortium for Political and Social Research.
Retrieved from http://people.wku.edu/douglas.smith/GSS%201972_2012%20Codebook.pdf
Svindseth, M., Nøttestad, J., & Dahl, A. (2013). Perceived humiliation during admission to a
psychiatric emergency service and its relation to socio-demography and psychopathology.
BMC Psychiatry, 13, 217–217. doi:10.1186/1471-244X-13-217
Szramka-Pawlak, B., Dańczak-Pazdrowska, A., Rzepa, T., Szewczyk, A., Sadowska-Przytocka, A., &
Żaba, R. (2014). Quality of life and optimism in patients with morphea. Applied Research in
Quality of Life, 9, 863–870. doi:10.1007/s11482-013-9273-3
Take Back Your Time. (n.d.). Our mission. Retrieved from https://www.takebackyourtime.org/about-
us/mission/
The Center for Bhutan Studies & GNH Research. (2015). A compass towards a just and harmonious
society. Retrieved from http://www.socioeco.org/bdf_fiche-document-5358_pt.html
Tran, K. (2006, October 4). Measuring discrimination in social surveys: Experiences from Canada
[PowerPoint slides]. Retrieved from
http://www.ceg.ul.pt/metropolis2006/WorkshopPresentations/Culturgest/KellyTran_metropol
is2006.pdf
U.K. Office for National Statistics. (2013, April 11). Measuring national well-being: Older people and
loneliness, 2013. Retrieved from http://www.ons.gov.uk/ons/dcp171766_304939.pdf
U.K. Office for National Statistics. (2015). Measuring national well-being: Personal well-being in the
U.K., 2014 to 2015. Retrieved from http://www.ons.gov.uk/ons/rel/wellbeing/measuring-
national-well-being/personal-well-being-in-the-uk--2014-15/stb-personal-well-being-in-the-
uk--2014-15.html#tab-3--Measuring-personal-well-being-in-the-UK
Ura, K., Alkire, S., Zangmo, T., & Wangdi, K. (2012, May). An extensive analysis of GNH index.
Centre for Bhutan Studies. Retrieved May 29, 1016, from
http://www.grossnationalhappiness.com/wp-
content/uploads/2012/10/An%20Extensive%20Analysis%20of%20GNH%20Index.pdf
Victoria Foundation. (2010). 2010 Greater Victoria Well-Being Survey. Retrieved from
http://www.slideshare.net/TheHappinessInitiative/2010-greater-victoria-wellbeing-survey
World Health Organization. (2002). WHOQOL-HIV instrument. Geneva, Switzerland: Author.
Retrieved from
http://apps.who.int/iris/bitstream/10665/77774/1/WHO_MSD_MER_Rev.2012.01_eng.pdf?ua=
1
World Values Survey. (n.d.a) World Values Survey Wave 4 1999–2004 (official aggregate v.20240429).
Retrieved May 29, 2016, from
http://www.worldvaluessurvey.org/WVSDocumentationWV4.jsp
Musikanski et al., 2017
Journal of Social Change 19
World Values Survey. (n.d.b). World Values Survey Wave 5 2005–2008 (official aggregate.
v.20140429). Retrieved May 29, 2016, from
http://www.worldvaluessurvey.org/WVSDocumentationWV5.jsp
World Values Survey. (n.d.c). World Values Survey Wave 6 (official aggregate v.20150418). Retrieved
May 29, 2016, from http://www.worldvaluessurvey.org/WVSDocumentationWV6.jsp
Zidanšek, A. (2007). Sustainable development and happiness in nations. Energy, 32, 891–897.
doi:10.1016/j.energy.2006.09.016
(Appendices follow)
Musikanski et al., 2017
Journal of Social Change 20
Appendix A
Questions in Round 4 of the Happiness Index and Sources
Below are the sources for each question in Round 4 of the Happiness Index. It is organized by
domains. Each domain lists the full text of the questions with answer choices followed by the
sources.
Domain 1: Cantril Ladder
The first domain has one question: the Cantril Ladder.
Question There is one question in Domain 1:
Please imagine a ladder with steps numbered from zero at the bottom to ten at the top.
Suppose we say that the top of the ladder represents the best possible life for you and the
bottom of the ladder represents the worst possible. If the top step is 10 and the bottom step is
0, on which step of the ladder do you feel you personally stand at the present time?
(Organisation for Economic Co-Operation and Development [OECD], 2013, p. 249)
Answers The answers are on an 11-point scale rated from 0 (worst possible life for you) to 10 (best possible life
for you). This question is Cantril’s self-anchoring ladder (OECD, 2013).
Domain 2: Satisfaction With Life
The second domain has four questions. They are the same as those used by the Government of the
United Kingdom for measuring well-being.
Questions There are four questions in Domain 2: “Overall, how satisfied are you with your life nowadays?”
“Overall, to what extent do you feel the things you do in your life are worthwhile?” “Overall, how
happy did you feel yesterday?” “Overall, how anxious did you feel yesterday?”
Answers The answer choices are on an 11-point scale rated from 0 (not at all) to 10 (completely). The source of
the questions is the U.K. Office for National Statistics Personal Well-Being (2015).
Domain 3: Psychological Well-Being
There are five questions in Domain 3. They measure mental well-being, also termed psychological
health or flourishing.
Questions The five questions in Domain 3 ask to what extent participants agree with the following statements:
“I lead a purposeful and meaningful life,” “I am engaged and interested in my daily activities”
(OECD, 2013), “I am optimistic about my future,” “Most days I feel a sense of accomplishment from
what I do,” and “In general, I feel positive about myself” (Huppert & So, 2011, p. 843).
Musikanski et al., 2017
Journal of Social Change 21
Answers The answer choices in this domain and in all subsequent domains except the demographic section
are on a 5-point scale rated 0 (strongly disagree), 1 (disagree), 2 (neither agree nor disagree), 3 (agree),
and 4 (strongly agree). The source for the first two questions is Diener and Biswas’ Psychological
Well-Being Scale (OECD, 2013). The source for the last three questions is the European Social
Survey 2003 (Huppert & So, 2011).
Domain 4: Health
There are four questions in Domain 4 that measure physical health.
Questions The first question is “In general, I would say my health is (poor, fair, good, very good, excellent).”
This question is adapted from the World Health Organization (2002), in which the question is “How
satisfied are you with your health?” (p. 14). The second is “Please indicate how much of the time
during the past week you had a lot of energy.” This question is adapted from the World Health
Organization question, “Do you have enough energy for everyday life?” (p. 11).
The third and fourth questions ask participants to rate their level of satisfaction. “How satisfied
were you with your ability to perform your daily living activities?” “How satisfied were you with the
quality of your exercise?” The source of the third question is the World Health Organization (2002),
in which the question is “How satisfied are you with your ability to perform your daily living
activities?” (p. 15). The fourth question is an adaptation of a question used by the United Kingdom
Department of Health (2006), in which the question is “During the last week, how many hours did
you spend on each of the following activities? Physical exercise such as swimming, jogging, aerobics,
football, tennis, gym, workout, etc.” (p. 2).
Answers The answer choices for the second question are 0 (very rarely or never), 1 (rarely), 2 (sometimes), 3
(often), and 4 (very often or always; World Health Organization, 2002, p. 11). The answer choices for
the third and fourth questions are 0 (very dissatisfied), 1 (dissatisfied), 2 (neither satisfied nor
dissatisfied), 3 (satisfied), and 4 (very satisfied; p. 15).
Domain 5: Time Balance
There are three questions in the Time Balance domain. They address time balance from three
perspectives. The time balance domain does not include a question about work–life balance. A
question about work–life balance is included in the work domain.
Questions The first question is “In a typical week, how much of your time are you able to spend doing the kinds
of things that you enjoy?” The second two questions ask participants to think specifically about how
things were for them over the past week. “My life has been too rushed.” “I have plenty of spare time.”
Answers The answers choices for the first question are 0 (none of my time), 1 (not much of my time), 2 (some of
my time), 3 (most of my time), and 4 (all of my time). The answer choices for the second and third
questions are 0 (strongly agree), 1 (disagree), 2 (neither agree nor disagree), 3 (agree), and 4 (strongly
agree). The source of both questions is Kasser and Sheldon (2009, p. 247).
Musikanski et al., 2017
Journal of Social Change 22
Domain 6: Lifelong Learning, Arts, and Culture
There are four questions in the Lifelong Learning, Arts, and Culture domain. They are about access
to lifelong learning, arts, and culture as well as about diversity and inclusion.
Questions The first three questions ask how satisfied participants are in their neighborhood or community with
“Your access to sports and recreational activities?” “Your access to artistic and cultural activities?”
and “Your access to activities to develop skills through informal education?” (Victoria Foundation,
2010, p. 15). Local governments in Australia used similar questions in 2012 (Morton & Edwards,
2012). The questions were as follows: “How adequate are the opportunities in your local community
for you to effectively engage in (a) sports and recreation, (b) art and cultural activities?” (p. 13) and
“How would you rate the adequacy of the following services in your local community in terms of your
needs and well-being: Education?” (p. 19).
The fourth question in this domain is “How often do you feel uncomfortable or out of place in your
neighborhood because of your ethnicity, culture, race, skin color, language, accent, gender, sexual
orientation, or religion?” (Tran, 2006, p. 6). Tran’s question is “How often do you feel uncomfortable
or out of place in Canada now because of your ethnicity, culture, race, skin colour, language, accent
or religion?” (p. 6). This question is similar to a question in the 2010 Greater Victoria Well-Being
Survey, except that the time frame is the last 5 years and the question begins with the sentence
“Discrimination may happen when people are treated unfairly because they are being seen as
different from others.” (p. 15). This question is also similar to two questions used by Kessler,
Mickelson, and William (1999): “How many times in your life have you been discriminated against in
each of the following ways because of such things as your race, ethnicity, gender, age, religion,
physical appearance, sexual orientation, or other characteristics?” (Section VI) and “(number of times
in your life...) You were prevented from remaining in a neighborhood because neighbors made life so
uncomfortable?” (Section VI).
Answers The answer choice to the first three questions are 0 (very dissatisfied), 1 (dissatisfied), 2 (neither
satisfied nor dissatisfied), 3 (satisfied), and 4 (very satisfied; Victoria Foundation, 2010, p. 15). The
answer choices for the fourth questions are 0 (never), 1 (rarely), 2 (some of the time), 3 (most of the
time), and 4 (all of the time; Tran, 2006, p. 6).
Domain 7: Community
There are seven questions in the Community domain, including questions about a sense of belonging,
volunteerism, donation activity, and trust, as well as a question about a lost wallet.
Questions The first question in the community domain is “How would you describe your feeling of belonging to
your local community?” (Victoria Foundation, 2010, p. 6). The answer choices are “very weak,
somewhat weak, neither weak nor strong, somewhat strong, very strong” (p. 6). The source of the
questions is the 2010 Greater Victoria Well-Being Survey (Victoria Foundation, 2010), in which the
question is “How would you describe your sense of belonging to your local community? Would you say
it is?” (p. 6). This question is similar to a question in the Detroit Area Study 2001: Quality of Life in
the Metro-Detroit Area (Marans, 2001), in which the question is “Here are some statements about
neighbors and neighborhoods. For each statement, please tell me if you strongly agree, agree, neither
agree nor disagree, disagree, or strongly disagree? You feel like you belong to a community” (pp. 25–
Musikanski et al., 2017
Journal of Social Change 23
26). It is also similar to a question in the World Values Survey Wave 5 (World Values Survey, n.d.b),
in which the question is “People have different views about themselves and how they relate to the
world. Using this card, would you tell me how strongly you agree or disagree with each of the
following statements about how you see yourself? I see myself as part of my local community” (p. 19).
The second questions is “Please tell us how many of the following people you trust: Your neighbors”
(Victoria Foundation, 2010, p. 6). The source of the second question is the 2010 Greater Victoria
Well-Being Survey (Victoria Foundation, 2010), in which the question is “How much do you
trust…Most strangers that you encounter” (p. 6). The World Values Survey Wave 6 (n.d.c) has a
similar question. It is “Could you tell me for each whether you trust people from this group
completely, somewhat, not very much or not at all? Your neighborhood” (p. 8).
The third questions is “Please tell us how many of the following people you trust: Businesses in your
community” (Victoria Foundation, 2010, p. 6). The source of the third question is the 2010 Greater
Victoria Well-Being Survey (Victoria Foundation, 2010), in which the question is “How much do you
trust…Businesses in your community” (p. 6). The World Values Survey Waves 5 (n.d.a) and 6 (n.d.c)
have a similar question. It is “…could you tell me how much confidence you have in them: is it a
great deal of confidence, quite a lot of confidence, not very much confidence or none at all? Major
companies.” (World Values Survey, n.d.c, p. 9; World Values Survey, n.d.b, p. 11). The General Social
Survey (Smith, Marsden, Hout, & Kim, 2013) also has a similar question. It is “Confidence? Major
companies?” (Smith et al., 2013, p. 163).
The fourth question is “Imagine that you lost a wallet or purse that contained $200. Please indicate
how likely you think it would be to have all of your money returned to you if it was found by someone
who lives close by” (Victoria Foundation, 2010, p. 17). The source of this question is the 2010 Greater
Victoria Well-Being Survey, in which the question is “If you lost a wallet or purse that contained two
hundred dollars, what is the likelihood of it being returned with the money in it if it was found by:
Someone who lives close by” (p. 17). This question is similar to the one used by the Gallup World Poll
2006 (Helliwell & Wang, 2011). The question is “In the city or area where you live, imagine that you
lost your wallet or something holding your identification or address and it was found by someone
else. Do you think your wallet (or your valuables) would be returned to you if it were found by
strangers” (Helliwell & Wang, 2011, pp. 74–75).
The fifth question is “How satisfied are you with your personal safety in your city or town?” The fifth
question is similar to a question in the International Well-Being Group’s (2013) Personal Well-Being
Index, in which the question is “How satisfied are you with…personal safely? How safe do you feel?”
(p. 11). The World Health Organization (2002) has similar questions including “How safe do you feel
in your daily life?” (p. 9), “Do you feel you are living in a safe and secure environment?” (p. 9), and
“How satisfied are you with your safety and security?” (p. 16). The Detroit Area Study 2001: Quality
of Life in the Metro-Detroit Area (Marans, 2001) also has similar questions including “How safe do
you feel about being out alone in your neighborhood during the day?” (p. 34), “How about at night—
how safe do you feel about being out alone in your neighborhood at night?” (p. 34), and “On a scale of
1 to 7, where 1 is completely dissatisfied and 7 is completely satisfied, how satisfied are you with
your personal safety in this neighborhood?” (p. 34). Gallup World Poll (2008) also has a similar
question, which is “Do you feel safe walking alone at night in the city or area where you life?” (p. 4).
Musikanski et al., 2017
Journal of Social Change 24
The sixth and seventh questions are “Using the scale below, please indicate how frequently you have
done these activities in the past 12 months: Volunteered your time to an organization. Donated
money to a charity” (Smith et al., 2013, pp. 634–635). The source of the questions is the General
Social Survey 2002. The questions in the General Social Survey 2002 are “During the past 12 months
how often have you done each of the following things: Done volunteer work for a charity” (Smith et
al., 2013, p. 634) and “During the past 12 months how often have you done each of the following
things: Given money to a charity” (Smith et al., 2013, p. 635). The Gallup World Poll (2008) has
similar questions, which are “Have you volunteered your time to an organization in the past month?”
(p. 2) and “Have you donated money to a charity in the past month?” (p. 2).
Answers The answer choices for the second and third question about trust are 0 (trust none of them), 1 (trust a
few of them), 2 (trust some of them), 3 (trust most of them), and 4 (trust all of them; Victoria
Foundation, 2010, p. 6).
The answer choices for the fourth question regarding a lost wallet are 0 (not at all likely), 1
(somewhat likely), 2 (fairly likely), 3 (very likely), and 4 (extremely likely; Victoria Foundation, 2010,
p. 17).
The answer choices for the fifth question regarding personal safety are 0 (very dissatisfied), 1
(dissatisfied), 2 (neither satisfied nor dissatisfied), 3 (satisfied), and 4 (very satisfied).
The answer choices for the sixth and seventh questions regarding volunteerism and donating activity
are 0 (at least once a month), 1 (at least once every 3 months), 2 (at least once every 6 months), 3 (once
in the last year), and 4 (never; Smith et al., 2013, pp. 634–635).
Domain 8: Social Support
There are four questions in the Social Support domain. The questions measure satisfaction with
relationships, and feeling cared for, loved, and lonely.
Questions The first question is “Please rate your level of satisfaction. How satisfied are you with your personal
relationships?” (World Health Organization, 2002, p. 15).
The second question is “To what extent do you agree with the following statement? People in my life
care about me” (Victoria Foundation, 2010, p. 8). The source of the question is the 2010 Greater
Victoria Well-Being Survey (Victoria Foundation, 2010). This question is similar to a question in the
European Social Survey (2006), in which the question is “please say to what extent you agree or
disagree with each of the following statements…There are people in my life who really care about
me” (p. 52).
The third question is “Please indicate how much of the time during the past week...You felt loved.”
This question is similar to Seligman’s PERMA flourishing scale question “To what extent do you feel
loved?” (Hone, Jarden, Schofield, & Duncan, 2014, p. 70).
Musikanski et al., 2017
Journal of Social Change 25
The fourth question is “Please indicate how much of the time during the past week…You felt lonely”
(OECD, 2013, p. 250). The source of question is the European Social Survey well-being module
developed by Huppert et al. (2009). The question is “Please tell me how much of the time during the
past week…you felt lonely” (OECD, 2013, p. 250). This question is similar to a question in the U.K.
Office for National Statistics (2013) report Measuring National Well-being: Older people and
loneliness, 2013 that used data from the English Longitudinal Study of Ageing, Wave 5, 2009–2010
for the question “How often do you feel lonely?” (U.K. Office for National Statistics, 2013, p. 19). The
fourth question is also similar to the UCLA Loneliness Scale’s question “Indicate how often each of
the statements below is descriptive of you. 11. I feel completely alone” (Russell, 1996, p. 2).
Answers The answer choices are 0 (very dissatisfied), 1 (dissatisfied), 2 (neither satisfied nor dissatisfied), 3
(satisfied), and 4 (very satisfied; World Health Organization, 2002, p. 15). The answer choices for the
second question about feeling cared about are 0 (strongly disagree), 1 (disagree), 2 (neither agree nor
disagree), 3 (agree), and 4 (strongly agree; Victoria Foundation, 2010, p. 8). The answer choice for the
third and fourth questions about feeling lonely and loved are 0 (very rarely or never), 1 (rarely), 2
(sometimes), 3 (often), and 4 (very often or always; OECD, 2013, p. 250).
Domain 9: Environment
There are four questions in the Environment domain. They measure access to nature, sense of
healthy or toxic environment, local natural preservation efforts and satisfaction with air quality.
Questions The first question is “How healthy is your physical environment?” World Values Survey (1999–2004,
p. 17).
The second and third questions are “Please rate your level of satisfaction: How satisfied are you with
the efforts being made to preserve the natural environment in your neighborhood? How satisfied are
you with the opportunities that you have to enjoy nature” (Victoria Foundation, 2010, p.19). The
source of these questions is the 2010 Greater Victoria Well-Being Survey (Victoria Foundation,
2010). The Gallup World Poll (2008) has a similar question to the second question, which is “In your
country, are you satisfied or dissatisfied with efforts to preserve the environment?” (p. 3).
The fourth question is “How satisfied are you with the air quality in your environment?” (OECD,
2013, p. 262). The source of the fourth question is the International Well-Being Group’s (2006)
Personal Well-Being Index, in which the question is “How satisfied are you with the air quality in
your environment?” (OECD, 2013, p. 262). The fourth question is similar to a question in the Detroit
Area Study 2001: Quality of Life in the Metro-Detroit Area (Marans, 2001, p. 41), in which the
question is “…first issue is the loss of natural scenic areas. Would you say that this is a very serious
problem, a somewhat serious problem, not a serious problem, or not a problem at all in all. Air
pollution in (NAME OF COUNTY)” (p. 41). The World Values Survey (n.d.a) also has a similar
question, which is “How satisfied are you with your physical environment (e.g. pollution, climate,
noise, attractiveness)?” (p. 17). The Gallup World Poll (2008) also has another similar question,
which is “In your city or area where you live, are you satisfied or dissatisfied with the quality of air?”
(p. 3). In addition, Gallup’s (2012) Global States of Mind New Metrics for World Leaders report
included a similar question, which is “In the city or area where you life, are you satisfied or
dissatisfied with the quality of air?” (p. 5).
Musikanski et al., 2017
Journal of Social Change 26
Answers The answer choice for the first question regarding the health of the environment are 0 (not at all), 1
(a little), 2 (somewhat), 3 (very), and 4 (extremely; World Values Survey, n.d.a, p. 17). The answer
choices for the second and third question regarding satisfaction with access to and preservation of
nature are 0 (very dissatisfied), 1 (dissatisfied), 2 (neither satisfied nor dissatisfied), 3 (satisfied), and
4 (very satisfied; Victoria Foundation, 2010, p.19). The answer choices for the fourth question
regarding air quality are 0 (very dissatisfied), 1 (dissatisfied), 2 (neither satisfied nor dissatisfied), 3
(satisfied), and 4 (very satisfied; OECD, 2013, p. 262).
Domain 10: Governance
There are four questions in the governance domain. They include questions about sense of
corruption, sense of local officials caring about what people think, and satisfaction with local and
national government.
Questions The first question is “State your level of agreement with the following statements: Corruption is
widespread throughout the government in my city or town” (Gallup World Poll, 2008, p. 4). The
source of question is the Gallup World Poll (2008), in which the question is “Is corruption is
widespread throughout the government in my city or town?” (p. 4).
The second question is “State your level of agreement with the following statements: The public
officials in my city or town pay attention to what people think” (Marans, 2001, p. 7). The source of
the question is the Detroit Area Study 2001: Quality of Life in the Metro-Detroit Area (Marans,
2001), in which the question is “Public officials in (NAME OF CITY/TOWNSHIP) pay attention to
what people think. How much do you agree or disagree?” (p. 7).
The third and fourth questions are “Please indicate how much confidence you have in the following
organizations: National government and. Local government” (Victoria Foundation, 2010, pp. 17–18).
The source of the third and fourth questions is the 2010 Greater Victoria Well-being Survey (Victoria
Foundation, 2010), in which the questions are “For the following organizations, please indicate how
much confidence you have in them: is it a great deal of confidence, quite a lot of confidence, not very
much confidence or no confidence? Federal government. Local government” (pp. 17–18). The World
Values Survey (n.d.a) Wave 4 has a similar question, which is “…how much confidence you have
in…The government (in your nation’s capital)” (p. 13). The Gallup World Poll (2008) also has a
similar question, which is “In this country, do you have confidence in national government?” (p. 4).
Answers The answer choices for the third and fourth question regarding confidence in local and national
government are 0 (no confidence), 1 (not very much confidence), 2 (a fair amount of confidence), 3
(quite a lot of confidence), and 4 (a great deal of confidence; Victoria Foundation, 2010, pp. 17–18).
The answer choices for the first question about corruption are 0 (strongly disagree), 1 (disagree), 2
(neither agree nor disagree), 3 (agree), and 4 (strongly agree; Gallup World Poll, 2008, p. 4). The
answer choices for the second question regarding sense that public official pay attention to what
people think are 0 (strongly disagree), 1 (disagree), 2 (neither agree nor disagree), 3 (agree), and 4
(strongly agree; Marans, 2001, p. 7).
Musikanski et al., 2017
Journal of Social Change 27
Domain 11: Standard of Living/Economy
There are four questions in the Standard of Living/Economy domain. They measure stress about
personal finance, getting by paycheck to paycheck, inability to afford food and sense of having
enough money.
Questions The first question is “In general, how much stress do you feel about your personal finances?”
(Heartland Institute of Financial Education, 2006, p. 8). The source of the question is the Heartland
Institute of Financial Education, in which the question is “How stressed do you feel about your
personal finances in general?” (p. 8). The Heartland Institute of Financial Education has another
similar question, which is “What do you feel is the level of your financial stress today?” (p. 1). The
Gallup World Poll (2008) also has a similar question, which is “How concerned are you…based on
your current financial situation. Are you very worried, moderately worried, not too worries or not at
all worried about not being able to maintain the standard of living you enjoy?” (p. 7).
The second question is “How frequently do you find yourself just getting by financially and living
paycheck to paycheck?” (Heartland Institute of Financial Education, 2006, p. 7). The source of the
question is the Heartland Institute of Financial Education in which the question is “How frequently
do you find yourself just getting by financially and living paycheck to paycheck?” (p. 7).
The third question is “Please indicate how frequently you have had the following experiences in the
past 12 months. You ate less because there wasn’t enough food or money for food.” The question is
similar to a question in the Greater Victoria Well-being Survey (Victoria Foundation, 2010), in which
the question is “In the past 12 months, did any of the following happen to you? Decreased the size of
your meal or skipped meals because there wasn’t enough food or money for food?” (p. 3). This
question is similar to the Gallup World Poll (2008) question “Have there been times in the past 12
months when you did not have enough money to buy the food that you or your family?” (Gallup
World Poll, 2008, p. 3). Gallup’s (2012) Gallup World Path poll also has a similar question, which is
“Have there been times in the past 12 months when you did not have enough money to buy the food
that you and your family needed?” (p. 4). The Heartland Institute of Financial Education (2006) also
has a similar question, which is “How often does this happen to you? You want to go out to eat, go to
a movie or do something else and don’t go because you can’t afford to?” (p. 6).
The fourth question is “To what extent do you agree with the following statement? I have enough
money to buy things I want” (Kasser & Sheldon, 2009, p. 247). The source of the question is Kasser
and Sheldon, in which the question is “I have had enough money to buy the things that are
important to me” (p. 247).
Answers The answer choices for the first question about stress over personal finances are “overwhelming
stress, high stress, moderate stress, low stress, no stress at all” (Heartland Institute of Financial
Education, 2006, p. 8). The answer choices for the second question regarding getting by paycheck to
paycheck are 0 (all the time), 1 (most of the time), 2 (sometimes), 3 (rarely), and 4 (never; p. 7). The
answer choices for the third question regarding having enough money for food are 0 (at least once a
month), 1 (at least once every 3 months), 2 (at least once every 6 months), 3 (once in the last year), and
4 (never). The answer choices are for the fourth question regarding having enough money are 0
(strongly disagree), 1 (disagree), 2 (neither agree nor disagree), 3 (agree), and 4 (strongly agree)
(Kasser & Sheldon, 2009, p. 247).
Musikanski et al., 2017
Journal of Social Change 28
Domain 12: Work
There are six questions in the Work domain. They measure satisfaction with work, work–life
balance, autonomy, pay, productivity, and job interest.
Questions The first question asks participants to answer the following questions about their satisfaction with
their current working situation (if they are not working [unemployed, retired, a student,
homemaker, volunteer, or other], they are instructed to answer only the questions that apply to their
main activity or occupation). “All things considered, how satisfied are you with your current work
life? (Note: if you work or volunteer at more than one job, you should answer about the job you spend
the longest time working at).” The question is similar to a question in the General Social Survey
2010 quality of work life module, in which the question is “All in all, how satisfied would you say you
are with your job?” (p. 12). The General Social Survey 2002 (Smith et al., 2013) also has a similar
question, which is “All in all, how satisfied would you say you are with your job?” (p. 603).
The second question is “How satisfied are you with the balance between the time you spend on your
job and the time you spend on other aspects of your life?” The source of the question is in Round 5 of
the European Social Survey (2011), in which the question is “How satisfied are you with the balance
between the time you spend on your paid work and the time you spend on other aspects of your life?”
(p. 72). Round 3 of the European Social Survey (2006) also has the same question, which is “How
satisfied are you with the balance between the time you spend on your paid work and the time you
spend on other aspects of your life?” (p. 53).
The third question is “How much of the time do you find your current work life interesting?” The
source of the question is in Round 3 of the European Social Survey (2006), in which the question is
“How much of the time do you find your job…interesting?” (p. 51). Round 5 of the European Social
Survey (2011) also has a similar question, which is “the reason I put effort into my work is…because
my work tasks are interesting?” (p. 65).
The fourth question is “Please state your level of agreement with each of these statements.
Considering all my efforts and achievements in my job I feel I get paid appropriately” (European
Social Survey, 2006, p. 53). The source of this question is Round 3 of the European Social Survey
(2006).
The fifth question is “Please state your level of agreement with each of these statements. The
conditions of my job allow me to be about as productive as I could be” (The National Institute for
Occupational Safety and Health [NIOSH], n.d., p. 5). The source this question is the NIOSH quality
of work life module (n.d.).
Musikanski et al., 2017
Journal of Social Change 29
The sixth question is “Please state your level of agreement with each of these statements. I am
allowed to decide how to go about getting my job done” (NIOSH, n.d., p. 5). The source this question
is the NIOSH (n.d) quality of work life module used by the General Social Survey, a survey
instrument developed by the National Opinion Research Center (NORC) at the University of
Chicago. This question is similar another question in the NIOSH (n.d) quality of work life module,
which is “I am given a lot of freedom to decide how to do my own work” (p. 6). The General Social
Survey conducted by NORC at the University of Chicago in 2002 using the NIOSH, work life module
also contains a similar question, which is “I am given a lot of freedom to decide how to do my own
work” (Smith et al., 2013, p. 892). Round 5 of the European Social Survey (2011) also has a similar
question, which is “how much the management at your work allows/allowed you…to decide how your
own daily work is/was organized? (p. 44).
Answers The answer choices for the first question regarding satisfaction with work are 0 (very dissatisfied), 1
(dissatisfied), 2 (neither satisfied nor dissatisfied), 3 (satisfied), and 4 (very satisfied). The answer
choices for the second question about work-life balance are 0 (very dissatisfied), 1 (dissatisfied), 2
(neither satisfied nor dissatisfied), 3 (satisfied), and 4 (very satisfied; European Social Survey, 2011,
p. 72). The answer choices for the third question regarding interest in work are 0 (very rarely or
never), 1 (rarely), 2 (sometimes), 3 (often), and 4 (very often or always; European Social Survey, 2006,
p. 51). The answer choices for the fourth question regarding pay are 0 (strongly disagree), 1
(disagree), 2 (neither agree nor disagree), 3 (agree), and 4 (strongly agree; p. 53). The answer choices
for the fifth question regarding productivity are 0(strongly disagree), 1 (disagree), 2 (neither agree nor
disagree), 3 (agree), and 4 (strongly agree; NIOSH, n.d., p. 5). The answer choices for the sixth
question regarding autonomy are 0 (strongly disagree), 1 (disagree), 2 (neither agree nor disagree), 3
(agree), and 4 (strongly agree; NIOSH, n.d., p. 5).
Musikanski et al., 2017
Journal of Social Change 30
Appendix B
Demographic Questions in Round 4 of the Happiness Index
Below is a list of demographic questions within Round 4 the Happiness Index (Happiness Alliance,
2014a). The questions are listed in the order presented in the survey, with the answer choices listed.
Users of the Happiness Index who use the index for a population are able to access their results for
each of the aspects of demographics, for example a data query may compare females, age 50–54, with
children under the age of 18 with males, age 50-54, with children under the age of 18 or any other
aspect of demographic qualities included in the index.
Demographic Questions
The demographic questions are listed with answer choices following each question.
Question: What is your current age?
Answers: <12 years old, 12–17 years old, 18–24 years old, 25–29 years old, 30–34 years old, 35–39
years old, 40–44 years old, 45–49 years old, 50–54 years old, 55–59 years old, 60–64 years old, 65–69
years old, 70–74 years old, 75–79 years old, 80–84 years old, 85–89 years old, 90 years or older
Question: Which gender do you identify as?
Answers: Female, male, other.
Question: What race or ethnicity do you identify as?
Answers: Black/African, East Asian, Hispanic, Middle Eastern, South Asian,
White/European/Caucasian, two or more, other, prefer not to say.
Question: What is your current marital status?
Answers: Married, domestic partnership, never married and/or never in a domestic partnership,
separated, divorced, widowed, other.
Question: How many people currently reside in your household, including you?
Answers: 1, 2, 3, 4, 5, 6, 7, 8, 9, 10, 11, 12, 13, 14, 15, 16, 17, 18, 19, 20 or more
Question: Do you have any children under 18?
Answers: Yes, no.
Question: What is your postal code? (we just want the more general part; e.g. 98101 for U.S. zip
Codes or SE11 for U.K. postcodes).
Question: How spiritual do you consider yourself to be?
Answers: Not at all, not very, somewhat, moderately, very.
Question: What is the highest level of education that you have completed?
Musikanski et al., 2017
Journal of Social Change 31
Answers: Less than Grade 9 (no high school), More than Grade 9 but less than Grade 12 (started
high school but did not graduate), high school graduate or equivalent, Trade, technical or vocational
training, associate’s degree (AA, AS, etc.), bachelor's degree (BA, AB, BS, etc.), Graduate university
degree (MA, MS, MBA, etc.), professional degree (MD, DDS, DVM, LLB, JD, etc.), doctoral degree
(PhD, EdD, etc.), other.
Question: What was your total household income from all sources last year?
Answers: <$10,000, $10,000–$19,999, $20,000–$29,999, $30,000–$39,999, $40,000–$49,999,
$50,000–$59,999, $60,000–$69,999, $70,000–$79,999, $80,000–$89,999, $90,000–$99,999, $100,000–
$109,999, $110,000–$119,999, $120,000–$129,999, $130,000–$139,999, $140,000–$149,999,
$150,000–$159,999, $160,000–$169,999, $170,000–$179,999, $180,000–$189,999, $190,000–
$199,999, ≥$200,000.
Question: Regarding employment, which of the following options best describe your current work
life?
Answers: Full-time employee, part-time employee, working independently/self-employed, military,
volunteer, homemaker, unemployed looking for work, unemployed not looking for work, retired,
student or in training, unable to work, other.
Question: What is the one thing you would like to do to improve your own well-being and the
wellbeing of your community and our planet?
Question: In one word, what makes you happy?
The Journal of Social Change, sponsored by Walden University, welcomes manuscripts focusing on interdisciplinary research in social change that improves the human condition and moves people, groups, organizations, cultures, and society toward a more positive future. Walden University Publishing: http://www.publishing.waldenu.edu