Embed Size (px)
Citation preview

Financing Urban Development in
India

Relevant Sustainable Development GoalGoal 7: Ensure access to affordable, reliable, sustainable and modern energy for all
Goal 8: Promote sustained, inclusive and sustainable economic growth, full and productive employment, and decent work for all
Goal 9: Build resilient infrastructure, promote inclusive and sustainable industrialisation, and foster innovation
Goal 10: Reduce inequality within and among countries
Goal 11: Make cities and human settlements inclusive, safe, resilient and sustainableGoal 12: Ensure sustainable consumption and production patterns
Goal 13: Take urgent action to combat climate change and its impacts (taking note of agreements made by the UNFCCC forum)
Goal 14: Conserve and sustainably use the oceans, seas and marine resources for sustainable development

Key Objectives of Goal No 11Ensure access for all to adequate, safe and affordable housing and basic services, and upgrade slums
Provide access to safe, affordable, accessible and sustainable transport systems for all, improving road safety, notably by expanding public transport
enhance inclusive and sustainable urbanisation and capacities for participatory, integrated and sustainable human settlement planning and management in all countries
reduce the adverse per capita environmental impact of cities, including by paying special attention to air quality, municipal and other waste management
provide universal access to safe, inclusive and accessible, green and public spaces, particularly for women and children, older persons and persons with disabilities
support positive economic, social and environmental links between urban, peri-urban and rural areas by strengthening national and regional development planning
support least developed countries, including through financial and technical assistance, for sustainable and resilient buildings utilising local materials

Overview of India’s Urban Sector

Some Useful Statistics Urban Population in India
Urban Local Bodies in India
Year Urban Population- million % of total Population2001 (Census) 286 28%2011 (Census) 377 31%2030 (World bank estimate) 600 39%
Type of Urban Units 2011 Census 2001 Census Addition in 2001-111. Towns: 7,935 5,161 2,774(a) Statutory Towns 4,041 3,811 242(b) Census Towns 3,894 1,350 2,5322. Urban Agglomerations 475 384 913. Out Growths (OGs) 981 962 19
Both the numbers of Urban Areas and Urban Population have grown significantly in the past and will continue to grow in the future
1 Source: Census of India 2011

Conventional Sources of Income for Urban Local Bodies
Tax•Property Tax•Entertainment Tax•Tax on Animal•Local Excise•Advertisement/ Hoarding Tax
Non Tax •User Charges and Fees•Rents•Return on Investment•Profits
Transfers/ Grants
•Formulae based devolution or share in resource of higher govts. •Adhoc grants•Special purpose grants
Government Loans
•From higher governments•Government agencies•Municipal development funds
Own Sources

Expenditure on Urban Services
Source: McKinsey Global Institute
India Spends only $50 per capita per annum on urban services which is only 14% of China’s and 3% of UK’s investment on same purpose

Urban Service Delivery PerformanceWater Supply-
litres per capita per day
Source: United Nations- Handbook of Benchmarks; Ministry of Urban Development; W Smith; Transport Policies and Strategies in Urban India; McKinsey Global Institute
Sewage treated (% of
generated)
Solid waste collected (%
of generated)
Parks and Open Spaces-
sq.m per capita
Share of public
transport trips %
Slum Population (% of total
Population)

The Additional Demand for Urban Services (2030)
106 billion litres water
per day
85 billion litres sewage
per day
306 million tons solid
waster per annum
48 million cars on urban
roads
208 million public
transport trips per day
13 million affordable
housing units
Source: United Nations- Handbook of Benchmarks; Ministry of Urban Development; W Smith; Transport Policies and Strategies in Urban India; McKinsey Global Institute

Investment Required to Meet the Demand (2030)
Current Backlog- $20 bFuture Requirement- $76 b
Current Backlog- $22 bFuture Requirement- $31 b
Current Backlog- $0.5 bFuture Requirement- $14.5 b
Current Backlog- $21 bFuture Requirement- $11 b
Current Backlog- $151 bFuture Requirement- $48 b
Current Backlog- $98 bFuture Requirement- $294 b
Current Backlog- $243 bFuture Requirement- $152 b
Total Requirement: $2.2 Trillion Per Capita Annual Spending- $250 (Current- $50)
Source: Indian Urbanization Funding Model, JuNURM, Ministry of Urban Development & McKinsey Global Institute Water Supply $96 b
Sewage $53 b
Solid Waste $15 b
Storm Water Drain $32 b
Urban Roads $199 b
Mass Transit $392 b
Affordable Housing $395 b
Operational Exp. $1040 b
Capital Expenditure: $1182 billion [Current (2010)Backlog: $555.5 b, Future Requirement: $626.5 b)
Operational Expenditure: $1040 billion

How to Mobilize Finance to Meet the Demand and Fulfil SDG Requirement?
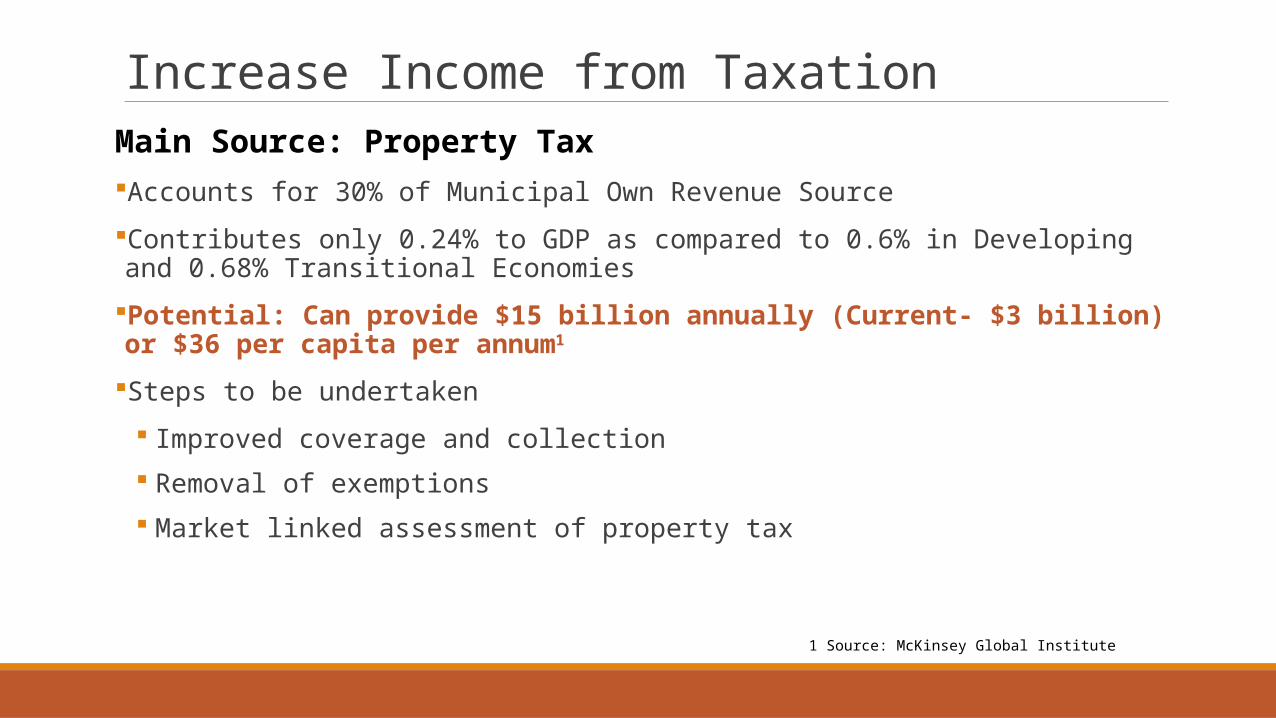
Increase Income from Taxation Main Source: Property Tax Accounts for 30% of Municipal Own Revenue Source
Contributes only 0.24% to GDP as compared to 0.6% in Developing and 0.68% Transitional Economies
Potential: Can provide $15 billion annually (Current- $3 billion) or $36 per capita per annum1
Steps to be undertaken
Improved coverage and collection Removal of exemptions Market linked assessment of property tax
1 Source: McKinsey Global Institute

Increase Income from Non Tax ResourcesUser Charges Potential: Can provide $35 billion annually (Current- $8 billion) or $76 per capita per annum1
Steps to be undertaken
Meter water connections Progressive rate slabs Improved recovery of user charges
Monetize Land AssetsPotential: Can provide $27 billion annually (Current- $3 billion) or $58 per capita per annum2
Steps to be undertaken
Identify land assets Auction greenfield sites Increase floor area ratio (FAR)
1 & 2 Source: McKinsey Global Institute

Income from Own Sources (Tax + Non Tax)Therefore, $77 Billion annually or $170 per capita per annum can be mobilized annually from the Municipalities’ existing sources
In addition to above, some income will also come from other Tax and Non Tax Sources
Still there is a shortfall of approximate $70-$80 per capita per annum- a substantial portion of this amount can be generated from nonconventional sources

Mobilize Investment from Nonconventional Sources
Debt and PPPAt present only 5% investment comes from these two sources
Potential: Can provide $12 billion annually (Current- $2 billion) or $26 per capita per annum1
Steps to be undertaken
Adapt enabling policy to encourage private investors Identify bankable projects Viability gap funding from higher level governments Create project specific SPVs (special purpose vehicle) Guarantee from higher level governments to ensure access to debt market (including loans
from multi and bilateral agencies)
1 Source: McKinsey Global Institute
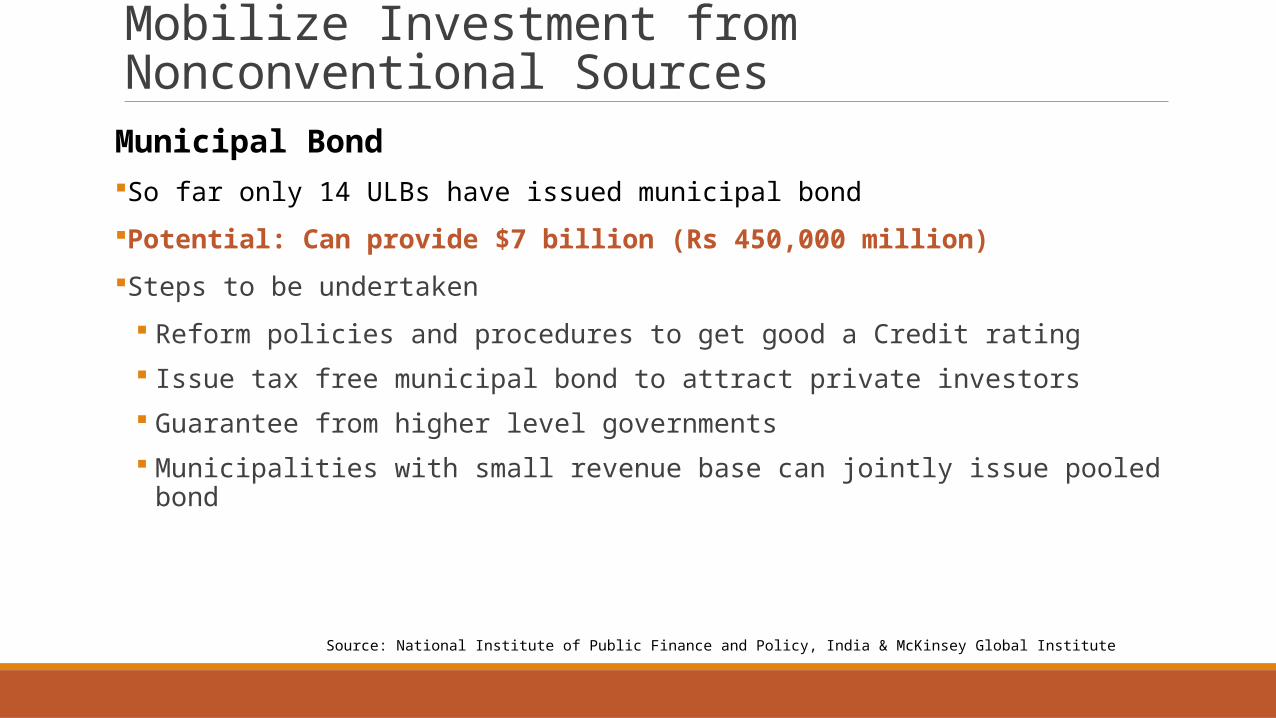
Mobilize Investment from Nonconventional Sources
Municipal Bond So far only 14 ULBs have issued municipal bond
Potential: Can provide $7 billion (Rs 450,000 million)
Steps to be undertaken
Reform policies and procedures to get good a Credit rating Issue tax free municipal bond to attract private investors Guarantee from higher level governments Municipalities with small revenue base can jointly issue pooled bond
Source: National Institute of Public Finance and Policy, India & McKinsey Global Institute

What is Expected from Higher Level Governments Devolution of powers and function to urban local bodies in accordance with the 74 th amendment of the Constitution
Reform policies and regulatory laws to attract investment for urban local bodies
Provide technical assistance to prepare municipal plans and budgets
Build capacity of municipal staff to empower them to adapt new techniques and process of day-to-day functioning of the municipalities
Help urban local bodies to identify projects, carryout project feasibility studies and design funding framework
Provide guarantee for municipal bonds and external loans
Fund the financial gap to make PPP projects viable

Thank You