Embed Size (px)
Citation preview
EQUITABLE WATER SUPPLY PROJECT FOR PUNE CITY
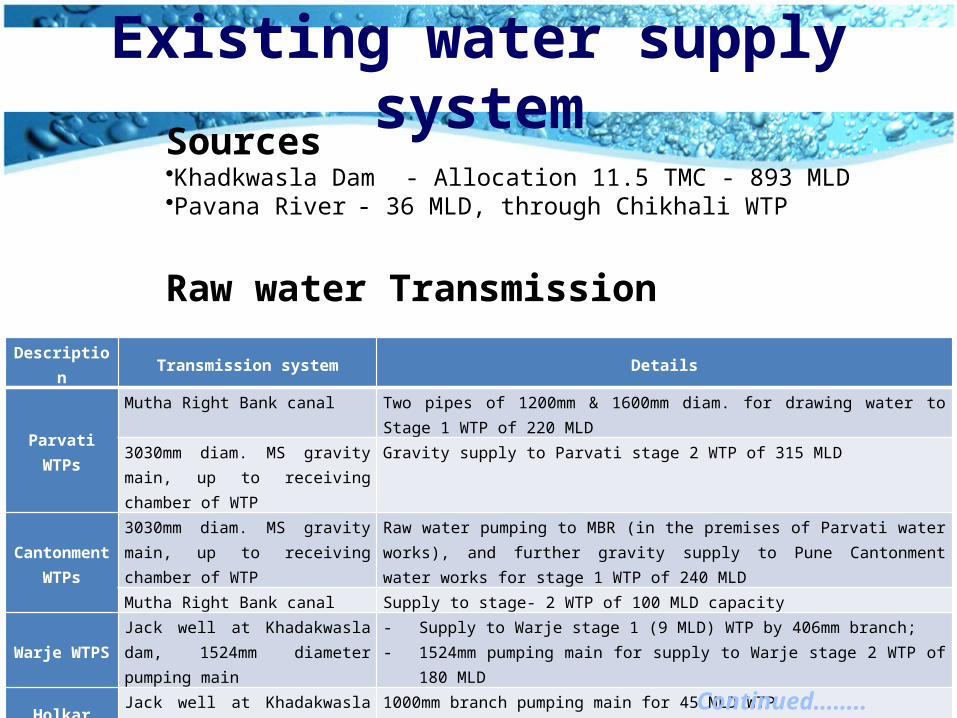
Existing water supply system
Description Transmission system Details
Parvati WTPsMutha Right Bank canal Two pipes of 1200mm & 1600mm diam. for drawing water to Stage 1 WTP of 220 MLD
3030mm diam. MS gravity main, up to receiving chamber of WTP
Gravity supply to Parvati stage 2 WTP of 315 MLD
Cantonment WTPs
3030mm diam. MS gravity main, up to receiving chamber of WTP
Raw water pumping to MBR (in the premises of Parvati water works), and further gravity supply to Pune Cantonment water works for stage 1 WTP of 240 MLD
Mutha Right Bank canal Supply to stage- 2 WTP of 100 MLD capacity
Warje WTPSJack well at Khadakwasla dam, 1524mm diameter pumping main
- Supply to Warje stage 1 (9 MLD) WTP by 406mm branch;- 1524mm pumping main for supply to Warje stage 2 WTP of 180 MLD
Holkar WTPsJack well at Khadakwasla dam, 1524mm diam. pumping main
1000mm branch pumping main for 45 MLD WTP
Vadgaon WTP stage 1
3030mm diam. MS gravity main, from Khadakwasla
- 1524 mm branch gravity main- Raw water PS- 1524mm diam. pumping main to stage 1 WTP of 125 MLD.
Chikhali WTP Jack well at Ravet on Pavana river 711mm diam. pumping main to Chikhali WTP
Sources•Khadkwasla Dam - Allocation 11.5 TMC - 893 MLD•Pavana River - 36 MLD, through Chikhali WTP
Raw water Transmission
Continued……..

Existing water supply system
Water Treatment Plants
Sr No NAME - LOCATIONCAPACITY in MLD
Existing Under construction Total
1 Chikhali-(Pavana River) 36 362 Holkar 45 45
3
Cantonment Old 260 260Cantonment New 100 100
Sub Total Cantonment 360 360
4
Parvati Old (line 1) 220 220Parvati New (line 2) 315 315
Sub Total Parvati 535 5355 Vadgaon stage 1 125 125
6
Warje Old 9 9Warje New 186 186Warje stage 3 200 200
Sub Total Warje 195 200 395TOTAL 1296 200 1496
Continued……..

Name Sump in ML Pumping destinationsParvati PH No.1 19.0 Parvati LLR, Parvati MLRs, Parvati HLRSParvati PH No.2 12.0 SNDT, Parvati HLRsParvati PH No.3 SNDT, Parvati HLRsCantonment Old WTP Pump Station
9.00 Bakri Hill, Wanorie ESR, Wanorie HLRs, Race course ESR, Thakarsi Hill SRs
Cantonment New WTP PH 4.20 Ram Tekdai, Kharadi ESRs
Warje 180 MLD WTP PH 4.20 Gandhi bhavan GSR, Chandani chowk GSR, SNDT
Vadgaon 125 MLD WTP PH 4.80 Taljai HLRs, Washout ESR, Institute ESRHolkar 45 MLD WTP PH 2.0 Vidyanagar sumpPadmavati Pump Station 8.0 Bibvewadi GSRs, Taljai MLR, Seminary GSRSNDT MLR Pump Station 11.35 SNDT HLRVidyanagar Pump Station 1.0 Vidyanagar ESR, Viman nagar ESRs,
Dhanori ESR, Kalwad, KalasRajeev Gandhi Udyan Pump Station 1.60 Kedareshwar GSR, Shreehari ESRKatraj Pump Station 0.35 Agam Mandir GSR(minor pump stations & boosters) - various
Existing water supply system
Pump Stations
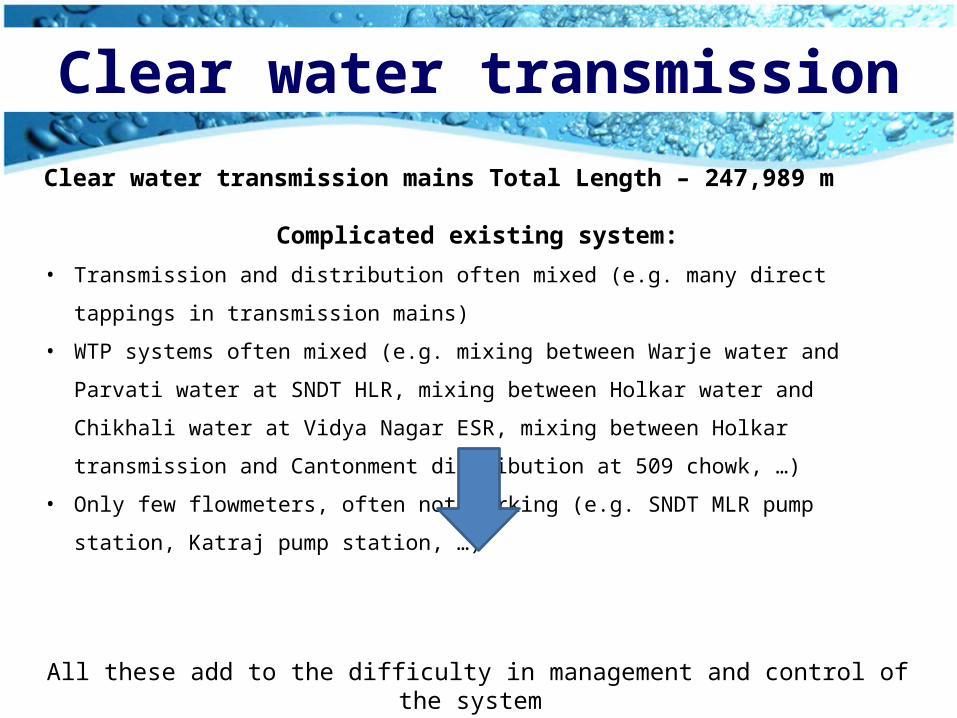
Clear water transmission
Clear water transmission mains Total Length – 247,989 m
Complicated existing system:
• Transmission and distribution often mixed (e.g. many direct tappings in transmission mains)
• WTP systems often mixed (e.g. mixing between Warje water and Parvati water at SNDT HLR,
mixing between Holkar water and Chikhali water at Vidya Nagar ESR, mixing between Holkar
transmission and Cantonment distribution at 509 chowk, …)
• Only few flowmeters, often not working (e.g. SNDT MLR pump station, Katraj pump station, …)
All these add to the difficulty in management and control of the system (e.g. Difficult to assess losses)
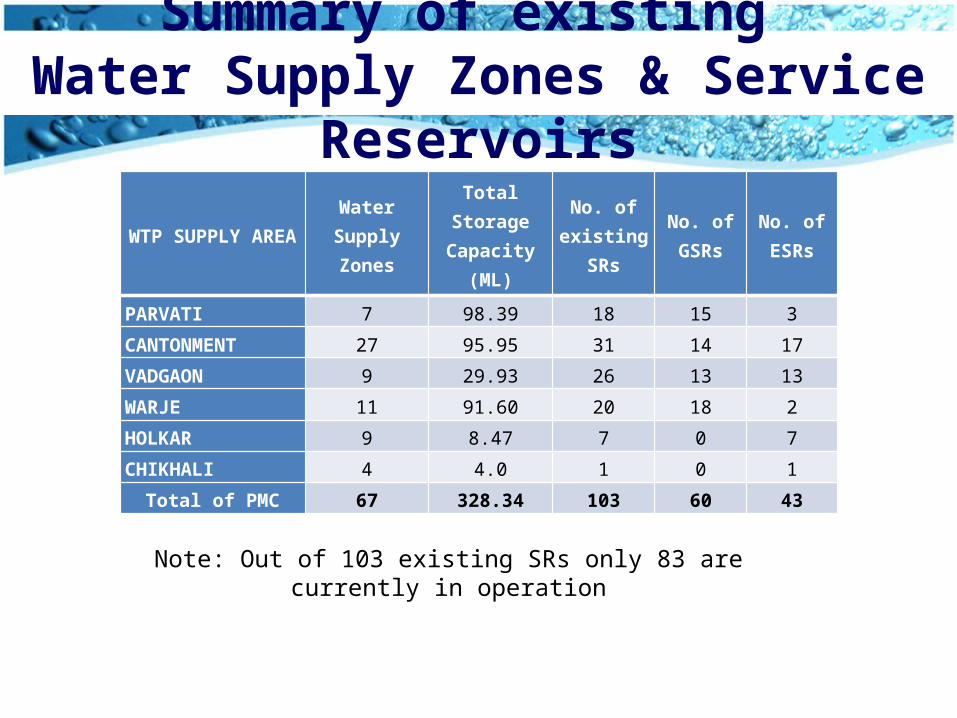
Summary of existing Water Supply Zones & Service Reservoirs
WTP SUPPLY AREA Water Supply Zones
Total Storage Capacity
(ML)
No. of existing SRs
No. of GSRs
No. of ESRs
PARVATI 7 98.39 18 15 3
CANTONMENT 27 95.95 31 14 17
VADGAON 9 29.93 26 13 13
WARJE 11 91.60 20 18 2
HOLKAR 9 8.47 7 0 7
CHIKHALI 4 4.0 1 0 1
Total of PMC 67 328.34 103 60 43
Note: Out of 103 existing SRs only 83 are currently in operation

Distribution System
Material Diameters in mm Length in kmAsbestos cement 80 to 300 15.465Cast Iron 75 to 1000 2335.50RCC 450 7.33Ductile Iron 50 to 600 189.66Galvanized Iron 25 to 100 34.39Mild Steel 100 to 1524 91.35Prestressed concrete 500 to 1600 6.70PVC 63 to 250 8.13
Total 2688.525
Material Diameters in mm Length in kmAsbestos cement 80 to 300 15.47Cast Iron 75 to 1000 2335.50RCC 450 7.33Ductile Iron 100 to 600 189.66Galvanized Iron 25 to 100 34.39Mild Steel 100 to 1524 91.35Prestressed concrete 500 to 1600 6.70PVC 63 to 250 8.13
Total 2688.53
Summary of Existing distribution system
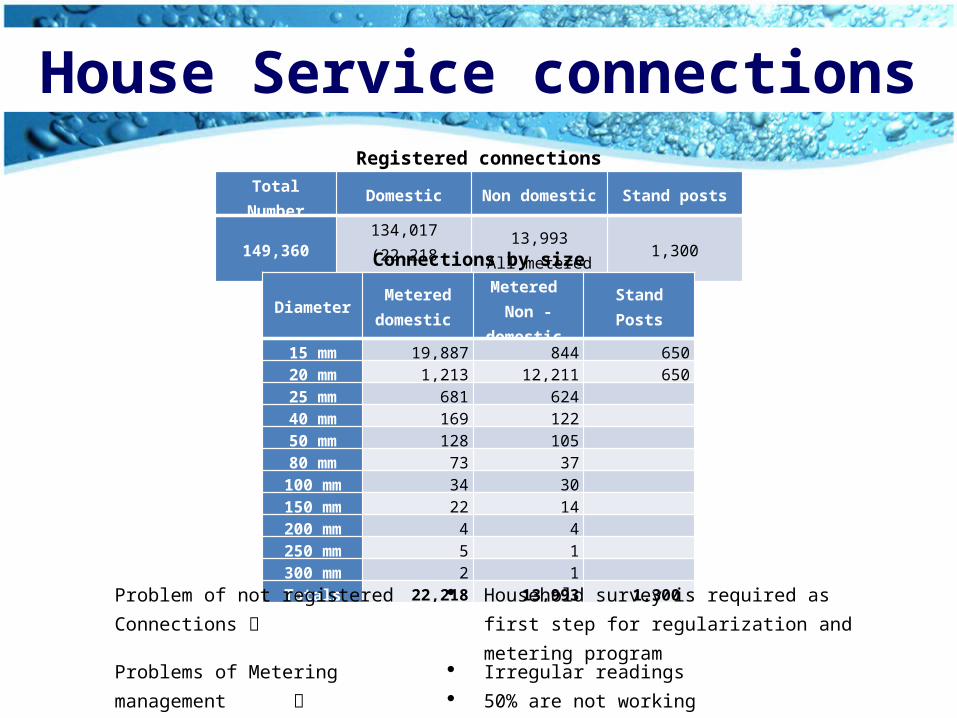
House Service connectionsRegistered connections
Total Number Domestic Non domestic Stand posts
149,360 134,017(22,218 metered)
13,993All metered 1,300
Connections by size
Diameter Metered domestic
Metered Non -domestic Stand Posts
15 mm 19,887 844 65020 mm 1,213 12,211 65025 mm 681 624 40 mm 169 122 50 mm 128 105 80 mm 73 37
100 mm 34 30 150 mm 22 14 200 mm 4 4 250 mm 5 1 300 mm 2 1
Totals 22,218 13,993 1,300 Problem of not registered Connections Household survey is required as first step for
regularization and metering program
Problems of Metering management Irregular readings 50% are not working Complaints by users for measurement of air flow
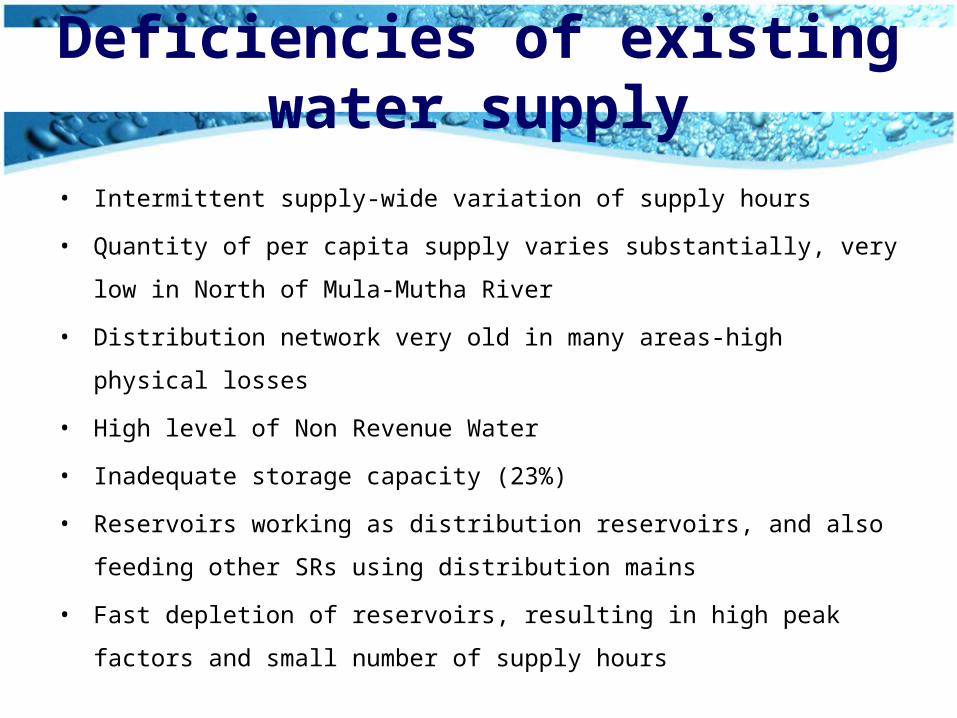
• Intermittent supply-wide variation of supply hours
• Quantity of per capita supply varies substantially, very low in North of Mula-Mutha
River
• Distribution network very old in many areas-high physical losses
• High level of Non Revenue Water
• Inadequate storage capacity (23%)
• Reservoirs working as distribution reservoirs, and also feeding other SRs using
distribution mains
• Fast depletion of reservoirs, resulting in high peak factors and small number of
supply hours
Deficiencies of existing water supply
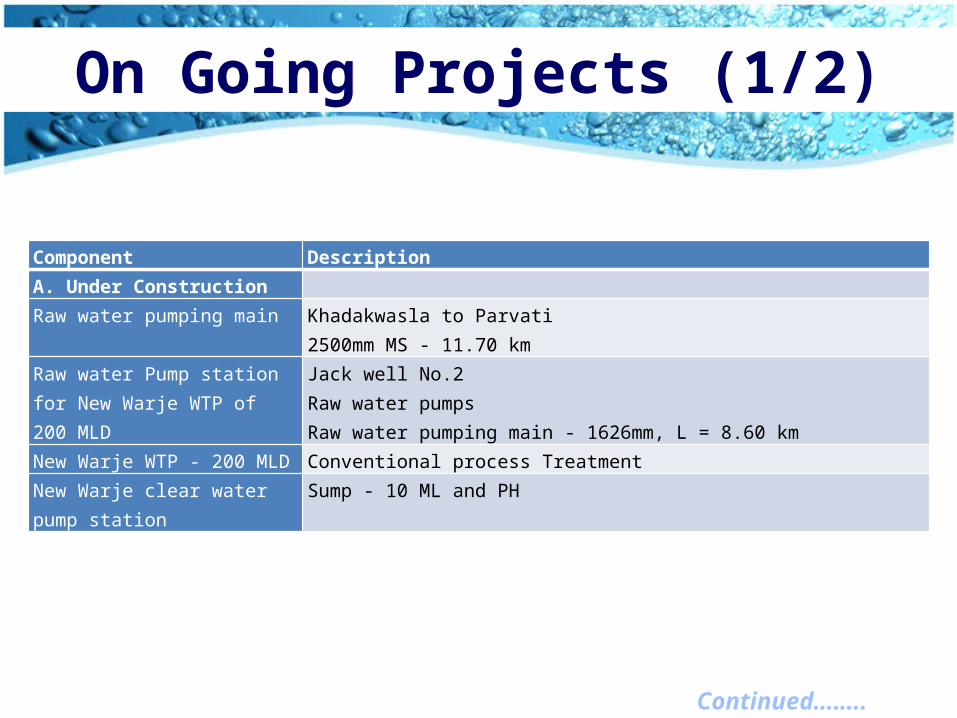
On Going Projects (1/2)
Component DescriptionA. Under Construction Raw water pumping main
Khadakwasla to Parvati2500mm MS - 11.70 km
Raw water Pump station for New Warje WTP of 200 MLD
Jack well No.2Raw water pumpsRaw water pumping main - 1626mm, L = 8.60 km
New Warje WTP - 200 MLD Conventional process TreatmentNew Warje clear water pump station
Sump - 10 ML and PH
Continued……..

On Going Projects (2/2)Component DescriptionB. Planned Raw water pump station for Parvati
Jack well and PH No.3Raw water pumps
New water treatment plant at Parvati-500 MLD including Pump Station
Conventional process TreatmentSump - 18 ML and PHPumps for Pune Cantonment
Clear Water Pumping Main from Parvati WTP to Pune Cantonment
2200 mm MS PipelineLength- 7.00 km
Raw water pump station for New Vadgaon WTP
Sump - 8.53 MLRaw water pumps
Raw water pumping main for for New Vadgaon WTP
2000mm dia. MS
New Vadgaon WTP-125 mld Conventional process TreatmentNew clear water pump station for Vadgaon
Sump - 11 ML - and PH
Raw water intake and pump station for Bhama – Askhed project
Intake wellJack well and PHRaw water pumps
Raw water pumping main 1700mm MS - 8.31 kmWater treatment plant -200 MLD at Alandi road
Conventional process TreatmentMBR
Clear water Transmission system 1600mm diam. gravity main - 16.5 km and feeder mains to ESRs
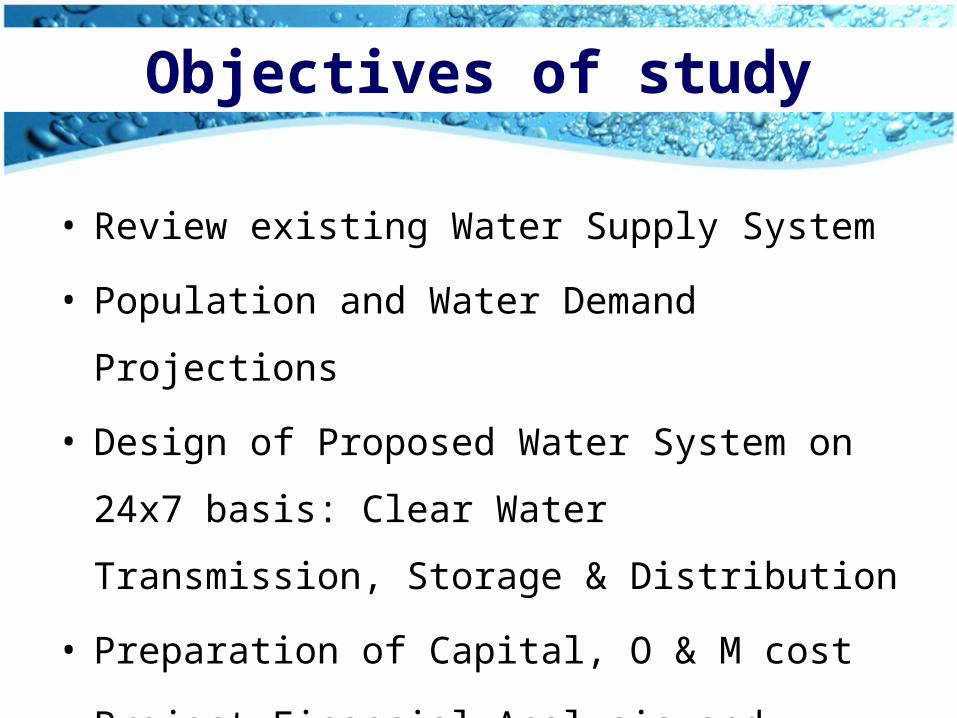
Objectives of study
• Review existing Water Supply System
• Population and Water Demand Projections
• Design of Proposed Water System on 24x7 basis:
Clear Water Transmission, Storage & Distribution
• Preparation of Capital, O & M cost
• Project Financial Analysis and Viability
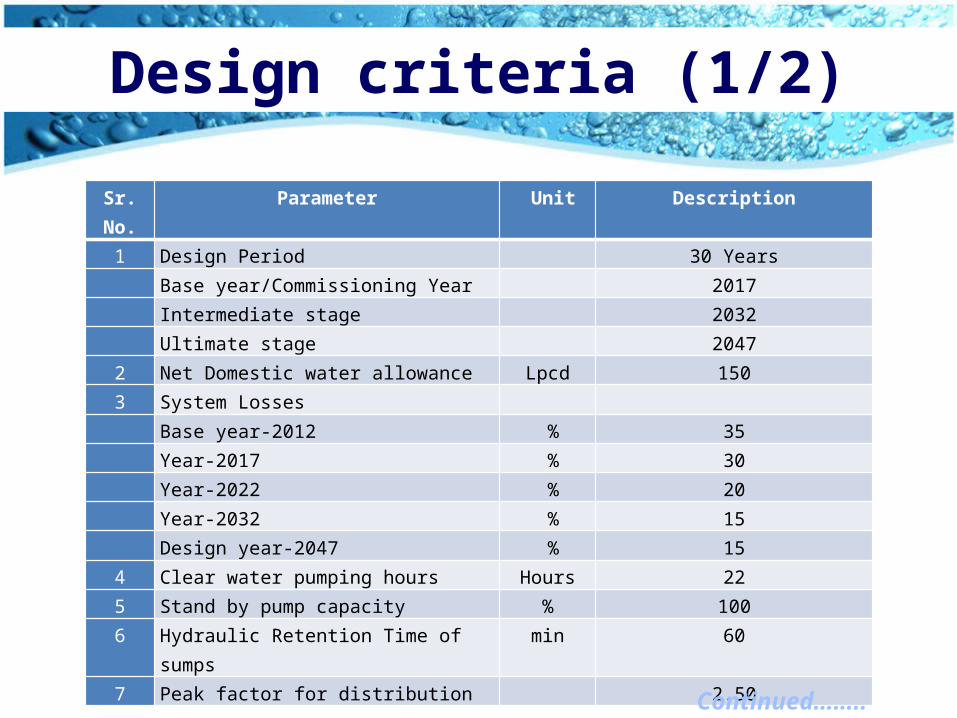
Design criteria (1/2)
Sr. No. Parameter Unit Description1 Design Period 30 Years Base year/Commissioning Year 2017 Intermediate stage 2032 Ultimate stage 20472 Net Domestic water allowance Lpcd 1503 System Losses Base year-2012 % 35 Year-2017 % 30 Year-2022 % 20 Year-2032 % 15 Design year-2047 % 154 Clear water pumping hours Hours 225 Stand by pump capacity % 1006 Hydraulic Retention Time of sumps min 607 Peak factor for distribution 2.50
Continued……..
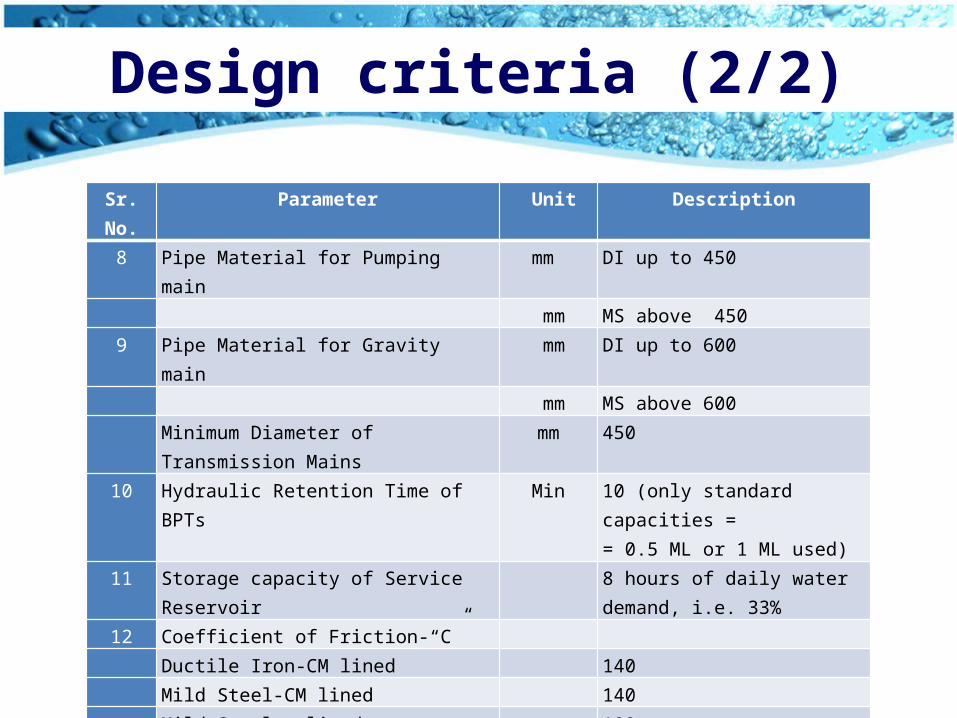
Sr. No. Parameter Unit Description8 Pipe Material for Pumping main mm DI up to 450 mm MS above 450 9 Pipe Material for Gravity main mm DI up to 600 mm MS above 600
Minimum Diameter of Transmission Mains mm 45010 Hydraulic Retention Time of BPTs Min 10 (only standard capacities =
= 0.5 ML or 1 ML used)11 Storage capacity of Service Reservoir 8 hours of daily water demand, i.e.
33%12 Coefficient of Friction-“C” Ductile Iron-CM lined 140 Mild Steel-CM lined 140
Mild Steel unlined 100 Cast Iron pipes-New (unlined) 100 Cast iron pipes-Old (unlined) 80
13 Terminal pressure in distribution Network m Normal 12m, but not below 10m
Design criteria (2/2)
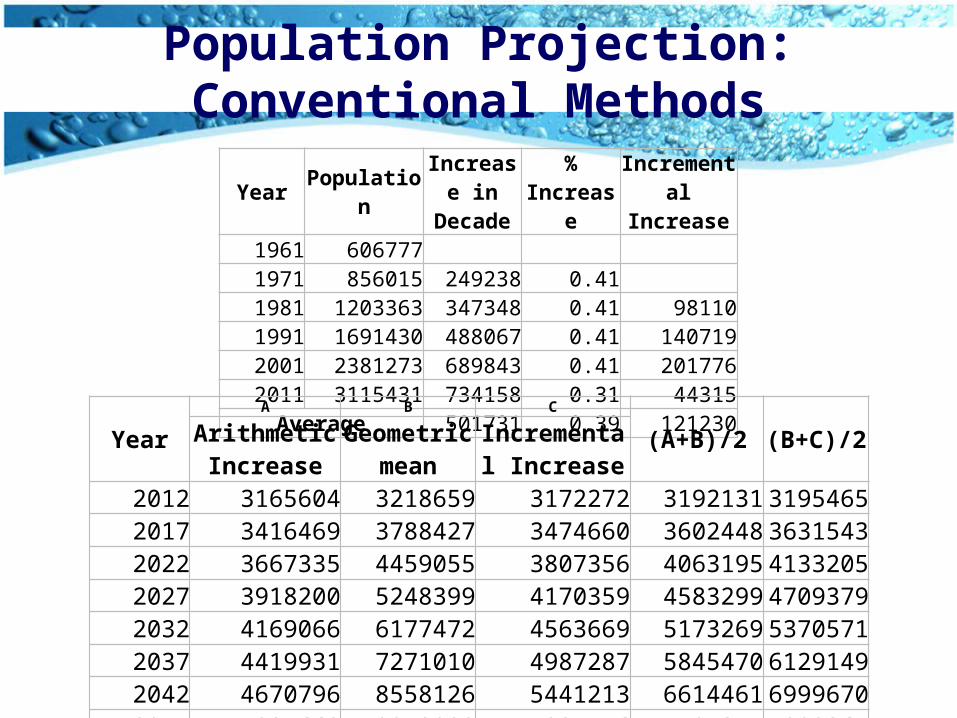
Population Projection: Conventional Methods
Year Population Increase in Decade % Increase Incremental
Increase1961 606777 1971 856015 249238 0.41 1981 1203363 347348 0.41 981101991 1691430 488067 0.41 1407192001 2381273 689843 0.41 2017762011 3115431 734158 0.31 44315
Average 501731 0.39 121230
YearA B C
(A+B)/2 (B+C)/2Arithmetic Increase
Geometric mean
Incremental Increase
2012 3165604 3218659 3172272 3192131 31954652017 3416469 3788427 3474660 3602448 36315432022 3667335 4459055 3807356 4063195 41332052027 3918200 5248399 4170359 4583299 47093792032 4169066 6177472 4563669 5173269 53705712037 4419931 7271010 4987287 5845470 61291492042 4670796 8558126 5441213 6614461 69996702047 4921662 10073088 5925446 7497375 7999267
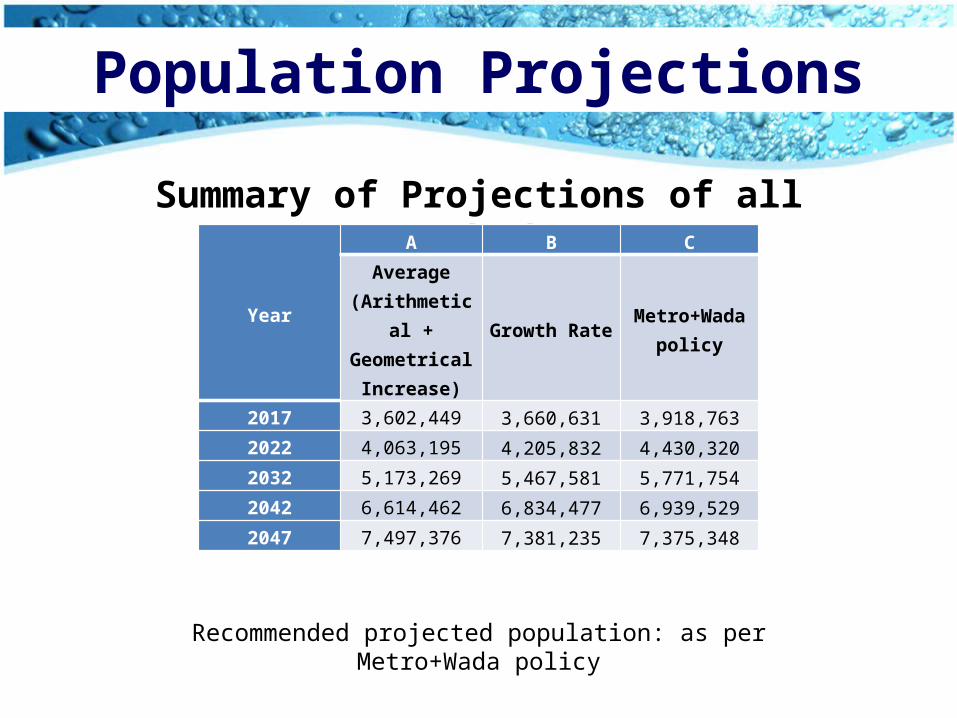
Summary of Projections of all Methods
Recommended projected population: as per Metro+Wada policy
Population Projections
Year
A B C
Average (Arithmetical +
Geometrical Increase)
Growth Rate Metro+Wada policy
2017 3,602,449 3,660,631 3,918,7632022 4,063,195 4,205,832 4,430,3202032 5,173,269 5,467,581 5,771,7542042 6,614,462 6,834,477 6,939,5292047 7,497,376 7,381,235 7,375,348

What is Metro & Wada Policy?
Assumption for Metro and Wada Policy
Sr. No. Metro Policy Wada Policy
1 In Metro Policy the area within 500m distance on either side of the metro route will have the floor space index (FSI)of 4.
This policy is applicable for peth areas. For water supply purpose, these areas come under command of Parvati LLR and MLR zones. In this, those houses/wadas coming together to form minimum plot size will be given 3 FSI.
2Out of this 4 FSI, 2 FSI will be for residential purpose and 2 FSI will be for Commercial development.
Out of this 3 FSI, 2 FSI is for residential Purpose and 1 FSI will be for Commercial purpose.
3 The Additional FSI will be given only after the starting of the work of metro.
Those who do not want come together and Consolidate to a minimum plot size, they may develop with existing allowable FSI of 1.
4 Phases of Metro: 4.1 Phase 1: Ramwadi to Vanaz 4.2 Phase 2: Swargate to Chinchwad 4.3 Phase 3: Other Links
Wada Policy?
Metro Policy?

Water Demand
Year
Net Demand (MLD)System Losses
Gross Demand (MLD)
PMCPune
Canton_ ment
Khadki Canton_
ment Total PMC
Pune Canton_
ment
Khadki Canton_
ment Total
2017 712.63 12.53 12.06 737.28 30% 1018.14 17.91 17.22 1053.272022 926.97 12.53 12.06 951.56 20% 1158.83 15.66 15.07 1189.562032 1231.99 12.53 12.06 1256.58 15% 1449.41 14.75 14.18 1478.342042 1431.64 12.53 12.06 1456.23 15% 1684.27 14.75 14.18 1713.202047 1596.71 12.53 12.06 1621.30 15% 1877.67 14.75 14.18 1906.60
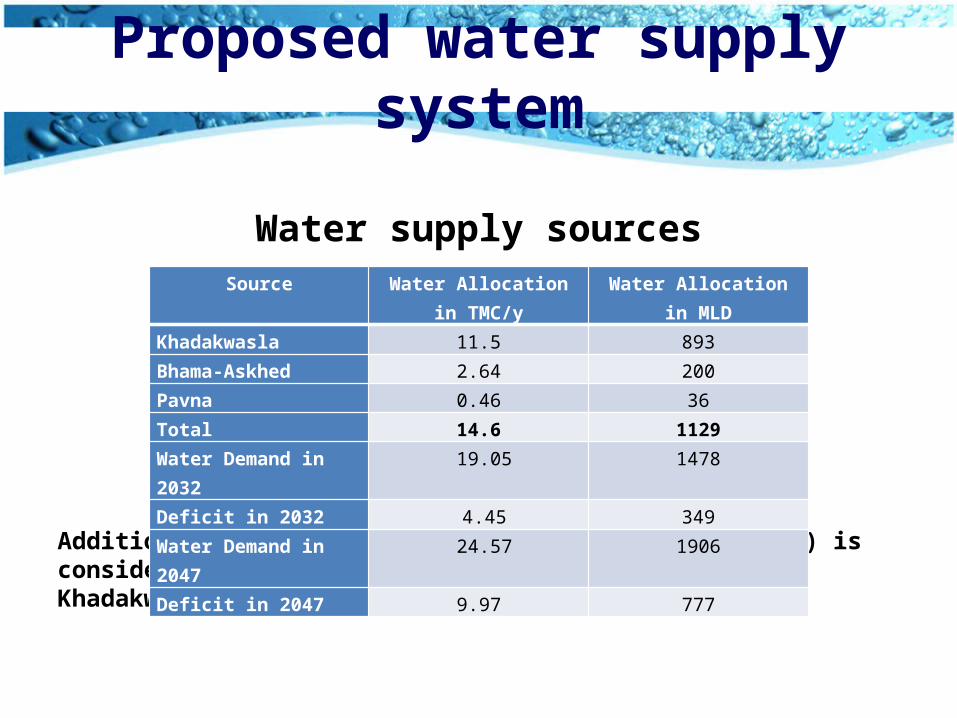
Water supply sources
Additional supply of 85 MLD (increased up to 285 MLD) is considered from Bhama-Askhed, and remaining from the Khadakwasla system
Proposed water supply system
Source Water Allocation in TMC/y
Water Allocation in MLD
Khadakwasla 11.5 893Bhama-Askhed 2.64 200Pavna 0.46 36Total 14.6 1129Water Demand in 2032 19.05 1478Deficit in 2032 4.45 349Water Demand in 2047 24.57 1906Deficit in 2047 9.97 777

THE WTP CAPACITIES AND DEMANDSSupply Zone NO.
LOCATION
CAPACITY IN MLD WTP CAPACITY DEMAND
ExistingUnder
construc tion
To be re-
placed
To be built in Stage 1
To be built in Stage 2
Year 2032
Year 2047
Year 2032
Year 2047
1 Chikhali / Bhama Askhed (Pavana) 36 200 85 200+36 285+36 214.68 306.542 Holkar 45 45 45 31.19 33.01
3
Cantonment-stage 1 260
70.8** 357.47Cantonment stage 2 (**) 100 100 100 Cantonment stage 3 300 300
Sub Total Cantonment 360 300 100 400
4
Parvati stage 1 220 220
456.25 390.73Parvati stage 2 315 315 Parvati stage 3 500 500 500
Sub Total Parvati 535 535 500 500 500
5
Vadgaon stage 1 125 12 137 137
277.45 356.71Vadgaon stage 2 125 125 125Vadgaon stage 3 * 125 125 125
Sub Total Vadgaon 125 262 387 387
6
Warje stage 1 9 9 9
428.49 461.96Warje stage 2 186 186 186Warje stage 3 200 200 200
Sub Total Warje 195 200 395 395TOTAL PMC 1296 200 535 962 385 1662 2042 1478.9 1906.4
Note (*) Vadgaon Stage 3 should be built before 2026Note (**) Supply to Cantonmnet area shall come from Parvati WTP up to 2032, until Future 300 MLD WTP is
constructed.
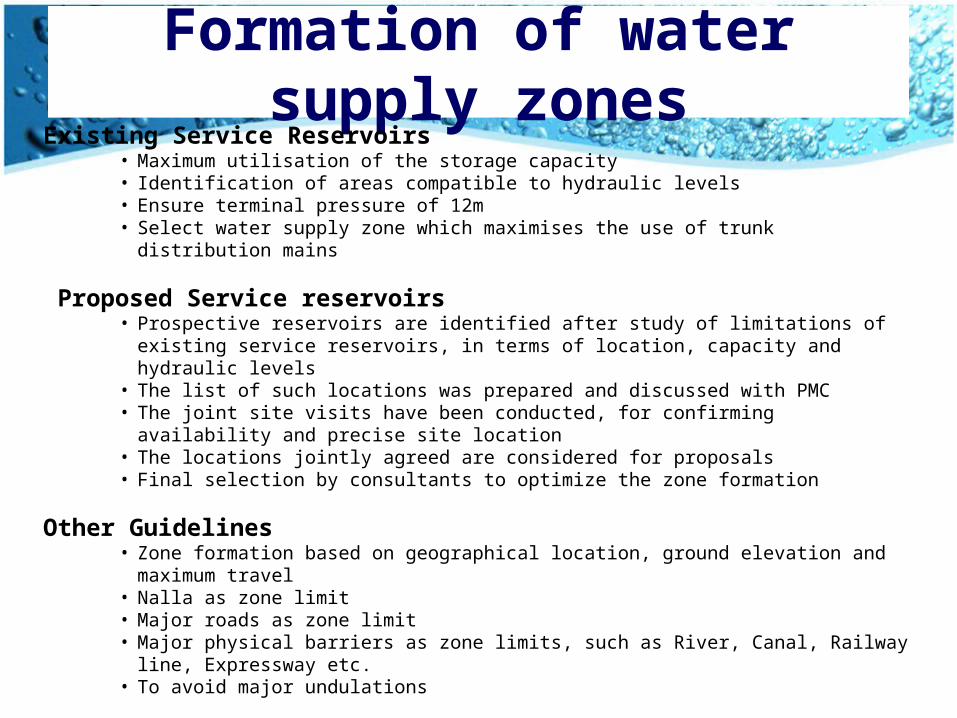
Formation of water supply zones
Existing Service Reservoirs• Maximum utilisation of the storage capacity• Identification of areas compatible to hydraulic levels• Ensure terminal pressure of 12m• Select water supply zone which maximises the use of trunk distribution mains
Proposed Service reservoirs
• Prospective reservoirs are identified after study of limitations of existing service reservoirs, in terms of location, capacity and hydraulic levels
• The list of such locations was prepared and discussed with PMC• The joint site visits have been conducted, for confirming availability and precise site location• The locations jointly agreed are considered for proposals• Final selection by consultants to optimize the zone formation
Other Guidelines
• Zone formation based on geographical location, ground elevation and maximum travel• Nalla as zone limit• Major roads as zone limit• Major physical barriers as zone limits, such as River, Canal, Railway line, Expressway etc.• To avoid major undulations
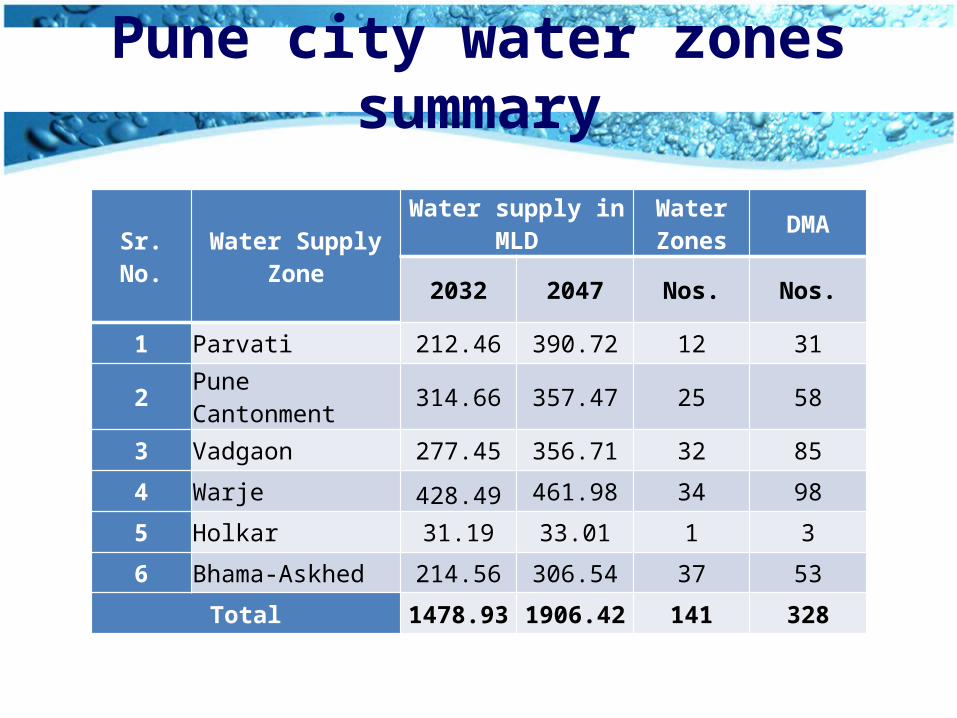
Pune city water zones summary
Sr. No. Water Supply ZoneWater supply in MLD Water
Zones DMA
2032 2047 Nos. Nos.
1 Parvati 212.46 390.72 12 31
2 Pune Cantonment 314.66 357.47 25 58
3 Vadgaon 277.45 356.71 32 85
4 Warje 428.49 461.98 34 98
5 Holkar 31.19 33.01 1 3
6 Bhama-Askhed 214.56 306.54 37 53
Total 1478.93 1906.42 141 328

SR. No. Zone Name
Existing (Count)
Proposed (Count)
Total Count
Existing Capacity (ML)
Proposed Capacity (ML)
Total Capacity (ML)
Total 33% Capacity
Required as per 2047 Demand
ESR GSR ESR GSR SRs ESR GSR ESR GSR ESR+GSR
1 Parvati - - - 7 9 3 19 - - - 33.66 33.00 29.50 96.16 92.52
2 Warje old - - - 1 1 - - - 2 - - - 2.30 1.00 - - - 3.30 3.98
3 Warje New - - - 14 14 6 34 - - - 99.96 42.50 40.50 182.96 182.94
4 Cantonment 6 6 14 1 27 13.45 36.45 50.00 32.00 131.9 132.83
5 Bhama Askhed 12 - - - 28 - - - 40 17.94 - - - 69.50 - - - 87.44 81.43
6 Vadgaon 3 9 15 10 37 3.00 43.61 39.00 40.00 125.61 117.71
7 Holkar - - - - - - 2 - - - 2 - - - - - - 6.50 - - - 7 6.21
Total 21 37 83 20 161 34.39 215.98 241.50 142.00 634.37 617.63
Total Count (ESR+GSR) 58 103 161 249.78 383.50
SUMMARY OF SERVICE RESERVOIRSPLANNED TO BE USED FOR YEAR 2047
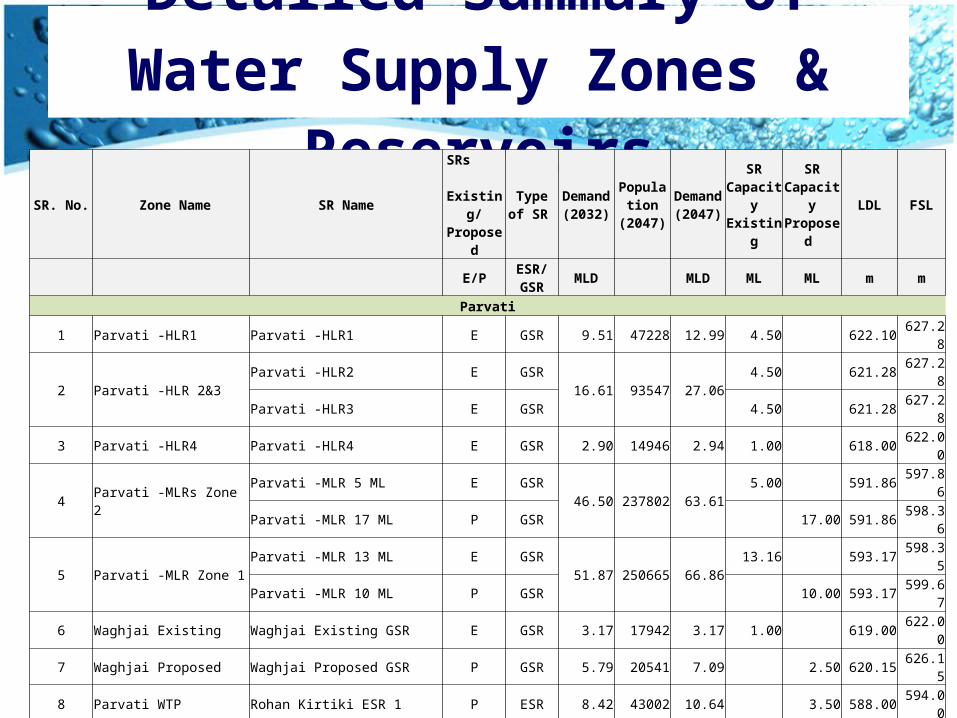
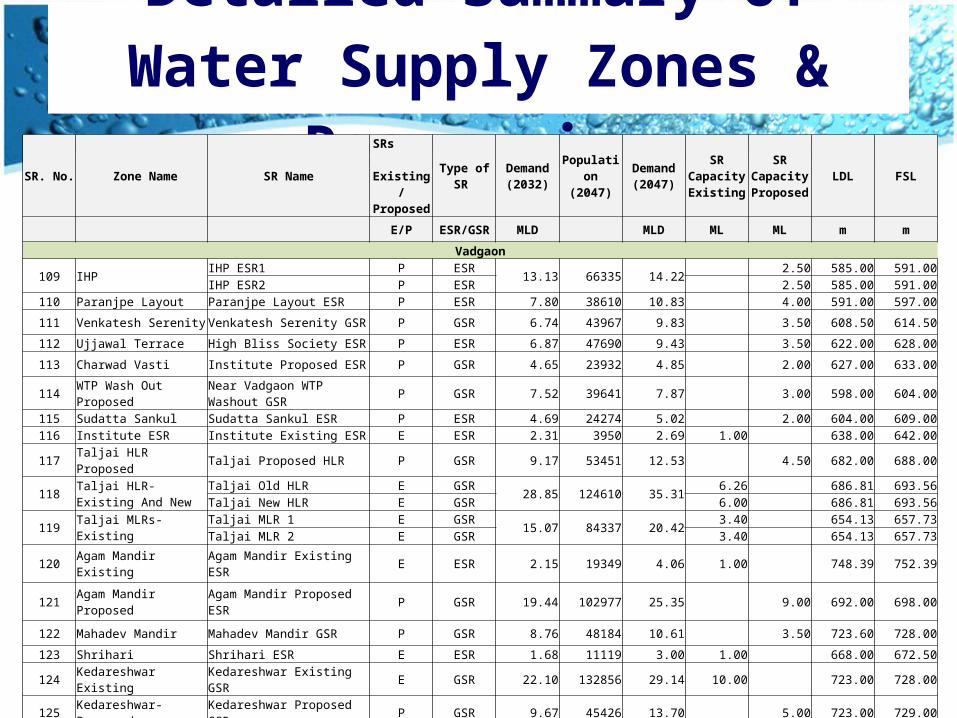
Detailed Summary of Water Supply Zones & Reservoirs
SR. No. Zone Name SR NameSRs Existing/ Proposed
Type of SR
Demand (2032)
Population (2047)
Demand (2047)
SR Capacity Existing
SR Capacity
Proposed LDL FSL
E/P ESR/GSR MLD MLD ML ML m m
Parvati1 Parvati -HLR1 Parvati -HLR1 E GSR 9.51 47228 12.99 4.50 622.10 627.28
2 Parvati -HLR 2&3Parvati -HLR2 E GSR
16.61 93547 27.064.50 621.28 627.28
Parvati -HLR3 E GSR 4.50 621.28 627.283 Parvati -HLR4 Parvati -HLR4 E GSR 2.90 14946 2.94 1.00 618.00 622.00
4 Parvati -MLRs Zone 2Parvati -MLR 5 ML E GSR
46.50 237802 63.615.00 591.86 597.86
Parvati -MLR 17 ML P GSR 17.00 591.86 598.36
5 Parvati -MLR Zone 1Parvati -MLR 13 ML E GSR
51.87 250665 66.8613.16 593.17 598.35
Parvati -MLR 10 ML P GSR 10.00 593.17 599.676 Waghjai Existing Waghjai Existing GSR E GSR 3.17 17942 3.17 1.00 619.00 622.00
7 Waghjai Proposed Waghjai Proposed GSR P GSR 5.79 20541 7.09 2.50 620.15 626.15
8 Parvati WTP Rohan Kirtiki ESR 1 P ESR 8.42 43002 10.64 3.50 588.00 594.00
9 P L Deshpande Garden Rohan Kirtiki ESR 2 P ESR 11.60 59289 14.67 4.50 584.00 590.00
10 Saras Baugh
Swargate Police Line Proposed ESR 1 P ESR
17.98 71018 20.90 3.50 590.00 596.10
Swargate Police Line Proposed ESR 2 P ESR 3.50 590.00 596.10
11 ShaniwarwadaSwargate WW ESR 1 P ESR
24.48 117527 33.44 4.00 589.00 595.00
Swargate WW ESR 2 P ESR 4.00 589.00 595.00Swargate WW ESR 3 P ESR 4.00 589.00 595.00
12 Crescent High SchoolCrescent High School ESR 1 P ESR
13.63 61696 16.99 3.00 608.50 614.50
Crescent High School ESR 2 P ESR 3.00 608.50 614.50

Detailed Summary of Water Supply Zones & Reservoirs
SR. No. Zone Name SR NameSRs Existing/ Proposed
Type of SR Demand (2032)
Population (2047)
Demand (2047)
SR Capacity Existing
SR Capacity
Proposed LDL FSL
E/P ESR/GSR MLD MLD ML ML m m
Warje old
13 Ahire Gaon Ahire Gaon ESR (Reconstruct) P ESR 1.98 12344 2.91 1.00 605.00 611.00
14 Warje Malwadi Warje Old WTP Pure Water Sump E GSR 2.29 12042 2.87 2.30 624.90 628.0015 Atul Nagar 5.02 33114 6.30
Warje New
16 Ramnagar Ramnagar ESR (Reconstruct) P ESR 4.69 28072 5.11 2.00 611.00 617.00
17 Dukkarkhind Dukkarkhind ESR (Reconstruct) P ESR 5.26 25657 6.60 2.50 616.00 622.50
18 Kumbharwadi Kumbharwadi GSR E GSR 2.71 13861 3.96 1.25 593.30 598.30
19 Karve Nagar Warje WTP GSR (U.C.) E GSR 26.75 141442 36.11 12.00 591.00 597.00
20 Gandhibhavan Zone 1 Gandhibhavan Old GSR E GSR 15.52 83262 19.87 6.40 636.00 641.00
21 Gandhibhavan Zone 2 Gandhibhavan New GSR E GSR 13.16 63651 19.93 6.40 636.00 641.00
22 Chandani Chowk Zone 1 Chandani Chowk Old GSR E GSR 18.53 115819 25.82 8.50 665.00 670.00
23 Chandani Chowk Zone 2Chandani Chowk New GSR E GSR
42.58 206703 52.538.50 657.07 665.07
Chandani Chowk Proposed GSR P GSR 9.00 657.07 665.07
24 Ideal Colony / MIT College SNDT Proposed HLR P GSR 11.25 60158 13.73 4.50 617.00 623.00
25 Pune University - 4.30 5.88
26 WakdewadiKhairewasti ESR 1 P ESR
24.23 69346 26.49 4.00 582.00 588.00
Khairewasti ESR 2 P ESR 4.00 582.00 588.00
27 Pashan LakePashan Proposed ESR 1 P ESR
13.38 84392 17.63 3.00 600.44 606.44
Pashan Proposed ESR 2 P ESR 3.00 600.44 606.44
28 Sus Sutarwadi SUS Old GSR E GSR 11.92 72843 13.77 4.50 653.00 657.0029 Baner Hill SUS New GSR E GSR 5.39 49096 10.03 3.50 654.10 660.1030 Baner Gaon Zone 1 Pancard Club GSR E GSR 8.02 71228 14.65 5.00 598.00 605.50

Detailed Summary of Water Supply Zones & Reservoirs
SR. No. Zone Name SR NameSRs Existing/ Proposed
Type of SR Demand (2032)
Population (2047)
Demand (2047)
SR Capacity Existing
SR Capacity
Proposed LDL FSL
E/P ESR/GSR MLD MLD ML ML m m
Warje New
31 Baner Gaon Zone 2 Pashan Baner Link Road ESR P ESR 4.95 44670 8.78 3.00 595.20 601.20
32 BalewadiBalewadi Jakat Naka ESR 1 P ESR
8.83 81827 16.46 3.00 590.00 596.00
Balewadi Jakat Naka ESR 2 P ESR 2.50 590.00 596.00
33 Baner West Green Zone Baner ESR P ESR 5.54 42550 10.00 3.50 615.00 621.00
34 Ram Nagar/ Laxman Nagar Sun Horizon ESR P ESR 7.01 55642 12.68 4.50 589.00 595.00
35 Panchavati Panchvati GSR P GSR 3.11 24136 5.71 2.00 641.00 647.0036 SNDT HLR SNDT Existing HLR E GSR 34.24 133791 38.71 13.16 620.00 625.4637 SNDT MLR SNDT MLR E GSR 28.85 106308 33.89 11.35 591.33 596.83
38 Bhosale Nagar Pune University GSR (Reconstruct) P GSR 15.20 64620 18.35 6.00 603.00 611.00
39 Gokhale Nagar Mafco Proposed GSR (Reconstruct) P GSR 12.29 71039 17.85 6.00 610.30 616.80
40 Chatushrungi Temple Asha Nagar ESR P ESR 5.61 28607 6.19 2.00 618.00 625.00
41 BMCC College FC Proposed ESR 1 (Reconstruct) P ESR 4.39 15920 5.12 2.00 595.00 601.00
42 Modern College FC Proposed GSR (Reconstruct) P GSR 32.70 118685 38.17 13.00 586.00 592.50
43 Fergusson College FC ESR 2 P ESR 7.26 36412 9.83 3.50 600.00 606.00
44 Chatushrungi Zone 1 Chatushringi Old GSR E GSR 8.33 37807 12.97 4.50 604.38 608.38
45 Chatushrungi Zone 2 Chatushringi New GSR E GSR 20.33 127449 34.30 8.40 604.38 608.38
46 Ganesh Khind/Aundh Chaturshringi GSR Under Construction E GSR 12.87 70194 19.14 6.50 601.88 606.88

Detailed Summary of Water Supply Zones & Reservoirs
SR. No. Zone Name SR NameSRs Existing/ Proposed
Type of SR Demand (2032)
Population (2047)
Demand (2047)
SR Capacity Existing
SR Capacity
Proposed LDL FSL
E/P ESR/GSR MLD MLD ML ML m m
Cantonment
47 Ram Tekdi Ram Tekdi existing GSR E GSR 22.32 71465 27.93 9.00 642.00 646.00
48 Hadapsar Industrial Colony Ram Tekdi tendered GSR E GSR 14.35 58820 18.30 6.00 638.00 646.00
49 Magarpatta - P GSR 10.21 87711 15.89
50 Indraprastha Indraprashta ESR E ESR 2.41 12772 3.76 1.25 592.70 596.70
51 Satavwadi Tukai Tekdi New GSR E GSR 8.26 44513 11.19 4.00 610.70 616.70
52 Gliding Centre Tukai Tekdi ESR (Reconstruct) P ESR 9.85 47610 10.88 3.50 611.00 617.00
53 AkashwaniAnand Nagar ESR1 P ESR
13.76 85694 20.84 3.50 589.00 595.00
Anand Nagar ESR2 P ESR 3.50 589.00 595.00
54 Sadhana Vidyalaya Anand Nagar ESR3 P ESR 9.07 56529 13.75 4.50 585.00 591.00
55 Hadapsar Gaon Hadapsar Bus Depot ESR P ESR 9.40 58541 14.24 4.50 587.00 593.00
56 Bakari Hill Zone 1 Bakari Hill Old GSR E GSR 13.07 62145 15.97 6.00 639.50 644.00
57 Bakari Hill Zone 2 Bakari Hill New GSR (U.C.) E GSR 13.60 64636 16.61 6.00 639.12 643.62
58 Kale Borate Nagar Selen Park ESR P ESR 6.47 28953 7.03 2.50 612.40 618.40
59 Badade Mala Bhujbal Scheme ESR P ESR 7.68 49590 9.70 3.50 615.54 621.54
60 Koregaon ParkCantonment WTP ESR 1 P ESR
16.31 85735 21.22 3.50 583.00 589.00
Cantonment WTP ESR 2 P ESR 3.50 583.00 589.00

Detailed Summary of Water Supply Zones & Reservoirs
SR. No. Zone Name SR NameSRs Existing/ Proposed
Type of SR
Demand (2032)
Population (2047)
Demand (2047)
SR Capacity Existing
SR Capacity
Proposed LDL FSL
E/P ESR/GSR MLD MLD ML ML m m
Cantonment
61 Jalmandir Cantonment Jalmandir GSR (Reconstruct) P GSR 60.91 184766 92.67 32.00 575.00 580.55
62 Ghorpadi Wanori HLR Circular E GSR 11.37 77494 13.97 5.45 607.13 612.80
63 Mundhwa Gaon Zone 1 Ghorpadi Sicilia ESR 1 P ESR 7.75 74184 13.59 4.50 580.54 587.04
64 Mundhwa Gaon Zone 2Ghorpadi Sicilia ESR 2 P ESR
8.66 82864 15.18 2.50 580.54 587.04
Ghorpadi Sicilia ESR 3 P ESR 2.50 580.54 587.04
65 Kharadi Zone 1 Kharadi ESR Under Construction E ESR 5.74 27022 6.43 2.50 583.63 588.63
66 Kharadi Zone 2 Kharadi Existing ESR E ESR 7.46 29999 7.84 2.50 583.63 588.63
67 Kharadi Zone 3/ Khulewadi Kharadi Proposed ESR P ESR 12.77 50084 13.86 4.50 588.00 594.00
68 Kharadi Bypass Kharadi bypass ESR P ESR 8.18 36853 10.44 3.50 578.00 584.00
69 Wadgaon Sheri Zone 4 Chandan Nagar ESR 1 (3.5 ML) E ESR 9.71 45425 9.99 3.50 578.00 583.50
70 Chandan Nagar Zone 1 Chandan Nagar ESR 3 (1.5 ML) E ESR 4.28 18748 4.53 1.50 590.82 595.82
71 Chandan Nagar Zone 2 Chandan Nagar ESR 2 (2.2 ML) E ESR 6.32 24867 6.69 2.20 584.30 588.80

Detailed Summary of Water Supply Zones & Reservoirs
SR. No. Zone Name SR NameSRs Existing/ Proposed
Type of SR Demand (2032)
Population (2047)
Demand (2047)
SR Capacity Existing
SR Capacity Proposed LDL FSL
E/P ESR/GSR MLD MLD ML ML m m
Bhama Askhed
72 Undevelop Area Dhanori Dhanori Undeveloped Area ESR P ESR 4.70 38906 8.72 3.00 631.00 637.00
73 Dhanori Zone 1 Dhanori Proposed ESR 2 P ESR 3.23 21452 4.20 2.00 609.63 615.63
74 Dhanori Zone 2 Dhanori Existing ESR E ESR 2.46 15035 3.20 1.00 605.50 610.50
75 Gokul Nagar Dhanori Proposed ESR 1 P ESR 5.55 33598 6.32 2.50 610.00 616.00
76 Munjaba wasti Munjaba Wasti ESR P ESR 4.58 30279 5.88 2.00 603.59 609.59
77 Lohegaon Lake Zone 1 Dhanori Proposed ESR 3 P ESR 3.16 17455 4.66 2.00 610.00 616.00
78 Lohegaon Lake Zone 2 B U Bhandari ESR E ESR 2.30 28146 3.39 1.50 613.00 618.00
79 Ganesh Nagar - NA NA 1.15 6177 1.15 NA
80 Mhaske Wasti Mhaske Wasti ESR E ESR 0.45 2414 0.45 0.14 578.00 582.00
81 Kusmade Wasti Kusmade Wasti ESR (Reconstruct) P ESR 2.86 14908 2.95 0.73 570.00 576.00
82 VishrantwadiVishrantwadi ESR 1 P ESR
10.26 56784 11.12 2.00 578.00 584.00
Vishrantwadi ESR 2 P ESR 2.00 578.00 584.00
83 Gurudwara WastiHaran Tala ESR 1 P ESR
5.79 55406 9.93 2.00 616.00 622.00
Haran Tala ESR 2 P ESR 1.50 616.00 622.0084 Tingre Nagar Tingre Nagar ESR P ESR 3.08 16516 3.08 2.00 581.00 587.0085 Vidya Nagar Vidya Nagar ESR E ESR 4.04 24057 4.57 1.60 586.37 591.37
86 MHB Zone 1 MHB existing ESR 1 (2 ML) E ESR 5.66 18174 6.20 2.00 586.00 591.00
87 MHB Zone 2 MHB Proposed ESR P ESR 7.81 29066 8.56 3.00 581.00 587.00
88 Shastri Nagar MHB existing ESR 2 (1 ML) E ESR 3.00 12077 3.29 1.00 588.00 593.00

Detailed Summary of Water Supply Zones & Reservoirs
SR. No. Zone Name SR NameSRs Existing/ Proposed
Type of SR Demand (2032)
Population (2047)
Demand (2047)
SR Capacity Existing
SR Capacity Proposed LDL FSL
E/P ESR/GSR MLD MLD ML ML m mBhama Askhed
89 Wadgaon Sheri Zone 1 Wadgaon Sheri Proposed ESR 1 P ESR 7.31 31357 7.63 2.50 581.00 587.00
90 Wadgaon Sheri Zone 2 Bishop School ESR 1 P ESR 8.53 38717 10.00 3.50 575.00 581.00
91 Wadgaon Sheri Zone 3 Wadgaon Sheri Proposed ESR 2&3
P ESR7.70 32439 8.08
2.00 587.00 593.00P ESR 2.00 587.00 593.00
92 Wadgaon Sheri Zone 5 Bishop School ESR 2 P ESR 6.32 34592 7.41 2.50 575.00 581.0093 Sanjay Park Zone 1 Vegetable Market ESR 1 P ESR 12.76 52472 13.49 4.50 600.00 606.0094 Sanjay Park Zone 2 Vegetable Market ESR 2 P ESR 12.24 56787 12.93 4.50 600.00 606.00
95 Viman Nagar Zone 1 (2.50 ML) Viman Nagar existing ESR1 (2.5 ML) E ESR 7.76 30442 7.98 2.50 589.00 592.00
96 Viman Nagar Zone 2 (1.00 ML) Viman Nagar existing ESR2 (1 ML) E ESR 3.37 8556 3.44 1.00 590.00 594.00
97 Viman Nagar Zone 3 Viman Nagar Proposed ESR P ESR 8.83 26435 9.35 3.00 588.00 594.00
98 Commerzone IT Park Yerwada Thakarsi ESR 1 (Reconstruct 2.5 to 3.5 ML) P ESR 9.33 29397 10.59 3.50 582.22 588.22
99 Sangamwadi Sangamwadi ESR P ESR 7.70 42212 7.90 3.00 572.00 578.00100 Laxmi Nagar/Ram Nagar Thakarsi Proposed ESR 4 P ESR 8.94 49690 9.07 3.00 582.22 588.22101 Navi Khadki Yerwada K. Bhaurao Patil ESR P ESR 3.73 16394 3.85 1.50 581.00 587.00
102 Kashmiri Colony Thakarsi ESR 2 (Reconstruct 2.5 to 4.0 ML) P ESR 10.98 51724 11.37 4.00 582.00 588.00
103 Kalyani Nagar Thakarsi Existing ESR 3 E ESR 5.91 18732 6.29 2.60 582.00 588.00104 Digambar Nagar Tempo Chowk ESR 1 E ESR 3.98 19365 5.84 1.50 578.80 582.80105 Tempo Chowk Tempo Chowk ESR 2 E ESR 3.72 19349 3.84 1.50 578.80 582.80106 Sundrabai Marathe Sundrabai Marathe ESR E ESR 4.54 20163 5.13 1.60 588.43 592.80107 Sainath Nagar Sainath Nagar ESR P ESR 5.00 25275 5.76 2.00 568.00 574.00
108 Bhange WastiBhange Wasti ESR 1 P ESR
5.95 41037 9.14 2.00 576.00 582.00
Bhange Wasti ESR 2 P ESR 1.00 576.00 582.00
Detailed Summary of Water Supply Zones & Reservoirs
SR. No. Zone Name SR NameSRs Existing/ Proposed
Type of SR Demand (2032)
Population (2047)
Demand (2047)
SR Capacity Existing
SR Capacity Proposed LDL FSL
E/P ESR/GSR MLD MLD ML ML m m
Vadgaon
109 IHP IHP ESR1 P ESR 13.13 66335 14.22 2.50 585.00 591.00IHP ESR2 P ESR 2.50 585.00 591.00
110 Paranjpe Layout Paranjpe Layout ESR P ESR 7.80 38610 10.83 4.00 591.00 597.00
111 Venkatesh Serenity Venkatesh Serenity GSR P GSR 6.74 43967 9.83 3.50 608.50 614.50
112 Ujjawal Terrace High Bliss Society ESR P ESR 6.87 47690 9.43 3.50 622.00 628.00
113 Charwad Vasti Institute Proposed ESR P GSR 4.65 23932 4.85 2.00 627.00 633.00
114 WTP Wash Out Proposed Near Vadgaon WTP Washout GSR P GSR 7.52 39641 7.87 3.00 598.00 604.00
115 Sudatta Sankul Sudatta Sankul ESR P ESR 4.69 24274 5.02 2.00 604.00 609.00116 Institute ESR Institute Existing ESR E ESR 2.31 3950 2.69 1.00 638.00 642.00117 Taljai HLR Proposed Taljai Proposed HLR P GSR 9.17 53451 12.53 4.50 682.00 688.00
118 Taljai HLR- Existing And New
Taljai Old HLR E GSR 28.85 124610 35.31 6.26 686.81 693.56Taljai New HLR E GSR 6.00 686.81 693.56
119 Taljai MLRs- Existing Taljai MLR 1 E GSR 15.07 84337 20.42 3.40 654.13 657.73Taljai MLR 2 E GSR 3.40 654.13 657.73
120 Agam Mandir Existing Agam Mandir Existing ESR E ESR 2.15 19349 4.06 1.00 748.39 752.39
121 Agam Mandir Proposed Agam Mandir Proposed ESR P GSR 19.44 102977 25.35 9.00 692.00 698.00
122 Mahadev Mandir Mahadev Mandir GSR P GSR 8.76 48184 10.61 3.50 723.60 728.00
123 Shrihari Shrihari ESR E ESR 1.68 11119 3.00 1.00 668.00 672.50
124 Kedareshwar Existing Kedareshwar Existing GSR E GSR 22.10 132856 29.14 10.00 723.00 728.00
125 Kedareshwar-Proposed Kedareshwar Proposed GSR P GSR 9.67 45426 13.70 5.00 723.00 729.00
126 Kondhwa Road Shivneri Nagar ESR P ESR 7.31 43507 9.30 3.50 675.00 681.00
127 Sai Baba Nagar Steel Yard ESR P ESR 12.33 66379 12.68 4.50 682.16 688.16
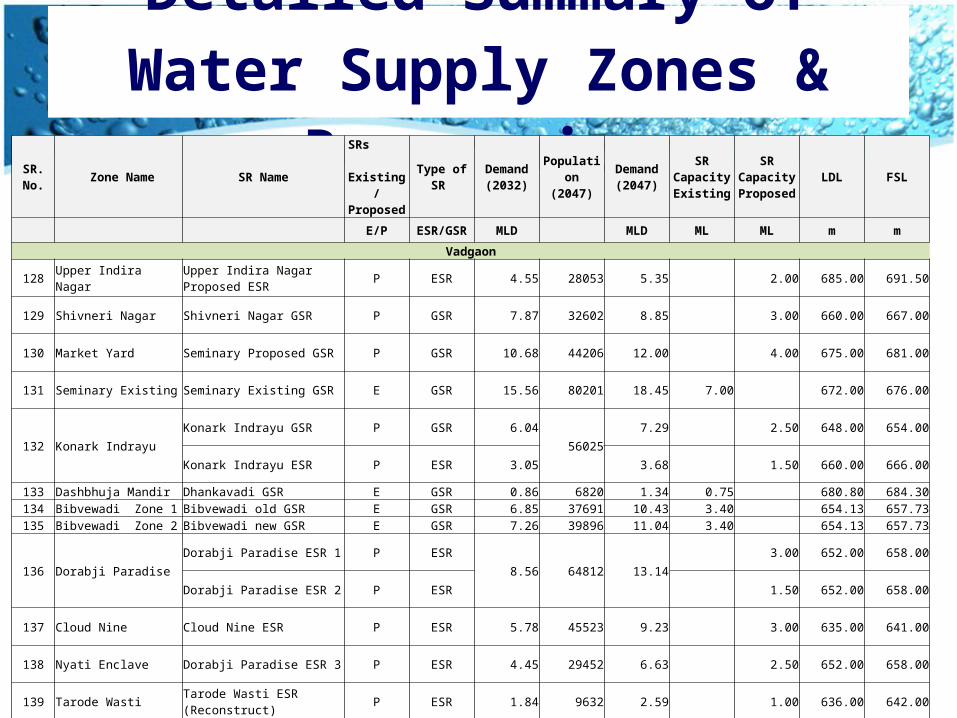
Detailed Summary of Water Supply Zones & Reservoirs
SR. No. Zone Name SR NameSRs Existing/ Proposed
Type of SR Demand (2032)
Population (2047)
Demand (2047)
SR Capacity Existing
SR Capacity Proposed LDL FSL
E/P ESR/GSR MLD MLD ML ML m m
Vadgaon
128 Upper Indira Nagar Upper Indira Nagar Proposed ESR P ESR 4.55 28053 5.35 2.00 685.00 691.50
129 Shivneri Nagar Shivneri Nagar GSR P GSR 7.87 32602 8.85 3.00 660.00 667.00
130 Market Yard Seminary Proposed GSR P GSR 10.68 44206 12.00 4.00 675.00 681.00
131 Seminary Existing Seminary Existing GSR E GSR 15.56 80201 18.45 7.00 672.00 676.00
132 Konark Indrayu
Konark Indrayu GSR P GSR 6.04
56025
7.29 2.50 648.00 654.00
Konark Indrayu ESR P ESR 3.05 3.68 1.50 660.00 666.00
133 Dashbhuja Mandir Dhankavadi GSR E GSR 0.86 6820 1.34 0.75 680.80 684.30134 Bibvewadi Zone 1 Bibvewadi old GSR E GSR 6.85 37691 10.43 3.40 654.13 657.73135 Bibvewadi Zone 2 Bibvewadi new GSR E GSR 7.26 39896 11.04 3.40 654.13 657.73
136 Dorabji Paradise
Dorabji Paradise ESR 1 P ESR
8.56 64812 13.14
3.00 652.00 658.00
Dorabji Paradise ESR 2 P ESR 1.50 652.00 658.00
137 Cloud Nine Cloud Nine ESR P ESR 5.78 45523 9.23 3.00 635.00 641.00
138 Nyati Enclave Dorabji Paradise ESR 3 P ESR 4.45 29452 6.63 2.50 652.00 658.00
139 Tarode Wasti Tarode Wasti ESR (Reconstruct) P ESR 1.84 9632 2.59 1.00 636.00 642.00
140 Mohamad Wadi Mohamad wadi ESR P ESR 3.86 31717 5.85 2.00 630.00 636.00
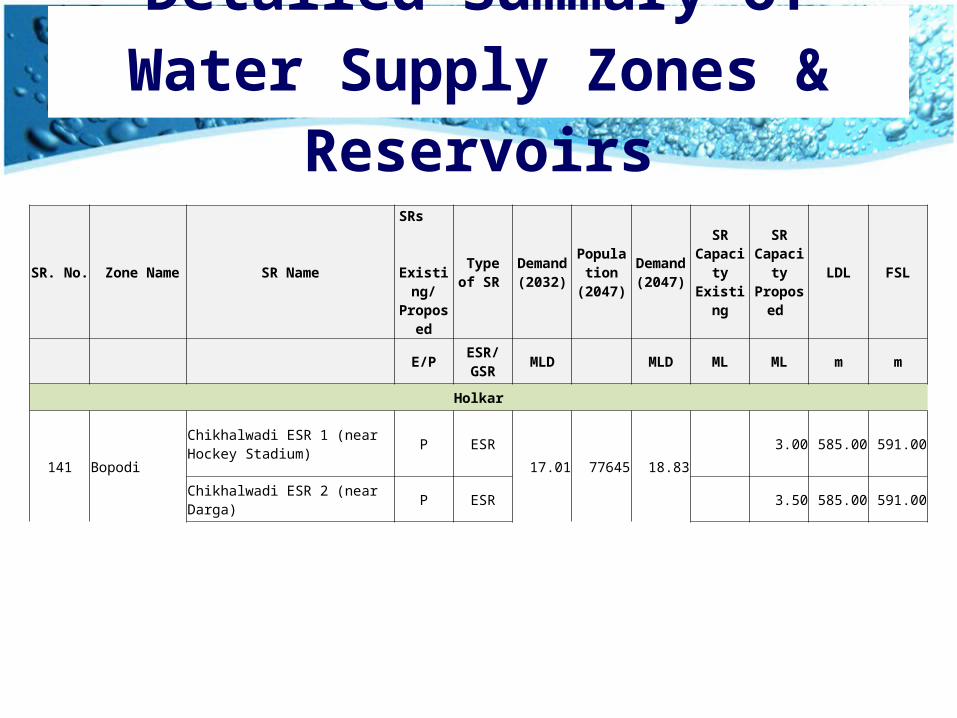
Detailed Summary of Water Supply Zones & Reservoirs
SR. No. Zone Name SR NameSRs Existing/ Proposed
Type of SR
Demand (2032)
Population (2047)
Demand (2047)
SR Capacity Existing
SR Capacity Proposed
LDL FSL
E/P ESR/GSR MLD MLD ML ML m m
Holkar
141 Bopodi
Chikhalwadi ESR 1 (near Hockey Stadium) P ESR
17.01 77645 18.83
3.00 585.00 591.00
Chikhalwadi ESR 2 (near Darga) P ESR 3.50 585.00 591.00
Clear Water Transmission System
Basic concepts in bulk transmission plan
• Maximum utilisation of the existing facilities (SRs, BPTs, sumps, pumps, and transmission mains)
• Maximum utilisation of gravity-driven systems and minimization of pumping
• Allocation of water from a WTP to SRs which are best suited in terms ofo nearness of locationo hydraulic level
• Avoid laying of pipelines through the congested areas
• Avoid to an extent possible, long and complex pipe networks
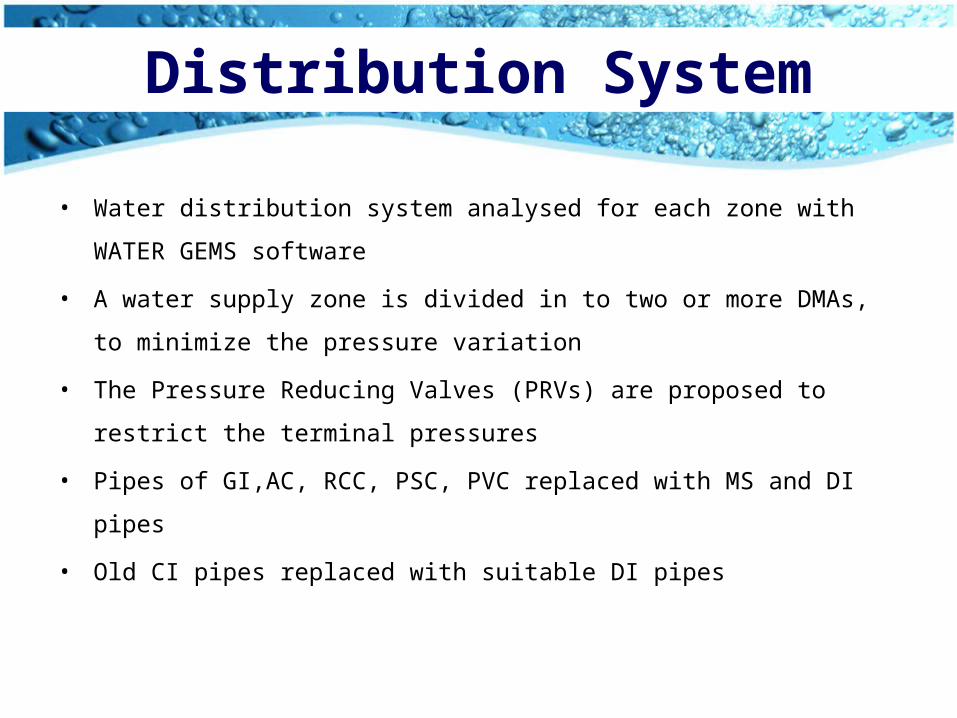
• Water distribution system analysed for each zone with WATER GEMS software
• A water supply zone is divided in to two or more DMAs, to minimize the pressure
variation
• The Pressure Reducing Valves (PRVs) are proposed to restrict the terminal
pressures
• Pipes of GI,AC, RCC, PSC, PVC replaced with MS and DI pipes
• Old CI pipes replaced with suitable DI pipes
Distribution System
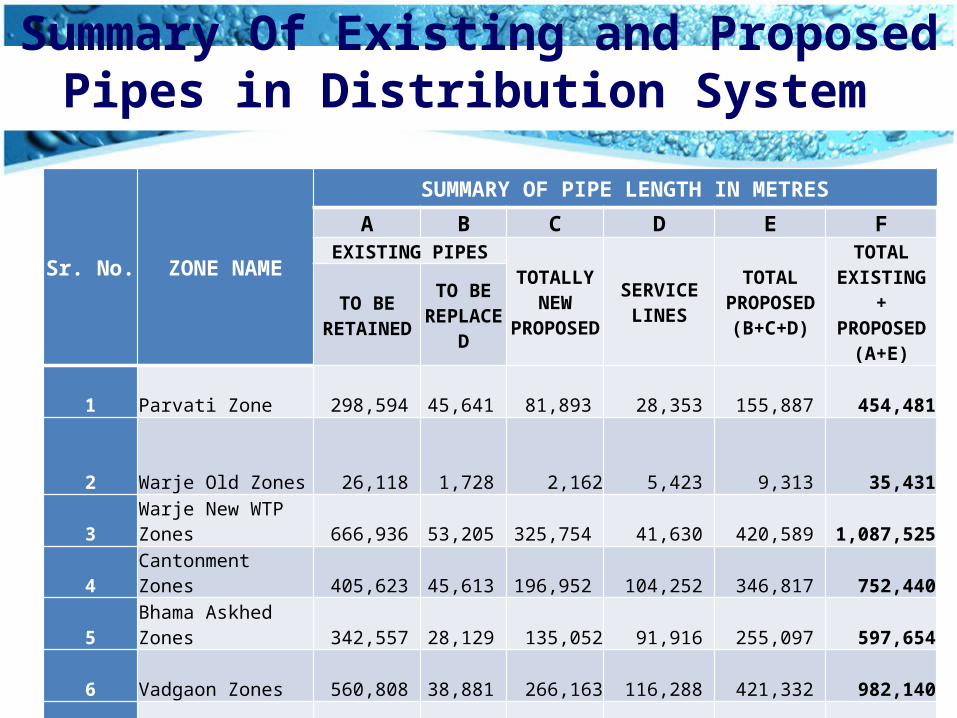
Summary Of Existing and Proposed Pipes in Distribution System
Sr. No. ZONE NAME
SUMMARY OF PIPE LENGTH IN METRES
A B C D E FEXISTING PIPES
TOTALLY NEW
PROPOSEDSERVICE
LINESTOTAL
PROPOSED (B+C+D)
TOTAL EXISTING + PROPOSED
(A+E)TO BE
RETAINEDTO BE
REPLACED
1 Parvati Zone 298,594 45,641 81,893 28,353 155,887 454,481
2 Warje Old Zones 26,118 1,728 2,162 5,423 9,313 35,431
3 Warje New WTP Zones 666,936 53,205 325,754 41,630 420,589 1,087,525
4 Cantonment Zones 405,623 45,613 196,952 104,252 346,817 752,440
5 Bhama Askhed Zones 342,557 28,129 135,052 91,916 255,097 597,654
6 Vadgaon Zones 560,808 38,881 266,163 116,288 421,332 982,140
7 Holkar Zones 25,224 5,041 3,290 1,034 9,365 34,589
Total 2,325,860 218,238 1,011,266 388,896 1,618,400 3,944,260
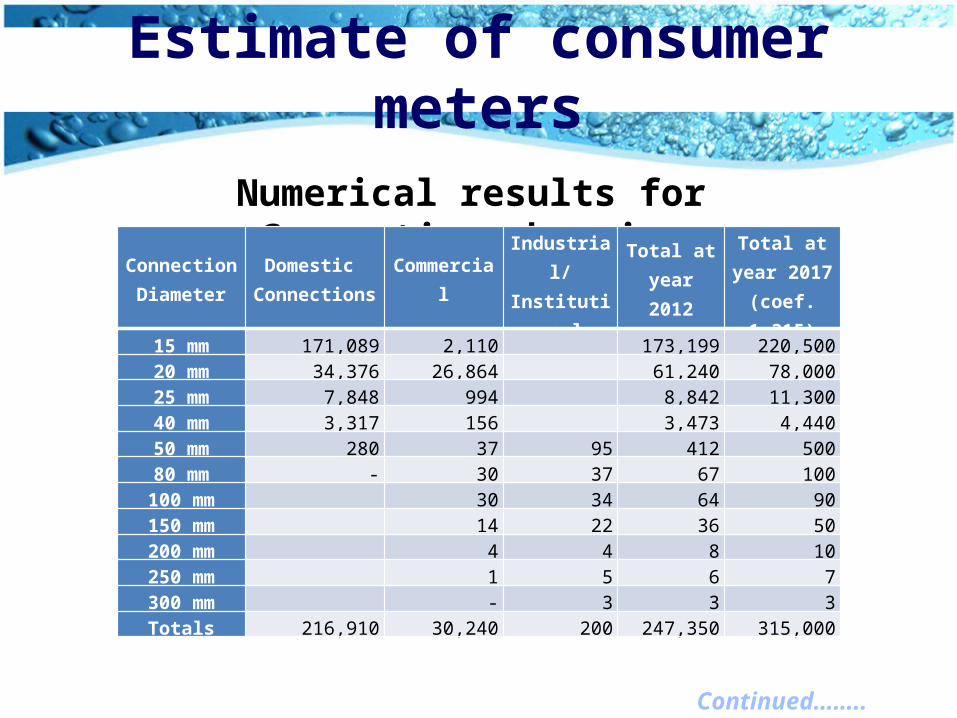
Estimate of consumer meters
Numerical results for Connections by sizeConnection Diameter
Domestic Connections Commercial Industrial/
InstitutionalTotal at year
2012
Total at year 2017
(coef. 1.315)
15 mm 171,089 2,110 173,199 220,50020 mm 34,376 26,864 61,240 78,00025 mm 7,848 994 8,842 11,30040 mm 3,317 156 3,473 4,44050 mm 280 37 95 412 50080 mm - 30 37 67 100
100 mm 30 34 64 90150 mm 14 22 36 50200 mm 4 4 8 10250 mm 1 5 6 7300 mm - 3 3 3
Totals 216,910 30,240 200 247,350 315,000
Continued……..
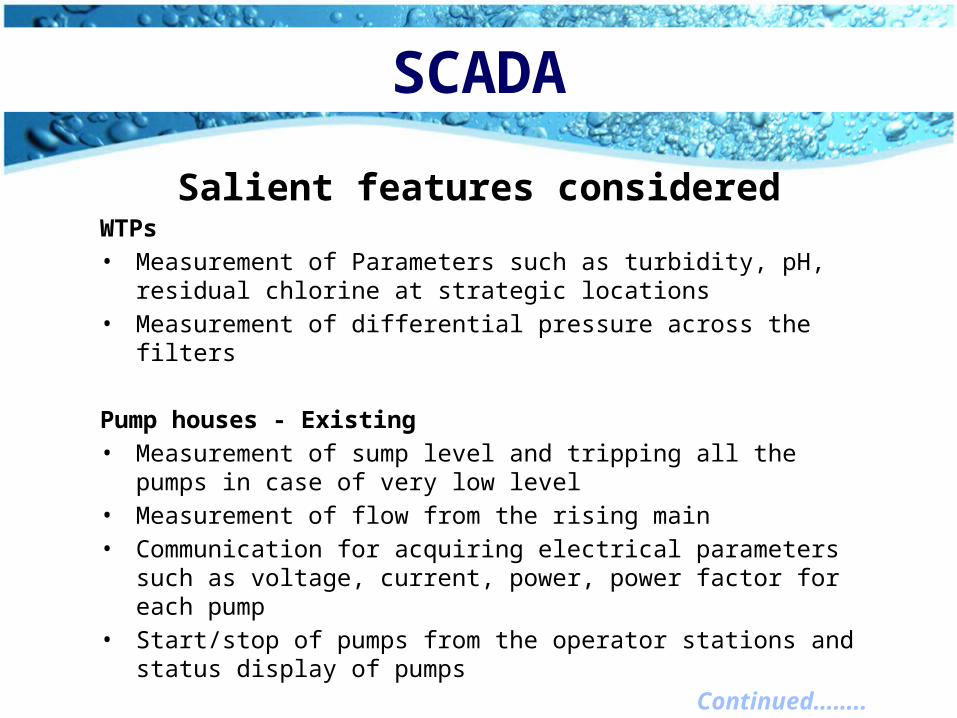
Salient features consideredWTPs • Measurement of Parameters such as turbidity, pH, residual chlorine at
strategic locations• Measurement of differential pressure across the filters
Pump houses - Existing• Measurement of sump level and tripping all the pumps in case of very low
level• Measurement of flow from the rising main• Communication for acquiring electrical parameters such as voltage,
current, power, power factor for each pump• Start/stop of pumps from the operator stations and status display of
pumps
SCADA
Continued……..
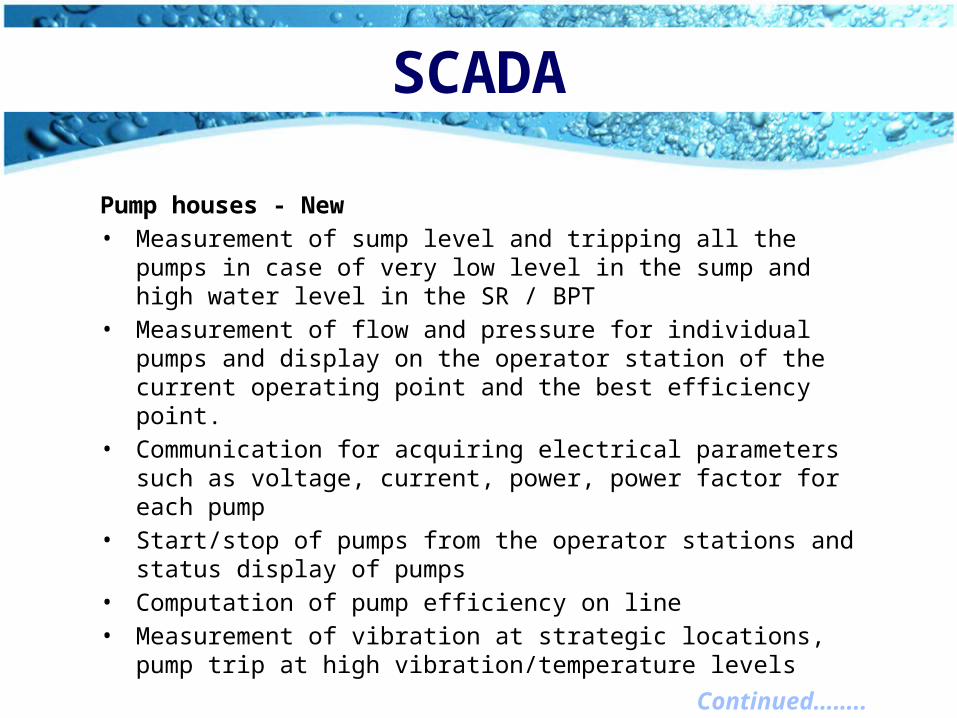
Pump houses - New• Measurement of sump level and tripping all the pumps in case of very low
level in the sump and high water level in the SR / BPT• Measurement of flow and pressure for individual pumps and display on
the operator station of the current operating point and the best efficiency point.
• Communication for acquiring electrical parameters such as voltage, current, power, power factor for each pump
• Start/stop of pumps from the operator stations and status display of pumps
• Computation of pump efficiency on line• Measurement of vibration at strategic locations, pump trip at high
vibration/temperature levels
SCADA
Continued……..
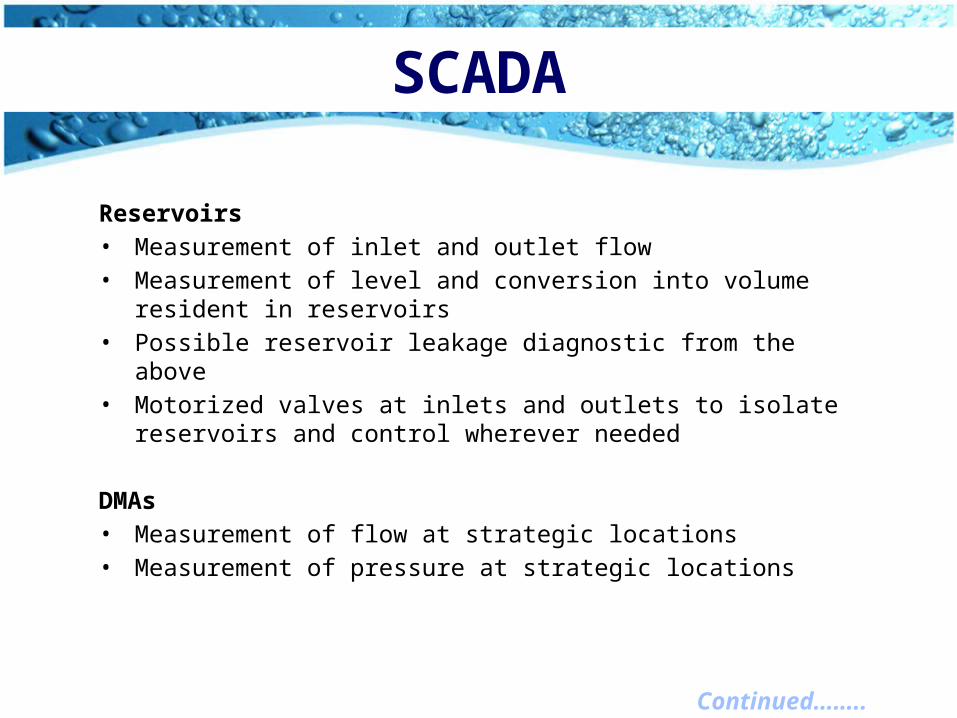
Reservoirs • Measurement of inlet and outlet flow• Measurement of level and conversion into volume resident in reservoirs• Possible reservoir leakage diagnostic from the above• Motorized valves at inlets and outlets to isolate reservoirs and control
wherever needed DMAs• Measurement of flow at strategic locations• Measurement of pressure at strategic locations
SCADA
Continued……..
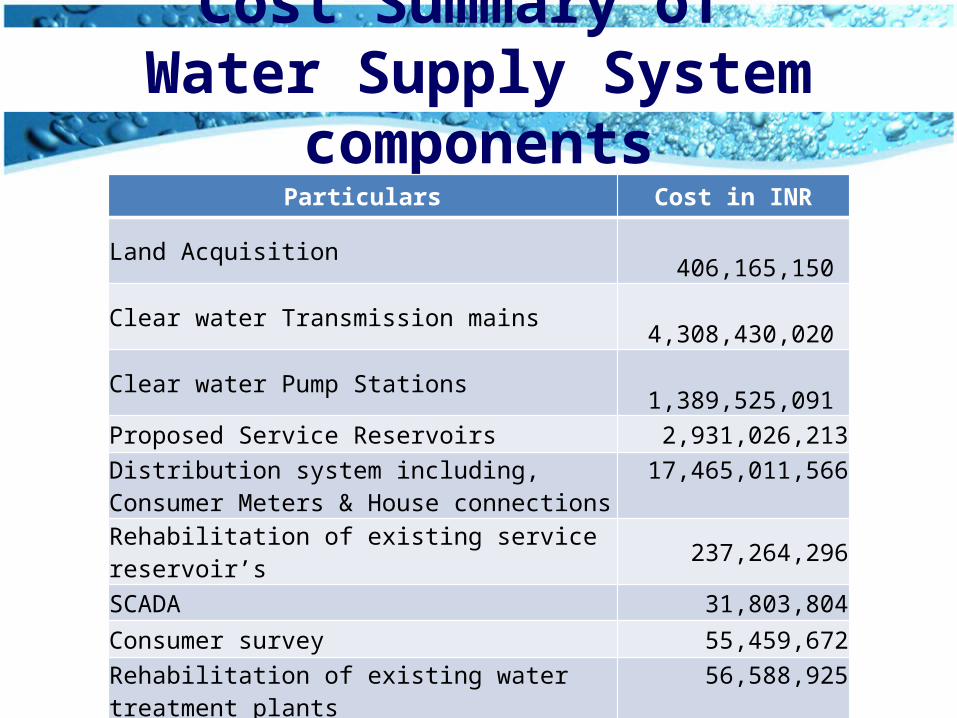
Cost Summary of Water Supply System components
Particulars Cost in INR
Land Acquisition 406,165,150 Clear water Transmission mains 4,308,430,020 Clear water Pump Stations 1,389,525,091 Proposed Service Reservoirs 2,931,026,213Distribution system including, Consumer Meters & House connections
17,465,011,566
Rehabilitation of existing service reservoir’s 237,264,296
SCADA 31,803,804Consumer survey 55,459,672Rehabilitation of existing water treatment plants 56,588,925
Pilot DMA project 161,247,509
Total 27,042,522,246
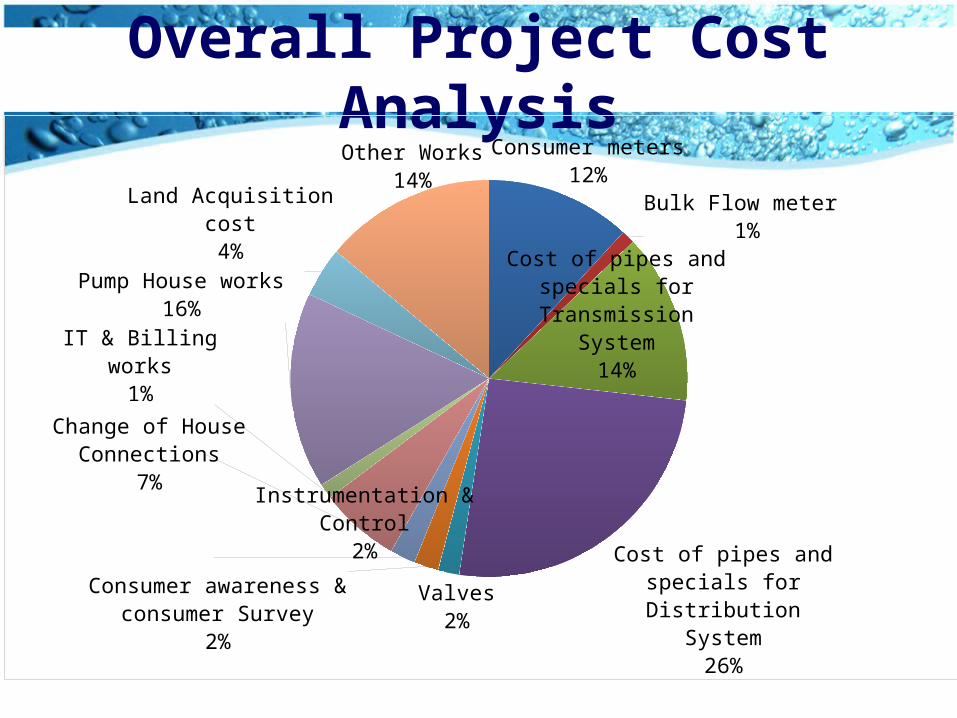
Overall Project Cost AnalysisConsumer meters
12%Bulk Flow meter
1%
Cost of pipes and specials for Transmis-
sion System14%
Cost of pipes and specials for Distribu-
tion System26%
Valves2%
Consumer awareness & consumer Survey
2%
Instrumentation & Control
2%
Change of House Connections
7%
IT & Billing works1% Pump House works
16%
Land Acquisition cost4%
Other Works14%
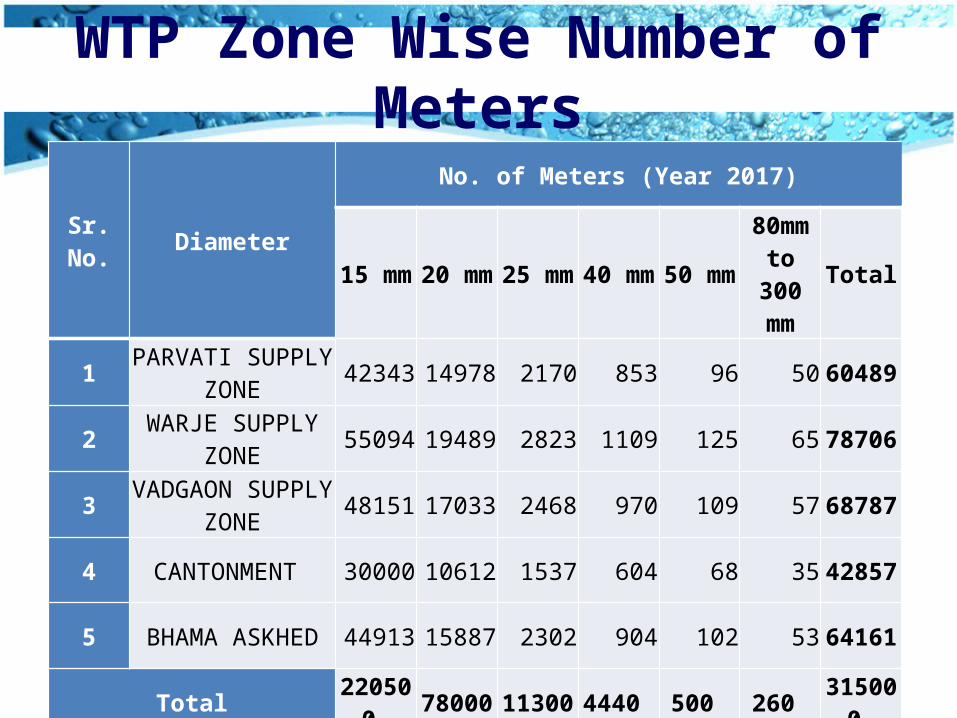
WTP Zone Wise Number of Meters
Sr. No. Diameter
No. of Meters (Year 2017)
15 mm 20 mm 25 mm 40 mm 50 mm80mm to 300
mmTotal
1 PARVATI SUPPLY ZONE 42343 14978 2170 853 96 50 60489
2 WARJE SUPPLY ZONE 55094 19489 2823 1109 125 65 78706
3 VADGAON SUPPLY ZONE 48151 17033 2468 970 109 57 68787
4 CANTONMENT 30000 10612 1537 604 68 35 42857
5 BHAMA ASKHED 44913 15887 2302 904 102 53 64161
Total 220500 78000 11300 4440 500 260 315000
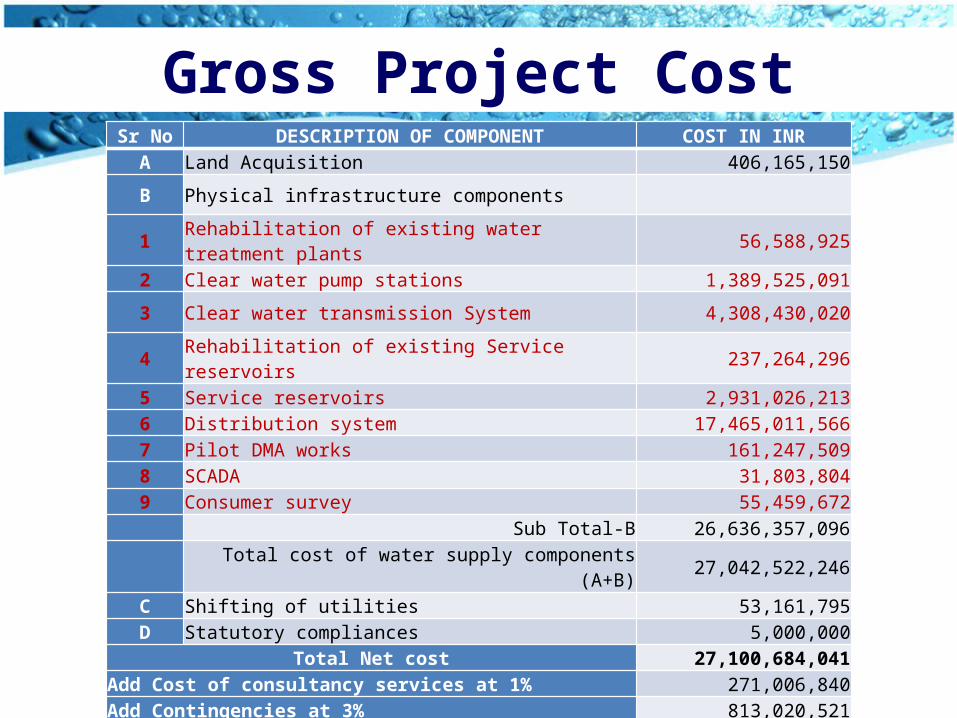
Gross Project CostSr No DESCRIPTION OF COMPONENT COST IN INR
A Land Acquisition 406,165,150
B Physical infrastructure components
1 Rehabilitation of existing water treatment plants 56,588,925
2 Clear water pump stations 1,389,525,091
3 Clear water transmission System 4,308,430,020
4 Rehabilitation of existing Service reservoirs 237,264,296
5 Service reservoirs 2,931,026,2136 Distribution system 17,465,011,5667 Pilot DMA works 161,247,5098 SCADA 31,803,8049 Consumer survey 55,459,672
Sub Total-B 26,636,357,096
Total cost of water supply components (A+B) 27,042,522,246
C Shifting of utilities 53,161,795D Statutory compliances 5,000,000
Total Net cost 27,100,684,041Add Cost of consultancy services at 1% 271,006,840Add Contingencies at 3% 813,020,521
Total Gross cost 28,184,711,402
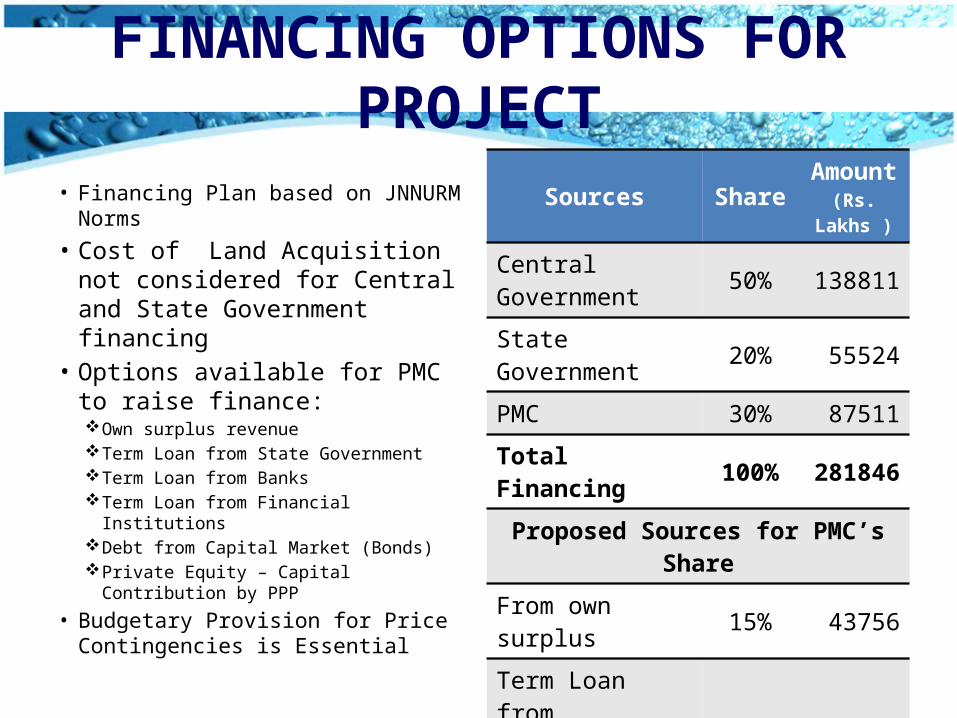
FINANCING OPTIONS FOR PROJECT
• Financing Plan based on JNNURM Norms
• Cost of Land Acquisition not considered for Central and State Government financing
• Options available for PMC to raise finance: Own surplus revenue Term Loan from State Government Term Loan from Banks Term Loan from Financial Institutions Debt from Capital Market (Bonds) Private Equity – Capital Contribution by
PPP
• Budgetary Provision for Price Contingencies is Essential
Sources Share Amount (Rs. Lakhs )
Central Government 50% 138811
State Government 20% 55524
PMC 30% 87511
Total Financing 100% 281846
Proposed Sources for PMC’s Share
From own surplus 15% 43756
Term Loan from Financial Institution 15% 43755
Total PMC’s Share 30% 87511
Conclusions
This Project is of critical importance to PMC Water SupplyA. Provides comprehensive Architecture for future water
supply1. PMC may consider phased implementation2. All works (Under various program) have to be as per master plan
B. Continuously Pressurised System with 24 x 7 supply1. Reduce contamination2. Discourage excessive storage & consequent reduction in losses3. Preventing empting of water supply mains
C. Large number of manageable DMAs for equitable pressure1. Moderate water supply zone size ensures better pressure management2. Higher consumer satisfaction3. Easier to locate & repair leakage
Continued……..

Conclusions
D. Volumetric billing for Precise water balance and estimation of NRW
1. Discourage excessive consumption2. Establish real value of water3. Address GOI policy requirement4. Tamper Proof
E. Active Leakage control programme for reducing physical losses
1. Quick response to leakages2. Reduction in loss3. Consumer Satisfaction
Continued……..

Conclusions
F. AMR type water meters for fast, accurate and easy to transfer data management
1. Very precise measurement2. No human interference3. Fast transfer of data for billing
G. SCADA for real time monitoring of operational parameters, reducing losses
1. Real time monitoring of critical parameters like flows in Trunk/Distribution mains, Reservoirs/Sump levels, Pump performance, pressure in system
2. Ability to quickly respond to any contingency3. Reduce wastages such as reservoir overflows