Embed Size (px)
Citation preview
Economic Development in Berks County &
Why is it Important to my Community?
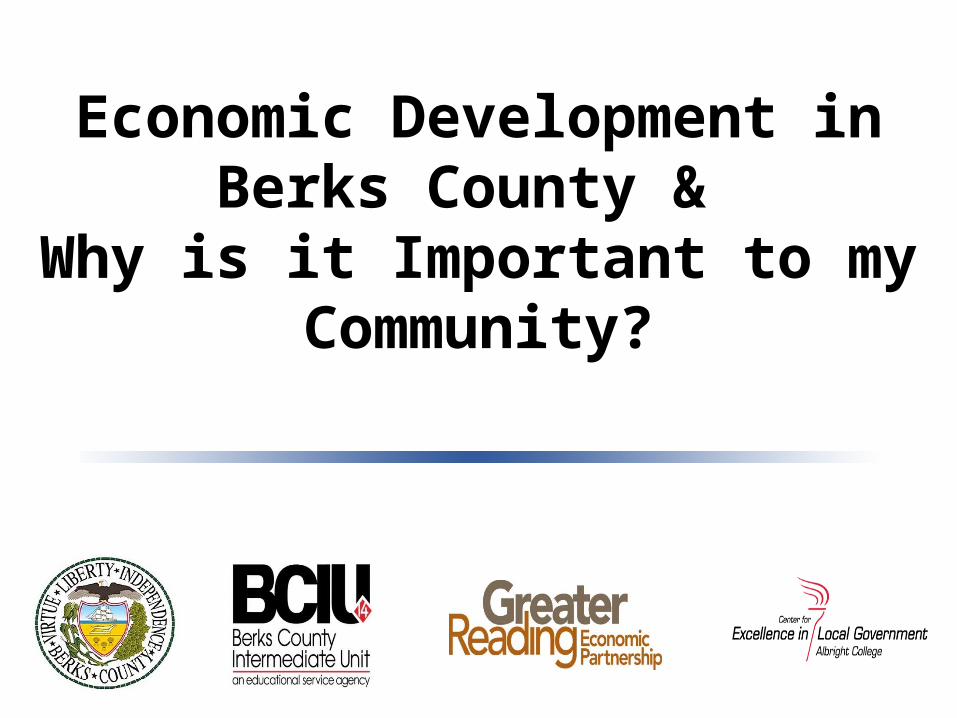
Berks County Outlook 2016• Increased Role of Municipalities
• Growth in Manufacturing and Logistics/Distribution Industries
• Workforce Availability Focus
• Increase in International Leads
• Filling the Site and Infrastructure Pipeline is Critical
1980 1990 2000 2010300,000
350,000
400,000
450,000
500,000
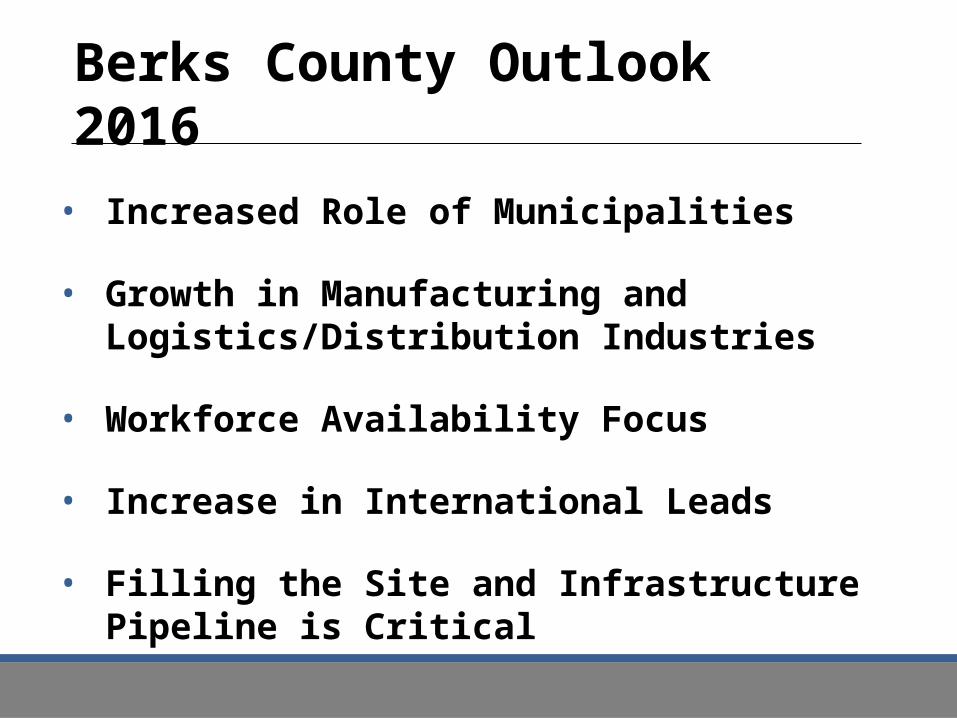
Berks County Population1980-2010
County Population
Berks County has had a 7-10% increase in popu-lation each decade.
Source: BCPC, U.S. Census Bureau
2000
2002
2004
2006
2008
2010
2012
2014
360,000
370,000
380,000
390,000
400,000
410,000
420,000
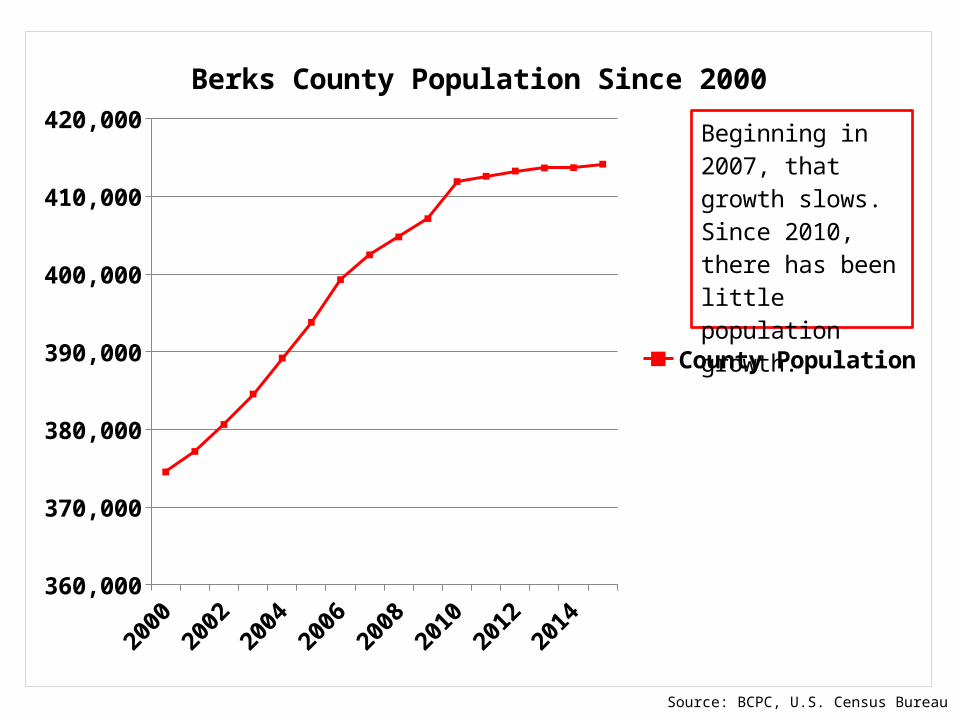
Berks County Population Since 2000
County Population
Beginning in 2007, that growth slows. Since 2010, there has been little population growth.
Source: BCPC, U.S. Census Bureau
2011 2012 2013 2014 2015
-1,000
-500
0
500
1,000
1,500
2,000
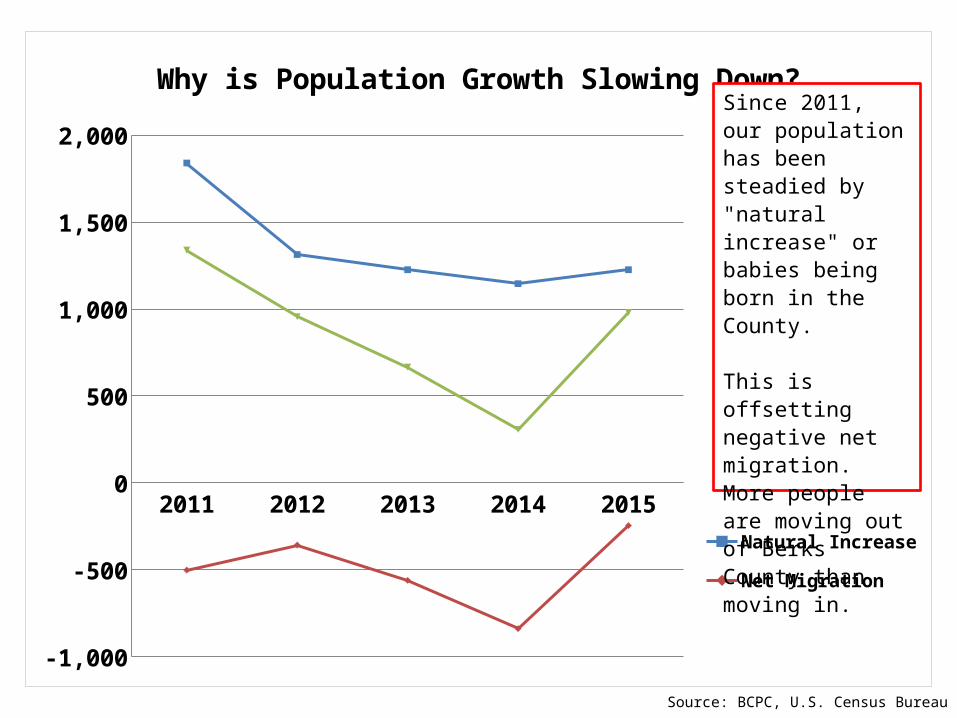
Why is Population Growth Slowing Down?
Natural IncreaseNet MigrationTotal Population Increase
Since 2011, our population has been steadied by "natural in-crease" or babies being born in the County.
This is offsetting negative net mi-gration. More people are mov-ing out of Berks County than mov-ing in.
Source: BCPC, U.S. Census Bureau
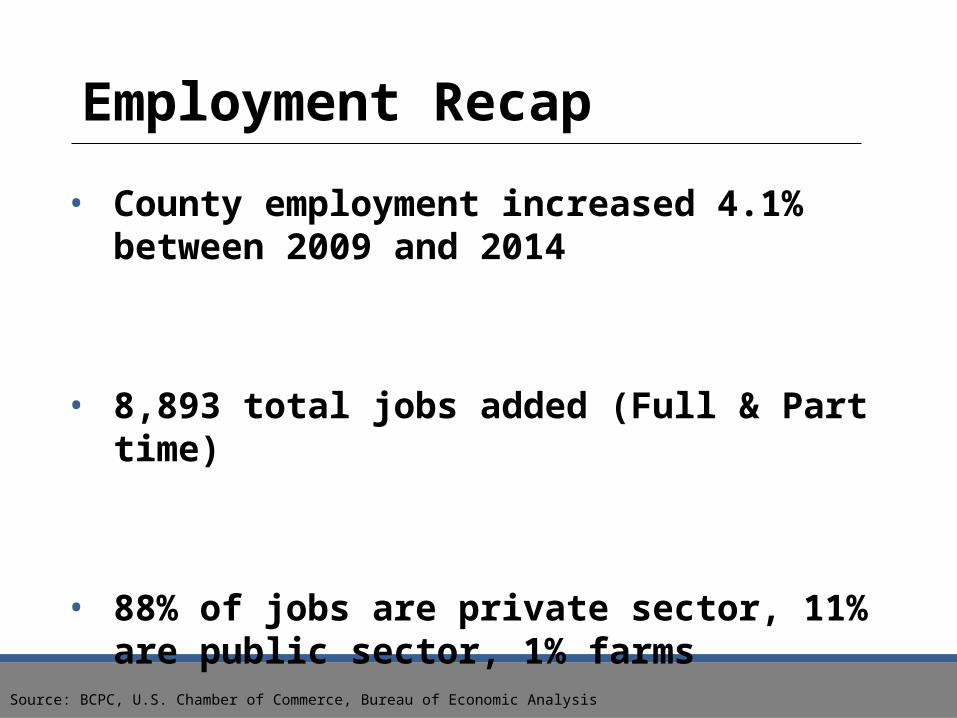
Employment Recap• County employment increased 4.1%
between 2009 and 2014
• 8,893 total jobs added (Full & Part time)
• 88% of jobs are private sector, 11% are public sector, 1% farms
Source: BCPC, U.S. Chamber of Commerce, Bureau of Economic Analysis
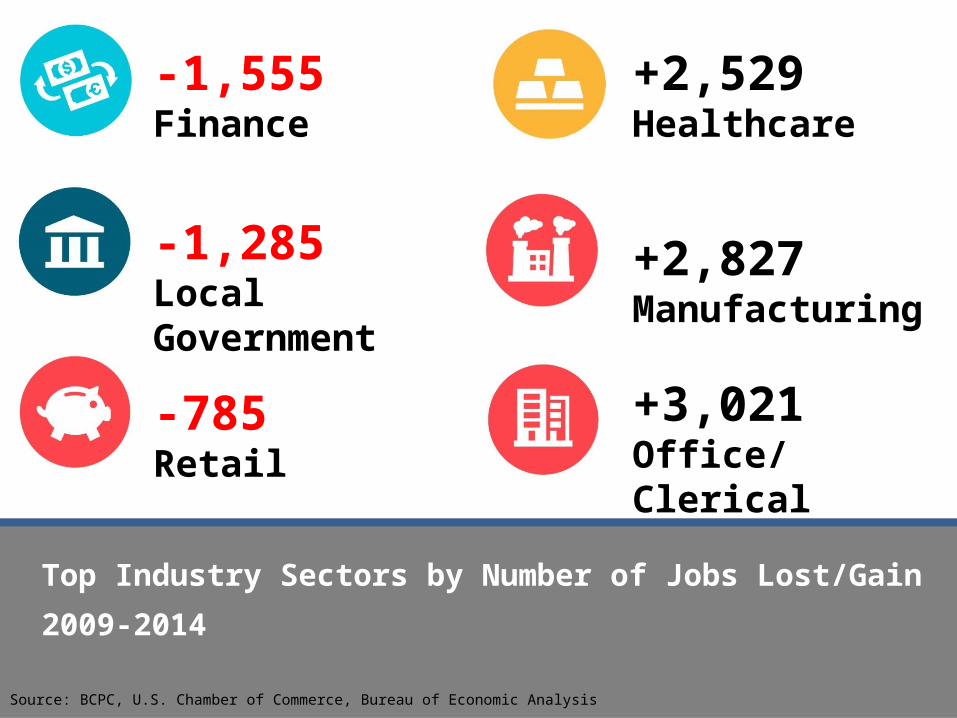
Top Industry Sectors by Number of Jobs Lost/Gain
2009-2014
-1,555Finance
+2,529Healthcare
-785Retail
-1,285Local Government +3,021
Office/Clerical
+2,827Manufacturing
Source: BCPC, U.S. Chamber of Commerce, Bureau of Economic Analysis
Source: BCPC, Pennsylvania State Tax Equalization Board Market Value Reports: 2008-2014
Bern
ville
Bor
ough
Beth
el T
owns
hip
Hei
delb
erg
Tow
nshi
p
Jeffe
rson
Tow
nshi
p
Low
er H
eide
lber
g ...
Mar
ion
Tow
nshi
p
Nor
th H
eide
lber
g ...
Penn
Tow
nshi
p
Robe
soni
a Bo
roug
h
Sout
h H
eide
lber
g ...
Tulp
ehoc
ken
Tow
n...
Wer
ners
ville
Bor
...
Wom
elsd
orf B
orou
gh
$0$50,000,000
$100,000,000$150,000,000$200,000,000$250,000,000$300,000,000$350,000,000$400,000,000$450,000,000
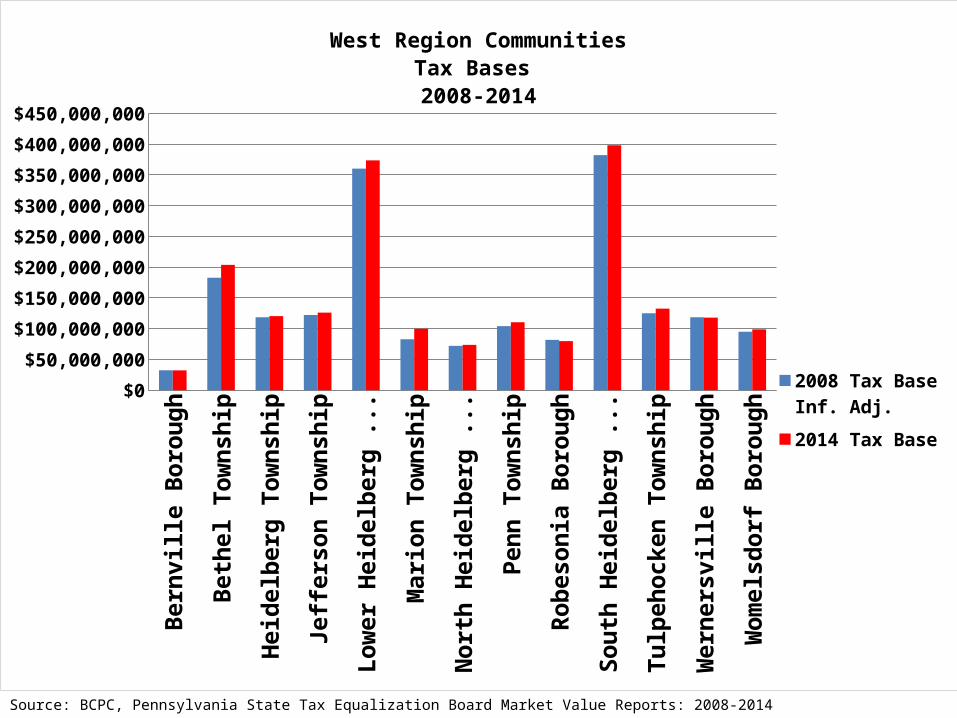
West Region CommunitiesTax Bases 2008-2014
2008 Tax Base Inf. Adj.2014 Tax Base
Source: BCPC, Pennsylvania State Tax Equalization Board Market Value Reports: 2008-2014
Bern
ville
Bor
ough
Beth
el T
owns
hip
Hei
delb
erg
Tow
nshi
p
Jeffe
rson
Tow
nshi
p
Low
er H
eide
lber
g Tw
p.
Mar
ion
Tow
nshi
p
Nor
th H
eide
lber
g Tw
p.
Penn
Tow
nshi
p
Robe
soni
a Bo
roug
h
Sout
h H
eide
lber
g Tw
p.
Tulp
ehoc
ken
Tow
nshi
p
Wer
ners
ville
Bor
ough
Wom
elsd
orf B
orou
gh
-5%
0%
5%
10%
15%
20%
25%
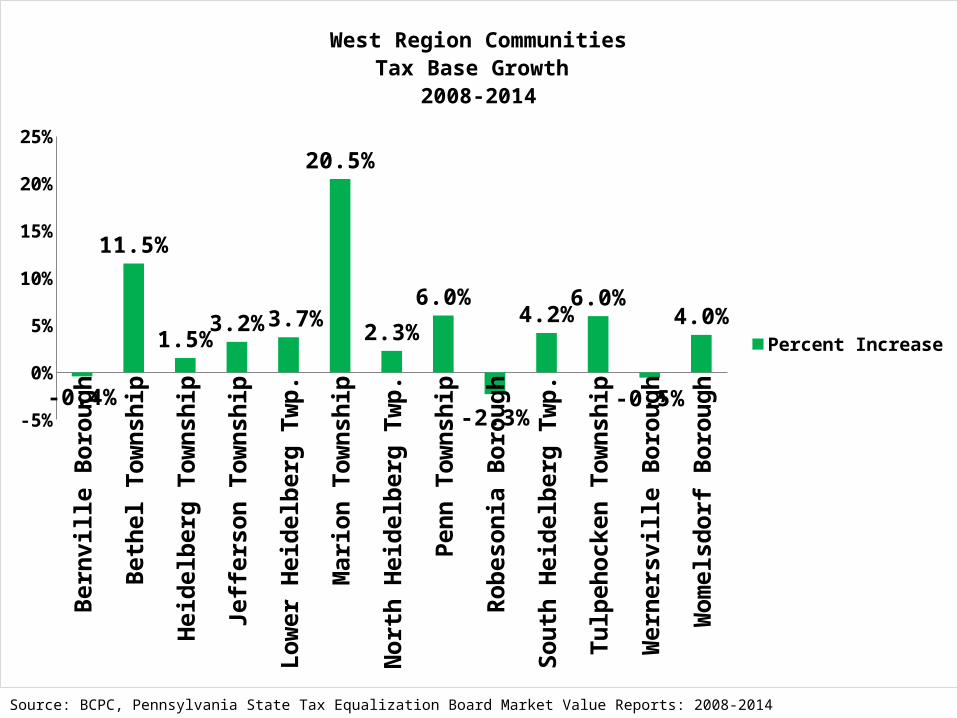
-0.4%
11.5%
1.5%3.2%3.7%
20.5%
2.3%6.0%
-2.3%
4.2%6.0%
-0.5%
4.0%
West Region CommunitiesTax Base Growth
2008-2014
Percent Increase
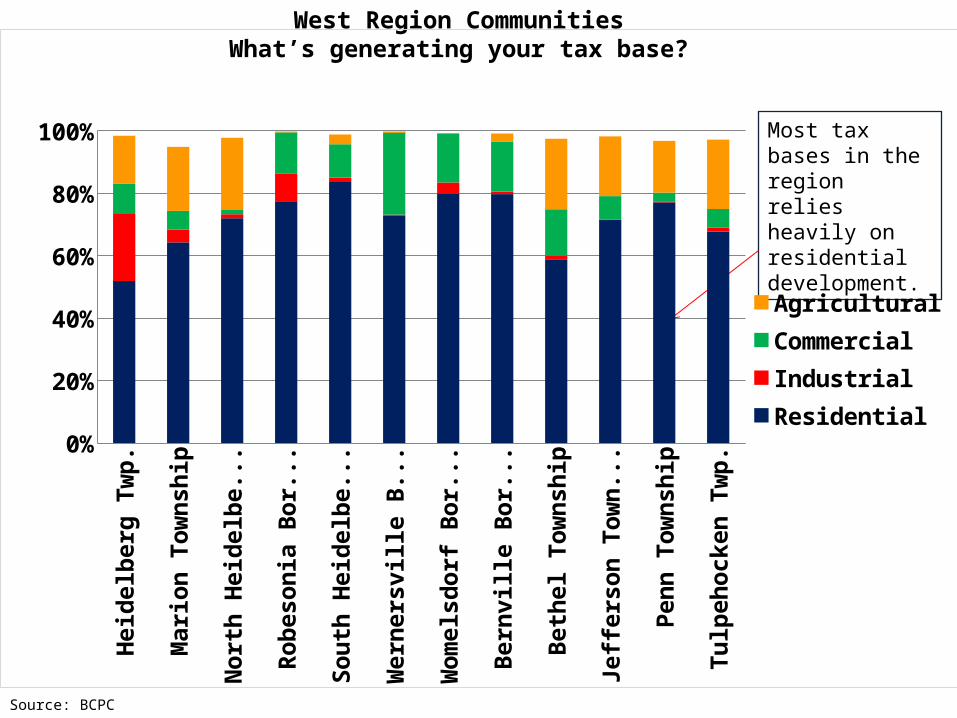
West Region CommunitiesWhat’s generating your tax base?
Source: BCPC
Most tax bases in the region relies heavily on residential development.
Hei
delb
erg
Twp.
Mar
ion
Tow
nshi
p
Nor
th H
eide
lbe.
..
Robe
soni
a Bo
r...
Sout
h H
eide
lb...
Wer
ners
ville
...
Wom
elsd
orf B
...
Bern
ville
Bor
...
Beth
el T
owns
hip
Jeffe
rson
Tow
n...
Penn
Tow
nshi
p
Tulp
ehoc
ken
...
0%10%20%30%40%50%60%70%80%90%
100%
AgriculturalCommercialIndustrialResidential
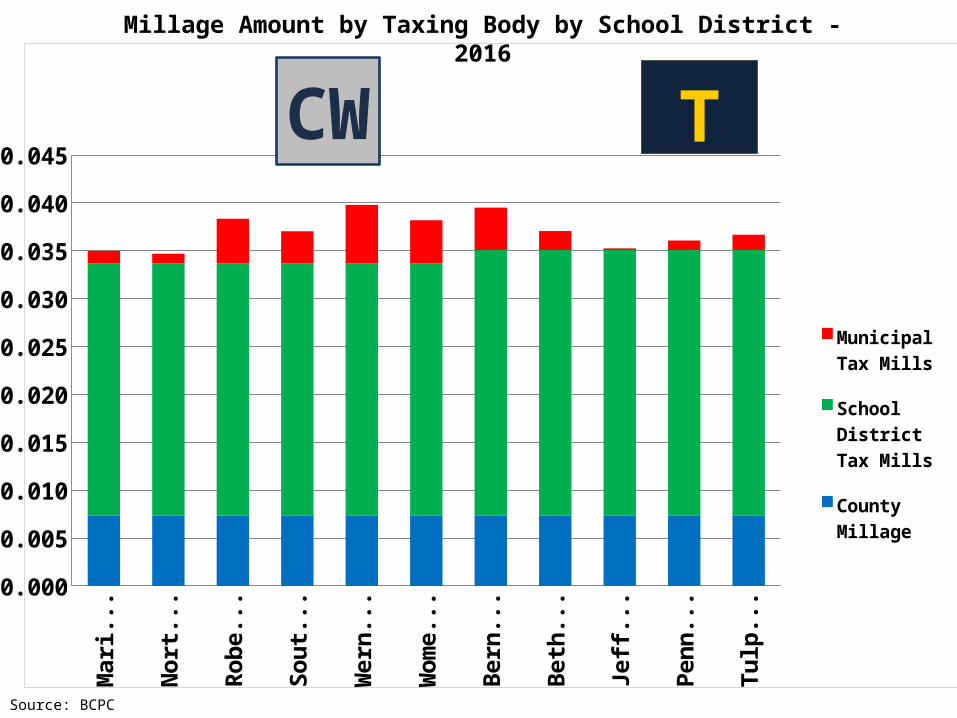
Millage Amount by Taxing Body by School District - 2016
Source: BCPC
Mar
Nor
t...
Rob
Sou
Wer
Wom
Bern
... Bet
Jeff.
..
Pen
Tul0.000
0.005
0.010
0.015
0.020
0.025
0.030
0.035
0.040
0.045
Municipal Tax Mills
School District Tax Mills
County Millage
CW T
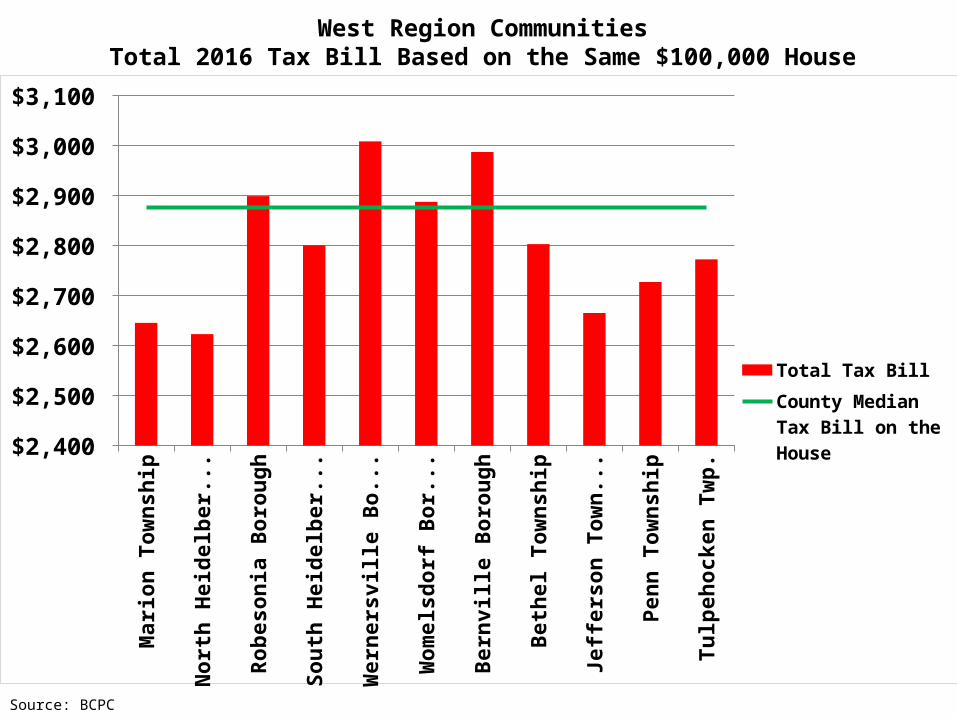
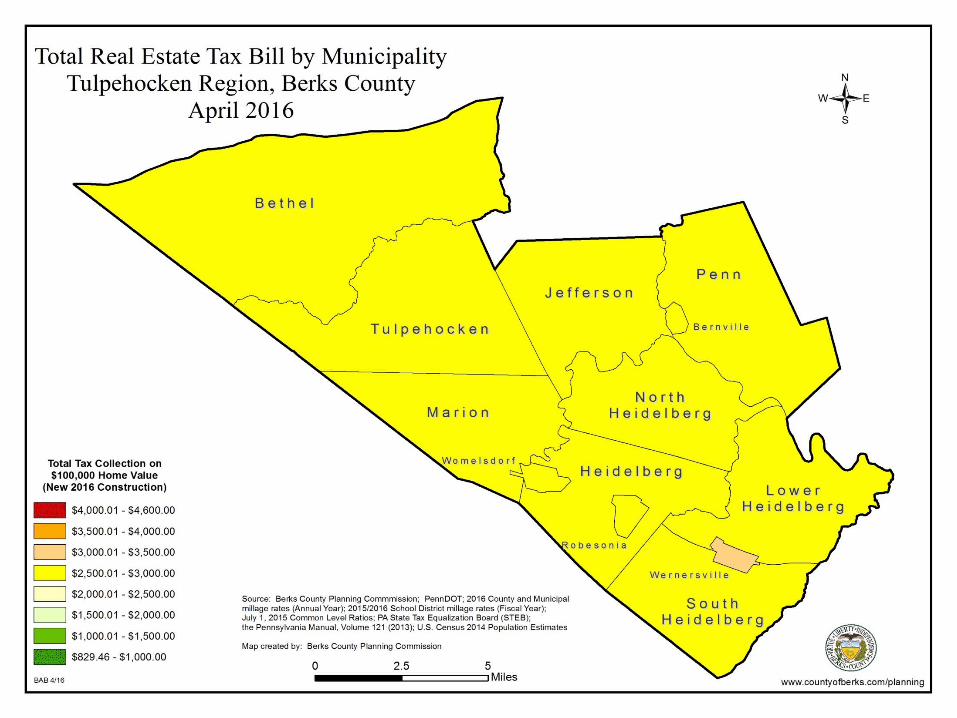
West Region CommunitiesTotal 2016 Tax Bill Based on the Same $100,000 House
Source: BCPC
Mar
ion
Tow
nshi
p
Nor
th H
eide
lber
...
Robe
soni
a Bo
r...
Sout
h H
eide
lber
...
Wer
ners
ville
Bo.
..
Wom
elsd
orf B
or...
Bern
ville
Bor
ough
Beth
el T
owns
hip
Jeffe
rson
Tow
nshi
p
Penn
Tow
nshi
p
Tulp
ehoc
ken
Twp.
$2,400
$2,500
$2,600
$2,700
$2,800
$2,900
$3,000
$3,100
Total Tax BillCounty Median Tax Bill on the House
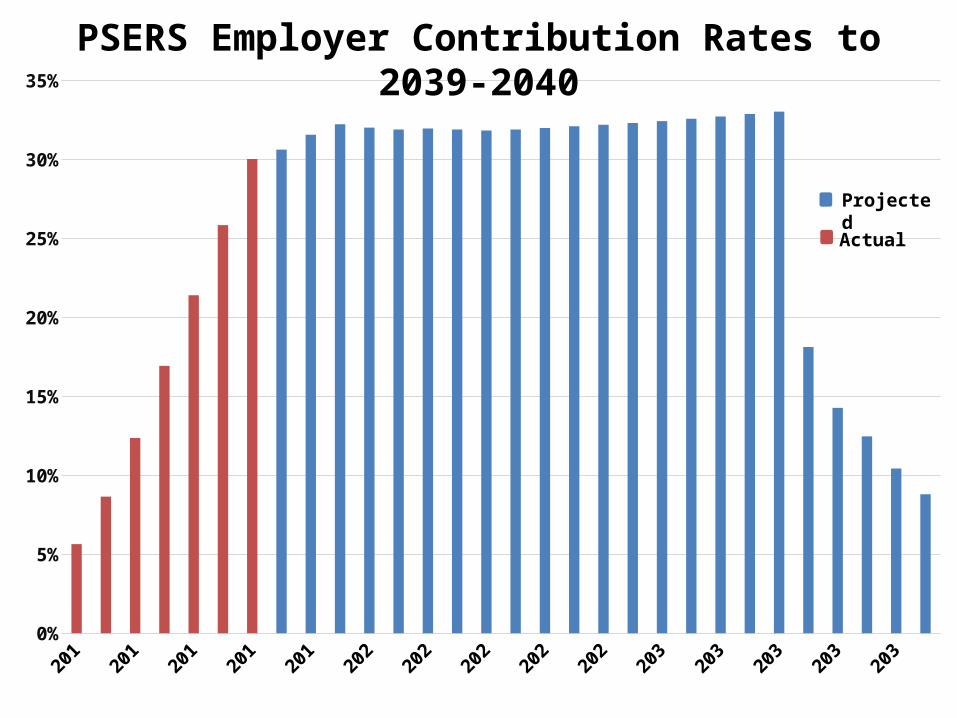
20 20 20 20 20 20 20 20 20 20 20 20 20 20 200%
5%
10%
15%
20%
25%
30%
35%PSERS Employer Contribution Rates to
2039-2040
Actual
Projected
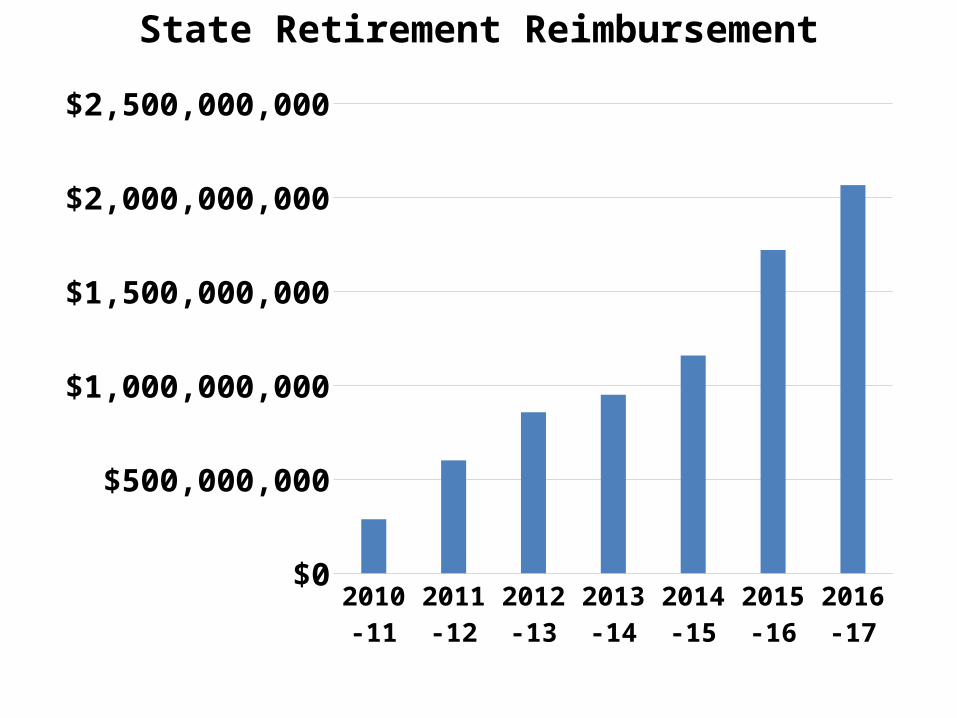
State Retirement Reimbursement
2010-11
2011-12
2012-13
2013-14
2014-15
2015-16
2016-17
$0
$500,000,000
$1,000,000,000
$1,500,000,000
$2,000,000,000
$2,500,000,000

Tools and Solutions
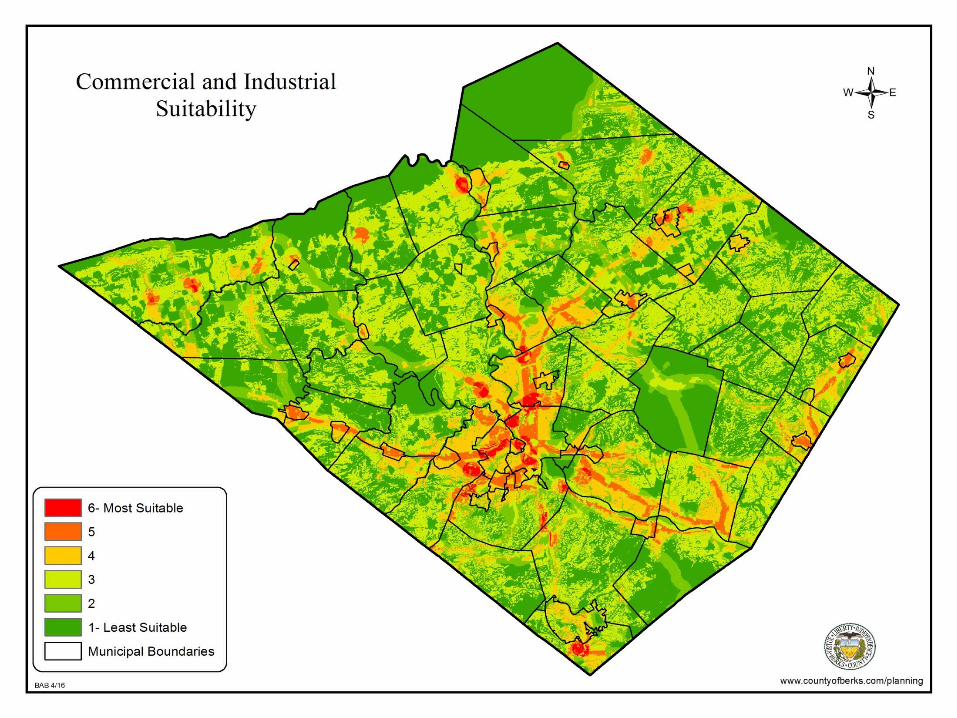
Berks County Sites and Infrastructure Tool
Berks CountySites and Infrastructure Strategy
Goal:
To determine the most suitable areas in Berks County for commercial and industrial uses based on prioritized factors.
Source: BCPC, RTP Sites and Infrastructure Committee
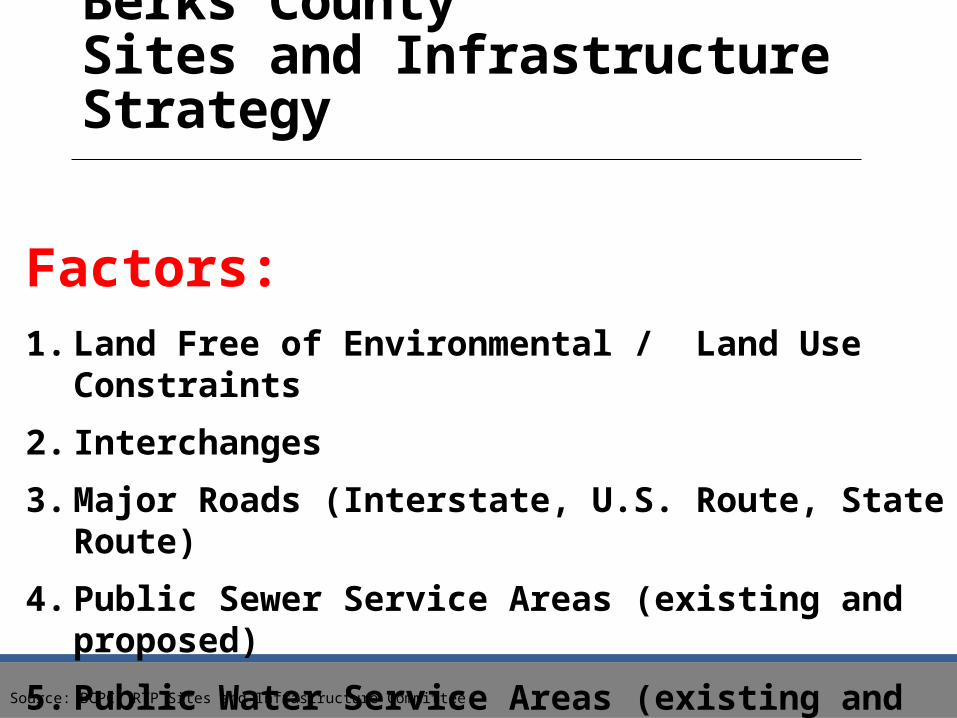
Factors:1. Land Free of Environmental / Land Use
Constraints2. Interchanges3. Major Roads (Interstate, U.S. Route, State
Route)4. Public Sewer Service Areas (existing and
proposed)5. Public Water Service Areas (existing and
proposed)
Berks CountySites and Infrastructure Strategy
Source: BCPC, RTP Sites and Infrastructure Committee
Source: BCPC
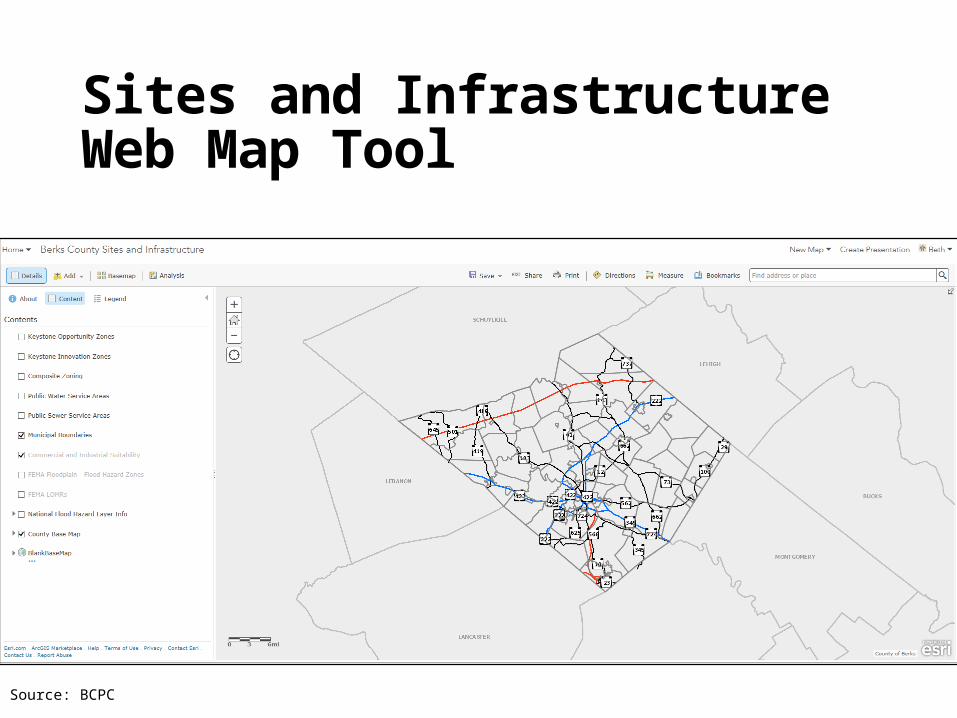
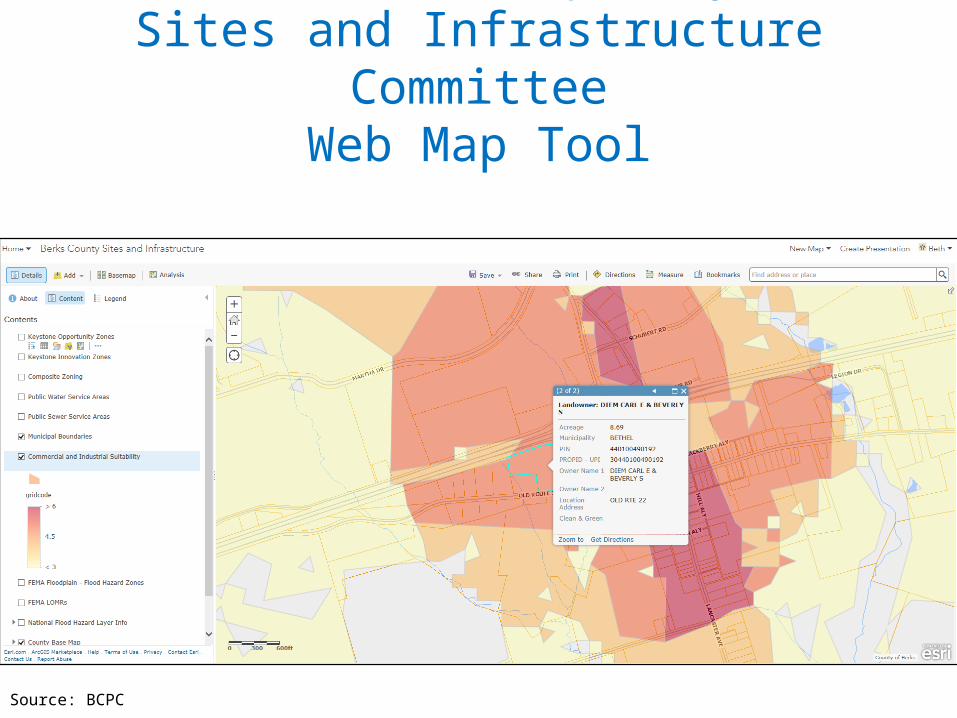
Sites and InfrastructureWeb Map Tool
Ride To ProsperitySites and Infrastructure Committee
Web Map Tool
Source: BCPC
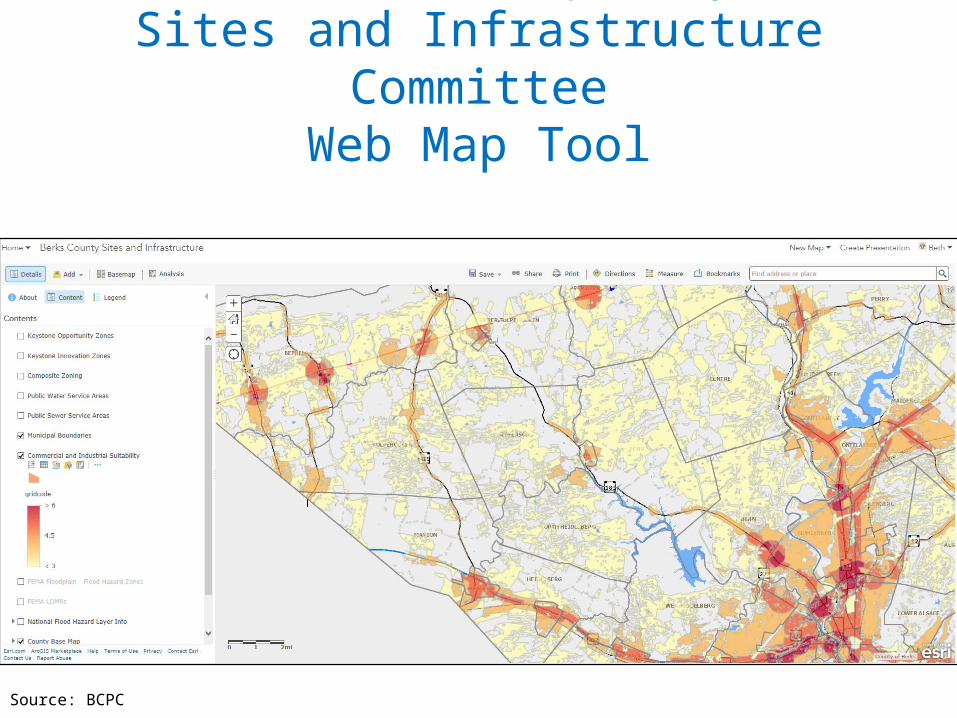
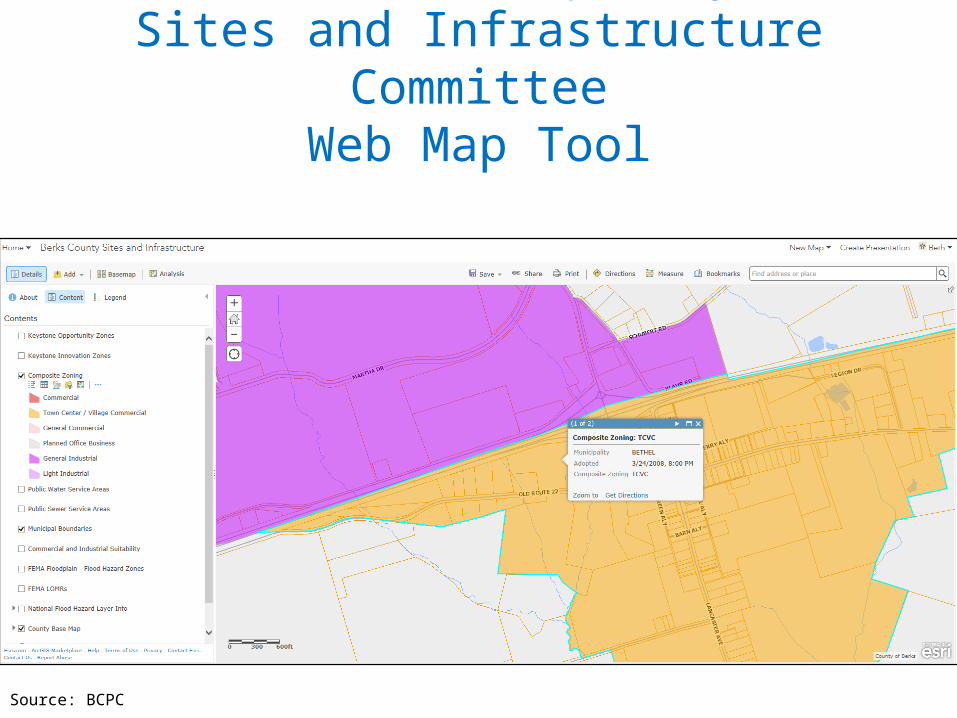
Ride To ProsperitySites and Infrastructure Committee
Web Map Tool
Source: BCPC
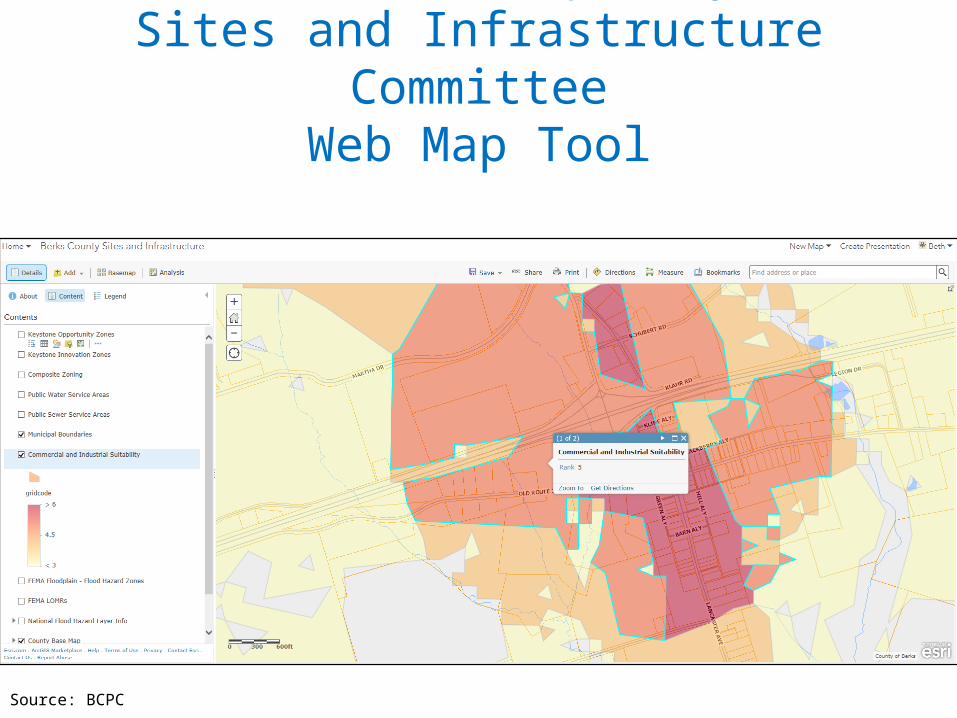
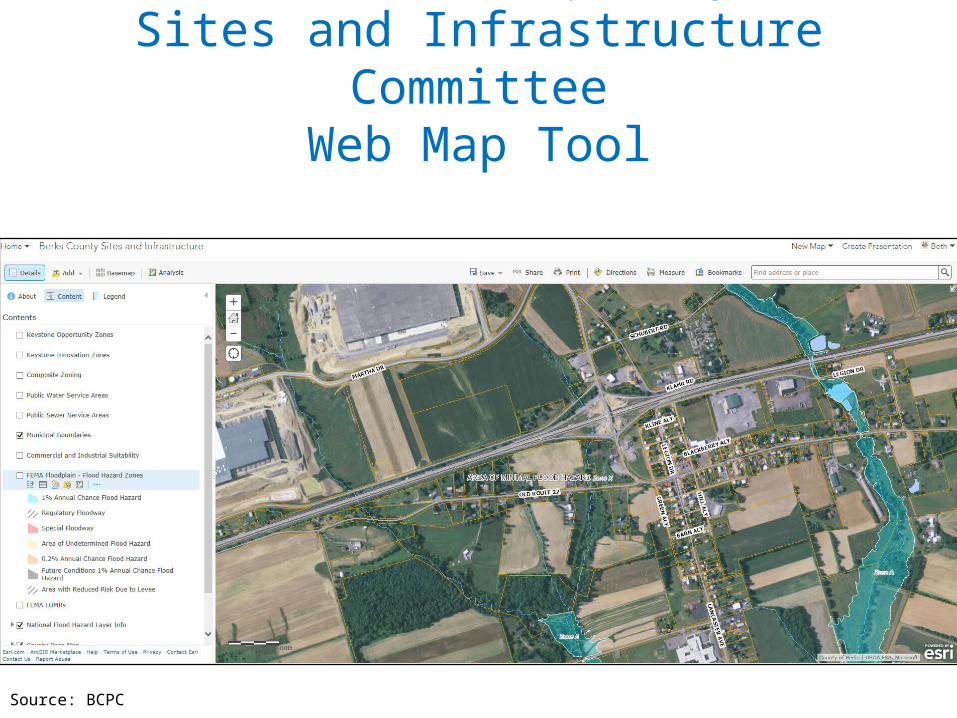
Ride To ProsperitySites and Infrastructure Committee
Web Map Tool
Source: BCPC
Ride To ProsperitySites and Infrastructure Committee
Web Map Tool
Source: BCPC
Ride To ProsperitySites and Infrastructure Committee
Web Map Tool
Source: BCPC
Transportation andFuture Land Use Maps

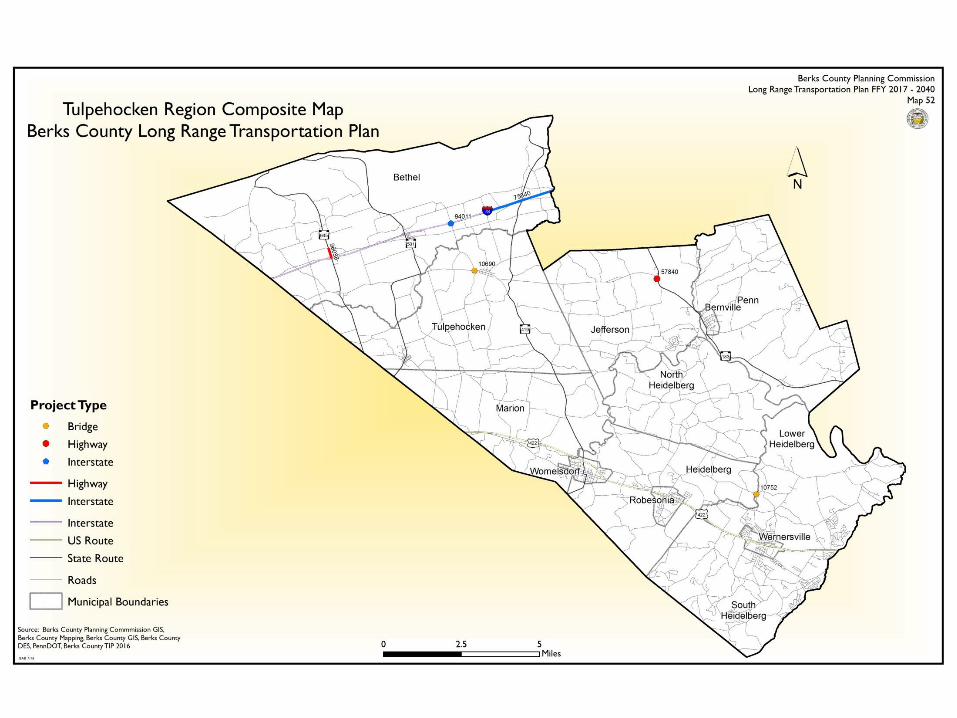
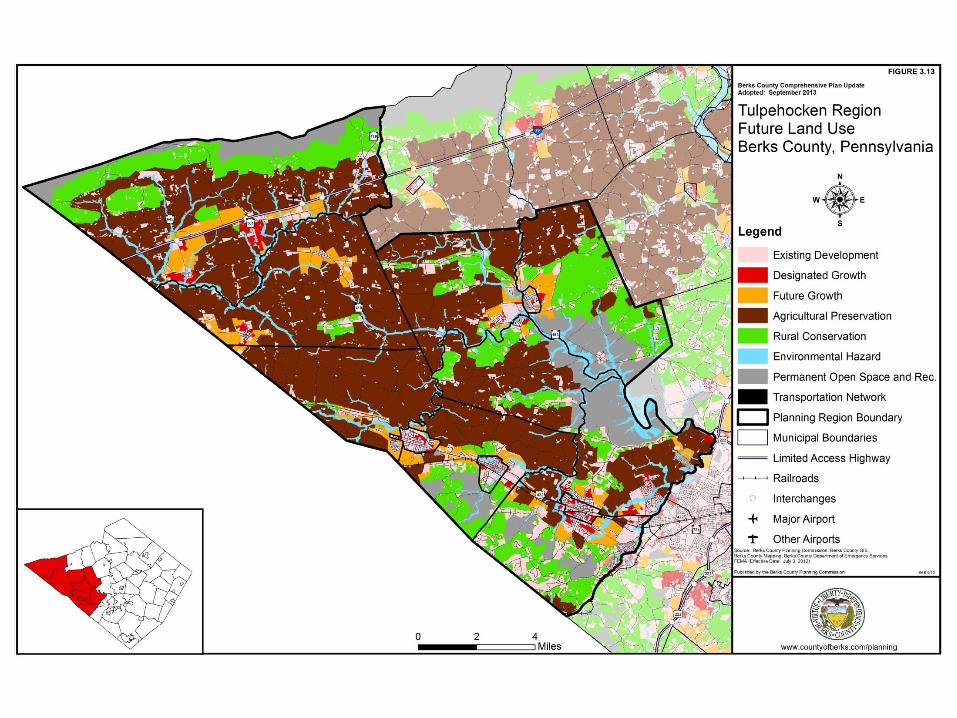

What Do We Do WithAll The Data?
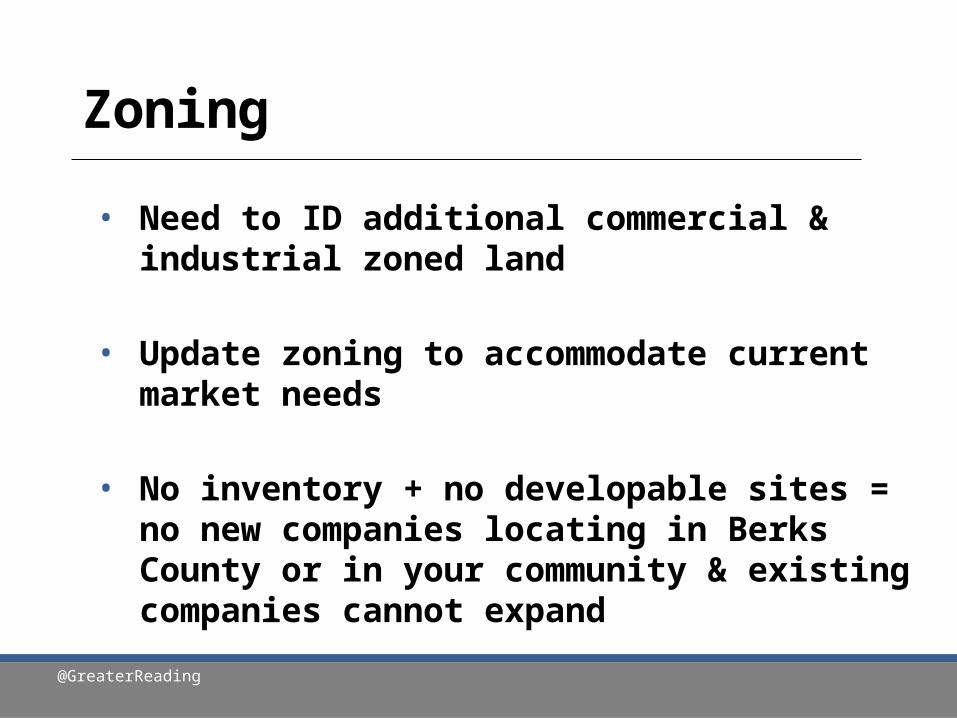
• Need to ID additional commercial & industrial zoned land
• Update zoning to accommodate current market needs
• No inventory + no developable sites = no new companies locating in Berks County or in your community & existing companies cannot expand
@GreaterReading
Zoning
Incentives…
“Incentives can make a good location great, but not a bad location good”
• The permitting process is difficult to navigate – even on a good day.
• Why is it important?• Added cost• Uncertainty• Time• Ability to get financing
Permitting

• Why is it an important tool?
• What does it mean to our bottom line? • Abating taxes on the new assessment
• You continue to receive taxes on the current assessed value
LERTA
If you are interested in:• Attracting new business to your
community
• Helping existing businesses to expand in your community
• Identifying land for business development in your community
• Providing job opportunities for your residents in your community
• Stabilizing the tax base in your community
How We Can Work Together
Download the presentation + more information visit:
bit.ly/BerksMuni
Pamela Shupp, GREP 610.376.4237

![Western Region News - Costume · 2 Western Region News WESTERN REGION d Z t v Z P ] } v } ( Z } µ u ^ } ] Ç } ( u ] ] u µ } (](https://img.pdfslide.us/doc/110x75/5f54d08525c3e16a50094f83/western-region-news-2-western-region-news-western-region-d-z-t-v-z-p-v-.jpg)