Embed Size (px)
Citation preview
EN EN
EUROPEAN COMMISSION
Brussels, 22.2.2017
SWD(2017) 87 final
COMMISSION STAFF WORKING DOCUMENT
Country Report Portugal 2017
Including an In-Depth Review on the prevention and correction of macroeconomic
imbalances
Accompanying the document
COMMUNICATION FROM THE COMMISSION TO THE EUROPEAN
PARLIAMENT, THE COUNCIL, THE EUROPEAN CENTRAL BANK AND THE
EUROGROUP
2017 European Semester: Assessment of progress on structural reforms, prevention and
correction of macroeconomic imbalances, and results of in-depth reviews
under Regulation (EU) No 1176/2011
{COM(2017) 90 final}
{SWD(2017) 67 final to SWD(2017) 93 final}
Executive summary 1
1. Economic situation and outlook 4
2. Progress with country-specific recommendations 11
3. Summary of the main findings from the MIP in-depth review 15
4. Reform priorities 21
4.1. Public finances and taxation 271
4.2. Financial sector and indebtedness 27
4.3. Labour market, education and social policies 33
4.4. Investment 40
4.5. Sectoral policies 46
4.6. Public administration 51
A. Overview table 55
B. MIP Scoreboard 63
C. Standard tables 64
References 69
LIST OF TABLES
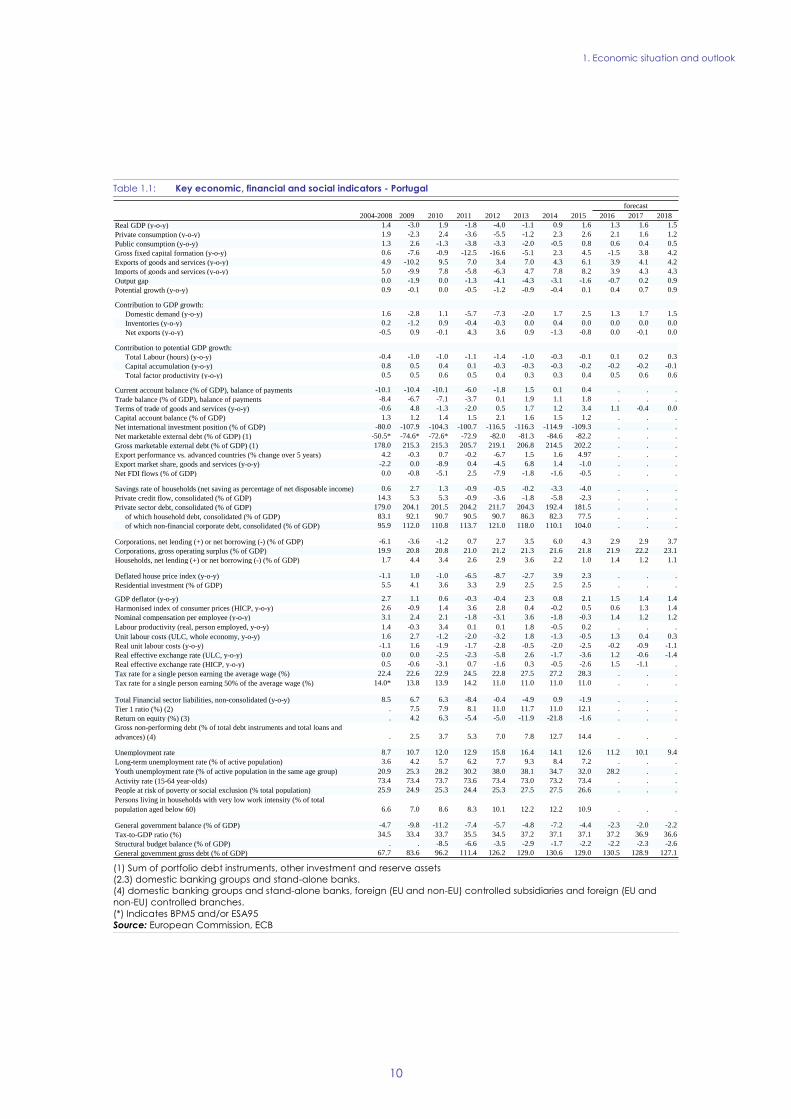
1.1. Key economic, financial and social indicators - Portugal 10
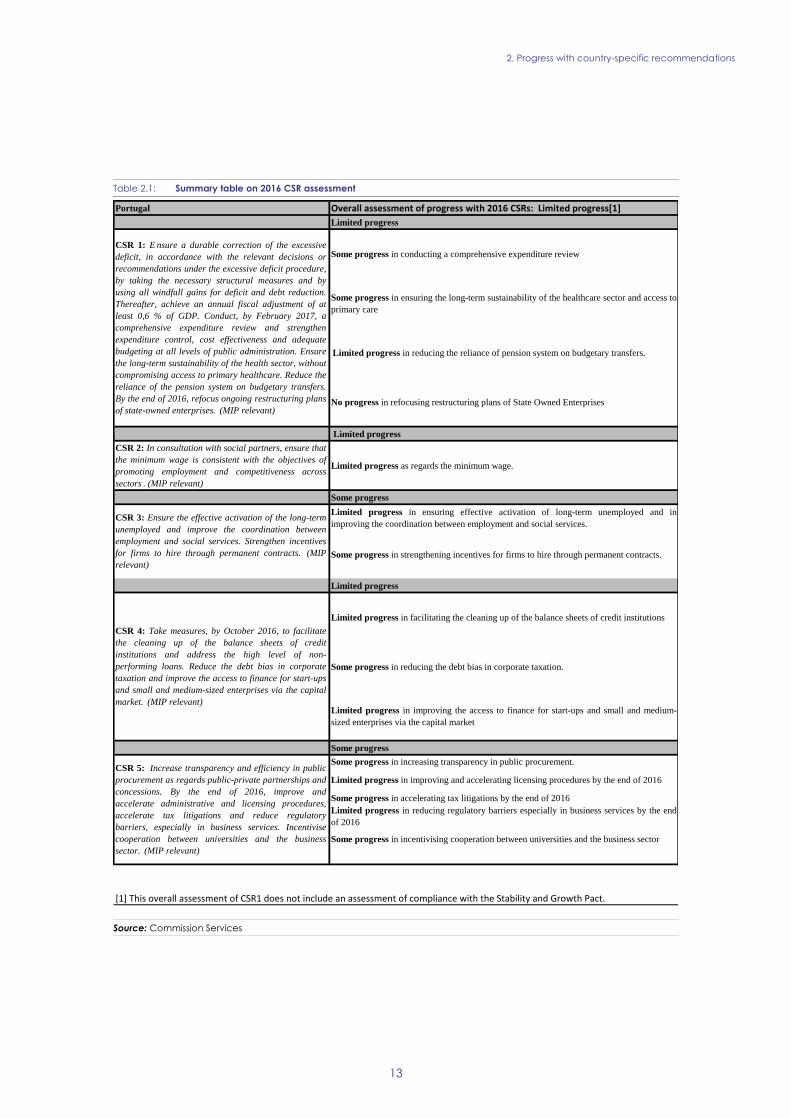
2.1. Summary table on 2016 CSR assessment 13
3.1. MIP assessment matrix - Portugal 2017 19
B.1. The MIP Scoreboard for Portugal 63
C.1. Financial market indicators 64
C.2. Labour market and social indicators 65
C.3. Expenditure on social protection benefits (% of GDP) 66
C.4. Product market performance and policy indicators 67
C.5. Green growth 68
LIST OF GRAPHS
1.1. Real GDP growth and its components 4
1.2. Activity, employment and unemployment rates (quarterly) 5
1.3. Employment by type (permanent, temporary, self-employed), year-on-year changes 5
CONTENTS
1.4. Inequality of income distribution (S80/S20 income quintile share ratio) 6
1.5. NIIP and Current Account evolution 6
1.6. Revealed Comparative Advantage Index (goods) 7
1.7. Nominal ULC, index 2001Q1=100 7
1.8. Wage growth consistent with constant external competitiveness and actual wage growth 8
1.9. Productivity decomposition in the overall economy 8
1.10. Potential growth and its components 9
3.1. Banking sector situation and domestic debt levels 16
4.1.1. Combined interest rate and GDP growth shock (chart to be updated) 21
4.1.2. Fiscal consolidation 22
4.2.1. Debt breakdown by sector in 2002-2016 30
4.2.2. Breakdown of year-on-year changes in debt-to-GDP ratios, NFCs 30
4.2.3. Breakdown of year-on-year changes in debt-to-GDP ratios, households 31
4.2.4. Breakdown of Portugal's Net International Investment Position (NIIP) 31
4.2.5. Current account financing 32
4.2.6. NIIP sensitivity to macroeconomic shocks 32
4.3.1. Unemployment by duration 33
4.3.2. Main social indicators 35
4.4.1. Investment productivity 40
4.4.2. Investment and its components 40
4.4.3. Private and public investments 41
4.4.4. Most problematic factors for doing business 42
4.4.5. World Economic Forum's 2016-2017 Global Competitiveness Report, Portugal 42
4.4.6. Foreign direct investment 42
4.4.7. Component contributions to change in CA balance 2007-2015 43
4.4.8. Nominal unit wage costs by sector 44
4.4.9. Average Quality Rank in the 5 biggest exporting manufacturing sectors 44
4.4.10. Dynamism and Competitiveness of Exports (goods) on top-10 sector destinations
(2013-2015) 44
4.5.1. Restrictiveness indicator, 2016, Portugal and the EU 48
4.5.2. Shares for selected countries of total EU maritime transport of goods, 2014 50
4.5.3. Wage-adjusted labour productivity of the ports sector 50
LIST OF BOXES
2.1. Contribution of the EU budget to structural change in Portugal 14
4.4.1. Investment Box 445
4.6.1. Selected highlights 54
1
This report assesses Portugal's economy in the
light of the Commission's Annual Growth Survey
published on 16 November 2016. In the survey the
Commission calls on EU Member States to
redouble their efforts on the three elements of the
virtuous triangle of economic policy – boosting
investment, pursuing structural reforms and
ensuring responsible fiscal policies. In so doing,
Member States should put the focus on enhancing
social fairness in order to deliver more inclusive
growth. At the same time, the Commission
published the Alert Mechanism Report (AMR) that
initiated the sixth round of the macroeconomic
imbalance procedure. The in-depth review, which
the 2017 AMR concluded should be undertaken
for the Portuguese economy, is presented in this
report.
While the Portuguese economy has continued to
recover for the fourth consecutive year, it
remains vulnerable to shocks. Growth in
domestic demand is still fuelled by strong private
consumption. The conditions for investment
remain challenging and continue to drag on
growth. However, investment is expected to
recover in the medium-term with the support from
EU funds. This will help rebalance the economy
by increasing the share of the tradable sectors.
Recently, there has been a large increase in the
contribution made by net external trade,
possibly driven by temporary causes. A steady
increase in the terms of trade has helped improve
the trade balance of goods. Yet, unit labour costs
have risen recently putting pressure on
competitiveness. Improvements in terms of trade
are expected to fade out while robust domestic
demand will contribute to boosting imports and
weakening the trade balance. Price pressures are
expected to re-emerge again, mainly owing to
higher oil prices. Employment is set to improve
further, albeit more slowly, becoming more
aligned with GDP growth. Taken together, real
GDP is forecast to have decelerated slightly in
2016 before picking up again in 2017 and 2018.
Uncertainty about investment, the banking sector
and the implementation of structural reforms pose
some downside risks to the sustainable recovery.
Public finances are expected to improve, while
the fiscal outlook remains subject to downside
risks. The headline deficit is projected to decrease
further to 2.0 % of GDP in 2017, mainly as a result
of the moderate economic recovery and good
financing conditions. However, uncertainty about
the macroeconomic outlook, the potential impact
on the deficit of banking support measures and
possible spending slippages pose risks. Following
a steep increase during the economic crisis, public
debt has stabilised at around 130.0 % of GDP since
2013. Supported by the projected continuing
moderate economic recovery and primary
surpluses, the debt-to-GDP ratio is expected to fall
gradually from 2017 onwards. The stock of public
debt, which is still large, coupled with still
relatively high deficit levels and low growth,
makes Portugal nevertheless vulnerable to
changing economic conditions and rising financing
costs.
Overall Portugal has made limited progress on
addressing the 2016 country-specific
recommendations. There has been some progress
in conducting an expenditure review. Expenditure
is now subject to more controls and expenditure
containment with the launch of spending reviews
in some sectors. Some progress has also been
made in ensuring the long-term sustainability of
the healthcare sector. There has been limited
progress towards reducing the reliance of the
pension system on budgetary transfers. No
progress has been made to restructure the
state-owned enterprises sustainability, especially
those in the transport sector. In the labour market,
limited progress has been made towards keeping
minimum wage developments at a level which
promotes employment and competitiveness
although employment risks have so far not
materialised. There has also been limited progress
in ensuring the effective activation of long-term
unemployed, improving the coordination between
employment and social services. Yet, some
progress has been made in strengthening incentives
for firms to hire through permanent contracts. In
the financial sector, limited progress has been
made in tackling the high level of non-performing
loans and improving the access to finance for
start-ups and small and medium-sized enterprises
via the capital market. Some progress has been
made in the debt bias in corporate taxation. There
has been some progress in increasing transparency
in public procurement, accelerating tax litigations,
and incentivising cooperation between universities
and businesses. Limited progress has been made in
accelerating licensing procedures as well as in
EXECUTIVE SUMMARY
Executive summary
2
reducing regulatory barriers especially in business
services.
Regarding progress in reaching the national targets
under the Europe 2020 strategy, Portugal is
performing well in reducing greenhouse gas
emissions, the renewable energy target and energy
efficiency, as well as reducing early school
leaving. There are still considerable obstacles in
attaining the targets on employment rate, R&D
investment, tertiary education attainment and
poverty reduction.
The main findings of the in-depth review
contained in this report and the related policy
challenges are as follows:
Potential growth still lags behind its
pre-crisis level and is below EU average. It is
affected by persistent bottlenecks and rigidities
in product and labour markets as well as major
external imbalances. Efforts to reduce debt and
the stock of banks' non-performing loans have
been limited, holding back more sustained
credit recovery and investment. At the same
time, public debt sustainability and the
reduction of interest rate costs hinge on fiscal
discipline and the necessary fiscal adjustment.
The external rebalancing of the Portuguese
economy is underway, but at a moderate
pace. The current account rebalancing,
influenced by stronger export performance, is
still having a limited impact on the large stock
of net external liabilities. High external debt
and the vulnerability in the external sector at
large are linked to weak productivity and
competitiveness, including limited
specialisation in sectors with higher value
added.
The private business sector in Portugal is
over-indebted. This is closely related to the
ongoing adjustment of the Portuguese banking
sector. The authorities are taking some policy
measures to tackle the high level of
non-performing loans especially in the
corporate sector, facilitate business
restructuring simplifying administrative
processes, improving the insolvency
framework and adjusting taxation
requirements.
The large stock of corporate non-performing
loans continues to pose challenges for the
banking sector. Besides the high level of
non-performing loans, Portuguese lenders'
vulnerabilities stem from different sources: thin
capital buffers, large amounts of foreclosed real
estate assets, elevated exposures to the
Portuguese sovereign debt, as well as weak
business models and profit rates of Portuguese
banks. Although some measures have been
taken to reduce incentives to debt financing,
corporate taxation still shows a relatively high
debt bias.
Ensuring public debt sustainability in the
medium and long term hinges on a solid
budgetary consolidation. It also relies on
growth enhancing structural measures as well
as expenditure containment and
growth-friendly optimisation of revenue flows
e.g. regarding the efficiency of indirect
taxation. While reforms in the pension system
have reduced its long-term costs, it still relies
on extraordinary budgetary transfers over the
medium term. In the healthcare sector,
measures to promote prevention and primary
care have been put forward and could probably
help cut costs in the long term. However, the
growing stock of arrears in hospitals and recent
measures concerning public sector working
hours weigh on the capacity to improve
healthcare infrastructure and services.
Indebtedness of state-owned enterprises
remains high, mainly in the transport sector. A
plan to improve monitoring is being set up, but
there are no concrete measures to ensure cost
efficiency, and sound debt management. The
negative operational performance and delay in
setting up a governance framework for
metropolitan transport further exacerbate the
risks of a debt increase. Finally, the current
spending review would benefit from a more
comprehensive and strategic approach.
Unemployment keeps falling and
employment growing, while long-term and
youth unemployment still remain high. Half
of the unemployed have been jobless for a year
or more, while a quarter of young workers are
unemployed. Long-term unemployment can
make it harder to return to work harming
Portugal’s growth potential.
Executive summary
3
Other key economic issues which point to
particular challenges facing Portugal's economy
are as follows:
The rising minimum wage may help reduce
in-work poverty, but it poses some
employment risks. Between 2015 and 2017
the minimum wage rose faster than prices and
average productivity. This can reduce in-work
poverty and impact aggregate demand
positively. At the same time, it is becoming
increasingly binding, covering a fifth of all
workers by 2016. Employment risks seem less
pressing in the current context of job recovery,
but remain a challenge, especially as regards
young and low-skilled workers.
While incentives for firms to hire through
permanent contracts were strengthened, the
labour market remains segmented. Although
financial incentives for permanent hiring have
been adopted, some aspects of labour law may
still discourage employers from hiring
permanent workers. This has potentially
negative social consequences and hampers
productivity growth. Extensive use of
temporary contracts may increase labour
market turnover. Younger people are more
likely to be on such contracts and are thus more
vulnerable to unemployment spells. As they
have higher levels of formal skills, this may
harm potential growth.
The proportion of people at risk of poverty
or social exclusion fell in 2015. This is in line
with labour market improvements, but the
overall level remains high. Income inequality
also declined. In-work poverty remained one of
the highest in the EU in 2015, partly due to low
quality jobs and a high involuntary part-time
employment. It is still not reflecting the recent
recovery in the labour market. Measures in the
area of social assistance were taken in 2016 to
improve income conditions of people in low
income households
School outcomes are improving but the skill
level of the labour force, including digital,
remains low. Tertiary attainment has stagnated
below EU average and higher education offer is
scattered. In spite of efforts made, obstacles to
more structured university business
cooperation and knowledge transfer remain,
hampering innovation and the transition to a
knowledge based economy.
Regulatory and administrative barriers,
restricting investment and efficient resource
allocation, have been tackled partially. The
government has put forward measures to ease
businesses' financing needs. Yet, access to
finance remains a concern for small and
medium-sized business. The authorities are
putting forward a framework for assessing the
regulatory burden of new legislation on
entrepreneurs. At the same time, there still are
weaknesses in the areas of the judicial system,
the energy sector, transport, the business
environment and the innovation framework.
There are also barriers to the access to certain
regulated professions and to more simplified
authorisation procedures. Previous reforms
targeting the most restrictive business services,
including regulated professions, have been
halted and, sometimes, reversed.
Progress with reforming Portugal's public
administration is incomplete. There is still a
lack of a comprehensive reform to effectively
rationalise public administration. Coordination
between the central and local levels is weak
without homogenous implementing procedures
across the different layers of the public sector.
There are gaps in anti-corruption measures and
an overarching anti-corruption strategy is not
yet in place. In the judiciary, in spite of efforts
made, efficiency indicators remain poor,
especially for tax and insolvency courts.
In public procurement, progress was made
in transparency and reliability of data, while
competition is still a problem and the use of
direct awards remains high. Other
weaknesses in tendering include limited
ex-ante and ex-post controls, lack of capacity,
failure to provide satisfactory justification for
the recourse of direct awards and contract
splitting.
4
GDP growth
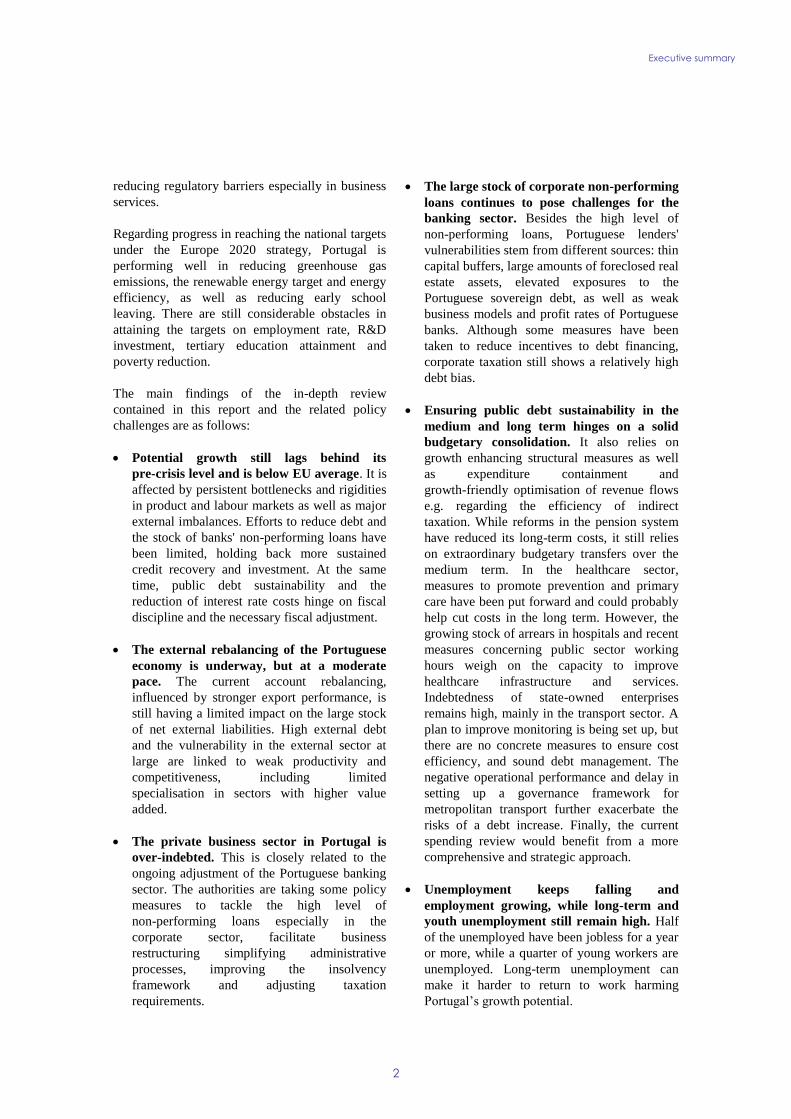
Portugal's economic recovery continues,
supported by a rebound in net exports but held
back by weak investment. Annual real GDP
growth accelerated significantly to 1.6 % in the
third quarter of 2016. This was due to a strong
resurgence in exports of goods and services, which
outweighed imports and increased the external
contribution to economic growth to 0.7 percentage
points. Domestic demand, which had strongly
fuelled expansion in 2015, reduced its positive
contribution to 1 pp. in the third quarter of 2016.
This drop was driven by falling investment and
slower growth in the consumption of durable
goods. Investment is estimated to have improved
only marginally by the end of 2016, due to
stabilisation in construction activity, while
employment growth is set to drive private
consumption up. Overall, the Commission's 2017
winter forecast estimates that real GDP growth
moderated to 1.3 % in 2016.
Graph 1.1: Real GDP growth and its components
Source: European Commission
Economic recovery is expected to pick up
modestly in 2017 and 2018. Growth in private
consumption is also projected to remain modest,
reflecting more stable consumption of durable
goods, a sustained high level of household debt
and higher oil prices. Coming from a low level in
2016, investment is set to gather pace in 2017.
This is driven by the gradual increase in EU
co-financing during the new programming period
and further support from external demand.
However, risks to the forecast are tilted to the
downside, as acceleration in growth will crucially
depend on investment, which has so far remained
volatile and sensitive to shocks.
Inflation
Inflation is projected to rise moderately in the
medium term. HICP inflation increased to around
1 % in annualised terms towards the end of 2016
on the back of higher prices of energy and, to a
lesser extent, services. The annual average rate
however remained lower at 0.6 % reflecting
downward energy price effects from the beginning
of the year. HICP inflation is forecast to climb
gradually to 1.4 % in 2018 under the assumption of
higher oil prices and related second-round effects
on energy-intensive services.
Labour market and social conditions
The recovery of the Portuguese labour market
continued in 2016. Employment growth continued
at a robust pace of 2 % year-on-year in Q3-2016,
mainly due to stronger demand for labour,
especially services. At the same time, the
unemployment rate fell to 10.5 % in Q4-2016. The
activity rate for the 20-64 age group remained
close to its historical highs at just below 80 % in
Q3-2016. Long-term unemployment remained
high at around 60 % of total unemployment in
2016 and weighed negatively on potential growth.
Youth unemployment, although decreasing, was
also high at 26.1 % in the third quarter of 2016.
The Portuguese labour market showed strong
recovery over 2014-2016. The fall in
unemployment between 2014 and 2016 was about
4.5 pps. faster than was to be expected on the basis
of the past relationship between GDP growth and
unemployment. This overshooting was the largest
in the EU (European Commission, 2016a). The
relatively job-rich recovery is probably linked to
factors including strong wage adjustment in the
previous years and with recent labour market
reforms. Strong growth in tourism, particularly in
2016, is also estimated to have had a substantial
positive impact on employment growth, as the
sector itself and many related services are labour
intensive. Overall, labour market conditions are
expected to continue to improve over the medium
term. Employment growth is however set to slow
down over the forecast horizon. Along with a
moderate decrease in the labour force, it is
expected to bring the unemployment rate from
around 11 % in 2016 to 9.4 % in 2018.
-10
-8
-6
-4
-2
0
2
4
6
2001
2002
2003
2004
2005
2006
2007
2008
2009
2010
2011
2012
2013
2014
2015
2016
2017
2018
Inventories investment Investment (GFCF) Consumption
Net exports Real GDP growth
pps.
1. ECONOMIC SITUATION AND OUTLOOK
1. Economic situation and outlook
5
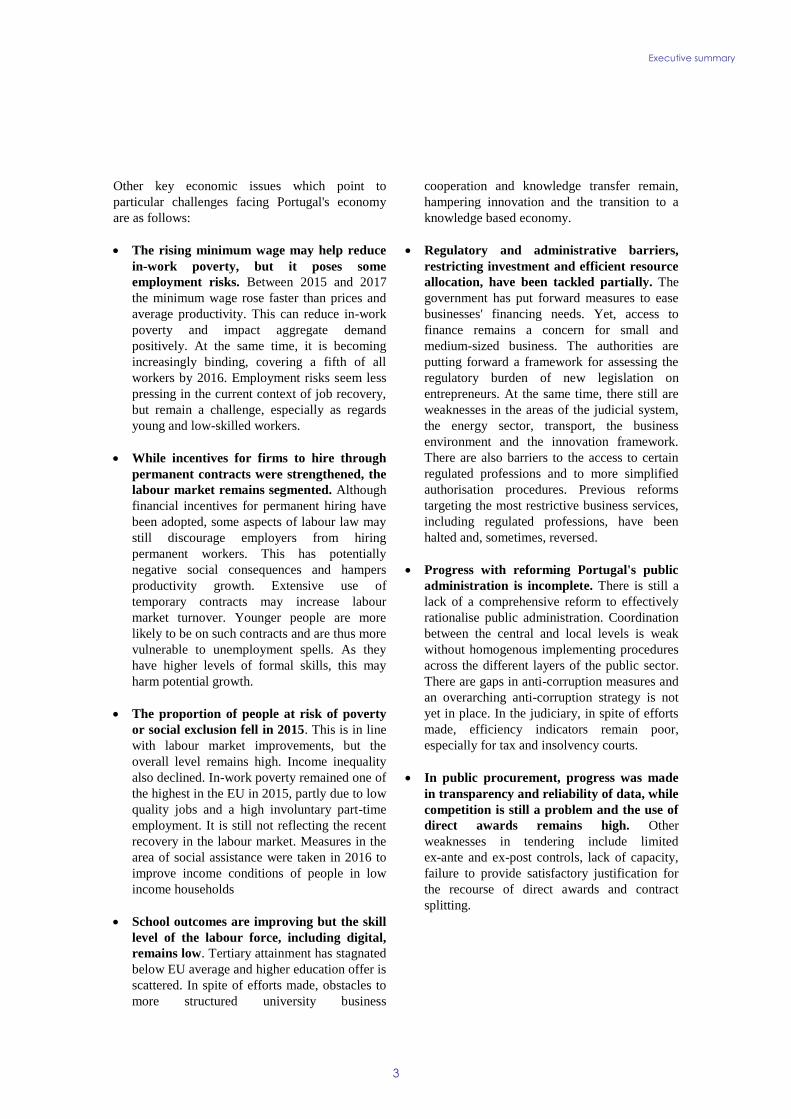
Graph 1.2: Activity, employment and unemployment
rates (quarterly)
(1) Activity and employment rates (% of population), total,
ages 20-64, seasonally adjusted
(2) Unemployment rate (% of labour force), total, ages
15-74, seasonally adjusted
Source: Eurostat
Portugal has witnessed negative net migration
flows since 2011. The average balance was about
32 000 people per year leaving the country
between 2011 and 2014. More recently, the
situation has been stabilising, along with
improving labour market conditions. In 2015 net
emigration declined to 10 500 people (or 1 per
1 000 inhabitants). Young people between 15 and
29 accounted for more than 40 % of total
emigration between 2011 and 2014 and there are
indications that the high-skilled are
over-represented (European Commission 2016b).
Hiring on permanent contracts continued, while
labour market segmentation remains an issue.
The Portuguese economy continued to add both
temporary and permanent jobs in 2015 and 2016
(Graph 1.3). At the same time, the creation of
permanent jobs was not sufficient to drive down
the share of temporary contracts in the economy.
Employees with fixed-term contracts accounted for
22.4 % of total employees in Q3-2016, one of the
highest proportions in the EU. About a quarter of
temporary employees move on to a permanent
contract every year (27.3 % in 2015, stable from
2014 and slightly higher than the EU average of
23 % in 2014, EU-SILC data). The wage premium
of permanent over temporary workers, not adjusted
for the different composition of the two groups, is
one of the highest in the EU (47 %, Eurostat 2014
structure of earnings survey). After adjusting for
personal characteristics (such as age, gender and
occupation) it falls to less than half of this, but it
still remains among the highest.
Graph 1.3: Employment by type (permanent, temporary,
self-employed), year-on-year changes
Source: European Commission
After two years of stagnation, the rate of
persons at-risk-of-poverty or social exclusion
declined in 2015. It reached 26.6 % (1), still nearly
3 pps. above the EU average. Children are
particularly affected, but their situation is slowly
improving. In-work poverty is one of the highest in
the EU, with a sharp increase by 0.2 pps. between
2014 and 2015 (still, not reflecting the recent
minimum wage increases as it is based in 2014
increases). The main reasons for this are
low-quality employment and insecure labour
relationships.
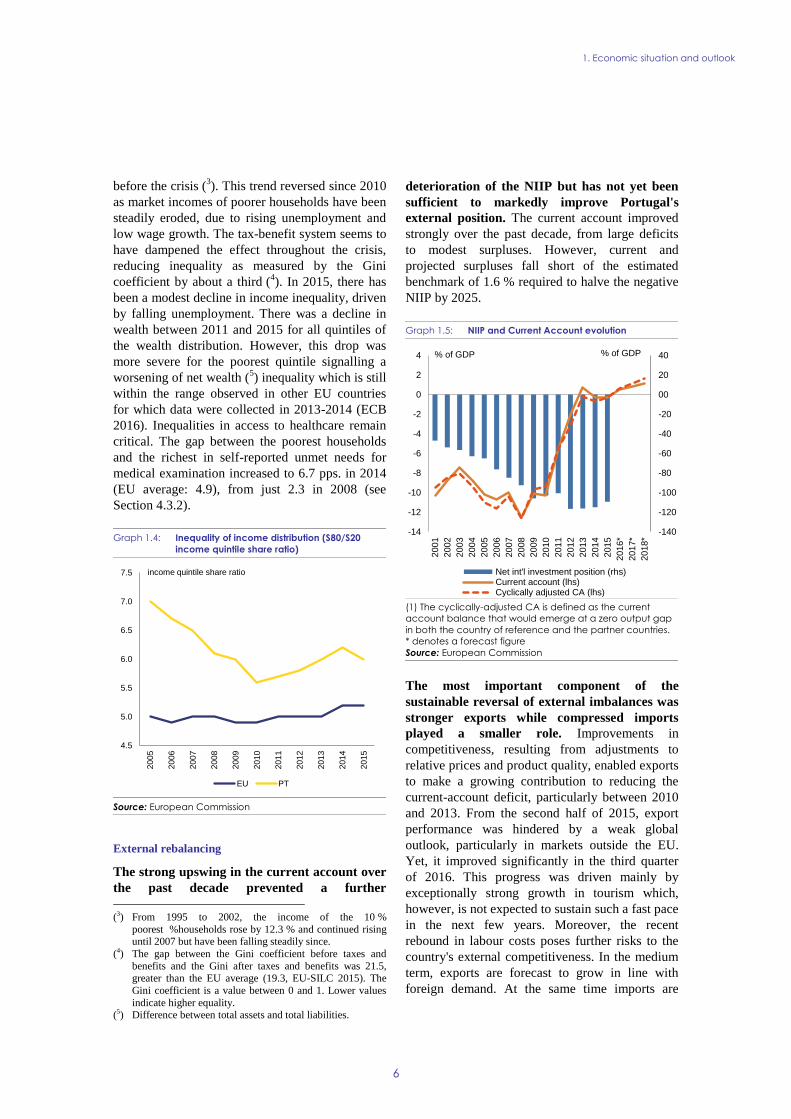
Portugal has one of the highest income
inequalities in Europe. Inequality, as measured
by the income quintile share ratio (2), has
historically been higher than in other EU countries,
though it was moving towards the EU average
(1) Provisional figures from the national statistical institute for
2016 point to a further decrease in the at-risk-of-poverty or social exclusion rate to 25.1% and to a stable in-work
poverty rate at 10.9%.
(2) The ratio of total income received by the 20 % of the population with the highest income (top quintile) to that
received by the 20 % of the population with the lowest
income (bottom quintile).
0
2
4
6
8
10
12
14
16
18
20
45
50
55
60
65
70
75
80
85
Q1-2
000
Q1-2
001
Q1-2
002
Q1-2
003
Q1-2
004
Q1-2
005
Q1-2
006
Q1-2
007
Q1-2
008
Q1-2
009
Q1-2
010
Q1-2
011
Q1-2
012
Q1-2
013
Q1-2
014
Q1-2
015
Q1-2
016
% of labour force
% of population
Unemployment rate 15-74 (rhs)Activity rate 20-64Employment rate 20-64
-250
-200
-150
-100
-50
0
50
100
150
200
250
Q1-2
000
Q1-2
001
Q1-2
002
Q1-2
003
Q1-2
004
Q1-2
005
Q1-2
006
Q1-2
007
Q1-2
008
Q1-2
009
Q1-2
010
Q1-2
011
Q1-2
012
Q1-2
013
Q1-2
014
Q1-2
015
Q1-2
016
Permanent employees
Temporary employees
Self employment
Overall
thousand people
1. Economic situation and outlook
6
before the crisis (3). This trend reversed since 2010
as market incomes of poorer households have been
steadily eroded, due to rising unemployment and
low wage growth. The tax-benefit system seems to
have dampened the effect throughout the crisis,
reducing inequality as measured by the Gini
coefficient by about a third (4). In 2015, there has
been a modest decline in income inequality, driven
by falling unemployment. There was a decline in
wealth between 2011 and 2015 for all quintiles of
the wealth distribution. However, this drop was
more severe for the poorest quintile signalling a
worsening of net wealth (5) inequality which is still
within the range observed in other EU countries
for which data were collected in 2013-2014 (ECB
2016). Inequalities in access to healthcare remain
critical. The gap between the poorest households
and the richest in self-reported unmet needs for
medical examination increased to 6.7 pps. in 2014
(EU average: 4.9), from just 2.3 in 2008 (see
Section 4.3.2).
Graph 1.4: Inequality of income distribution (S80/S20
income quintile share ratio)
Source: European Commission
External rebalancing
The strong upswing in the current account over
the past decade prevented a further
(3) From 1995 to 2002, the income of the 10 %
poorest %households rose by 12.3 % and continued rising until 2007 but have been falling steadily since.
(4) The gap between the Gini coefficient before taxes and
benefits and the Gini after taxes and benefits was 21.5,
greater than the EU average (19.3, EU-SILC 2015). The
Gini coefficient is a value between 0 and 1. Lower values
indicate higher equality. (5) Difference between total assets and total liabilities.
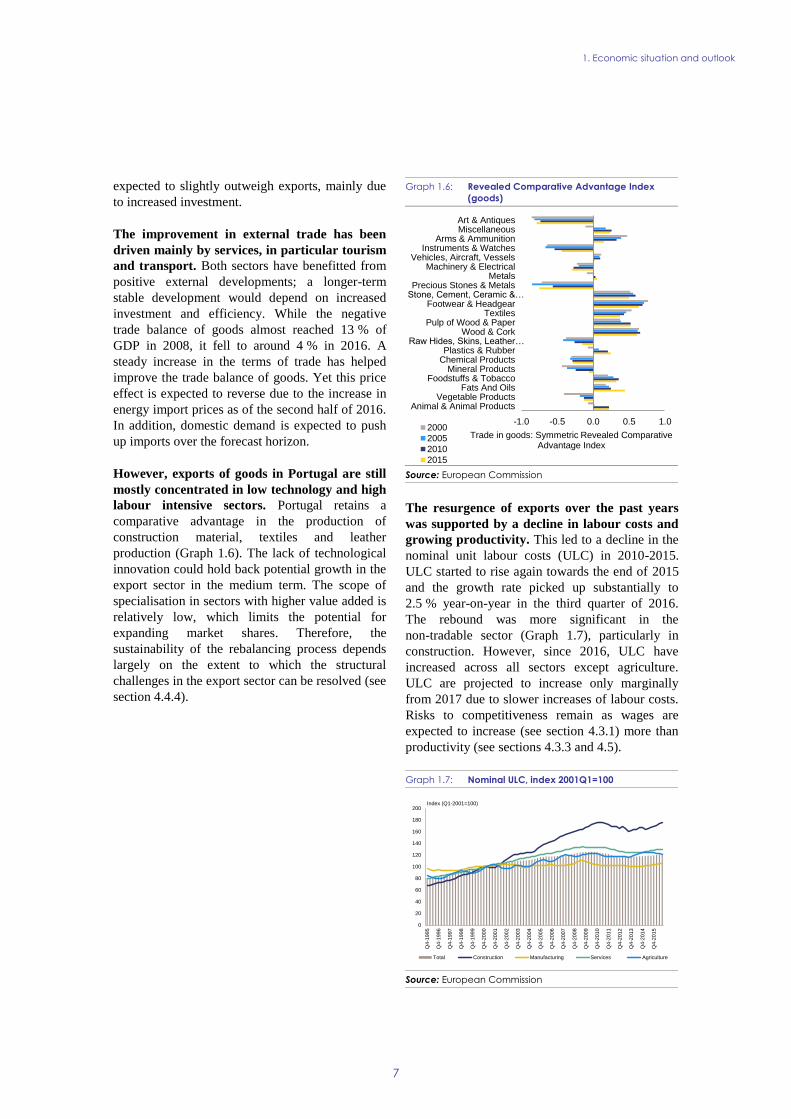
deterioration of the NIIP but has not yet been
sufficient to markedly improve Portugal's
external position. The current account improved
strongly over the past decade, from large deficits
to modest surpluses. However, current and
projected surpluses fall short of the estimated
benchmark of 1.6 % required to halve the negative
NIIP by 2025.
Graph 1.5: NIIP and Current Account evolution
(1) The cyclically-adjusted CA is defined as the current
account balance that would emerge at a zero output gap
in both the country of reference and the partner countries.
* denotes a forecast figure
Source: European Commission
The most important component of the
sustainable reversal of external imbalances was
stronger exports while compressed imports
played a smaller role. Improvements in
competitiveness, resulting from adjustments to
relative prices and product quality, enabled exports
to make a growing contribution to reducing the
current-account deficit, particularly between 2010
and 2013. From the second half of 2015, export
performance was hindered by a weak global
outlook, particularly in markets outside the EU.
Yet, it improved significantly in the third quarter
of 2016. This progress was driven mainly by
exceptionally strong growth in tourism which,
however, is not expected to sustain such a fast pace
in the next few years. Moreover, the recent
rebound in labour costs poses further risks to the
country's external competitiveness. In the medium
term, exports are forecast to grow in line with
foreign demand. At the same time imports are
4.5
5.0
5.5
6.0
6.5
7.0
7.5
2005
2006
2007
2008
2009
2010
2011
2012
2013
2014
2015
EU PT
income quintile share ratio
-140
-120
-100
-80
-60
-40
-20
00
20
40
-14
-12
-10
-8
-6
-4
-2
0
2
4
2001
2002
2003
2004
2005
2006
2007
2008
2009
2010
2011
2012
2013
2014
2015
2016*
2017*
2018*
Net int'l investment position (rhs)Current account (lhs)Cyclically adjusted CA (lhs)
% of GDP % of GDP
1. Economic situation and outlook
7
expected to slightly outweigh exports, mainly due
to increased investment.
The improvement in external trade has been
driven mainly by services, in particular tourism
and transport. Both sectors have benefitted from
positive external developments; a longer-term
stable development would depend on increased
investment and efficiency. While the negative
trade balance of goods almost reached 13 % of
GDP in 2008, it fell to around 4 % in 2016. A
steady increase in the terms of trade has helped
improve the trade balance of goods. Yet this price
effect is expected to reverse due to the increase in
energy import prices as of the second half of 2016.
In addition, domestic demand is expected to push
up imports over the forecast horizon.
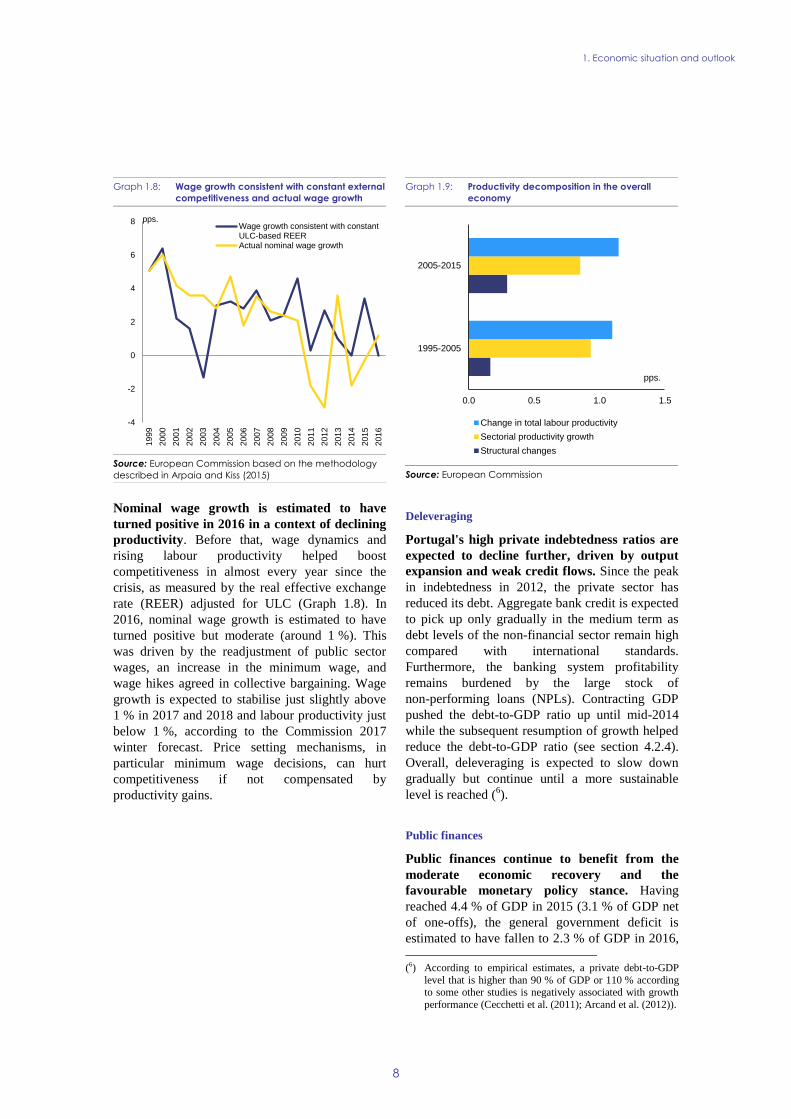
However, exports of goods in Portugal are still
mostly concentrated in low technology and high
labour intensive sectors. Portugal retains a
comparative advantage in the production of
construction material, textiles and leather
production (Graph 1.6). The lack of technological
innovation could hold back potential growth in the
export sector in the medium term. The scope of
specialisation in sectors with higher value added is
relatively low, which limits the potential for
expanding market shares. Therefore, the
sustainability of the rebalancing process depends
largely on the extent to which the structural
challenges in the export sector can be resolved (see
section 4.4.4).
Graph 1.6: Revealed Comparative Advantage Index
(goods)
Source: European Commission
The resurgence of exports over the past years
was supported by a decline in labour costs and
growing productivity. This led to a decline in the
nominal unit labour costs (ULC) in 2010-2015.
ULC started to rise again towards the end of 2015
and the growth rate picked up substantially to
2.5 % year-on-year in the third quarter of 2016.
The rebound was more significant in the
non-tradable sector (Graph 1.7), particularly in
construction. However, since 2016, ULC have
increased across all sectors except agriculture.
ULC are projected to increase only marginally
from 2017 due to slower increases of labour costs.
Risks to competitiveness remain as wages are
expected to increase (see section 4.3.1) more than
productivity (see sections 4.3.3 and 4.5).
Graph 1.7: Nominal ULC, index 2001Q1=100
Source: European Commission
-1.0 -0.5 0.0 0.5 1.0
Animal & Animal ProductsVegetable Products
Fats And OilsFoodstuffs & Tobacco
Mineral ProductsChemical ProductsPlastics & Rubber
Raw Hides, Skins, Leather…Wood & Cork
Pulp of Wood & PaperTextiles
Footwear & HeadgearStone, Cement, Ceramic &…Precious Stones & Metals
MetalsMachinery & Electrical
Vehicles, Aircraft, VesselsInstruments & Watches
Arms & AmmunitionMiscellaneousArt & Antiques
Trade in goods: Symmetric Revealed Comparative Advantage Index
2000
2005
2010
2015
0
20
40
60
80
100
120
140
160
180
200
Q4-1
995
Q4-1
996
Q4-1
997
Q4-1
998
Q4-1
999
Q4-2
000
Q4-2
001
Q4-2
002
Q4-2
003
Q4-2
004
Q4-2
005
Q4-2
006
Q4-2
007
Q4-2
008
Q4-2
009
Q4-2
010
Q4-2
011
Q4-2
012
Q4-2
013
Q4-2
014
Q4-2
015
Total Construction Manufacturing Services Agriculture
Index (Q1-2001=100)
1. Economic situation and outlook
8
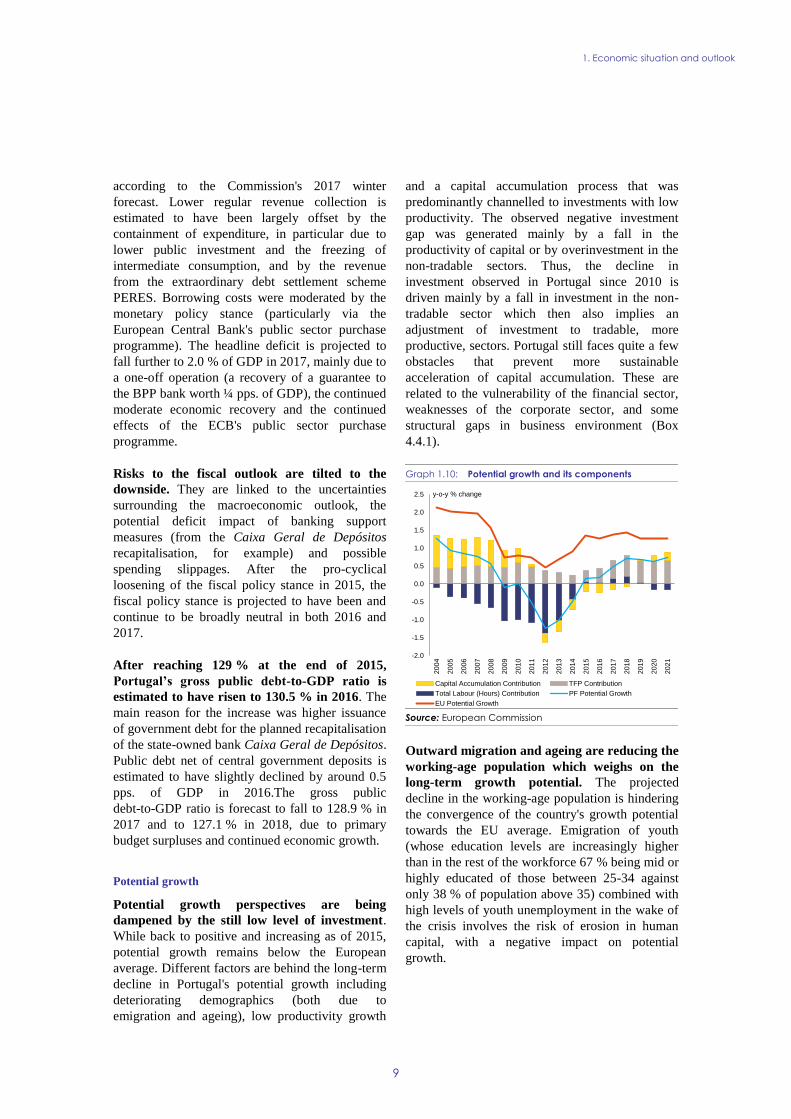
Graph 1.8: Wage growth consistent with constant external
competitiveness and actual wage growth
Source: European Commission based on the methodology
described in Arpaia and Kiss (2015)
Nominal wage growth is estimated to have
turned positive in 2016 in a context of declining
productivity. Before that, wage dynamics and
rising labour productivity helped boost
competitiveness in almost every year since the
crisis, as measured by the real effective exchange
rate (REER) adjusted for ULC (Graph 1.8). In
2016, nominal wage growth is estimated to have
turned positive but moderate (around 1 %). This
was driven by the readjustment of public sector
wages, an increase in the minimum wage, and
wage hikes agreed in collective bargaining. Wage
growth is expected to stabilise just slightly above
1 % in 2017 and 2018 and labour productivity just
below 1 %, according to the Commission 2017
winter forecast. Price setting mechanisms, in
particular minimum wage decisions, can hurt
competitiveness if not compensated by
productivity gains.
Graph 1.9: Productivity decomposition in the overall
economy
Source: European Commission
Deleveraging
Portugal's high private indebtedness ratios are
expected to decline further, driven by output
expansion and weak credit flows. Since the peak
in indebtedness in 2012, the private sector has
reduced its debt. Aggregate bank credit is expected
to pick up only gradually in the medium term as
debt levels of the non-financial sector remain high
compared with international standards.
Furthermore, the banking system profitability
remains burdened by the large stock of
non-performing loans (NPLs). Contracting GDP
pushed the debt-to-GDP ratio up until mid-2014
while the subsequent resumption of growth helped
reduce the debt-to-GDP ratio (see section 4.2.4).
Overall, deleveraging is expected to slow down
gradually but continue until a more sustainable
level is reached (6).
Public finances
Public finances continue to benefit from the
moderate economic recovery and the
favourable monetary policy stance. Having
reached 4.4 % of GDP in 2015 (3.1 % of GDP net
of one-offs), the general government deficit is
estimated to have fallen to 2.3 % of GDP in 2016,
(6) According to empirical estimates, a private debt-to-GDP
level that is higher than 90 % of GDP or 110 % according to some other studies is negatively associated with growth
performance (Cecchetti et al. (2011); Arcand et al. (2012)).
-4
-2
0
2
4
6
8
1999
2000
2001
2002
2003
2004
2005
2006
2007
2008
2009
2010
2011
2012
2013
2014
2015
2016
Wage growth consistent with constantULC-based REERActual nominal wage growth
pps.
0.0 0.5 1.0 1.5
1995-2005
2005-2015
Change in total labour productivity
Sectorial productivity growth
Structural changes
pps.
1. Economic situation and outlook
9
according to the Commission's 2017 winter
forecast. Lower regular revenue collection is
estimated to have been largely offset by the
containment of expenditure, in particular due to
lower public investment and the freezing of
intermediate consumption, and by the revenue
from the extraordinary debt settlement scheme
PERES. Borrowing costs were moderated by the
monetary policy stance (particularly via the
European Central Bank's public sector purchase
programme). The headline deficit is projected to
fall further to 2.0 % of GDP in 2017, mainly due to
a one-off operation (a recovery of a guarantee to
the BPP bank worth ¼ pps. of GDP), the continued
moderate economic recovery and the continued
effects of the ECB's public sector purchase
programme.
Risks to the fiscal outlook are tilted to the
downside. They are linked to the uncertainties
surrounding the macroeconomic outlook, the
potential deficit impact of banking support
measures (from the Caixa Geral de Depósitos
recapitalisation, for example) and possible
spending slippages. After the pro-cyclical
loosening of the fiscal policy stance in 2015, the
fiscal policy stance is projected to have been and
continue to be broadly neutral in both 2016 and
2017.
After reaching 129 % at the end of 2015,
Portugal’s gross public debt-to-GDP ratio is
estimated to have risen to 130.5 % in 2016. The
main reason for the increase was higher issuance
of government debt for the planned recapitalisation
of the state-owned bank Caixa Geral de Depósitos.
Public debt net of central government deposits is
estimated to have slightly declined by around 0.5
pps. of GDP in 2016.The gross public
debt-to-GDP ratio is forecast to fall to 128.9 % in
2017 and to 127.1 % in 2018, due to primary
budget surpluses and continued economic growth.
Potential growth
Potential growth perspectives are being
dampened by the still low level of investment.
While back to positive and increasing as of 2015,
potential growth remains below the European
average. Different factors are behind the long-term
decline in Portugal's potential growth including
deteriorating demographics (both due to
emigration and ageing), low productivity growth
and a capital accumulation process that was
predominantly channelled to investments with low
productivity. The observed negative investment
gap was generated mainly by a fall in the
productivity of capital or by overinvestment in the
non-tradable sectors. Thus, the decline in
investment observed in Portugal since 2010 is
driven mainly by a fall in investment in the non-
tradable sector which then also implies an
adjustment of investment to tradable, more
productive, sectors. Portugal still faces quite a few
obstacles that prevent more sustainable
acceleration of capital accumulation. These are
related to the vulnerability of the financial sector,
weaknesses of the corporate sector, and some
structural gaps in business environment (Box
4.4.1).
Graph 1.10: Potential growth and its components
Source: European Commission
Outward migration and ageing are reducing the
working-age population which weighs on the
long-term growth potential. The projected
decline in the working-age population is hindering
the convergence of the country's growth potential
towards the EU average. Emigration of youth
(whose education levels are increasingly higher
than in the rest of the workforce 67 % being mid or
highly educated of those between 25-34 against
only 38 % of population above 35) combined with
high levels of youth unemployment in the wake of
the crisis involves the risk of erosion in human
capital, with a negative impact on potential
growth.
-2.0
-1.5
-1.0
-0.5
0.0
0.5
1.0
1.5
2.0
2.5
2004
2005
2006
2007
2008
2009
2010
2011
2012
2013
2014
2015
2016
2017
2018
2019
2020
2021
Capital Accumulation Contribution TFP Contribution
Total Labour (Hours) Contribution PF Potential Growth
EU Potential Growth
y-o-y % change
1. Economic situation and outlook
10
Table 1.1: Key economic, financial and social indicators - Portugal
(1) Sum of portfolio debt instruments, other investment and reserve assets
(2.3) domestic banking groups and stand-alone banks.
(4) domestic banking groups and stand-alone banks, foreign (EU and non-EU) controlled subsidiaries and foreign (EU and
non-EU) controlled branches.
(*) Indicates BPM5 and/or ESA95
Source: European Commission, ECB
2004-2008 2009 2010 2011 2012 2013 2014 2015 2016 2017 2018
Real GDP (y-o-y) 1.4 -3.0 1.9 -1.8 -4.0 -1.1 0.9 1.6 1.3 1.6 1.5
Private consumption (y-o-y) 1.9 -2.3 2.4 -3.6 -5.5 -1.2 2.3 2.6 2.1 1.6 1.2
Public consumption (y-o-y) 1.3 2.6 -1.3 -3.8 -3.3 -2.0 -0.5 0.8 0.6 0.4 0.5
Gross fixed capital formation (y-o-y) 0.6 -7.6 -0.9 -12.5 -16.6 -5.1 2.3 4.5 -1.5 3.8 4.2
Exports of goods and services (y-o-y) 4.9 -10.2 9.5 7.0 3.4 7.0 4.3 6.1 3.9 4.1 4.2
Imports of goods and services (y-o-y) 5.0 -9.9 7.8 -5.8 -6.3 4.7 7.8 8.2 3.9 4.3 4.3
Output gap 0.0 -1.9 0.0 -1.3 -4.1 -4.3 -3.1 -1.6 -0.7 0.2 0.9
Potential growth (y-o-y) 0.9 -0.1 0.0 -0.5 -1.2 -0.9 -0.4 0.1 0.4 0.7 0.9
Contribution to GDP growth:
Domestic demand (y-o-y) 1.6 -2.8 1.1 -5.7 -7.3 -2.0 1.7 2.5 1.3 1.7 1.5
Inventories (y-o-y) 0.2 -1.2 0.9 -0.4 -0.3 0.0 0.4 0.0 0.0 0.0 0.0
Net exports (y-o-y) -0.5 0.9 -0.1 4.3 3.6 0.9 -1.3 -0.8 0.0 -0.1 0.0
Contribution to potential GDP growth:
Total Labour (hours) (y-o-y) -0.4 -1.0 -1.0 -1.1 -1.4 -1.0 -0.3 -0.1 0.1 0.2 0.3
Capital accumulation (y-o-y) 0.8 0.5 0.4 0.1 -0.3 -0.3 -0.3 -0.2 -0.2 -0.2 -0.1
Total factor productivity (y-o-y) 0.5 0.5 0.6 0.5 0.4 0.3 0.3 0.4 0.5 0.6 0.6
Current account balance (% of GDP), balance of payments -10.1 -10.4 -10.1 -6.0 -1.8 1.5 0.1 0.4 . . .
Trade balance (% of GDP), balance of payments -8.4 -6.7 -7.1 -3.7 0.1 1.9 1.1 1.8 . . .
Terms of trade of goods and services (y-o-y) -0.6 4.8 -1.3 -2.0 0.5 1.7 1.2 3.4 1.1 -0.4 0.0
Capital account balance (% of GDP) 1.3 1.2 1.4 1.5 2.1 1.6 1.5 1.2 . . .
Net international investment position (% of GDP) -80.0 -107.9 -104.3 -100.7 -116.5 -116.3 -114.9 -109.3 . . .
Net marketable external debt (% of GDP) (1) -50.5* -74.6* -72.6* -72.9 -82.0 -81.3 -84.6 -82.2 . . .
Gross marketable external debt (% of GDP) (1) 178.0 215.3 215.3 205.7 219.1 206.8 214.5 202.2 . . .
Export performance vs. advanced countries (% change over 5 years) 4.2 -0.3 0.7 -0.2 -6.7 1.5 1.6 4.97 . . .
Export market share, goods and services (y-o-y) -2.2 0.0 -8.9 0.4 -4.5 6.8 1.4 -1.0 . . .
Net FDI flows (% of GDP) 0.0 -0.8 -5.1 2.5 -7.9 -1.8 -1.6 -0.5 . . .
Savings rate of households (net saving as percentage of net disposable income) 0.6 2.7 1.3 -0.9 -0.5 -0.2 -3.3 -4.0 . . .
Private credit flow, consolidated (% of GDP) 14.3 5.3 5.3 -0.9 -3.6 -1.8 -5.8 -2.3 . . .
Private sector debt, consolidated (% of GDP) 179.0 204.1 201.5 204.2 211.7 204.3 192.4 181.5 . . .
of which household debt, consolidated (% of GDP) 83.1 92.1 90.7 90.5 90.7 86.3 82.3 77.5 . . .
of which non-financial corporate debt, consolidated (% of GDP) 95.9 112.0 110.8 113.7 121.0 118.0 110.1 104.0 . . .
Corporations, net lending (+) or net borrowing (-) (% of GDP) -6.1 -3.6 -1.2 0.7 2.7 3.5 6.0 4.3 2.9 2.9 3.7
Corporations, gross operating surplus (% of GDP) 19.9 20.8 20.8 21.0 21.2 21.3 21.6 21.8 21.9 22.2 23.1
Households, net lending (+) or net borrowing (-) (% of GDP) 1.7 4.4 3.4 2.6 2.9 3.6 2.2 1.0 1.4 1.2 1.1
Deflated house price index (y-o-y) -1.1 1.0 -1.0 -6.5 -8.7 -2.7 3.9 2.3 . . .
Residential investment (% of GDP) 5.5 4.1 3.6 3.3 2.9 2.5 2.5 2.5 . . .
GDP deflator (y-o-y) 2.7 1.1 0.6 -0.3 -0.4 2.3 0.8 2.1 1.5 1.4 1.4
Harmonised index of consumer prices (HICP, y-o-y) 2.6 -0.9 1.4 3.6 2.8 0.4 -0.2 0.5 0.6 1.3 1.4
Nominal compensation per employee (y-o-y) 3.1 2.4 2.1 -1.8 -3.1 3.6 -1.8 -0.3 1.4 1.2 1.2
Labour productivity (real, person employed, y-o-y) 1.4 -0.3 3.4 0.1 0.1 1.8 -0.5 0.2 . . .
Unit labour costs (ULC, whole economy, y-o-y) 1.6 2.7 -1.2 -2.0 -3.2 1.8 -1.3 -0.5 1.3 0.4 0.3
Real unit labour costs (y-o-y) -1.1 1.6 -1.9 -1.7 -2.8 -0.5 -2.0 -2.5 -0.2 -0.9 -1.1
Real effective exchange rate (ULC, y-o-y) 0.0 0.0 -2.5 -2.3 -5.8 2.6 -1.7 -3.6 1.2 -0.6 -1.4
Real effective exchange rate (HICP, y-o-y) 0.5 -0.6 -3.1 0.7 -1.6 0.3 -0.5 -2.6 1.5 -1.1 .
Tax rate for a single person earning the average wage (%) 22.4 22.6 22.9 24.5 22.8 27.5 27.2 28.3 . . .
Tax rate for a single person earning 50% of the average wage (%) 14.0* 13.8 13.9 14.2 11.0 11.0 11.0 11.0 . . .
Total Financial sector liabilities, non-consolidated (y-o-y) 8.5 6.7 6.3 -8.4 -0.4 -4.9 0.9 -1.9 . . .
Tier 1 ratio (%) (2) . 7.5 7.9 8.1 11.0 11.7 11.0 12.1 . . .
Return on equity (%) (3) . 4.2 6.3 -5.4 -5.0 -11.9 -21.8 -1.6 . . .
Gross non-performing debt (% of total debt instruments and total loans and
advances) (4) . 2.5 3.7 5.3 7.0 7.8 12.7 14.4 . . .
Unemployment rate 8.7 10.7 12.0 12.9 15.8 16.4 14.1 12.6 11.2 10.1 9.4
Long-term unemployment rate (% of active population) 3.6 4.2 5.7 6.2 7.7 9.3 8.4 7.2 . . .
Youth unemployment rate (% of active population in the same age group) 20.9 25.3 28.2 30.2 38.0 38.1 34.7 32.0 28.2 . .
Activity rate (15-64 year-olds) 73.4 73.4 73.7 73.6 73.4 73.0 73.2 73.4 . . .
People at risk of poverty or social exclusion (% total population) 25.9 24.9 25.3 24.4 25.3 27.5 27.5 26.6 . . .
Persons living in households with very low work intensity (% of total
population aged below 60) 6.6 7.0 8.6 8.3 10.1 12.2 12.2 10.9 . . .
General government balance (% of GDP) -4.7 -9.8 -11.2 -7.4 -5.7 -4.8 -7.2 -4.4 -2.3 -2.0 -2.2
Tax-to-GDP ratio (%) 34.5 33.4 33.7 35.5 34.5 37.2 37.1 37.1 37.2 36.9 36.6
Structural budget balance (% of GDP) . . -8.5 -6.6 -3.5 -2.9 -1.7 -2.2 -2.2 -2.3 -2.6
General government gross debt (% of GDP) 67.7 83.6 96.2 111.4 126.2 129.0 130.6 129.0 130.5 128.9 127.1
forecast
11
Progress with the implementation of the
recommendations addressed to Portugal in
2016 (7) has to be seen in a longer term
perspective since the introduction of the
European Semester in 2011. Portugal
successfully completed the three year EU-IMF
financial assistance programme in 2014. In the
course of the programme, it adopted a wide range
of structural reforms. While implementing the
programme, Portugal received only one
country-specific recommendation to meet the
programme commitments (8). As of 2014, Portugal
returned to the regular cycle of EU economic
surveillance under the European Semester and
received a full set of recommendations.
The reform efforts over the period 2011-2016
have helped Portugal to become more
competitive and attractive for investors.
Portugal carried out an ambitious fiscal
consolidation underpinned by a number of fiscal
governance and structural-fiscal measures
(organisation of public administration, public
finance management, tax administration, SOEs and
PPPs). A number of measures were carried out to
unwind the public and private, internal and
external imbalances and increase the growth
potential, while mitigating negative social impacts.
In light of the need of correcting the country's
imbalances, the authorities introduced reforms to
product markets (energy, housing, services,
telecommunications, and transport), labour market
(wage setting, working time arrangements,
individual dismissal, unemployment benefits,
active labour market policies), education system
(increased number of compulsory education years,
enhanced vocational and professional training,
enhanced external evaluation and transparency),
business environment (licensing, services and
regulated professions), judicial sector (new
insolvency, arbitration, competition laws and new
judiciary map). Measures were also targeted at
strengthening the banking sector. Despite those
reforms, policy gaps persist regarding product and
services markets, corporate debt restructuring,
fiscal issues and selected areas of the labour
market.
(7) For the assessment of other reforms implemented in the
past, see in particular section 4. (8) European Commission, Ex-post evaluation of the economic
adjustment programme, Portugal 2011-2014, Institutional
paper 040, November 2016
Overall, Portugal has made limited progress (9)
in addressing the 2016 country-specific
recommendations.
There has been limited progress towards making
public finances more sustainable (CSR1). A solid
budgetary consolidation relies on the timely and
strict implementing the budget framework law,
reviewing and rationalising public spending and
further improving revenue collection. The
restructuring of state-owned enterprises, to make
them fiscally sustainable, has not still been fully
addressed. The reliance of the pension system on
budgetary transfers has only been reduced to a
limited extent thus creating intergenerational
inequalities. In the health sector, the government
has adopted measures aimed at promoting disease
prevention and public health policies. At the same
time, given the lack of sound budget planning and
implementation in hospitals they are not enough to
guarantee arrears clearance and spending control.
Portugal made limited progress in ensuring that the
minimum wage is consistent with the objectives of
promoting employment and competitiveness across
sectors (CSR2). After consulting the social
partners, the government has raised the minimum
wage by 5.1 %, beyond inflation and average
productivity developments. While increasing
aggregate demand and contributing to reducing
in-work poverty, by growing faster than overall
compensation per employee and covering an
increasing share of workers, it may make the
hiring of especially lower productivity workers
harder. The government has established a structure
to monitor the impact of minimum wage
developments. Its quarterly reports are discussed
with social partners.
Some progress has been made regarding the
recommended reforms on the labour market
(CSR3). While limited progress has been observed
in effectively activating the long-term unemployed
and coordinating employment and social services
there is some progress in reducing labour market
segmentation. A study has been conducted into the
effectiveness of active labour market policies.
(9) Information on the level of progress and the actions taken
to address the policy advice in each respective subpart of a
CSR is presented in the Overview Table in the Annex. This overall assessment does not include an assessment of
compliance with the Stability and Growth Pact.
2. PROGRESS WITH COUNTRY-SPECIFIC RECOMMENDATIONS
2. Progress with country-specific recommendations
12
Based on its results, the government redesigned its
employment support programme to promote hiring
on open-ended contracts though the number of
people covered by this measure is limited. At the
same time, long-term unemployment remains high.
The introduction of one stop shops for both
employment and social services is also planned,
but has not yet been implemented.
Progress in the financial sector (CSR4) remains
limited. Despite some actions taken recently to
address the high stock of non-performing loans,
there is no comprehensive strategy. Efforts to
provide alternative means of financing remain
limited. The authorities have published a strategic
plan to support the capitalisation of companies (the
Capitalizar Programme) which has yet to be fully
implemented. The debt bias in corporate taxation is
addressed by broadening the scope of the
allowance for corporate equity regime.
Some progress has been observed in removing
regulatory barriers and improving the business
environment (CSR5). The authorities have
introduced some measures to make the justice
system more efficient, especially as regards
organisational improvements in the courts.
However, the sector's overall performance remains
low, especially where dealing with tax litigation is
concerned. Measures are ongoing to improve
transparency and reliability of public procurement
data and practices. The government has established
quarterly monitoring and reporting procedures
related to local and regional public private
partnership and concessions, but the relatively high
use of direct awards remains a concern. Licensing
has been reformed, but its uneven implementation
across different layers of the public administration
is detrimental to confidence and investment.
Existing regulatory barriers in some business
services sectors still prevent resources from being
allocated efficiently. Portugal is developing a set
of measures to improve university-business
cooperation and the commercialisation of
knowledge. The government is currently working
on an international revision of the higher education
system. Nevertheless, an overall strategy to foster
cooperation between universities and the business
sector has not so far been implemented.
2. Progress with country-specific recommendations
13
Table 2.1: Summary table on 2016 CSR assessment
Source: Commission Services
Portugal Overall assessment of progress with 2016 CSRs: Limited progress[1]
Limited progress
Some progress in conducting a comprehensive expenditure review
Some progress in ensuring the long-term sustainability of the healthcare sector and access to
primary care
Limited progress in reducing the reliance of pension system on budgetary transfers.
No progress in refocusing restructuring plans of State Owned Enterprises
Limited progress
CSR 2: In consultation with social partners, ensure that
the minimum wage is consistent with the objectives of
promoting employment and competitiveness across
sectors . (MIP relevant)
Limited progress as regards the minimum wage.
Some progress
Limited progress in ensuring effective activation of long-term unemployed and in
improving the coordination between employment and social services.
Limited progress
Limited progress in facilitating the cleaning up of the balance sheets of credit institutions
Some progress in reducing the debt bias in corporate taxation.
Limited progress in improving the access to finance for start-ups and small and medium-
sized enterprises via the capital market
Some progress
Some progress in increasing transparency in public procurement.
Limited progress in improving and accelerating licensing procedures by the end of 2016
Some progress in accelerating tax litigations by the end of 2016
Limited progress in reducing regulatory barriers especially in business services by the end
of 2016
Some progress in incentivising cooperation between universities and the business sector
[1] This overall assessment of CSR1 does not include an assessment of compliance with the Stability and Growth Pact.
CSR 1: E nsure a durable correction of the excessive
deficit, in accordance with the relevant decisions or
recommendations under the excessive deficit procedure,
by taking the necessary structural measures and by
using all windfall gains for deficit and debt reduction.
Thereafter, achieve an annual fiscal adjustment of at
least 0,6 % of GDP. Conduct, by February 2017, a
comprehensive expenditure review and strengthen
expenditure control, cost effectiveness and adequate
budgeting at all levels of public administration. Ensure
the long-term sustainability of the health sector, without
compromising access to primary healthcare. Reduce the
reliance of the pension system on budgetary transfers.
By the end of 2016, refocus ongoing restructuring plans
of state-owned enterprises. (MIP relevant)
CSR 3: Ensure the effective activation of the long-term
unemployed and improve the coordination between
employment and social services. Strengthen incentives
for firms to hire through permanent contracts. (MIP
relevant)
CSR 4: Take measures, by October 2016, to facilitate
the cleaning up of the balance sheets of credit
institutions and address the high level of non-
performing loans. Reduce the debt bias in corporate
taxation and improve the access to finance for start-ups
and small and medium-sized enterprises via the capital
market. (MIP relevant)
CSR 5: Increase transparency and efficiency in public
procurement as regards public-private partnerships and
concessions. By the end of 2016, improve and
accelerate administrative and licensing procedures,
accelerate tax litigations and reduce regulatory
barriers, especially in business services. Incentivise
cooperation between universities and the business
sector. (MIP relevant)
Some progress in strengthening incentives for firms to hire through permanent contracts.
2. Progress with country-specific recommendations
14
Box 2.1: Contribution of the EU budget to structural change in Portugal
Portugal is a significant beneficiary of European Structural and Investment Funds (ESI Funds), with an
allocaton of up to EUR 25.8 billion until 2020. This is equivalent to around 2 % of GDP annually (over 2014-
2017) and 73 % of the total public investment1. Out of the EU financing EUR 2.6 billion is planned to be
delivered via financial instruments, which is five times higher than the previous period. By 31 December
2016, an estimated EUR 11.4 billion, which represents about 44 % of the total allocation for ESI Funds,
have been allocated to concrete projects.
Financing under the European Fund for Strategic Investments, Horizon 2020, the Connecting Europe Facility and other directly managed EU funds is additional to the ESI Funds. By end 2016, Portugal has signed agreements for nearly EUR 573 million for projects under the Connecting Europe Facility. The EIB Group approved financing under EFSI amounts to EUR 1 billion, which is expected to trigger nearly EUR 3.4 billion in total investments (as of end 2016). ESI Funds helped progress on a number of structural reforms in 2015 and 2016 via ex-ante conditionalities2 and targeted investment. Examples include the creation of a national system of credits and a national quality assurance system for vocational education and training, and building administrative capacity of the Public Administration, the development of the transport plan which contributes to focus investments on mature and strategic projects, and of specialisation strategies which favour synergies between public and private partners aiming at concentrating efforts and investments on each region’s relative strengths. These reforms have prepared the ground for better implementation of public investment projects in general, including those financed from national sources and from the other EU instruments mentioned above. The fulfilment of ex-ante conditionalities is on track. Administrative reforms support is also available through targeted financing under the European Social Fund, advice from the Structural Reform Support Service and, indirectly, through technical assistance. The relevant CSRs focusing on structural issues were taken into account when designing the 2014-2020 programmes. Compared to the 2007-2013 programming period, there is a significant increase in innovation, R&D, SME support and low-carbon economy. This renewed focus of the funds reflects the need of rebalancing the Portuguese economy towards a higher share of the tradable sectors while alleviating the effects of the economic adjustment on the most vulnerable parts of the population and reducing social and territorial disparities. In addition to challenges identified in the past CSRs, ESI Funds address wider structural obstacles to growth, competitiveness and job creation. These include improving the access to finance for small and medium-sized enterprises, incentivising research and cooperation between universities and the business sector, promoting the qualification of human capital and improving the functioning of employment and social services. EU investments are expected to support more than 24 500 enterprises, increasing the share of exports in the SMEs turnover (estimated to reach 27 % of SMEs turnover by 2023) and favouring job creation (more than 35 000 direct jobs estimated) and will incentivize innovative projects favouring cooperation between research institutions and more than 1 300 enterprises. R&D expenditure of companies is projected to rise considerably, from 1.2 % (2012) to 2 % of GVA by 2023, contributing to increase the overall R&D expenditure.
https://cohesiondata.ec.europa.eu/countries/PT
1 National public investment is defined as gross capital formation + investment grants + national expenditure on agriculture and
fisheries 2 Before programmes are adopted, Member States are required to comply with a number of ex-ante conditionalities, which aim at improving framework and conditions for the majority of public investments areas. For Members States that did not fulfil all the ex-ante conditionalities by the end 2016, the Commission has the possibility to propose the temporary suspension of all or part of interim payments.
15
The 2017 Alert Mechanism Report called for
further in-depth analysis to monitor progress in
the unwinding of the excessive imbalances
identified for Portugal in the 2016 MIP cycle.
The selection was also motivated by the fact that
Portugal was identified as having excessive
imbalances in spring 2016, so that a new IDR is
needed to assess how these imbalances evolve. The
excessive imbalances arise from external
liabilities, high levels of private and public debt
levels and high unemployment in a low-growth
environment.
Analyses integrated in this Country Report
provide an in-depth review (IDR) of how the
imbalances identified have developed. In
particular, analysis relevant to the IDR may be
found in the following sections: Public finances
and taxation (see Section 4.1); Financial sector:
banking sector, access to finance, private
indebtedness, vulnerability linked to the highly
negative net international investment position (see
Section 4.2); Labour market: high youth and
long-term unemployment (see Section 4.3);
Investment: external competitiveness, private and
public investment, business environment (see
Section 4.4); Sectoral policies: R&I, competition
in product and services markets (see Sections 4.5.1
and 4.5.2); Public administration: efficiency of
public administration, public procurement, judicial
system (see Section 4.6)
3.1. IMBALANCES AND THEIR GRAVITY
The net international investment position
(NIIP) remains negative. It was close to -110 %
of GDP in 2015, one of the most negative NIIPs in
the EU, well beyond its estimated prudential level
of -48 %. Moreover, its composition is tilted
towards marketable debt rather than more stable
FDI and equity components. Improved growth
prospects and continuous current account surpluses
of around 1.6 % of GDP per year would be
required to halve the negative NIIP and reach a
more sustainable position by 2025.
Some deleveraging efforts, in particular for
households, notwithstanding, the private
debt-to-GDP ratio remains high. Private debt is
still well above prudent levels in a context of also
high government debt and low potential growth
and inflation. Total household non-consolidated
debt reached 76 % of GDP in early 2016 and
non-consolidated corporate debt was over 117 %.
Corporate indebtedness remains amongst the
highest in the EU and deleveraging needs in this
sector are assessed at between 10 % and 20 % of
GDP (10
). The share of non-performing loans
(NPLs) has stabilized although at a high level over
the recent quarters, while it is still increasing in
some sectors, in particular construction, real estate
and trade.
The large stock of corporate non-performing
loans, low profitability, exposure to sovereign
debt risks and weak capital buffers are putting
pressure on the banking sector. The deterioration
in the quality of assets, in particular in the
corporate sector where the ratio of overdue loans
was 16.2 % in the end of first half 2016, weighs on
the banking sector's aggregate balance sheet. It is
one of the factors, along with demand for loans
and low capital buffers to impede the productive
allocation of credit and investment.
(10) Although the exact figures differ among studies, it is
estimated that a private debt-to-GDP level that is higher
than 90 % of GDP or 110 % according to some other studies is negatively associated with growth performance
(Cecchetti et al. (2011); Arcand et al. (2012)).
3. SUMMARY OF THE MAIN FINDINGS FROM THE MIP IN-
DEPTH REVIEW
3. Summary of the main findings from the MIP in-depth review
16
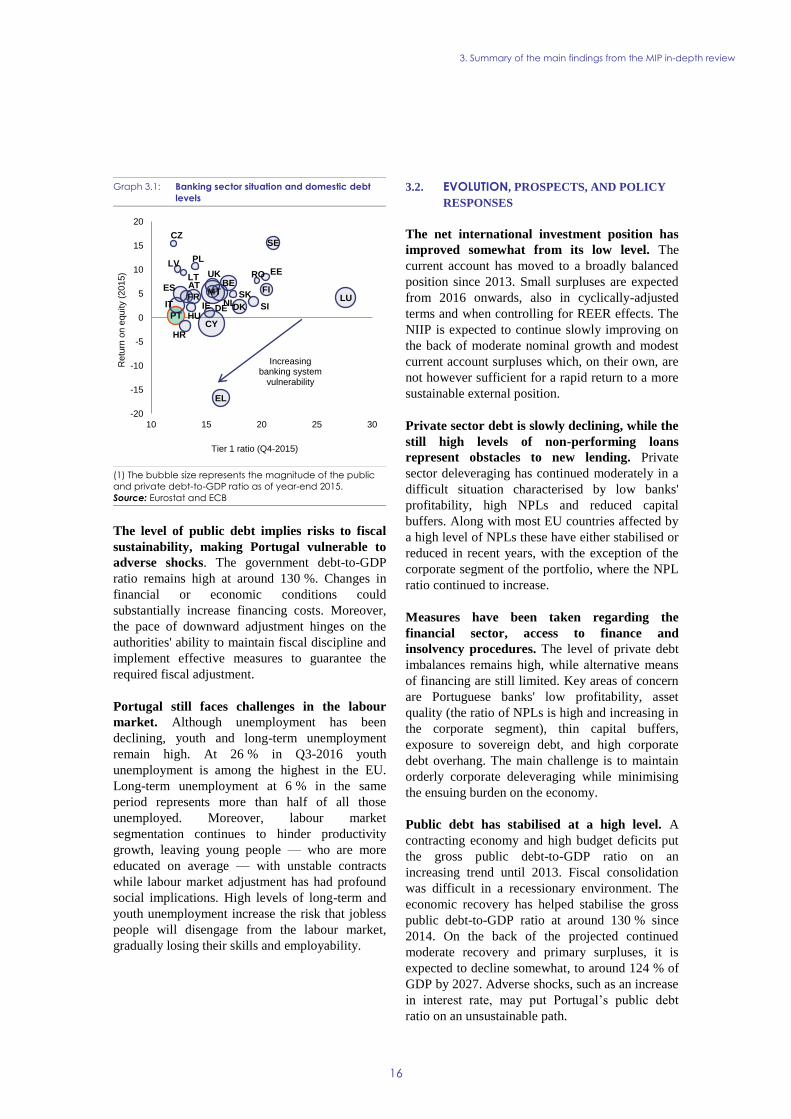
Graph 3.1: Banking sector situation and domestic debt
levels
(1) The bubble size represents the magnitude of the public
and private debt-to-GDP ratio as of year-end 2015.
Source: Eurostat and ECB
The level of public debt implies risks to fiscal
sustainability, making Portugal vulnerable to
adverse shocks. The government debt-to-GDP
ratio remains high at around 130 %. Changes in
financial or economic conditions could
substantially increase financing costs. Moreover,
the pace of downward adjustment hinges on the
authorities' ability to maintain fiscal discipline and
implement effective measures to guarantee the
required fiscal adjustment.
Portugal still faces challenges in the labour
market. Although unemployment has been
declining, youth and long-term unemployment
remain high. At 26 % in Q3-2016 youth
unemployment is among the highest in the EU.
Long-term unemployment at 6 % in the same
period represents more than half of all those
unemployed. Moreover, labour market
segmentation continues to hinder productivity
growth, leaving young people — who are more
educated on average — with unstable contracts
while labour market adjustment has had profound
social implications. High levels of long-term and
youth unemployment increase the risk that jobless
people will disengage from the labour market,
gradually losing their skills and employability.
3.2. EVOLUTION, PROSPECTS, AND POLICY
RESPONSES
The net international investment position has
improved somewhat from its low level. The
current account has moved to a broadly balanced
position since 2013. Small surpluses are expected
from 2016 onwards, also in cyclically-adjusted
terms and when controlling for REER effects. The
NIIP is expected to continue slowly improving on
the back of moderate nominal growth and modest
current account surpluses which, on their own, are
not however sufficient for a rapid return to a more
sustainable external position.
Private sector debt is slowly declining, while the
still high levels of non-performing loans
represent obstacles to new lending. Private
sector deleveraging has continued moderately in a
difficult situation characterised by low banks'
profitability, high NPLs and reduced capital
buffers. Along with most EU countries affected by
a high level of NPLs these have either stabilised or
reduced in recent years, with the exception of the
corporate segment of the portfolio, where the NPL
ratio continued to increase.
Measures have been taken regarding the
financial sector, access to finance and
insolvency procedures. The level of private debt
imbalances remains high, while alternative means
of financing are still limited. Key areas of concern
are Portuguese banks' low profitability, asset
quality (the ratio of NPLs is high and increasing in
the corporate segment), thin capital buffers,
exposure to sovereign debt, and high corporate
debt overhang. The main challenge is to maintain
orderly corporate deleveraging while minimising
the ensuing burden on the economy.
Public debt has stabilised at a high level. A
contracting economy and high budget deficits put
the gross public debt-to-GDP ratio on an
increasing trend until 2013. Fiscal consolidation
was difficult in a recessionary environment. The
economic recovery has helped stabilise the gross
public debt-to-GDP ratio at around 130 % since
2014. On the back of the projected continued
moderate recovery and primary surpluses, it is
expected to decline somewhat, to around 124 % of
GDP by 2027. Adverse shocks, such as an increase
in interest rate, may put Portugal’s public debt
ratio on an unsustainable path.
AT BE
HR
CY
CZ
DK
EE
FIFR
DE
EL
HUIEIT
LV
LT
LUMT
NL
PL
PT
RO
SK
SI
ES
SE
UK
-20
-15
-10
-5
0
5
10
15
20
10 15 20 25 30
Retu
rn o
n e
quity (
2015)
Tier 1 ratio (Q4-2015)
Increasing banking system
vulnerability
3. Summary of the main findings from the MIP in-depth review
17
Although measures have been taken to make
public finances more sustainable, challenges
remain. The financial viability of the State-Owned
Enterprises (SOEs) is not yet ensured. This is
particularly true of highly-indebted SOEs, most of
which are in the transport sector. In view of
demographic and economic developments, the
affordability of public pensions is under pressure
in the short term. Even though partially tackled,
there are also challenges to the short and long-term
sustainability of the healthcare sector. Historically
the health system has run losses and has been
unable to clear its arrears.
Labour market duality remains an issue. The
Portuguese economy continued to add both
temporary and permanent jobs in 2016, but job
creation on permanent contracts was not strong
enough to lower the share of temporary employees,
particularly among young workers. Measures were
taken in the area of employment support to
promote hiring on open-ended contracts, but their
expected impact on reducing segmentation appears
limited.
A rebound in potential growth to converge with
the EU average would address medium-term
challenges. Persistent bottlenecks and rigidities in
the product and labour markets still imply limits to
supply and demand of labour and thus to potential
growth. This refers in particular to obstacles to job
market access for young people and the long-term
unemployed. High leverage in the private sector
and high banks' stocks of NPL weigh on new
credit to firms which would allow for a positive
capital contribution to potential output. At the
same time, a tight fiscal situation poses risks for
public debt sustainability and also limits the
productive use of public capital resources. Given
the estimated need for deleveraging, inflows of
non-debt financing such as FDI, could make a
valuable contribution to expanding the country's
investment and growth potential.
The current imbalances limit the resilience of
the Portuguese economy to shocks, making it
less capable to adapt to a constantly changing
environment. Portuguese GDP growth is volatile
relative to the EU average and remains vulnerable
to the high volatility of the terms of trade. To
buffer the economy from these and other shocks,
reducing the stock of public debt would create the
fiscal space needed to enable fiscal policy to offset
future shocks. At the same time reducing corporate
debt would make the private sector more flexible
in dealing with sudden shocks, mitigating the
spill-overs which shocks to firms have on the rest
of the economy. Lower unemployment would
prevent major negative impacts on aggregate
demand, which could occur through a decline in
consumption or an expansion in unemployment
benefits. Overall, these adjustments would also
help improve the NIIP, Measures designed to
improve export competitiveness could also help.
While some progress has been made, there is
further potential for structural reforms in
several areas. Progress has been made so far in
improving the efficiency of the Portuguese public
administration. However, there is a lack of
rationalising and modernising central, regional and
local public administration. Measures have been
taken to improve the operation of the judicial
system, but efficiency indicators remain very poor
especially for tax courts. It is still not possible to
evaluate and monitor the housing market reforms
properly. There is no systematic monitoring and
reporting underpinned by precise and relevant data
on key drivers of that market. There have been
improvements in the dedicated online platform for
public procurement which provides a large amount
of data on public contracts. However, transparency
remains a challenge for public-private
partnerships. This is particularly applicable to the
local and regional level, and to concession
contracts. Portugal has one of the most restrictive
business services regulation in the EU. As a result,
productivity growth remains limited, it is more
difficult for new players to enter the market, and
the price for services is higher than it should be.
There are outstanding barriers to access to
professions and to more simplified authorisation
which adversely affect external and internal
competition within the Portuguese economy.
Unfavourable framework conditions and weak
links between public and private sector still limit
Portugal's innovation performance. Delays in
reforming the transport sector are hampering the
sector's competitiveness. State owned transport
companies lack a long-term financial sustainability
plan to support future investments. The current rail
infrastructure is not being used to its full potential
thus compromising the performance of the freight
sector. The renegotiation of existing port
concession agreements and a new framework for
port concessions aim at making Portuguese ports
3. Summary of the main findings from the MIP in-depth review
18
more competitive. Yet, both are being delayed.
High structural costs in the energy sector together
with an excess of installed capacity compromise
the sustainability of the system. The government is
putting forward measures to recover past undue
rents and eliminate existing ones but a high tariff
debt and a concentrated retail market put pressure
on end-user prices.
3.3. OVERALL ASSESSMENT
Portugal continues to face important sources of
imbalances arising from high external, private and
government debt in a context of unemployment
and low-growth. Private debt is slowly declining,
while government debt has stabilised against the
background of remaining consolidation needs. The
competitiveness gains that materialised over the
past few years are bottoming out. The high stock
of non-performing loans, which has not yet
stabilised, continues to put pressure on bank
profitability and their workout could imply capital
gaps that might require state intervention. Various
policy measures have been taken to help reduce
imbalances, but significant gaps remain. Despite
some improvement in relevant flow indicators,
Portugal still suffers from major sources of
external and internal imbalances. Besides very
high private and government debt levels persistent
weaknesses concern, the exposure to sovereign
debt risks, and thin capital buffers in the banking
sector, as well as limited access to finance for
corporations and SMEs. A number of policy
measures have been taken to restructure the
financial sector, ensure adequate capital buffers,
and support the reduction of non-performing loans.
Despite the restructuring of major banks,
recapitalisation programmes and reforms of the
insolvency framework, progress with NPL
reduction remains slow and further recapitalisation
needs remain likely. Public finances are not yet
firmly on a stable footing; despite some progress in
moving towards a spending review and addressing
health expenditure sustainability, action on the
front of State-Owned-Enterprises restructuring
remain limited. Bottlenecks to productivity growth
remain related to innovation performance,
restrictions in some services and regulated
professions, the public administration, and network
industries. The labour market is improving but
youth and long-term unemployment still weigh on
the employment and social recovery. There is still
no comprehensive growth strategy. Regulatory
barriers and rigidities in labour and product
markets continue to hamper business growth,
competitiveness and investment in Portugal.
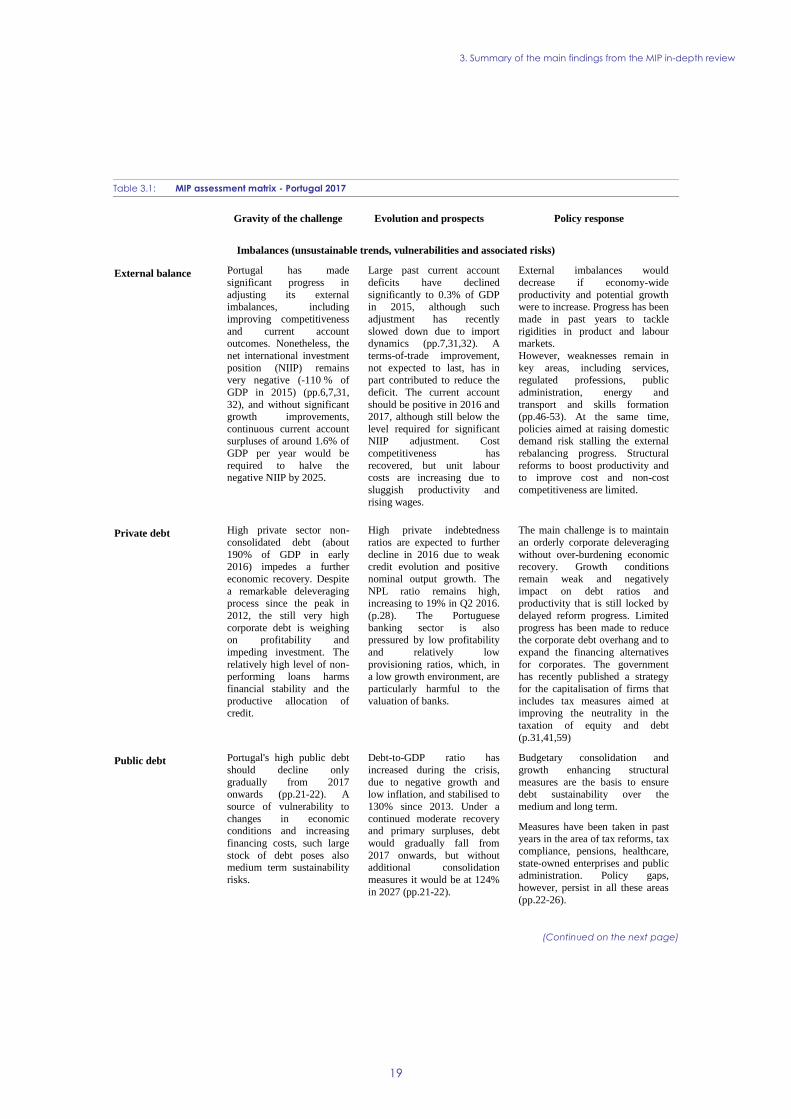
3. Summary of the main findings from the MIP in-depth review
19
Table 3.1: MIP assessment matrix - Portugal 2017
(Continued on the next page)
Gravity of the challenge Evolution and prospects Policy response
Imbalances (unsustainable trends, vulnerabilities and associated risks)
External balance Portugal has made
significant progress in
adjusting its external imbalances, including
improving competitiveness
and current account outcomes. Nonetheless, the
net international investment
position (NIIP) remains
very negative (-110 % of
GDP in 2015) (pp.6,7,31,
32), and without significant growth improvements,
continuous current account surpluses of around 1.6% of
GDP per year would be
required to halve the negative NIIP by 2025.
Large past current account
deficits have declined
significantly to 0.3% of GDP in 2015, although such
adjustment has recently
slowed down due to import dynamics (pp.7,31,32). A
terms-of-trade improvement,
not expected to last, has in
part contributed to reduce the
deficit. The current account
should be positive in 2016 and 2017, although still below the
level required for significant NIIP adjustment. Cost
competitiveness has
recovered, but unit labour costs are increasing due to
sluggish productivity and
rising wages.
External imbalances would
decrease if economy-wide
productivity and potential growth were to increase. Progress has been
made in past years to tackle
rigidities in product and labour markets.
However, weaknesses remain in
key areas, including services,
regulated professions, public
administration, energy and
transport and skills formation (pp.46-53). At the same time,
policies aimed at raising domestic demand risk stalling the external
rebalancing progress. Structural
reforms to boost productivity and to improve cost and non-cost
competitiveness are limited.
Private debt High private sector non-
consolidated debt (about
190% of GDP in early 2016) impedes a further
economic recovery. Despite
a remarkable deleveraging process since the peak in
2012, the still very high
corporate debt is weighing on profitability and
impeding investment. The
relatively high level of non-performing loans harms
financial stability and the
productive allocation of credit.
High private indebtedness
ratios are expected to further
decline in 2016 due to weak credit evolution and positive
nominal output growth. The
NPL ratio remains high, increasing to 19% in Q2 2016.
(p.28). The Portuguese
banking sector is also pressured by low profitability
and relatively low
provisioning ratios, which, in a low growth environment, are
particularly harmful to the
valuation of banks.
The main challenge is to maintain
an orderly corporate deleveraging
without over-burdening economic recovery. Growth conditions
remain weak and negatively
impact on debt ratios and productivity that is still locked by
delayed reform progress. Limited
progress has been made to reduce the corporate debt overhang and to
expand the financing alternatives
for corporates. The government has recently published a strategy
for the capitalisation of firms that
includes tax measures aimed at improving the neutrality in the
taxation of equity and debt
(p.31,41,59)
Public debt
Portugal's high public debt
should decline only
gradually from 2017 onwards (pp.21-22). A
source of vulnerability to
changes in economic conditions and increasing
financing costs, such large
stock of debt poses also medium term sustainability
risks.
Debt-to-GDP ratio has
increased during the crisis,
due to negative growth and low inflation, and stabilised to
130% since 2013. Under a
continued moderate recovery and primary surpluses, debt
would gradually fall from
2017 onwards, but without additional consolidation
measures it would be at 124%
in 2027 (pp.21-22).
Budgetary consolidation and
growth enhancing structural
measures are the basis to ensure debt sustainability over the
medium and long term.
Measures have been taken in past
years in the area of tax reforms, tax
compliance, pensions, healthcare,
state-owned enterprises and public administration. Policy gaps,
however, persist in all these areas
(pp.22-26).
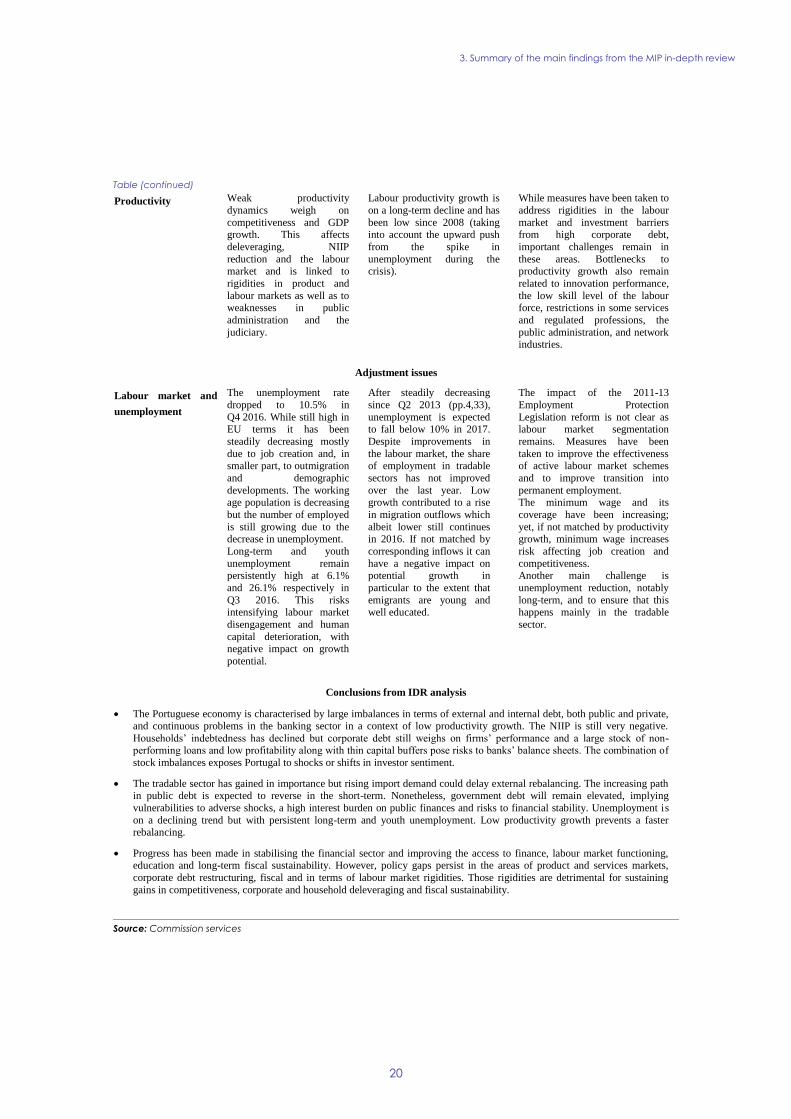
3. Summary of the main findings from the MIP in-depth review
20
Table (continued)
Source: Commission services
Productivity Weak productivity
dynamics weigh on
competitiveness and GDP growth. This affects
deleveraging, NIIP
reduction and the labour market and is linked to
rigidities in product and
labour markets as well as to weaknesses in public
administration and the
judiciary.
Labour productivity growth is
on a long-term decline and has
been low since 2008 (taking into account the upward push
from the spike in
unemployment during the crisis).
While measures have been taken to
address rigidities in the labour
market and investment barriers from high corporate debt,
important challenges remain in
these areas. Bottlenecks to productivity growth also remain
related to innovation performance,
the low skill level of the labour force, restrictions in some services
and regulated professions, the
public administration, and network industries.
Adjustment issues
Labour market and
unemployment
The unemployment rate
dropped to 10.5% in
Q4 2016. While still high in EU terms it has been
steadily decreasing mostly
due to job creation and, in smaller part, to outmigration
and demographic
developments. The working age population is decreasing
but the number of employed
is still growing due to the decrease in unemployment.
Long-term and youth
unemployment remain persistently high at 6.1%
and 26.1% respectively in
Q3 2016. This risks
intensifying labour market
disengagement and human
capital deterioration, with negative impact on growth
potential.
After steadily decreasing
since Q2 2013 (pp.4,33),
unemployment is expected to fall below 10% in 2017.
Despite improvements in
the labour market, the share of employment in tradable
sectors has not improved
over the last year. Low growth contributed to a rise
in migration outflows which
albeit lower still continues in 2016. If not matched by
corresponding inflows it can
have a negative impact on potential growth in
particular to the extent that
emigrants are young and
well educated.
The impact of the 2011-13
Employment Protection
Legislation reform is not clear as labour market segmentation
remains. Measures have been
taken to improve the effectiveness of active labour market schemes
and to improve transition into
permanent employment. The minimum wage and its
coverage have been increasing;
yet, if not matched by productivity growth, minimum wage increases
risk affecting job creation and
competitiveness. Another main challenge is
unemployment reduction, notably
long-term, and to ensure that this
happens mainly in the tradable
sector.
Conclusions from IDR analysis
The Portuguese economy is characterised by large imbalances in terms of external and internal debt, both public and private,
and continuous problems in the banking sector in a context of low productivity growth. The NIIP is still very negative.
Households’ indebtedness has declined but corporate debt still weighs on firms’ performance and a large stock of non-performing loans and low profitability along with thin capital buffers pose risks to banks’ balance sheets. The combination of
stock imbalances exposes Portugal to shocks or shifts in investor sentiment.
The tradable sector has gained in importance but rising import demand could delay external rebalancing. The increasing path in public debt is expected to reverse in the short-term. Nonetheless, government debt will remain elevated, implying
vulnerabilities to adverse shocks, a high interest burden on public finances and risks to financial stability. Unemployment is
on a declining trend but with persistent long-term and youth unemployment. Low productivity growth prevents a faster rebalancing.
Progress has been made in stabilising the financial sector and improving the access to finance, labour market functioning, education and long-term fiscal sustainability. However, policy gaps persist in the areas of product and services markets,
corporate debt restructuring, fiscal and in terms of labour market rigidities. Those rigidities are detrimental for sustaining
gains in competitiveness, corporate and household deleveraging and fiscal sustainability.
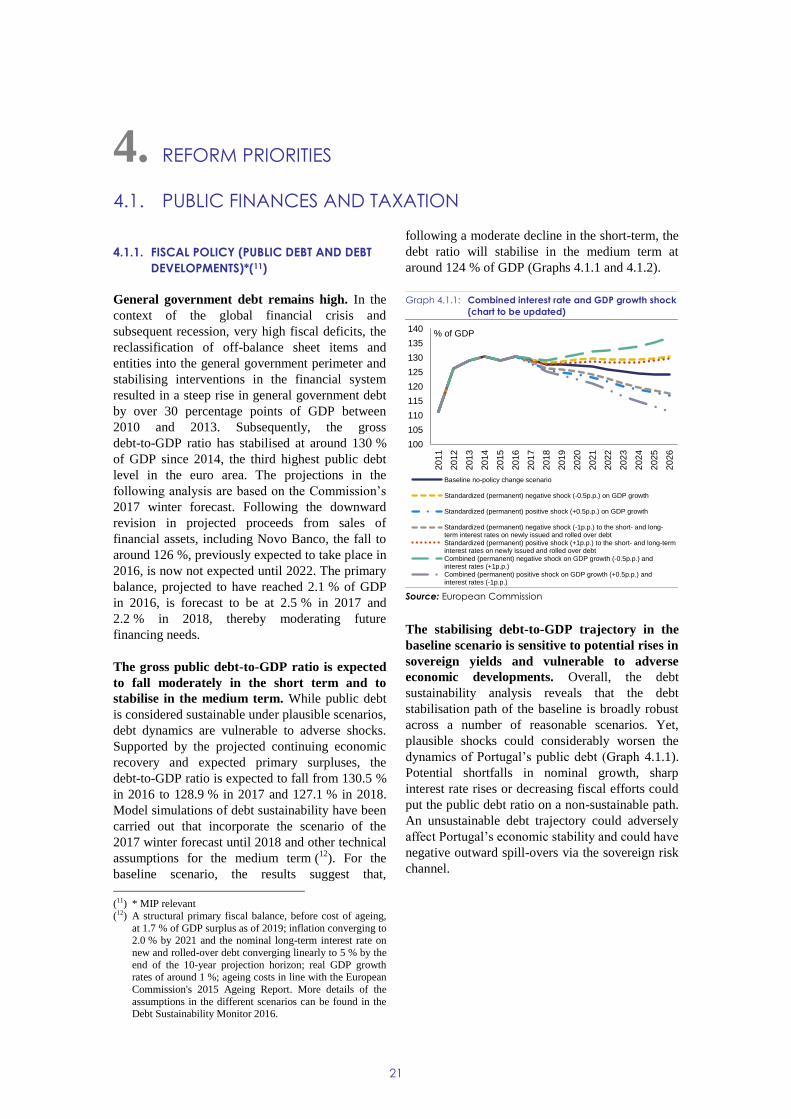
21
4.1.1. FISCAL POLICY (PUBLIC DEBT AND DEBT
DEVELOPMENTS)*(11)
General government debt remains high. In the
context of the global financial crisis and
subsequent recession, very high fiscal deficits, the
reclassification of off-balance sheet items and
entities into the general government perimeter and
stabilising interventions in the financial system
resulted in a steep rise in general government debt
by over 30 percentage points of GDP between
2010 and 2013. Subsequently, the gross
debt-to-GDP ratio has stabilised at around 130 %
of GDP since 2014, the third highest public debt
level in the euro area. The projections in the
following analysis are based on the Commission’s
2017 winter forecast. Following the downward
revision in projected proceeds from sales of
financial assets, including Novo Banco, the fall to
around 126 %, previously expected to take place in
2016, is now not expected until 2022. The primary
balance, projected to have reached 2.1 % of GDP
in 2016, is forecast to be at 2.5 % in 2017 and
2.2 % in 2018, thereby moderating future
financing needs.
The gross public debt-to-GDP ratio is expected
to fall moderately in the short term and to
stabilise in the medium term. While public debt
is considered sustainable under plausible scenarios,
debt dynamics are vulnerable to adverse shocks.
Supported by the projected continuing economic
recovery and expected primary surpluses, the
debt-to-GDP ratio is expected to fall from 130.5 %
in 2016 to 128.9 % in 2017 and 127.1 % in 2018.
Model simulations of debt sustainability have been
carried out that incorporate the scenario of the
2017 winter forecast until 2018 and other technical
assumptions for the medium term (12
). For the
baseline scenario, the results suggest that,
(11) * MIP relevant
(12) A structural primary fiscal balance, before cost of ageing,
at 1.7 % of GDP surplus as of 2019; inflation converging to 2.0 % by 2021 and the nominal long-term interest rate on
new and rolled-over debt converging linearly to 5 % by the
end of the 10-year projection horizon; real GDP growth
rates of around 1 %; ageing costs in line with the European
Commission's 2015 Ageing Report. More details of the
assumptions in the different scenarios can be found in the Debt Sustainability Monitor 2016.
following a moderate decline in the short-term, the
debt ratio will stabilise in the medium term at
around 124 % of GDP (Graphs 4.1.1 and 4.1.2).
Graph 4.1.1: Combined interest rate and GDP growth shock
(chart to be updated)
Source: European Commission
The stabilising debt-to-GDP trajectory in the
baseline scenario is sensitive to potential rises in
sovereign yields and vulnerable to adverse
economic developments. Overall, the debt
sustainability analysis reveals that the debt
stabilisation path of the baseline is broadly robust
across a number of reasonable scenarios. Yet,
plausible shocks could considerably worsen the
dynamics of Portugal’s public debt (Graph 4.1.1).
Potential shortfalls in nominal growth, sharp
interest rate rises or decreasing fiscal efforts could
put the public debt ratio on a non-sustainable path.
An unsustainable debt trajectory could adversely
affect Portugal’s economic stability and could have
negative outward spill-overs via the sovereign risk
channel.
100
105
110
115
120
125
130
135
140
2011
2012
2013
2014
2015
2016
2017
2018
2019
2020
2021
2022
2023
2024
2025
2026
Baseline no-policy change scenario
Standardized (permanent) negative shock (-0.5p.p.) on GDP growth
Standardized (permanent) positive shock (+0.5p.p.) on GDP growth
Standardized (permanent) negative shock (-1p.p.) to the short- and long-term interest rates on newly issued and rolled over debtStandardized (permanent) positive shock (+1p.p.) to the short- and long-terminterest rates on newly issued and rolled over debtCombined (permanent) negative shock on GDP growth (-0.5p.p.) andinterest rates (+1p.p.)Combined (permanent) positive shock on GDP growth (+0.5p.p.) andinterest rates (-1p.p.)
% of GDP
4. REFORM PRIORITIES
4.1. PUBLIC FINANCES AND TAXATION
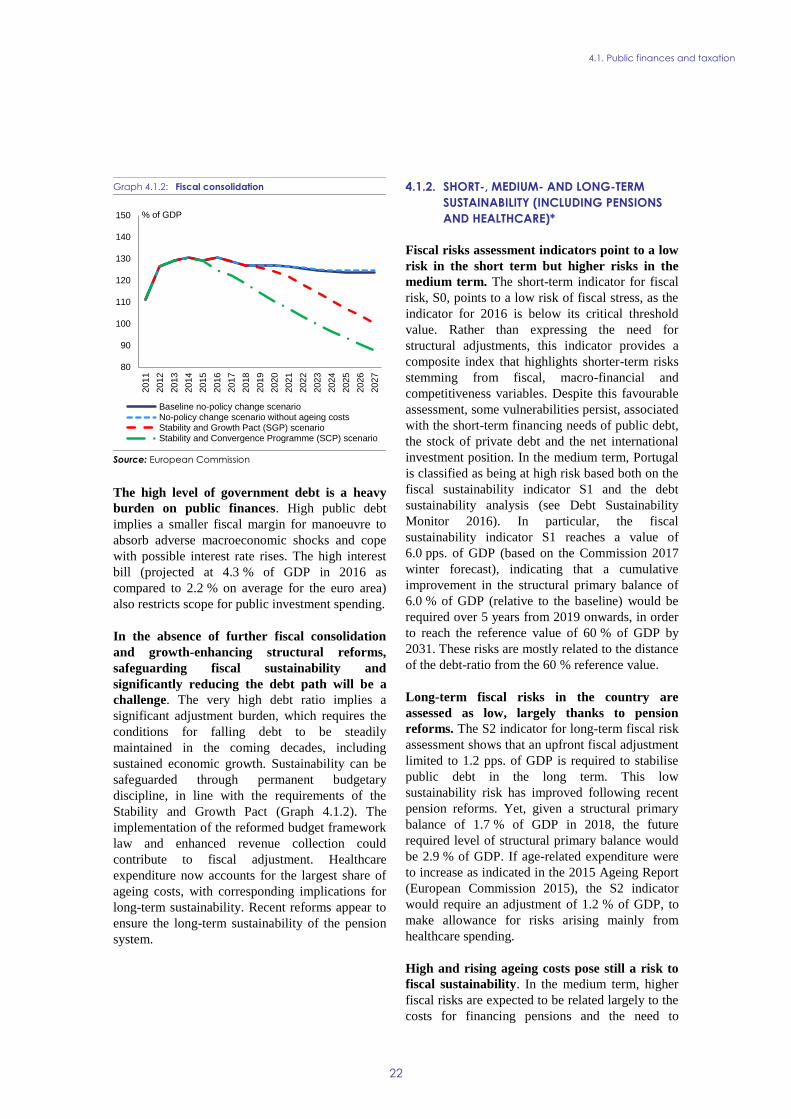
4.1. Public finances and taxation
22
Graph 4.1.2: Fiscal consolidation
Source: European Commission
The high level of government debt is a heavy
burden on public finances. High public debt
implies a smaller fiscal margin for manoeuvre to
absorb adverse macroeconomic shocks and cope
with possible interest rate rises. The high interest
bill (projected at 4.3 % of GDP in 2016 as
compared to 2.2 % on average for the euro area)
also restricts scope for public investment spending.
In the absence of further fiscal consolidation
and growth-enhancing structural reforms,
safeguarding fiscal sustainability and
significantly reducing the debt path will be a
challenge. The very high debt ratio implies a
significant adjustment burden, which requires the
conditions for falling debt to be steadily
maintained in the coming decades, including
sustained economic growth. Sustainability can be
safeguarded through permanent budgetary
discipline, in line with the requirements of the
Stability and Growth Pact (Graph 4.1.2). The
implementation of the reformed budget framework
law and enhanced revenue collection could
contribute to fiscal adjustment. Healthcare
expenditure now accounts for the largest share of
ageing costs, with corresponding implications for
long-term sustainability. Recent reforms appear to
ensure the long-term sustainability of the pension
system.
4.1.2. SHORT-, MEDIUM- AND LONG-TERM
SUSTAINABILITY (INCLUDING PENSIONS
AND HEALTHCARE)*
Fiscal risks assessment indicators point to a low
risk in the short term but higher risks in the
medium term. The short-term indicator for fiscal
risk, S0, points to a low risk of fiscal stress, as the
indicator for 2016 is below its critical threshold
value. Rather than expressing the need for
structural adjustments, this indicator provides a
composite index that highlights shorter-term risks
stemming from fiscal, macro-financial and
competitiveness variables. Despite this favourable
assessment, some vulnerabilities persist, associated
with the short-term financing needs of public debt,
the stock of private debt and the net international
investment position. In the medium term, Portugal
is classified as being at high risk based both on the
fiscal sustainability indicator S1 and the debt
sustainability analysis (see Debt Sustainability
Monitor 2016). In particular, the fiscal
sustainability indicator S1 reaches a value of
6.0 pps. of GDP (based on the Commission 2017
winter forecast), indicating that a cumulative
improvement in the structural primary balance of
6.0 % of GDP (relative to the baseline) would be
required over 5 years from 2019 onwards, in order
to reach the reference value of 60 % of GDP by
2031. These risks are mostly related to the distance
of the debt-ratio from the 60 % reference value.
Long-term fiscal risks in the country are
assessed as low, largely thanks to pension
reforms. The S2 indicator for long-term fiscal risk
assessment shows that an upfront fiscal adjustment
limited to 1.2 pps. of GDP is required to stabilise
public debt in the long term. This low
sustainability risk has improved following recent
pension reforms. Yet, given a structural primary
balance of 1.7 % of GDP in 2018, the future
required level of structural primary balance would
be 2.9 % of GDP. If age-related expenditure were
to increase as indicated in the 2015 Ageing Report
(European Commission 2015), the S2 indicator
would require an adjustment of 1.2 % of GDP, to
make allowance for risks arising mainly from
healthcare spending.
High and rising ageing costs pose still a risk to
fiscal sustainability. In the medium term, higher
fiscal risks are expected to be related largely to the
costs for financing pensions and the need to
80
90
100
110
120
130
140
150
2011
2012
2013
2014
2015
2016
2017
2018
2019
2020
2021
2022
2023
2024
2025
2026
2027
Baseline no-policy change scenarioNo-policy change scenario without ageing costsStability and Growth Pact (SGP) scenarioStability and Convergence Programme (SCP) scenario
% of GDP
4.1. Public finances and taxation
23
reverse the ongoing accumulation of arrears in the
healthcare sector. Despite recent reforms, public
pension spending is expected to rise over the next
10 years until benefit and coverage curbs take
effect. This leads to an overall decline in pension
spending of about 0.7pp of GDP between 2013 and
2060 (European Commission 2015). The situation
is different for the healthcare sector, which
represents the largest share of Portugal's ageing
costs and which is expected to post the EU's
largest by 2060 (2.5 % of GDP against 0.9 % EU
average). Further, the continued accumulation of
delayed payments in hospitals adds more strains to
debt reduction and sustainability in the very short
term.
Several reforms have improved the long–term
sustainability of the pension system. Pressure for
the sustainability of the debt path is mostly related
to the large distance of the present debt-to-GDP
ratio from the 60 % reference value, rather than to
pension related costs. Past measures include
introducing disincentives to early retirement,
raising the pensionable age from 65 to 66 for both
sexes, and linking future increases to life
expectancy at age 65. The automatic adjustment of
pension to life expectancy has done much to
reduce pension costs in the long-term. Short to
medium-term costs however remain high.
New measures in the pension system are
explored, but it is unclear how they will affect
cost reduction. The government has launched a
comprehensive study of the pension system with
measures expected to be applied in 2018, at the
earliest. These measures might entail a reduction in
the early repayment penalties for workers with
about or more than 40 years of service. They could
include harmonising current benefit schemes and
means-testing procedures. Overall, the authorities
are committed to issuing a package of new
measures that will be budget-neutral. It will not
alter the current plan to eliminate extraordinary
budgetary transfers to the pension system by 2019.
In the meanwhile, the 2017 budget includes the
earmarking of a new progressive tax on real estate
assets to the social security's Financial
Stabilization Fund (worth EUR 160 million in
2017 according to the 2017 Budget). The
government is presenting this earmarking as an
alternative to excessive reliance on conventional
budgetary transfers. Yet, overall the expenditure
side of the sustainability of the pension system in
the short to medium-term remains unaddressed.
Portugal has made efforts to ensure access to
quality healthcare. Several steps have been taken
to make the healthcare sector more efficient and
sustainable. Procurement of goods and services is
now centralised, creating important savings to the
National Health Service. The use of generics
eligible for public reimbursement has been
expanded, pharmaceutical prices have fallen,
waiting lists have been cut and the number of
family health units has increased. More recently,
the authorities have set up a reform working group
with a three year mandate. The latter has focused
mainly on i) improving the IT system (including
eliminating duplicate records, records of deceased
patients etc.), ii) human resource planning aimed at
recruiting qualified staff in difficult areas, iii) pilot
projects in areas with gaps in the National Health
Service. At the same time, access to primary
healthcare continues to expand, while the emphasis
is increasingly shifting on prevention measures,
such as vaccination campaigns (see section 4.3).
Weak accounting and managerial controls lie
behind the rising stock of arrears in hospitals,
which undermines the health sector's viability.
While the hospital reform continues, budgetary
planning and implementation in the hospitals
remain an important issue. Late payments (arrears)
continue to increase, denoting weaknesses in
accounting control mechanisms and managerial
practices. The stock of arrears in the health sector
has increased by EUR 90 million from December
2015 to December 2016. Yet, in October the
increase from December 2015 was about
307 million (or 68 %) as arrear repayments
occurred mostly at the end of the year. On the one
hand, these were possible thanks to the use of
centralised allocation to the reversal of wage cuts,
the use of some centralised appropriations and the
authorisation of using cash balances at the end of
the year. On the other hand the extension of the tax
on alcoholic drinks (IABA) to sweetened drinks
(the levy on drinks with added sugar should be
worth EUR 80 million in 2017) is earmarked to
address the sustainability of the National Health
Service. While these measures sufficed to reduce
the existing stock of arrears, they do not entirely
address the factors behind their continued
accumulation. The most recent report on budgetary
execution (October 2016) confirms the increasing
4.1. Public finances and taxation
24
indebtedness of state-owned hospitals. Accurate
and balanced budgeting, enhanced controls and
effective enforcement of the commitment control
law could help improve efficiency and quality in
this sector. An inadequate system of incentives for
the compliant hospitals may lead to overspending.
In spite of short term savings in the health care
sector, Portugal lacks a comprehensive
long-term strategy to addressing the
health-related costs of ageing. The health sector
is covered by the recently launched spending
review. Savings from the sector are expected to
amount to EUR 134 million between 2017 and19.
Yet, there is still a need to clarify in more detail
how these savings will be achieved. Given the
major cost compression undertaken during the
economic adjustment programme, any new saving
measures need to be carefully designed so as to
avoid compromising access to primary healthcare.
4.1.3. FISCAL FRAMEWORK, PUBLIC
ADMINISTRATION AND SOES*
Implementation of the reformed Budget
Framework Law adopted in 2015 has been
slow. The Law is designed to make budget units
more accountable, strengthen the medium to
long-term focus of public finances by introducing
programme-based budgeting and align the
deadlines for presenting of the stability programme
and the draft budget to Parliament with European
Semester requirements. It allows for a three-year
transitional period to apply most new features.
Albeit nearly a year late, the authorities have
recently approved the rules on the operation of the
new Budget Framework Law implementation
unit (13
), a first milestone in its implementation,
and have set a timetable for 2017 activities.
However, the decree law setting up the new
budgetary programmes is still outstanding. Given
the cumulated delays in the implementation of the
new Budgetary Framework Law, there is a risk
that this may not be completed by the 2018 target.
The current spending review appears would
benefit from a more comprehensive and
(13) The Portuguese Public Finance Council in its capacity as
an independent institution for the monitoring of public finance issues is to participate in the technical committee of
the new Budget Framework Law implementation unit.
strategic approach. The authorities have started a
spending review that focuses mainly on the health
and education ministries, state owned enterprises,
(centralised) public procurement and real estate
management. This review falls short of a
comprehensive approach that would encompass
the public sector at large and be guided by a set of
concrete savings targets (14
). On the contrary,
arrears in hospitals have been growing since the
beginning of the year, indicating a lack of control
over spending especially in the health sector.
There are set-backs in public administration
reforms. Ongoing public employment reforms
have not led to the expected containment of the
wage bill. Despite the civil servants rotation policy
(2:1 replacement rule) introduced in 2016, the
wage bill is on the rise, pointing to some
weaknesses in the efficiency of this reform and
possible negative implications from the return to
the 35-hour working week for public employees,
mainly in the healthcare sector. The scope of the
revised requalification scheme has also been
reduced. Local administration reform measures
have been delayed. Following some delays, the
Municipality Support Fund (FAM – a debt
workout mechanism for over-indebted
municipalities) has only recently started
disbursements.
There is still no framework to guarantee the
financial sustainability of state owned
enterprises. State Owned Enterprises (SOEs)
monitored by the Ministry of Finance's UTAM
unit had a total indebtedness of EUR 32 billion in
the second quarter of 2016. However, there is no
concrete plan to tackle this large debt stock.
Transport sector firms account for most
indebtedness. The rail and road infrastructure
manager (IP) alone represents 27 % of total
indebtedness of SOEs reaching 62 % when added
to the rail transport company (CP) and the Lisbon
and Porto metros. IP has recently signed a
five-year Public Service Obligation contract, but a
more long-term operation of sustainability has not
been defined. The authorities are revising the
operating and financing model for SOEs providing
urban transport in Lisbon and Porto. However the
(14) In September 2016, the Eurogroup endorsed a set of shared
principles for improving the quality of public finances through spending.
http://www.consilium.europa.eu/en/press/press-
releases/2016/09/09-eurogroup-statement/
4.1. Public finances and taxation
25
high debt and negative operational results of the
cities' metro system remain worrying and their
long-term sustainability is still not ensured. New
investments are being planned, but a governance
scheme and financial framework to ensure
long-term sustainability is still being defined. In
the case of Lisbon’s bus transport company Carris,
it was decided to transfer ownership to local
government while the debt will remain with central
government. The reinstatement of career
progression for employees of SOEs may further
adversely affect the firms’ financial situation. The
burden placed on public finances by public private
partnerships (PPP) is set to continue. Extraordinary
subsidies and compensatory payments to IP are
expected to more than double compared with 2016
mostly as a result of the five year Public Service
Obligation contract recently signed. The cost of
PPP contracts until their end has been revised up
by over EUR 500 million with respect to the value
estimated in the 2016 budget as the amounts were
recalculated using 2017 prices. The Court of
Auditors also recently drew attention to the fact
that the current monitoring does not take full
account of the risk to public finances. The
Government intends to improve oversight of
spending by SOE's through an ex-ante and ex-post
assessment of investments, activities and their
financial impact together with a more regular
monitoring. But this does not amount to a
comprehensive plan to tackle indebtedness and
long-term financial sustainability by setting
concrete targets.
4.1.4. TAXATION*
Measures have been proposed to improve tax
compliance and the tax administration's
efficiency. The authorities are taking steps to make
the tax administration more efficient by recruiting
new tax auditors and gradually reorganising the tax
administration's local presence. Measures to
further step up the fight against tax evasion and
fraud are also under way. The dedicated Taxpayer
Services Department for large companies is now
expected to take over wealthier households as well.
An annual plan for combating tax evasion and
fraud is set to replace the current three-year
programme, thus enabling the Tax Administration
to strengthen its oversight. Portugal is imposing
further requirements as regards banks' obligations
to provide data on all non-residents bank accounts,
resulting from the exchange of information with
other countries, limits on cash payments and the
end of bearer shares.
Dealing with taxes is time-consuming and
complex. The average number of payments
necessary to comply with all tax obligations is
small (8). At the same time, the average number of
hours needed to meet such obligations (243)
remains the 5th highest among EU countries
(World Bank, 2016). However, Portugal continues
to simplify its tax administration with a view to
reduce tax evasion and improve tax compliance.
Following past efforts to improve the efficiency of
the tax administration, there are plans for a series
of new administrative simplification measures for
several taxes between 2016 and 2017 under the
Simplex Programme. A number of measures were
already adopted in 2016, (e.g. non-habitual
residents may register online for Personal Income
Tax purposes, and the invoicing rules for the Value
Added Tax (VAT) special regime for small and
medium-sized enterprises were simplified).
Minor tax policy shifts have been implemented.
As set out in the government programme and the
2016 budget, the introduction of a lump-sum
allowance per child, replacing the family quotient
introduced in 2015, is now effective. The reduction
in VAT on restaurant food to the intermediate rate
of 13 % took effect on 1 July 2016.
Reduced VAT rates are still used heavily,
although VAT reforms during the crisis had
broadened the tax base to some extent (15
).
Portugal's VAT gap as a percentage of theoretical
VAT liability of 12.5 % is close to the EU average
of 14.0 %, indicating that the efficiency of VAT
collection is around the average. However,
Portugal's VAT policy gap of 50.9 % is clearly
above the EU average of 43.8 %. This is because it
has a high VAT rate gap (11.1 % compared with
an EU average of 5.3 %), while the exemption gap
is in line with the EU average. The VAT rate gap
shows the reduction of revenue (as a percentage of
GDP) due to the use of reduced VAT rates. The
still broad use of reduced rates implies significant
revenue losses.
(15) CASE, 2016, Study and Reports on the VAT Gap in the
EU Member States:2016 Final Report TAXUD/2015/CC/131
https://ec.europa.eu/taxation_customs/sites/taxation/files/2
016-09_vat-gap-report_final.pdf
4.1. Public finances and taxation
26
The authorities plan to reform several taxes but
the timelines are not yet defined. These reforms
include revising the number of income brackets in
the Personal Income Tax and making it more
progressive while creating a salary supplement for
lower wages; and other tax reforms addressing
firms' chronic under-capitalisation. The 2017
budget includes revenue from the extension of two
taxes that is going to be fully earmarked to the
sustainability of the national health system and the
Social Security's Financial Stabilisation Fund.
These are: (i) the extension of the alcoholic drinks
tax (IABA) to include sweetened drinks, which is
forecast to be worth EUR 80 million in 2017; and
(ii) the new progressive tax on real estate
portfolios (portfolios above EUR 0.6 million, on
top of the existing recurrent real estate tax IMI that
has been relatively low in EU comparison) which
should yield EUR 130 million in 2017. Despite the
need to address some outstanding issues, ensuring
the stability of the tax system is also considered a
key aspect of the country's capacity to attract
investment.
Despite some positive recent developments, the
debt-equity tax bias in corporate taxation
remains a challenge. Investments financed by
debt are taxed less than those financed by equity.
As a result, the difference in the cost of capital for
investments financed by debt and equity in 2016
was the fifth highest in the EU and well above the
EU average (16
). In recent years, the government
has tried to tackle this problem by introducing new
rules on limitation of interest deductions and an
Allowance for Corporate Equity (ACE). Further
measures are envisaged as part of a programme
adopted in July 2016 (Programa Capitalizar),
though they are not yet in place. In line with the
Capitalizar programme, the 2017 state budget law
widened the scope of the allowance for corporate
equity. The impact of these measures remains to be
seen and will be closely monitored. The impact of
an ACE depends on its design features and notably
its anti-tax avoidance framework. An alternative,
more robust measure, the Allowance for growth
and investment, was recently proposed by the
(16) https://ec.europa.eu/taxation_customs/sites/taxation/files/
final_report_2016_taxud.pdf
Commission within the Common Consolidated
Corporate Tax Base (17
).
(17) European Commission (2016a), Impact assessment
accompanying the proposals for a Council Directive on a Common Corporate Tax Base and a Common Consolidated
Corporate Tax Base (CCCTB), SWD(2016) 341 final.
European Commission (2016b), Communication from the Commission to the European Parliament and the Council,
'Building a fair, competitive and stable corporate tax
system for the EU', COM(2016) 682 final.
27
4.2.1. BANKING SECTOR*
The banking system's main challenges remain
weak asset quality, thin capital buffers, low
profitability and relatively high exposure to
Portuguese sovereign debt. While asset risk has
broadly stabilised, banks profitability in 2016
remained weak because of a sluggish business
environment, high costs for low quality assets, and
lower trading gains than in 2015. In seeking to
optimise assets' allocation, banks have slightly
increased exposure to domestic and higher yielding
foreign sovereign debt while some lenders have a
large exposure to companies tied to emerging
market economies that have recently
underperformed on the market. However, the
structure of banks funding is improving, with a
loan-to-deposit ratio close to 100 % since
end-2015, a higher share of customer resources,
and slightly lower funding from the European
Central Bank.
Banks carry on the deleveraging of their
balance sheets while new loans to households
are on the increase. Total banking system assets
continued to decline, falling by 24 % between the
end of 2010, when the deleveraging started, and
Q2-2016. As in previous years, the fall in the
credit portfolio contributes most to the fall in the
system's assets. Looking at recent trends in lending
volumes, by the end of 2015, total credit to
households shrank by 2.2 % year-on-year driven
by the fall in loans for house purchase (-2.9 %
year-on-year), whereas loans for consumption and
other purpose rose by nearly 1 %. In the same
period, loans to Portuguese firms (adjusted for
sales of credit portfolios) fell by 1.3 %
year-on-year. Nevertheless, gross flows of new
bank loans to households increased considerably in
2015. The volume of new mortgage loans is now
comparable with the average last seen in 2011.
Consumer lending is once again strong reflecting
more consumer confidence and backed by easing
credit standards and low interest rates.
Assets quality and low profitability continue to
put pressure on the system’s solvency levels. All
Portuguese lenders comply with the minimum
capital requirement of 8 %, while the average
Common Equity Tier 1 (CET1) ratio for the
banking system was 12.1 % in Q2-2016, 0.8
percentage points higher than at the end of 2014
and stable if compared to the end of 2015.
Nonetheless, Portuguese banks are currently
among the weakest-capitalised credit institutions in
the Eurozone. This highlights dire solvency
pressures coming mostly from the difficulty for
banks to generate capital from internal resources,
through earnings retention. Such pressures are set
to continue in 2017. Portuguese banks are facing
increased regulatory and prudential capital
requirements through additional capital buffers
imposed through Pillar II requirements and also on
Portugal's systemically important institutions.
The profitability of Portuguese banks is still
very weak. After four years of losses, the banking
system became profitable in 2015, given a
substantial decrease in impairments and
provisions, and large trading gains booked from
the sale of sovereign bonds. In 2016, however,
most banks just have broken even as the
system-wide return on equity at the end of June
2016 was just 0.3 %. This reflects a significant fall
in income from financial operations and an
increase in the flow of impairments. By contrast,
net interest income increased, driven by a larger
reduction in interest costs than in interest income,
following the re-pricing of deposits at lower rates.
The overall differential between the headline credit
rate and the average remuneration rate paid by
banks on deposits is gradually rising. Ongoing
deleveraging, the relative importance of loans with
indexed interest rates and low spreads in the
banks’ credit portfolios negatively impacted on the
income from credit to customers. Overall,
recurring revenues remain strongly affected by the
low interest rate environment and subdued
business levels. Other income items such as net
commissions and income from international
activity have accounted positively to revenue
generated in 2015 and 2016.
Portugal's banking sector compares rather
unfavourably with most of the euro area
countries when it comes to efficiency figures.
The cost-to-income ratio remains locked at 60 %.
The average efficiency of banking operations has
hardly improved with cost-to-income at 59.9 % at
the end of 2015 and 60.4 % in mid-2016, only a
fall of 5.1 percentage points from 2014.
Nevertheless, efforts are being made to adjust the
structure of banking operations and employment to
the new environment – in that context the top nine
lenders in the country have cut operational costs by
6 % over the first three quarter of 2016. Taking
4.2. FINANCIAL SECTOR AND INDEBTEDNESS
4.2. Financial sector and indebtedness
28
into account the banks’ limited capacity to
generate gross income in the current
macroeconomic environment, the recovery in the
Portuguese banking system’s profitability is likely
to rely mainly on continuously reducing
operational costs while at the same time
safeguarding the integrity of the risk assessment
and internal control processes among banks.
The high amount of non-performing loans
continues to weigh on the banking sector's
aggregate balance sheet. The non-performing
loan (NPL) ratio (18
) remains high (20.1 % against
19.6 % in end-2015) and still rising for some
sectors of the economy, in particular non-financial
corporations, active in the construction and real
estate sectors. These corporations have also a high
share of overdue loans for more than two years. In
contrast, bad loans in manufacturing, hotels and
restaurants have stabilised and even improved. The
quality of credit to households is relatively of
better quality and seems to have stabilised over the
past year. In addition to high levels of NPLs, some
large banks have a high share of foreclosed real
estate assets on their balance sheet, which puts
additional asset risk pressure on the banking
system as a whole. Given moderate economic
growth prospects, the ratio of non-performing
loans is not expected to improve substantially.
Without decisive action, the stock of problematic
assets will remain very large and costly, and will
jeopardise the efficient reallocation of financial
resources available on banks’ balance sheets.
The distribution of NPLs has been highly
unequal among Portuguese banks with non-
performing exposure ratios ranging from below
5 % to over 30 %. Close to ¾ of the total non-
performing loan stock and 70 % of the corporate
NPLs are held by the six largest banks in the
system at the end of 2015 with a very high
concentration of corporate bad debts (over 60 % of
the total exposure) among just two lenders in the
system. The coverage of NPLs has been steadily
increasing reflecting the significant build-up of
impairment flows. The accumulated credit
impairments on the aggregate balance sheet of the
banking sector represented about 9.1 % of gross
(18) European Banking Authority (EBA) data. Note that the
EBA definition of NPLs here corresponds to the share of non-performing loans over total loans and is then different
from the EBA non-performing exposure (NPE) indicator
which encompasses both loans and debts.
credit granted to the resident private sector at the
end of June 2016. However, banks differ in terms
of accumulated impairments on NPL: at end-Q3
2016, the average coverage ratio for corporate
NPLs was close to 80 % and ranged from 50 % to
95 %.
Although some actions have been taken recently
to address the large stock of non-performing
loans, there is no comprehensive strategy with
clear deadlines. Early warning systems for viable
firms have been improved and a task force set up
to tackle the core problem. It was decided recently,
for tax purposes to write-offs loans that had been
overdue for more than 2 years and had 100 %
impairments; these write-offs would also have to
be derecognised from the banks' balance sheet.
Moreover, current recapitalisations and the arrival
of new shareholders in some of the large
Portuguese banks may also lead to a reduction in
such loans. The authorities have also presented a
tripartite strategy to tackle the problem. This
involves:
revising the existing legal and judicial package,
including provisions to streamlining and
accelerating processes under PER (Special
Revitalisation Process) and SIREVE
(Extrajudicial Business Recovery System),
expected to be implemented already in 2017;
relying on the measures taken by individual
banks in the form of an internal review of each
non-performing loan by the banks under the
supervision of the Central Bank. This would
lead to a clear assessment of the loans' viability
and specific restructuring arrangements for
each case. Although the granular examination
of these loans is a step in the right direction,
there is no timeline nor are there any obvious
incentives to banks to undertake this costly
process;
encouraging banks to partly outsource the
servicing of their non-performing loans.
Whether this would be followed by the
establishment of a proper market of distressed
assets, including new underlying regulation, is
not clear. Overall, an overarching strategy in
line with the recent proposals presented in the
Single Supervisory Mechanism (SSM)
non-performing loan guidance is still missing.
4.2. Financial sector and indebtedness
29
Banks are taking steps to improve their capital
ratios through attracting some fresh equity.
State owned Caixa Geral De Depositos (CGD), the
largest bank in Portugal, is in the process of
increasing its equity base by some EUR 5 bn in
total. This is being done through a set of measures
entailing the transfer of EUR 499 m of assets from
Parcaixa to CGD, the conversion into equity of
EUR 945 m of Cocos and two other operations
planned for March 2017, namely a direct
recapitalisation by the State in the amount of
EUR 2.7 bn and a EUR 0.5 bn issuance of
subordinated debt to private investors. Banco
Commercial Portugues (BCP) Millennium, the
second biggest bank in Portugal, recently raised its
capital by EUR 1.3 bn in total through the issuance
of shares. For the Chinese financial conglomerate
Fosun, this implied an increase in its stake to 23.9
percent from the 16.7 percent they had previously
offered to buy for 175 m. BCP repaid EUR 700
million CoCos to the state on 9 February. Banco
Portugues de Investimento (BPI)'s main
shareholder, the Spanish Caixabank, launched a
takeover bid for the bank, a move that was
welcome by investors following a long standing
dispute with BPI second biggest shareholder
(Angolan Santoro group) over BPI's subsidiary in
Angola. Finally, Novo Banco's sale process has
recently entered in its final phase with private
equity funds leading the acquisition discussions.
Additionally, virtually all banks in the system are
restructuring their franchise to support earnings in
parallel selling non-core assets to improve their
capitalisation – these asset sales are however
dependent on current market conditions and
valuations.
4.2.2. INSURANCE SECTOR
The Portuguese insurance market is open and
competitive but still under pressure from
crisis-legacy issues. With EUR 12.7 billion
(equivalent to 7.1 % of GDP) in underwritten
premiums the value of the Portuguese insurance
market is about the European average. The sector
consists of close to 80 insurers with the top five
firms representing two thirds of the market, 11 000
employees and a country-wide distribution channel
including over 23 000 brokers. The insurance
business is dominated by the life insurance
segment, representing about 70 % of gross
premium income in the non-life insurance sector.
Compensation for the workmen is also provided,
which is a line of business specific to Portugal.
Portuguese insurers were heavily affected by the
economic and financial crisis. The crisis created
considerable volatility in the value of assets on
Portuguese insurers' balance sheet and affected the
insurance product mix with sales of life risk
products linked to banks loans plummeting while
bank lending continued to contract. The business
model of the Portuguese insurance sector is based
on strong links between banks and insurance
companies. This means it is under pressure, mostly
because of the challenging situation within the
Portuguese credit institutions. Faced with crippling
losses, in recent years, banks sold some of the
biggest insurers in the country, representing about
40 % of the market. The recession weighed on the
motor insurance while heavy competition and high
unemployment plunged the once profitable
workmen compensation segment into heavy losses.
Life insurance was experiencing a revival prior to
2014 but 2015 and 2016 saw a strong reversal as
economic uncertainty took hold and interest rate
guarantees had to be reduced to levels close to
zero. Implementing Solvency II is challenging in
the current weak macroeconomic environment,
which is also reflected in the recent EIOPA stress
test results.
4.2.3. HOUSING MARKET
There are signs of step-backs in the housing
market reforms. The original framework aimed to
make the housing market more dynamic by better
balancing the rights and obligations of landlords
and tenants. Over a period of five years, it phased
out, the old system of open-ended leases in which
rents were frozen and contracts could not be
terminated by landlords, and provided for rents to
be updated so as to achieve gradual alignment with
market levels. It also introduced more flexibility in
the choice of contract duration, set better
incentives for renovation and provided a new and
fast extrajudicial eviction procedure. A law which
simplified administrative procedures for
renovation works was adopted as part of the same
package. Concerns remain about the current
Parliament's proposal to further extend the
transitional period for certain categories for 10
years (more 5 years). In particular the proposal
concerns "old household" (contracts before 1990),
namely tenants aged 65 or over or disabled, whose
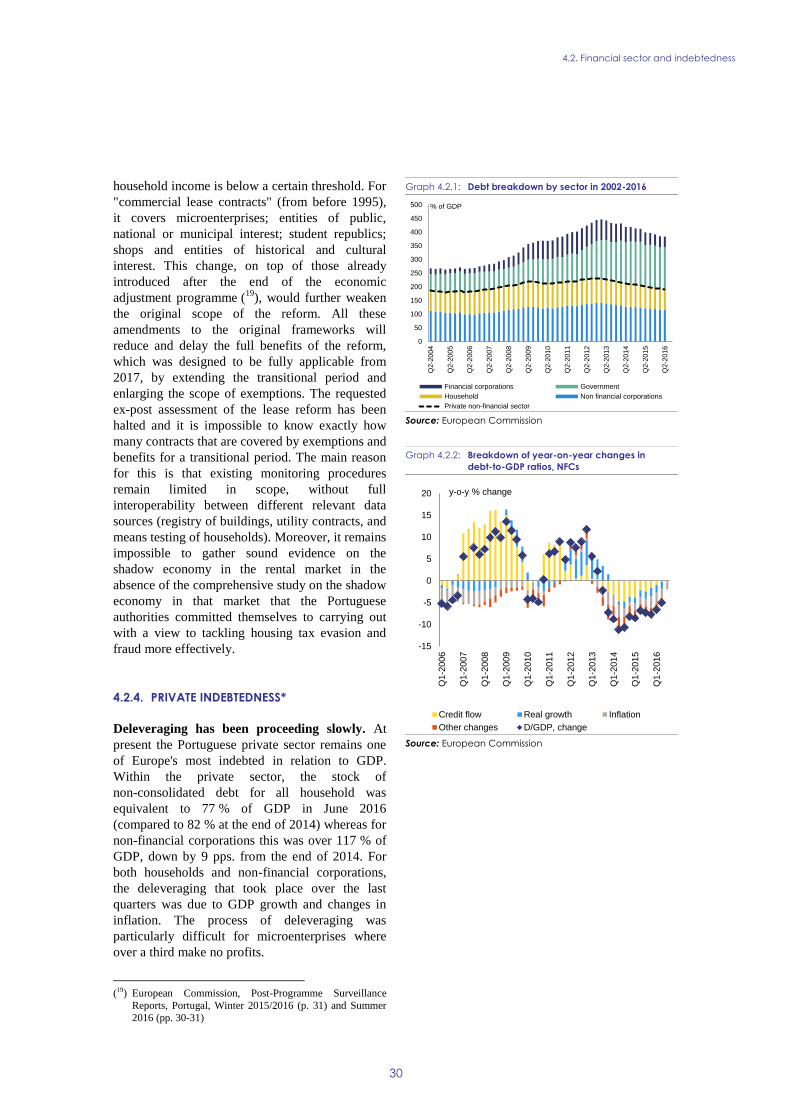
4.2. Financial sector and indebtedness
30
household income is below a certain threshold. For
"commercial lease contracts" (from before 1995),
it covers microenterprises; entities of public,
national or municipal interest; student republics;
shops and entities of historical and cultural
interest. This change, on top of those already
introduced after the end of the economic
adjustment programme (19
), would further weaken
the original scope of the reform. All these
amendments to the original frameworks will
reduce and delay the full benefits of the reform,
which was designed to be fully applicable from
2017, by extending the transitional period and
enlarging the scope of exemptions. The requested
ex-post assessment of the lease reform has been
halted and it is impossible to know exactly how
many contracts that are covered by exemptions and
benefits for a transitional period. The main reason
for this is that existing monitoring procedures
remain limited in scope, without full
interoperability between different relevant data
sources (registry of buildings, utility contracts, and
means testing of households). Moreover, it remains
impossible to gather sound evidence on the
shadow economy in the rental market in the
absence of the comprehensive study on the shadow
economy in that market that the Portuguese
authorities committed themselves to carrying out
with a view to tackling housing tax evasion and
fraud more effectively.
4.2.4. PRIVATE INDEBTEDNESS*
Deleveraging has been proceeding slowly. At
present the Portuguese private sector remains one
of Europe's most indebted in relation to GDP.
Within the private sector, the stock of
non-consolidated debt for all household was
equivalent to 77 % of GDP in June 2016
(compared to 82 % at the end of 2014) whereas for
non-financial corporations this was over 117 % of
GDP, down by 9 pps. from the end of 2014. For
both households and non-financial corporations,
the deleveraging that took place over the last
quarters was due to GDP growth and changes in
inflation. The process of deleveraging was
particularly difficult for microenterprises where
over a third make no profits.
(19) European Commission, Post-Programme Surveillance
Reports, Portugal, Winter 2015/2016 (p. 31) and Summer
2016 (pp. 30-31)
Graph 4.2.1: Debt breakdown by sector in 2002-2016
Source: European Commission
Graph 4.2.2: Breakdown of year-on-year changes in
debt-to-GDP ratios, NFCs
Source: European Commission
0
50
100
150
200
250
300
350
400
450
500
Q2-2
004
Q2-2
005
Q2-2
006
Q2-2
007
Q2-2
008
Q2-2
009
Q2-2
010
Q2-2
011
Q2-2
012
Q2-2
013
Q2-2
014
Q2-2
015
Q2-2
016
Financial corporations Government
Household Non financial corporations
Private non-financial sector
% of GDP
-15
-10
-5
0
5
10
15
20
Q1-2
006
Q1-2
007
Q1-2
008
Q1-2
009
Q1-2
010
Q1-2
011
Q1-2
012
Q1-2
013
Q1-2
014
Q1-2
015
Q1-2
016
Credit flow Real growth Inflation
Other changes D/GDP, change
y-o-y % change
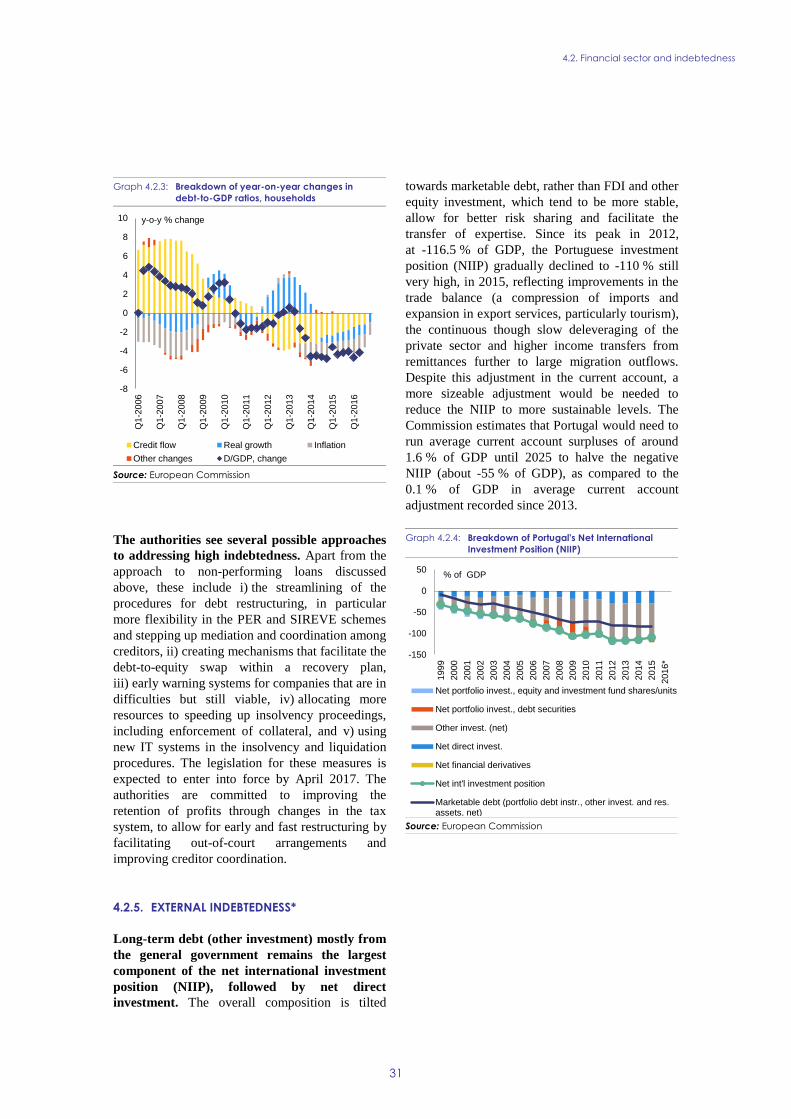
4.2. Financial sector and indebtedness
31
Graph 4.2.3: Breakdown of year-on-year changes in
debt-to-GDP ratios, households
Source: European Commission
The authorities see several possible approaches
to addressing high indebtedness. Apart from the
approach to non-performing loans discussed
above, these include i) the streamlining of the
procedures for debt restructuring, in particular
more flexibility in the PER and SIREVE schemes
and stepping up mediation and coordination among
creditors, ii) creating mechanisms that facilitate the
debt-to-equity swap within a recovery plan,
iii) early warning systems for companies that are in
difficulties but still viable, iv) allocating more
resources to speeding up insolvency proceedings,
including enforcement of collateral, and v) using
new IT systems in the insolvency and liquidation
procedures. The legislation for these measures is
expected to enter into force by April 2017. The
authorities are committed to improving the
retention of profits through changes in the tax
system, to allow for early and fast restructuring by
facilitating out-of-court arrangements and
improving creditor coordination.
4.2.5. EXTERNAL INDEBTEDNESS*
Long-term debt (other investment) mostly from
the general government remains the largest
component of the net international investment
position (NIIP), followed by net direct
investment. The overall composition is tilted
towards marketable debt, rather than FDI and other
equity investment, which tend to be more stable,
allow for better risk sharing and facilitate the
transfer of expertise. Since its peak in 2012,
at -116.5 % of GDP, the Portuguese investment
position (NIIP) gradually declined to -110 % still
very high, in 2015, reflecting improvements in the
trade balance (a compression of imports and
expansion in export services, particularly tourism),
the continuous though slow deleveraging of the
private sector and higher income transfers from
remittances further to large migration outflows.
Despite this adjustment in the current account, a
more sizeable adjustment would be needed to
reduce the NIIP to more sustainable levels. The
Commission estimates that Portugal would need to
run average current account surpluses of around
1.6 % of GDP until 2025 to halve the negative
NIIP (about -55 % of GDP), as compared to the
0.1 % of GDP in average current account
adjustment recorded since 2013.
Graph 4.2.4: Breakdown of Portugal's Net International
Investment Position (NIIP)
Source: European Commission
-8
-6
-4
-2
0
2
4
6
8
10
Q1-2
006
Q1-2
007
Q1-2
008
Q1-2
009
Q1-2
010
Q1-2
011
Q1-2
012
Q1-2
013
Q1-2
014
Q1-2
015
Q1-2
016
Credit flow Real growth Inflation
Other changes D/GDP, change
y-o-y % change
-150
-100
-50
0
50
1999
2000
2001
2002
2003
2004
2005
2006
2007
2008
2009
2010
2011
2012
2013
2014
2015
2016*
Net portfolio invest., equity and investment fund shares/units
Net portfolio invest., debt securities
Other invest. (net)
Net direct invest.
Net financial derivatives
Net int'l investment position
Marketable debt (portfolio debt instr., other invest. and res.assets, net)
% of GDP
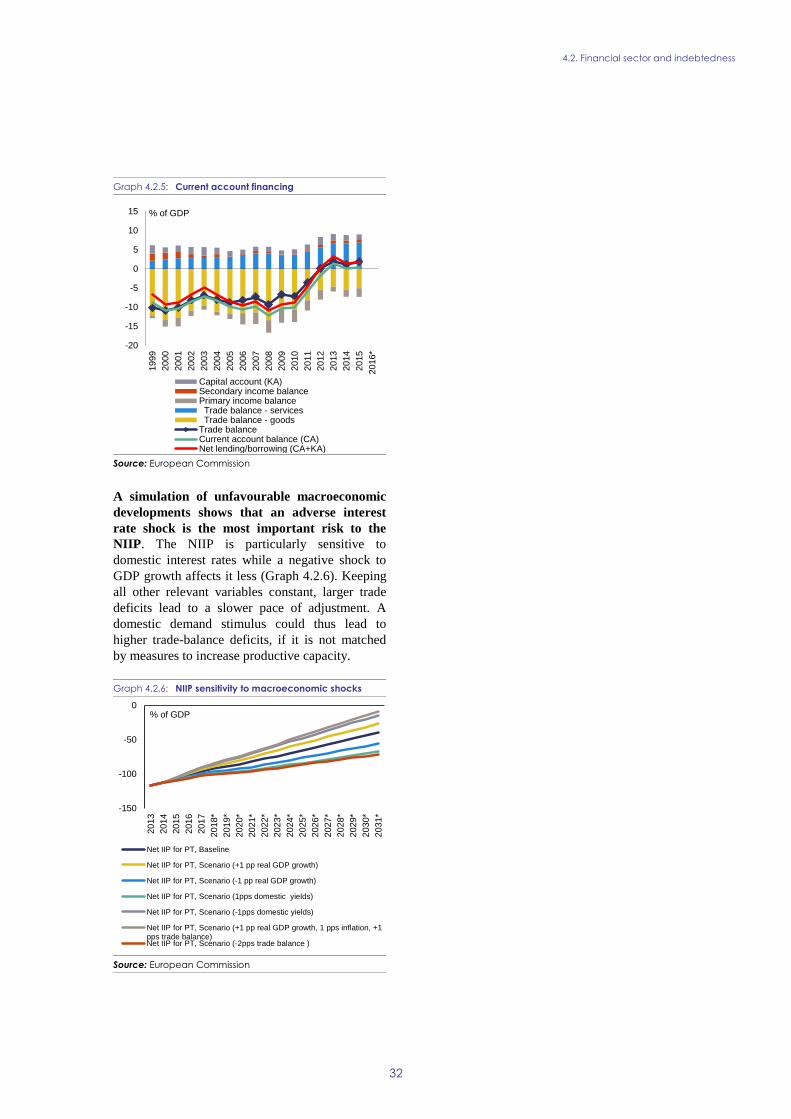
4.2. Financial sector and indebtedness
32
Graph 4.2.5: Current account financing
Source: European Commission
A simulation of unfavourable macroeconomic
developments shows that an adverse interest
rate shock is the most important risk to the
NIIP. The NIIP is particularly sensitive to
domestic interest rates while a negative shock to
GDP growth affects it less (Graph 4.2.6). Keeping
all other relevant variables constant, larger trade
deficits lead to a slower pace of adjustment. A
domestic demand stimulus could thus lead to
higher trade-balance deficits, if it is not matched
by measures to increase productive capacity.
Graph 4.2.6: NIIP sensitivity to macroeconomic shocks
Source: European Commission
-20
-15
-10
-5
0
5
10
15
1999
2000
2001
2002
2003
2004
2005
2006
2007
2008
2009
2010
2011
2012
2013
2014
2015
2016*
Capital account (KA)Secondary income balancePrimary income balance Trade balance - services Trade balance - goodsTrade balanceCurrent account balance (CA)Net lending/borrowing (CA+KA)
% of GDP
-150
-100
-50
0
2013
2014
2015
2016
2017
2018*
2019*
2020*
2021*
2022*
2023*
2024*
2025*
2026*
2027*
2028*
2029*
2030*
2031*
Net IIP for PT, Baseline
Net IIP for PT, Scenario (+1 pp real GDP growth)
Net IIP for PT, Scenario (-1 pp real GDP growth)
Net IIP for PT, Scenario (1pps domestic yields)
Net IIP for PT, Scenario (-1pps domestic yields)
Net IIP for PT, Scenario (+1 pp real GDP growth, 1 pps inflation, +1pps trade balance)Net IIP for PT, Scenario (-2pps trade balance )
% of GDP
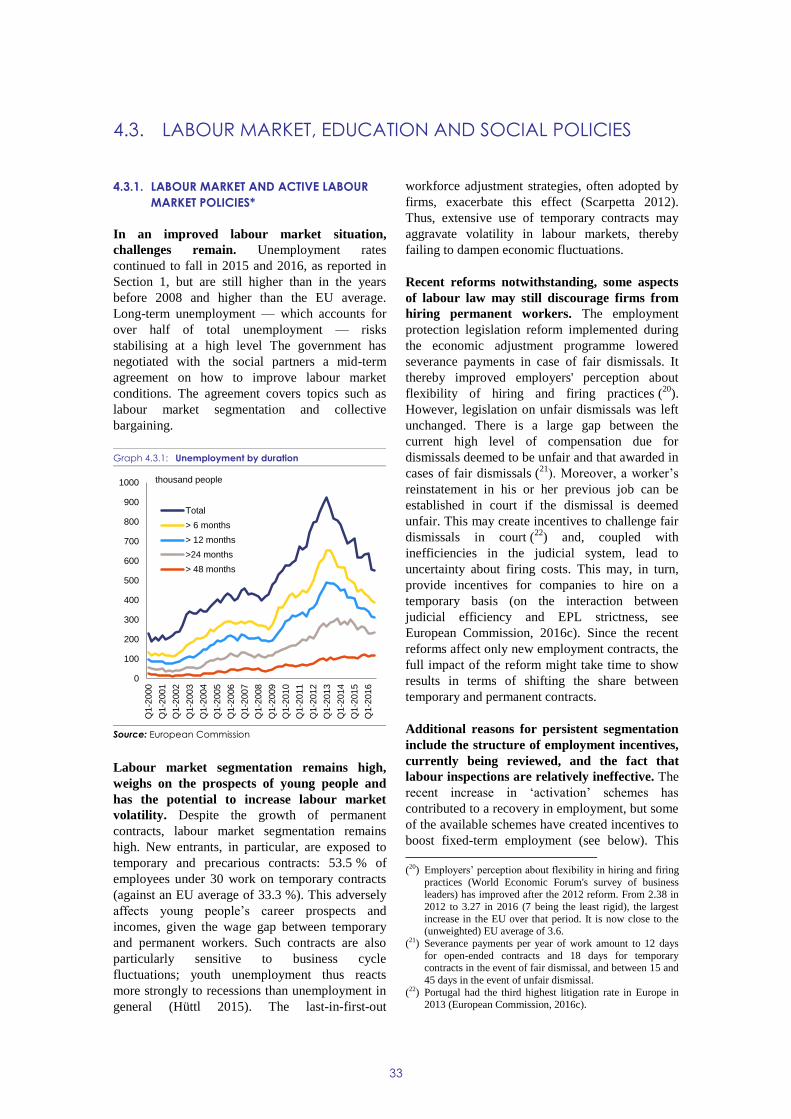
33
4.3.1. LABOUR MARKET AND ACTIVE LABOUR
MARKET POLICIES*
In an improved labour market situation,
challenges remain. Unemployment rates
continued to fall in 2015 and 2016, as reported in
Section 1, but are still higher than in the years
before 2008 and higher than the EU average.
Long-term unemployment — which accounts for
over half of total unemployment — risks
stabilising at a high level The government has
negotiated with the social partners a mid-term
agreement on how to improve labour market
conditions. The agreement covers topics such as
labour market segmentation and collective
bargaining.
Graph 4.3.1: Unemployment by duration
Source: European Commission
Labour market segmentation remains high,
weighs on the prospects of young people and
has the potential to increase labour market
volatility. Despite the growth of permanent
contracts, labour market segmentation remains
high. New entrants, in particular, are exposed to
temporary and precarious contracts: 53.5 % of
employees under 30 work on temporary contracts
(against an EU average of 33.3 %). This adversely
affects young people’s career prospects and
incomes, given the wage gap between temporary
and permanent workers. Such contracts are also
particularly sensitive to business cycle
fluctuations; youth unemployment thus reacts
more strongly to recessions than unemployment in
general (Hüttl 2015). The last-in-first-out
workforce adjustment strategies, often adopted by
firms, exacerbate this effect (Scarpetta 2012).
Thus, extensive use of temporary contracts may
aggravate volatility in labour markets, thereby
failing to dampen economic fluctuations.
Recent reforms notwithstanding, some aspects
of labour law may still discourage firms from
hiring permanent workers. The employment
protection legislation reform implemented during
the economic adjustment programme lowered
severance payments in case of fair dismissals. It
thereby improved employers' perception about
flexibility of hiring and firing practices (20
).
However, legislation on unfair dismissals was left
unchanged. There is a large gap between the
current high level of compensation due for
dismissals deemed to be unfair and that awarded in
cases of fair dismissals (21
). Moreover, a worker’s
reinstatement in his or her previous job can be
established in court if the dismissal is deemed
unfair. This may create incentives to challenge fair
dismissals in court (22
) and, coupled with
inefficiencies in the judicial system, lead to
uncertainty about firing costs. This may, in turn,
provide incentives for companies to hire on a
temporary basis (on the interaction between
judicial efficiency and EPL strictness, see
European Commission, 2016c). Since the recent
reforms affect only new employment contracts, the
full impact of the reform might take time to show
results in terms of shifting the share between
temporary and permanent contracts.
Additional reasons for persistent segmentation
include the structure of employment incentives,
currently being reviewed, and the fact that
labour inspections are relatively ineffective. The
recent increase in ‘activation’ schemes has
contributed to a recovery in employment, but some
of the available schemes have created incentives to
boost fixed-term employment (see below). This
(20) Employers’ perception about flexibility in hiring and firing
practices (World Economic Forum's survey of business leaders) has improved after the 2012 reform. From 2.38 in
2012 to 3.27 in 2016 (7 being the least rigid), the largest
increase in the EU over that period. It is now close to the (unweighted) EU average of 3.6.
(21) Severance payments per year of work amount to 12 days
for open-ended contracts and 18 days for temporary contracts in the event of fair dismissal, and between 15 and
45 days in the event of unfair dismissal.
(22) Portugal had the third highest litigation rate in Europe in 2013 (European Commission, 2016c).
0
100
200
300
400
500
600
700
800
900
1000
Q1-2
000
Q1-2
001
Q1-2
002
Q1-2
003
Q1-2
004
Q1-2
005
Q1-2
006
Q1-2
007
Q1-2
008
Q1-2
009
Q1-2
010
Q1-2
011
Q1-2
012
Q1-2
013
Q1-2
014
Q1-2
015
Q1-2
016
Total
> 6 months
> 12 months
>24 months
> 48 months
thousand people
4.3. LABOUR MARKET, EDUCATION AND SOCIAL POLICIES
4.3. Labour market, education and social policies
34
has prompted the Government to redesign in
January 2017 its employment support programme
to promote hiring on open-ended contracts while
restricting support for temporary contracts to
specific cases such as the very long-term
unemployed. However the expected impact on
reducing segmentation seems limited as only
15 000 people are foreseen to be covered by the
programme. As regards labour inspections, the
Authority for Working Conditions has launched a
public competition to hire 80 additional labour
inspectors. This additional capacity, together with
the planned interconnection of data between the
services of the labour inspectorate, Social Security
and Tax Authorities should enable more effective
identification of bogus self-employment and other
labour infractions.
Minimum wage increases are not aligned with
inflation and average productivity
developments. The government has increased the
monthly minimum wage (paid 14 times a year) by
5.1 %, to EUR 557 as of 1 January 2017. This
increase overcompensates for recent increases in
consumer prices, which rose by 0.6 % in 2016, and
average labour productivity, which remained
more-or-less stable (European Commission’s 2016
winter Forecast). This adds up to a similar
development in the previous year. Moreover, the
minimum wage rose faster than the average
compensation per employee (which rose by 1.4 %
in 2016), following a trend that started in 2007 (23
).
In spite of the recent significant increases in the
minimum wage, average wage growth has been
moderate (and sometimes negative) in recent
years, pointing to a limited impact on overall cost
competitiveness so far (24
) but leading to an
increasing wage compression. The latter may
reduce the returns to skills and therefore the
incentives to invest in them. The Government is
monitoring the impact of minimum wage
developments, namely through quarterly reports
which are published and discussed with social
partners.
(23) Between 2011 and 2014 the minimum wage was frozen.
See the 2016 Country Report (European Commission, 2016) for a detailed comparison of minimum wage
developments with relevant economic variables.
(24) The impact on average unit labour cost could even be
negative, if increases in the minimum wage eventually
have a negative effect on low-productivity jobs.
Increases in the minimum wage can reduce
in-work poverty and increase aggregate
demand but also involve risks to the
employment of low-wage groups. Evidence
shows that minimum wage increases may help
reduce (in-work) poverty (European Commission,
2016a) (25
). In 2013, before the most recent
increases in the minimum wage, more than 20 %
of minimum wage earners in Portugal were at risk
of poverty. Increases in the minimum wage can
also have a positive impact on aggregate demand if
not outpaced by possible negative employment
effects, depending on the relative position of the
minimum wage in the wage distribution. The
higher the minimum wage in the overall
distribution, the more binding it is, making it more
likely that some firms will forego filling some
low-productivity jobs. The potential negative
effect on employment is more marked for groups
with a higher share of low-wage workers, such as
young people and low-skilled workers (European
Commission, 2016a). In a context of employment
recovery, these risks have not materialised so far.
The minimum wage covers a rising share of
workers increasing the potential negative effect
on low-productivity jobs. The Portuguese
minimum wage was one of the highest in the EU
relative to the median wage in 2015 (57 %; OECD
data). The two recent increases also significantly
extended its coverage. The share of workers
earning the minimum wage rose from about 12 %
to 16 % in October 2014, and to around 21 % in
the first nine months of 2016. It is expected to rise
further in 2017, as the increase in the minimum
wage is higher than the forecast increase in
employees’ compensation. At the same time, the
share of workers earning the minimum wage
among new contracts increased from below 25 %
in early 2014 to around 38 % by mid-2016
(Portuguese Cabinet of Strategy and Planning,
2016).
More workers were covered by new collective
agreements in 2016. From January to August the
share of workers covered by newly signed
collective agreements in the private sector rose to
26 %. It was expected to reach 40 % by the end of
(25) The incidence of this effect cannot be assessed yet, as the
most recent in-work poverty figures reflect 2014 incomes (i.e. before the latest increases in minimum wages). See
Section 4.3.2 for details.
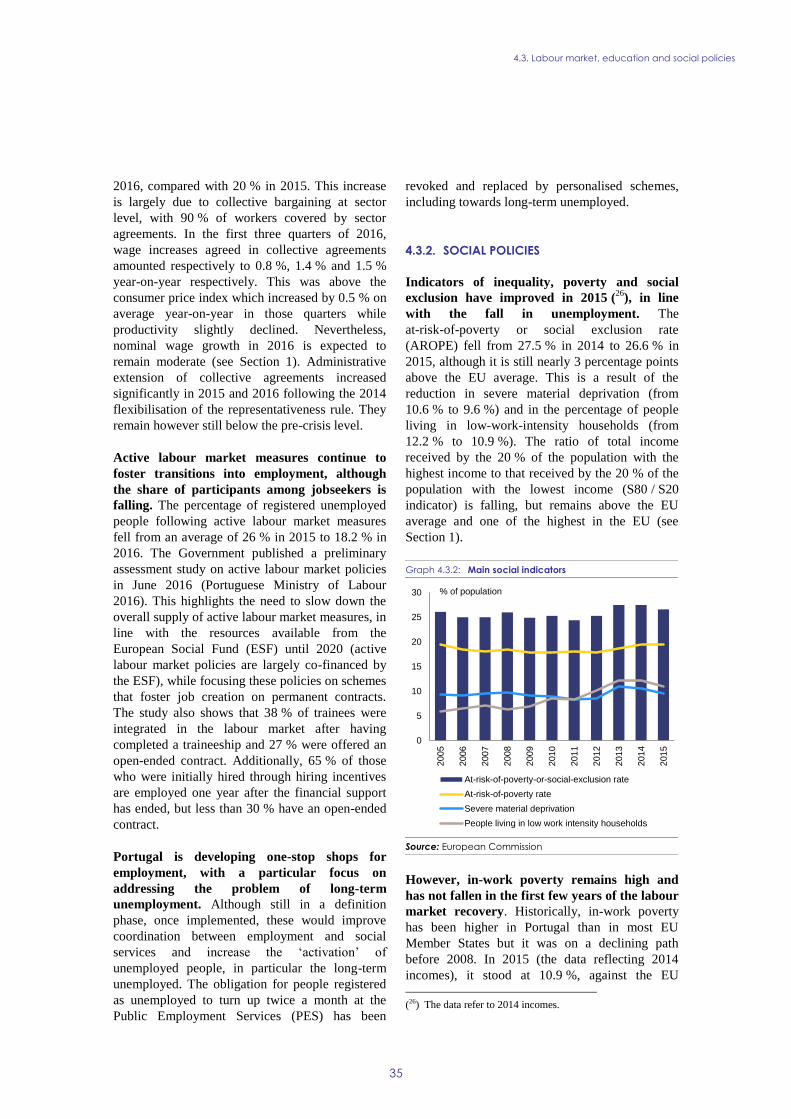
4.3. Labour market, education and social policies
35
2016, compared with 20 % in 2015. This increase
is largely due to collective bargaining at sector
level, with 90 % of workers covered by sector
agreements. In the first three quarters of 2016,
wage increases agreed in collective agreements
amounted respectively to 0.8 %, 1.4 % and 1.5 %
year-on-year respectively. This was above the
consumer price index which increased by 0.5 % on
average year-on-year in those quarters while
productivity slightly declined. Nevertheless,
nominal wage growth in 2016 is expected to
remain moderate (see Section 1). Administrative
extension of collective agreements increased
significantly in 2015 and 2016 following the 2014
flexibilisation of the representativeness rule. They
remain however still below the pre-crisis level.
Active labour market measures continue to
foster transitions into employment, although
the share of participants among jobseekers is
falling. The percentage of registered unemployed
people following active labour market measures
fell from an average of 26 % in 2015 to 18.2 % in
2016. The Government published a preliminary
assessment study on active labour market policies
in June 2016 (Portuguese Ministry of Labour
2016). This highlights the need to slow down the
overall supply of active labour market measures, in
line with the resources available from the
European Social Fund (ESF) until 2020 (active
labour market policies are largely co-financed by
the ESF), while focusing these policies on schemes
that foster job creation on permanent contracts.
The study also shows that 38 % of trainees were
integrated in the labour market after having
completed a traineeship and 27 % were offered an
open-ended contract. Additionally, 65 % of those
who were initially hired through hiring incentives
are employed one year after the financial support
has ended, but less than 30 % have an open-ended
contract.
Portugal is developing one-stop shops for
employment, with a particular focus on
addressing the problem of long-term
unemployment. Although still in a definition
phase, once implemented, these would improve
coordination between employment and social
services and increase the ‘activation’ of
unemployed people, in particular the long-term
unemployed. The obligation for people registered
as unemployed to turn up twice a month at the
Public Employment Services (PES) has been
revoked and replaced by personalised schemes,
including towards long-term unemployed.
4.3.2. SOCIAL POLICIES
Indicators of inequality, poverty and social
exclusion have improved in 2015 (26
), in line
with the fall in unemployment. The
at-risk-of-poverty or social exclusion rate
(AROPE) fell from 27.5 % in 2014 to 26.6 % in
2015, although it is still nearly 3 percentage points
above the EU average. This is a result of the
reduction in severe material deprivation (from
10.6 % to 9.6 %) and in the percentage of people
living in low-work-intensity households (from
12.2 % to 10.9 %). The ratio of total income
received by the 20 % of the population with the
highest income to that received by the 20 % of the
population with the lowest income (S80 / S20
indicator) is falling, but remains above the EU
average and one of the highest in the EU (see
Section 1).
Graph 4.3.2: Main social indicators
Source: European Commission
However, in-work poverty remains high and
has not fallen in the first few years of the labour
market recovery. Historically, in-work poverty
has been higher in Portugal than in most EU
Member States but it was on a declining path
before 2008. In 2015 (the data reflecting 2014
incomes), it stood at 10.9 %, against the EU
(26) The data refer to 2014 incomes.
0
5
10
15
20
25
30
2005
2006
2007
2008
2009
2010
2011
2012
2013
2014
2015
At-risk-of-poverty-or-social-exclusion rate
At-risk-of-poverty rate
Severe material deprivation
People living in low work intensity households
% of population
4.3. Labour market, education and social policies
36
average of 9.5 %. The slight increase in in-work
poverty, as compared to the previous two years,
seems to indicate that the first period of the labour
market recovery, which started in early 2013,
increased median income more than that of
low-wage earners. A large proportion of atypical
employment contracts and high involuntary
part-time employment may also contribute to this
trend. In-work poverty among individuals with
temporary contracts was twice that of people with
a permanent contract (13.3 % v 6.5 %,
respectively) in 2015. In addition, households with
dependent children are particularly vulnerable to
in-work poverty (12.7 % compared to 11.2 % in
the EU). The minimum wage increase of October
2014 is not yet fully reflected in the latest wave of
social indicators, since they reflect 2014 incomes.
The same holds for the subsequent increases until
January 2017, which might potentially have a
reducing effect on in-work poverty.
Several measures were adopted in 2016 to
improve the income conditions of people in
low-income households. After some measures to
widen the coverage of the minimum income
scheme (27
) in early 2016, the number of
individuals benefiting from the scheme has been
increasing steadily since March (when the changes
became effective). The number of beneficiaries
rose to 214 000 in November 2016, while the mean
value rose to EUR 252.70 per household. Though
this is considerably below the poverty threshold, it
represents an increase of 17.9 % in the monthly
mean value per household if compared to
February. While the minimum income on its own
is not sufficient to reduce the risk of poverty, it
plays an important role in mitigating the intensity
and severity of poverty.
Changes in child benefits and in social benefit
for the elderly have a positive, though limited,
impact on poverty reduction. Given the large
proportion of children at risk of poverty or social
exclusion (29.1 % in 2015), in January 2016 the
government increased monthly child benefits by
between 2 % and 3.5 % as well as the extra income
given to lone parent families from 20 % to 35 %.
However, the increase in general child benefits for
(27) In January, the reference value of the Social Support Index
was increased from 42.5 to 43.2 % and the equivalence scale for calculating the minimum income scheme was
reinstated, widening its coverage.
households is marginal, while the monthly increase
in the extra amount paid to single parent
households is slightly more significant.
Older people continue to show lower risk of
poverty and social exclusion than the
working-age population. The impact of the fiscal
adjustment in recent years was sharper for young
and working-age people than pensioners.
Government spending on education and social
benefits for family and children fell by 16 %
between 2007 and 2014, while expenditure
directed towards older people, such as healthcare
and pensions, increased by 14 %. In 2015, the
AROPE among those aged 65 and above was
21.7 %, against 25.2 % among 25-54-year-olds.
However, the risk of poverty or social exclusion
for older people remains higher than the EU
average. In this regard, the reference value of the
elderly solidarity supplement was increased
through three legislative changes from EUR 4 909
in 2015 to EUR 5 084 in 2017. This social benefit
may help reduce the at-risk-of-poverty rate for the
elderly, although the number of people benefiting
from the measure has fallen slightly by comparison
with 2015. According to the Portuguese
authorities, some potential beneficiaries are failing
to claim their entitlements because they are
unaware of the eligibility criteria. In 2016, the
authorities launched a national awareness
campaign to tackle this issue.
A new social benefit was introduced for
unemployed who no longer have access to
unemployment benefits or assistance. This
benefit, established in March 2016, is payable for a
maximum of 180 days. It amounts to 80 % of the
last social assistance benefit paid. Like the
unemployment assistance scheme, it is
means-tested (28
). According to the National
Reform Programme, this measure is designed to
reach 70 000 people until 2020. Up until
November 2016, 3 065 people were covered.
Overall, the health of the Portuguese population
is good yet some indicators point to potential
inequalities in access. Access to primary health
care is limited; in 2015, 10 % of the population did
not have a family doctor. One reason for this is the
(28) The household should not have movable assets worth more
than EUR 100 613. Its monthly income per capita should be under EUR 335.
4.3. Labour market, education and social policies
37
uneven geographic distribution of doctors.
Consolidating current government action to recruit
family doctors and promote their mobility could be
beneficial in the context of a well-oriented health
care reform. However, it is not yet possible to give
a full assessment of the results of the reform. There
is a high share of out-of-pocket expenditure and a
low share of public financing of pharmaceutical
expenditure, even though the state covers 100 % of
spending in some cases (Eurostat/WHO data).
Mortality due to respiratory diseases and healthy
life years for females rank among the worst in the
EU. Portuguese women live longer periods with
disease or disability than the EU average, which
shortens their working lives. This could be due in
part to a shortage of health promotion and disease
prevention activities which tend to address healthy
life styles and disease screening.
4.3.3. EDUCATION
The Portuguese school system has improved its
basic skills outcomes but performance gaps
linked to students' socioeconomic background
remain a challenge. Portugal is continuing to
reduce early school-leaving. With a rate of 13.7 %
in 2015, the country is moving towards the Europe
2020 national target of 10 %. The 2015 Trends in
International Mathematics and Science Study
shows that fourth-year pupils (nine-year-olds) in
Portugal improved their performance in
mathematics between 2011 and 2015. The 2015
OECD Programme for International Student
Assessment (PISA) showed that Portugal had
improved its average performance levels. The
share of low achievers in reading, maths and
sciences among 15-year-olds dropped. The
proportion of low achievers is now lower than the
EU average in reading and science but slightly
higher in maths. The impact of socioeconomic
status on student performance is closer to the EU
average but remains significant. Rates of low
achievers are below 10 % among the upper social
quarter but around 30 % among the lower one. The
gap in performance between non-immigrants and
both first and second-generation immigrants is
small, especially in reading and science.
The government is implementing a plan to
promote school success. Approved in March 2016
it is designed to address education inequalities and
preventing school failure. The plan is based on a
closer cooperation between schools and municipal
authorities so as to develop specific strategic plans
adapted to their local needs. It provides schools
with additional teaching hours to implement
pedagogical projects and improve students' basic
skills. In June 2016, 663 education centres had
joined this Plan most of which will benefit from
100 additional teaching hours over the 2016-2017
school year. Each school will also benefit from 10
specific training actions provided by 91 training
centres. This Plan, although it does not preclude
the implementation of the Autonomy Contracts
signed over the past three years with more than
200 schools nonetheless puts their renewal and
continuation on hold.
High rates of grade repetition weigh on
education costs, social inclusion and labour
market outcomes. With 31 % of students having
repeated an academic year, Portugal shows the
third highest rate in the EU (PISA, 2016). The
social gap is significant, with rates over 52 %
among disadvantaged students and less than 9 %
among advantaged ones. This is estimated to
increase public education costs by EUR 250
million a year. The upward trend in grade retention
has reverted in 2014-2015 but remains high at
15 % in secondary school (National Education
Council 2015a). Successive grade retention
increases the risk of dropping out of school and
lowers attainment expectations (OECD, 2012),
translating into lower professional achievement
and wages. The previous programmes of basic
vocational education and training for students
required to repeat several academic years are now
over. The government proposes to tackle school
failure by improving tutoring support to students
and reasserting the value of transferable skills in
the curricula. Students experiencing difficulties
will have four hours of tutoring a week with
teachers who have received special training. The
new tutoring system is also expected to help make
better use of teaching staff and reduce the number
of teachers without jobs.
The composition of the teaching force shows
some mismatch. The failing demographic trend
and consecutive reforms of the curricula in
primary and secondary education have reduced
teaching needs in some areas. A significant
number of teachers have thus been left with no
professional assignment. On the other hand, limits
to retraining these trainers as well as budget
4.3. Labour market, education and social policies
38
constraints to recruiting new teachers have limited
the possibility of dealing with new requirements,
such as special education needs (National
Education Council 2015b) with specific skills and
in the regions where those are required. The rise in
the average age of teachers has also increased the
average cost of teaching hours since older teachers
have higher salaries and shorter teaching
schedules. There is also a worrying segmentation
in terms of contracts. Many new teachers are hired
on a fixed-term contract, although they are actually
filling a permanent position. This creates
inefficiencies in human resources management and
career uncertainty for teachers. Possible
improvements in this area will probably be
explored by the upcoming School Resource
Review on Portugal led by the OECD.
While graduates have a high employment rate,
many seek opportunities abroad, which limit
the effectiveness of spending in higher
education. According to the Emigration
Observatory, Portugal is one of the European
countries with the highest rates of highly qualified
individuals who emigrate (11 %). Demand for
tertiary qualifications is however increasing with
graduates' employability rate in the labour market
(81.5 %) exceeding that of people with upper
secondary qualifications (68.3 %) (29
). But limited
career prospects and low wage levels limit the
economic return on the education investment.
They make highly skilled youngsters look for
better opportunities abroad (European Commission
2016b) and in some cases might make higher
education less attractive. In particular this may
have contributed to the fall in enrolment of about
30 % between 2011 and 2014 (PORDATA).
Enrolment stabilised in 2015 and rose by 2.2 % in
2016.
The higher education offer is quite
heterogeneous and does not necessarily match
actual demand. So far, the polytechnic institutes
have been at the centre of the strategy to
modernise higher education. Decree Law No
63/2016 upgrades the higher education technical
vocational courses (CTeSP) by integrating them
into the Legal Regime of degrees and higher
education diplomas. This increases further an
already dispersed scope of higher education
programmes. Yet, it is expected to consolidate the
(29) Eurostat data (lfsq_ergaed) referring to Q3 2016.
new upward trend in enrolment on such courses
and encourage cooperation with business. Business
sciences, computing, personal services and
engineering are sectors where CTeSP courses are
expanding most. Universities have not been
included in this modernisation effort. The low
mobility of academics in Portuguese universities
also limits their competitiveness in terms of quality
of teaching and projects, which reduces their
efficiency (National Education Council 2015b).
The Government has requested a higher education
review to explore avenues for reforms in the higher
education system. Few universities have engaged
in specific cooperation projects with companies at
regional level. However, the Government has
made some efforts in encouraging the interaction
between universities and the business sector, but a
comprehensive and integrated strategy is missing.
The upcoming second phase of the National Skills
Strategy project could open up new opportunities
to make progress on this issue.
The low level of skills among the Portuguese
labour force is an obstacle to innovation and
economic transformation. The Government's new
initiative to promote adult education Programa
Qualifica – is based, namely, in the establishment
of the ‘Qualifica’ centres focused on promoting
adult qualification by recognizing, validating and
certifying prior learning and competences acquired
by adults in different life contects complemented
by vocational education and training adapted to
each individual. The revamped ‘Qualifica’ centres,
that replaced the previous network of specialized
Centres on adult qualification, have been
reinforced with upskilled staff. The government
has also launched the ‘Qualifica passport’, a new
online tool that not only registers the learning and
competences acquired by adults, but also allows to
understand what the adult lacks in order to achieve
a certain qualification. The outcomes of the
National Skills Strategy project could help boost
efforts to tackle adults' skills gaps. The Vocational
Education and Training system further expanded
the number of people enrolled and the number of
trainings provided in 2016. However, the
remaining overlap between programmes
undermines the system's efficiency and its
effectiveness in terms of labour market integration
(European Commission 2016b).
Digital skills remain a barrier for upgrading the
labour force skills. About 22 % of people in the
4.3. Labour market, education and social policies
39
Portuguese labour force have no digital skills
(mostly because they do not use the internet
regularly), about double the EU average. Only
54 % has basic or above basic digital skills (63 %
EU average) (Digital Scoreboard 2017, European
Commission). In a global context of rapid
digitisation of organisations and work
environments, insufficient digital skills can hamper
productivity and the transition towards a higher
value production structure. The digital skills deficit
also applies to the Portuguese population, chiefly
the elderly, low-income and low-education groups.
This situation is acknowledged in the Portuguese
Digital Agenda Strategy, although few details on
budgeting or implementation measures are
currently available. Together with limited
affordability and switching costs, it might be
hampering the take-up of broadband and digital
services (30
).
(30) Of Portuguese households 68 % subscribe to fixed
broadband (EU 74 %). There are 55 subscriptions to
mobile broadband per 100 people (average of 84 in the
EU).
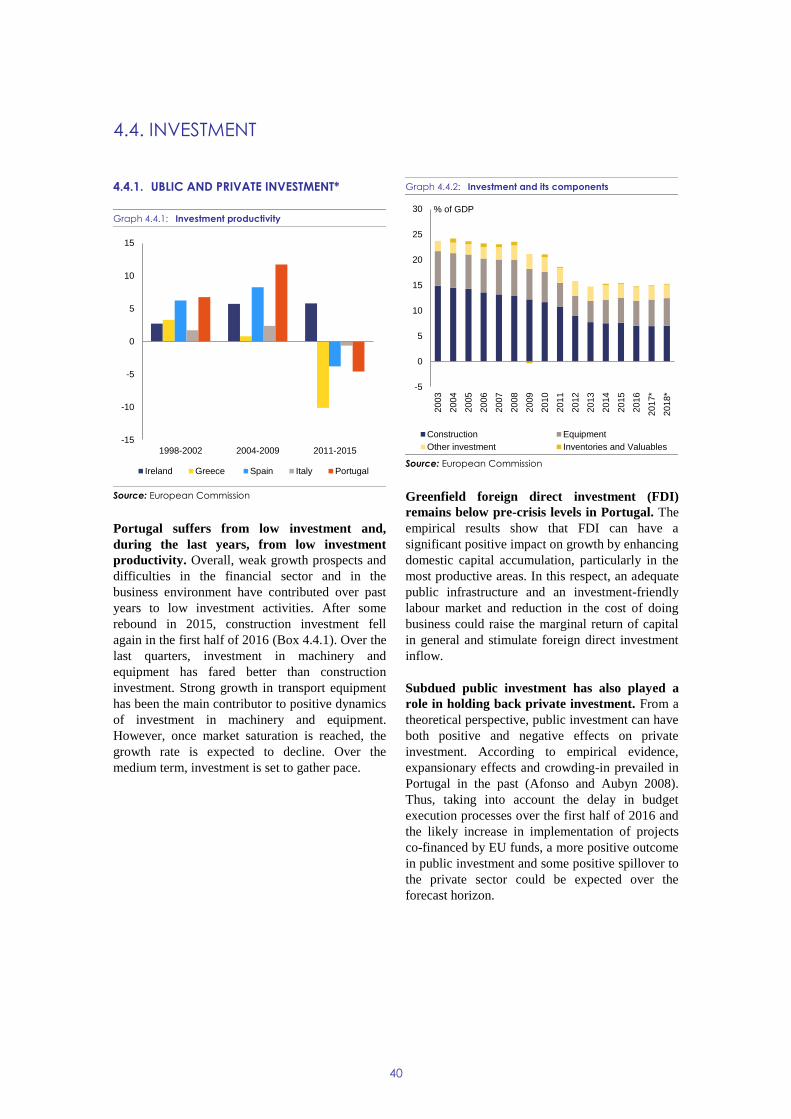
40
4.4.1. UBLIC AND PRIVATE INVESTMENT*
Graph 4.4.1: Investment productivity
Source: European Commission
Portugal suffers from low investment and,
during the last years, from low investment
productivity. Overall, weak growth prospects and
difficulties in the financial sector and in the
business environment have contributed over past
years to low investment activities. After some
rebound in 2015, construction investment fell
again in the first half of 2016 (Box 4.4.1). Over the
last quarters, investment in machinery and
equipment has fared better than construction
investment. Strong growth in transport equipment
has been the main contributor to positive dynamics
of investment in machinery and equipment.
However, once market saturation is reached, the
growth rate is expected to decline. Over the
medium term, investment is set to gather pace.
Graph 4.4.2: Investment and its components
Source: European Commission
Greenfield foreign direct investment (FDI)
remains below pre-crisis levels in Portugal. The
empirical results show that FDI can have a
significant positive impact on growth by enhancing
domestic capital accumulation, particularly in the
most productive areas. In this respect, an adequate
public infrastructure and an investment-friendly
labour market and reduction in the cost of doing
business could raise the marginal return of capital
in general and stimulate foreign direct investment
inflow.
Subdued public investment has also played a
role in holding back private investment. From a
theoretical perspective, public investment can have
both positive and negative effects on private
investment. According to empirical evidence,
expansionary effects and crowding-in prevailed in
Portugal in the past (Afonso and Aubyn 2008).
Thus, taking into account the delay in budget
execution processes over the first half of 2016 and
the likely increase in implementation of projects
co-financed by EU funds, a more positive outcome
in public investment and some positive spillover to
the private sector could be expected over the
forecast horizon.
-15
-10
-5
0
5
10
15
1998-2002 2004-2009 2011-2015
Ireland Greece Spain Italy Portugal
-5
0
5
10
15
20
25
30
2003
2004
2005
2006
2007
2008
2009
2010
2011
2012
2013
2014
2015
2016
2017*
2018*
Construction Equipment
Other investment Inventories and Valuables
% of GDP
4.4. INVESTMENT
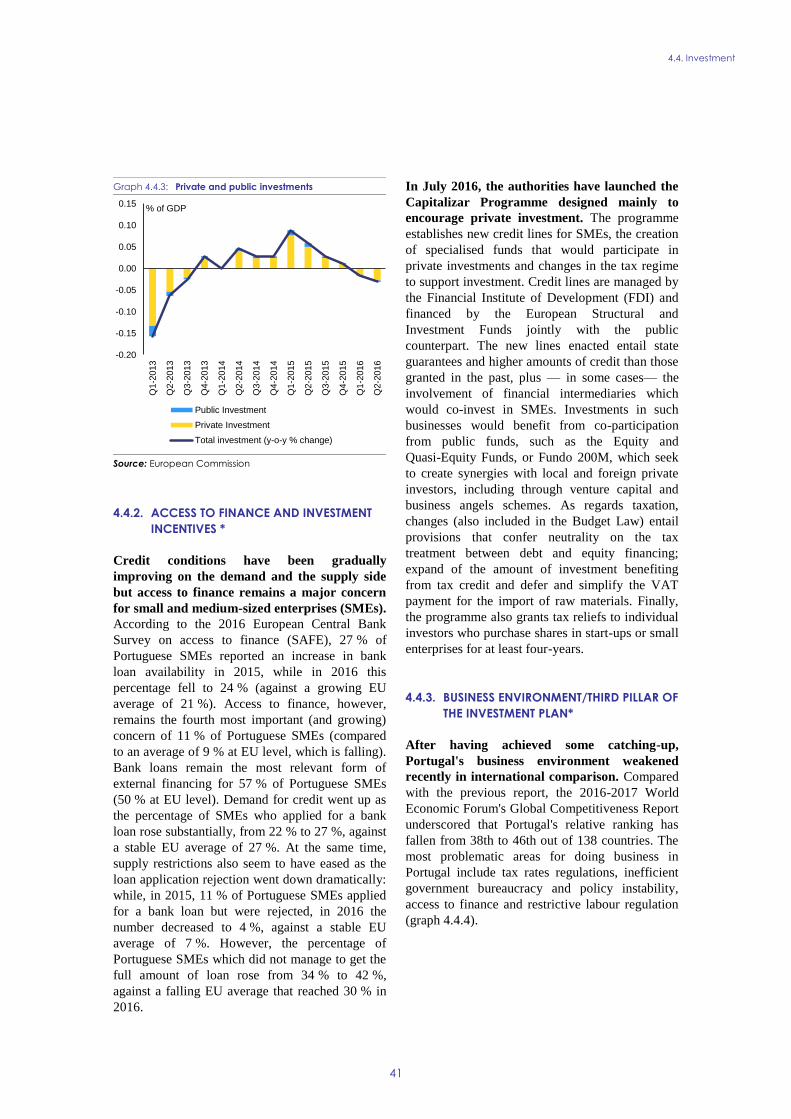
4.4. Investment
41
Graph 4.4.3: Private and public investments
Source: European Commission
4.4.2. ACCESS TO FINANCE AND INVESTMENT
INCENTIVES *
Credit conditions have been gradually
improving on the demand and the supply side
but access to finance remains a major concern
for small and medium-sized enterprises (SMEs).
According to the 2016 European Central Bank
Survey on access to finance (SAFE), 27 % of
Portuguese SMEs reported an increase in bank
loan availability in 2015, while in 2016 this
percentage fell to 24 % (against a growing EU
average of 21 %). Access to finance, however,
remains the fourth most important (and growing)
concern of 11 % of Portuguese SMEs (compared
to an average of 9 % at EU level, which is falling).
Bank loans remain the most relevant form of
external financing for 57 % of Portuguese SMEs
(50 % at EU level). Demand for credit went up as
the percentage of SMEs who applied for a bank
loan rose substantially, from 22 % to 27 %, against
a stable EU average of 27 %. At the same time,
supply restrictions also seem to have eased as the
loan application rejection went down dramatically:
while, in 2015, 11 % of Portuguese SMEs applied
for a bank loan but were rejected, in 2016 the
number decreased to 4 %, against a stable EU
average of 7 %. However, the percentage of
Portuguese SMEs which did not manage to get the
full amount of loan rose from 34 % to 42 %,
against a falling EU average that reached 30 % in
2016.
In July 2016, the authorities have launched the
Capitalizar Programme designed mainly to
encourage private investment. The programme
establishes new credit lines for SMEs, the creation
of specialised funds that would participate in
private investments and changes in the tax regime
to support investment. Credit lines are managed by
the Financial Institute of Development (FDI) and
financed by the European Structural and
Investment Funds jointly with the public
counterpart. The new lines enacted entail state
guarantees and higher amounts of credit than those
granted in the past, plus — in some cases— the
involvement of financial intermediaries which
would co-invest in SMEs. Investments in such
businesses would benefit from co-participation
from public funds, such as the Equity and
Quasi-Equity Funds, or Fundo 200M, which seek
to create synergies with local and foreign private
investors, including through venture capital and
business angels schemes. As regards taxation,
changes (also included in the Budget Law) entail
provisions that confer neutrality on the tax
treatment between debt and equity financing;
expand of the amount of investment benefiting
from tax credit and defer and simplify the VAT
payment for the import of raw materials. Finally,
the programme also grants tax reliefs to individual
investors who purchase shares in start-ups or small
enterprises for at least four-years.
4.4.3. BUSINESS ENVIRONMENT/THIRD PILLAR OF
THE INVESTMENT PLAN*
After having achieved some catching-up,
Portugal's business environment weakened
recently in international comparison. Compared
with the previous report, the 2016-2017 World
Economic Forum's Global Competitiveness Report
underscored that Portugal's relative ranking has
fallen from 38th to 46th out of 138 countries. The
most problematic areas for doing business in
Portugal include tax rates regulations, inefficient
government bureaucracy and policy instability,
access to finance and restrictive labour regulation
(graph 4.4.4).
-0.20
-0.15
-0.10
-0.05
0.00
0.05
0.10
0.15
Q1-2
013
Q2-2
013
Q3-2
013
Q4-2
013
Q1-2
014
Q2-2
014
Q3-2
014
Q4-2
014
Q1-2
015
Q2-2
015
Q3-2
015
Q4-2
015
Q1-2
016
Q2-2
016
Public Investment
Private Investment
Total investment (y-o-y % change)
% of GDP
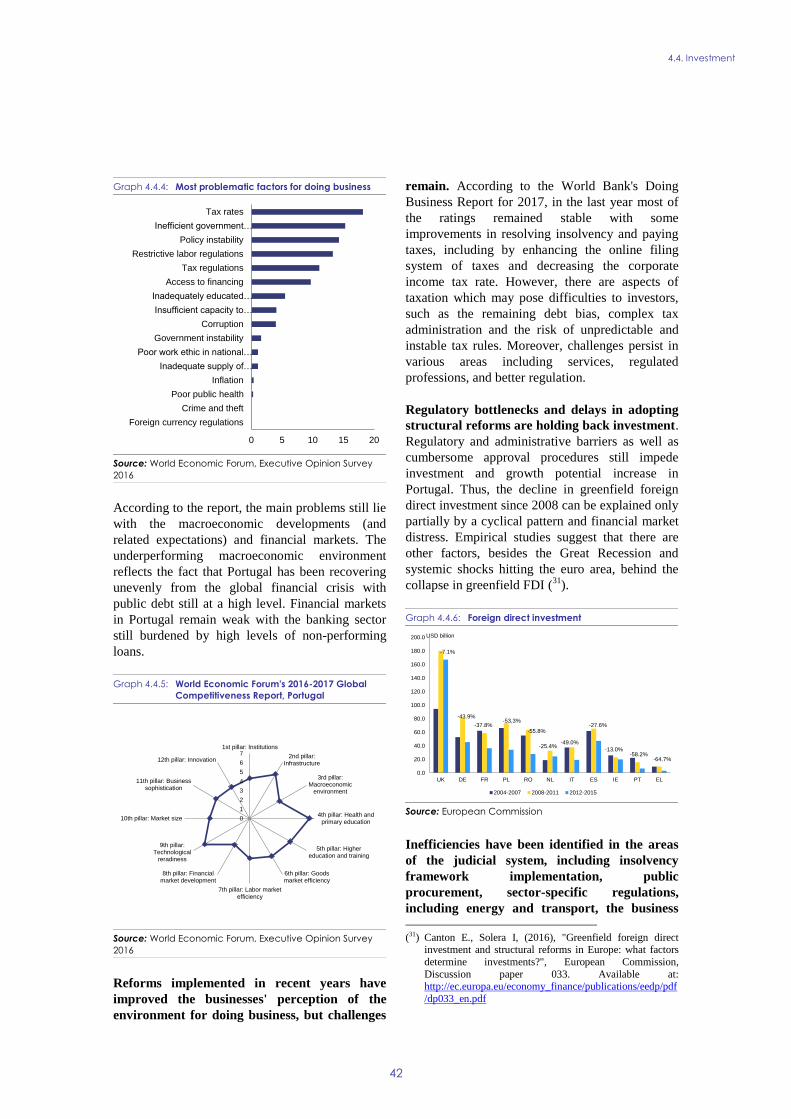
4.4. Investment
42
Graph 4.4.4: Most problematic factors for doing business
Source: World Economic Forum, Executive Opinion Survey
2016
According to the report, the main problems still lie
with the macroeconomic developments (and
related expectations) and financial markets. The
underperforming macroeconomic environment
reflects the fact that Portugal has been recovering
unevenly from the global financial crisis with
public debt still at a high level. Financial markets
in Portugal remain weak with the banking sector
still burdened by high levels of non-performing
loans.
Graph 4.4.5: World Economic Forum's 2016-2017 Global
Competitiveness Report, Portugal
Source: World Economic Forum, Executive Opinion Survey
2016
Reforms implemented in recent years have
improved the businesses' perception of the
environment for doing business, but challenges
remain. According to the World Bank's Doing
Business Report for 2017, in the last year most of
the ratings remained stable with some
improvements in resolving insolvency and paying
taxes, including by enhancing the online filing
system of taxes and decreasing the corporate
income tax rate. However, there are aspects of
taxation which may pose difficulties to investors,
such as the remaining debt bias, complex tax
administration and the risk of unpredictable and
instable tax rules. Moreover, challenges persist in
various areas including services, regulated
professions, and better regulation.
Regulatory bottlenecks and delays in adopting
structural reforms are holding back investment.
Regulatory and administrative barriers as well as
cumbersome approval procedures still impede
investment and growth potential increase in
Portugal. Thus, the decline in greenfield foreign
direct investment since 2008 can be explained only
partially by a cyclical pattern and financial market
distress. Empirical studies suggest that there are
other factors, besides the Great Recession and
systemic shocks hitting the euro area, behind the
collapse in greenfield FDI (31
).
Graph 4.4.6: Foreign direct investment
Source: European Commission
Inefficiencies have been identified in the areas
of the judicial system, including insolvency
framework implementation, public
procurement, sector-specific regulations,
including energy and transport, the business
(31) Canton E., Solera I, (2016), "Greenfield foreign direct
investment and structural reforms in Europe: what factors
determine investments?", European Commission,
Discussion paper 033. Available at: http://ec.europa.eu/economy_finance/publications/eedp/pdf
/dp033_en.pdf
0 5 10 15 20
Foreign currency regulations
Crime and theft
Poor public health
Inflation
Inadequate supply of…
Poor work ethic in national…
Government instability
Corruption
Insufficient capacity to…
Inadequately educated…
Access to financing
Tax regulations
Restrictive labor regulations
Policy instability
Inefficient government…
Tax rates
0
1
2
3
4
5
6
71st pillar: Institutions
2nd pillar:Infrastructure
3rd pillar:Macroeconomic
environment
4th pillar: Health andprimary education
5th pillar: Highereducation and training
6th pillar: Goodsmarket efficiency
7th pillar: Labor marketefficiency
8th pillar: Financialmarket development
9th pillar:Technological
reradiness
10th pillar: Market size
11th pillar: Businesssophistication
12th pillar: Innovation
0.0
20.0
40.0
60.0
80.0
100.0
120.0
140.0
160.0
180.0
200.0
UK DE FR PL RO NL IT ES IE PT EL
2004-2007 2008-2011 2012-2015
USD billion
-7.1%
-43.9%-53,3%
-55.8%-37.8%
-25.4%-49.0%
-27.6%
-13.0%-58.2%
-64.7%
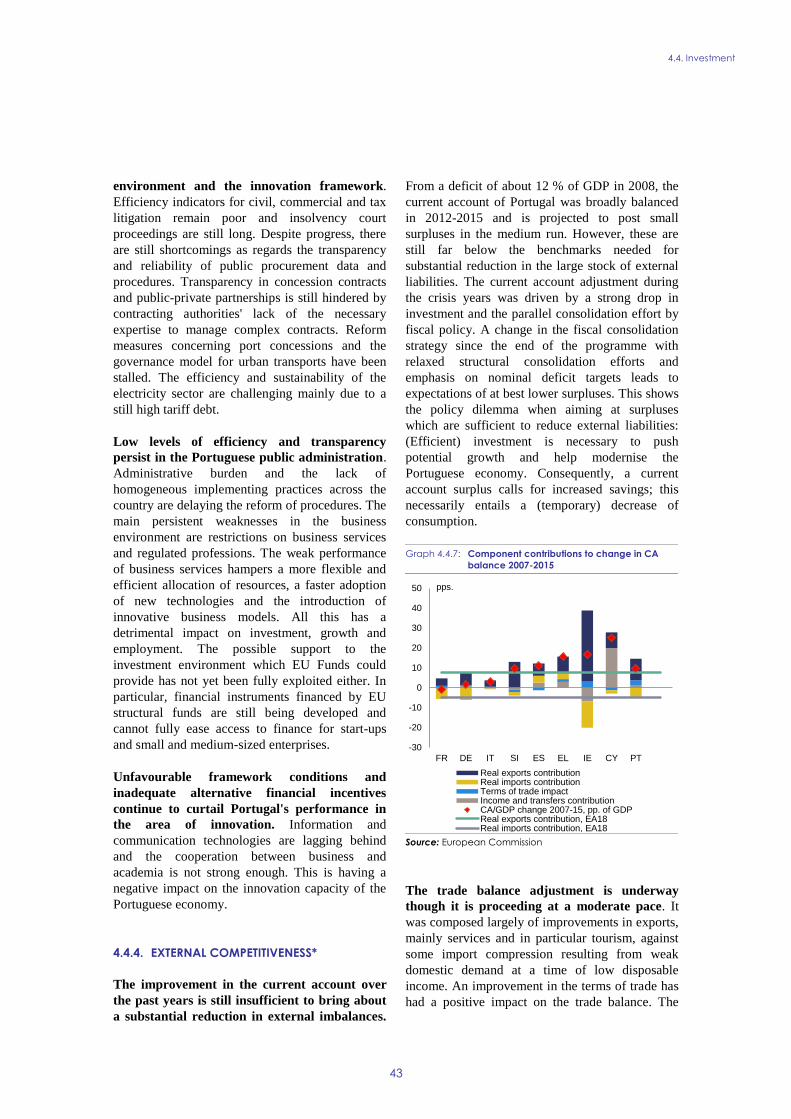
4.4. Investment
43
environment and the innovation framework.
Efficiency indicators for civil, commercial and tax
litigation remain poor and insolvency court
proceedings are still long. Despite progress, there
are still shortcomings as regards the transparency
and reliability of public procurement data and
procedures. Transparency in concession contracts
and public-private partnerships is still hindered by
contracting authorities' lack of the necessary
expertise to manage complex contracts. Reform
measures concerning port concessions and the
governance model for urban transports have been
stalled. The efficiency and sustainability of the
electricity sector are challenging mainly due to a
still high tariff debt.
Low levels of efficiency and transparency
persist in the Portuguese public administration.
Administrative burden and the lack of
homogeneous implementing practices across the
country are delaying the reform of procedures. The
main persistent weaknesses in the business
environment are restrictions on business services
and regulated professions. The weak performance
of business services hampers a more flexible and
efficient allocation of resources, a faster adoption
of new technologies and the introduction of
innovative business models. All this has a
detrimental impact on investment, growth and
employment. The possible support to the
investment environment which EU Funds could
provide has not yet been fully exploited either. In
particular, financial instruments financed by EU
structural funds are still being developed and
cannot fully ease access to finance for start-ups
and small and medium-sized enterprises.
Unfavourable framework conditions and
inadequate alternative financial incentives
continue to curtail Portugal's performance in
the area of innovation. Information and
communication technologies are lagging behind
and the cooperation between business and
academia is not strong enough. This is having a
negative impact on the innovation capacity of the
Portuguese economy.
4.4.4. EXTERNAL COMPETITIVENESS*
The improvement in the current account over
the past years is still insufficient to bring about
a substantial reduction in external imbalances.
From a deficit of about 12 % of GDP in 2008, the
current account of Portugal was broadly balanced
in 2012-2015 and is projected to post small
surpluses in the medium run. However, these are
still far below the benchmarks needed for
substantial reduction in the large stock of external
liabilities. The current account adjustment during
the crisis years was driven by a strong drop in
investment and the parallel consolidation effort by
fiscal policy. A change in the fiscal consolidation
strategy since the end of the programme with
relaxed structural consolidation efforts and
emphasis on nominal deficit targets leads to
expectations of at best lower surpluses. This shows
the policy dilemma when aiming at surpluses
which are sufficient to reduce external liabilities:
(Efficient) investment is necessary to push
potential growth and help modernise the
Portuguese economy. Consequently, a current
account surplus calls for increased savings; this
necessarily entails a (temporary) decrease of
consumption.
Graph 4.4.7: Component contributions to change in CA
balance 2007-2015
Source: European Commission
The trade balance adjustment is underway
though it is proceeding at a moderate pace. It
was composed largely of improvements in exports,
mainly services and in particular tourism, against
some import compression resulting from weak
domestic demand at a time of low disposable
income. An improvement in the terms of trade has
had a positive impact on the trade balance. The
-30
-20
-10
0
10
20
30
40
50
FR DE IT SI ES EL IE CY PT
Real exports contributionReal imports contributionTerms of trade impactIncome and transfers contributionCA/GDP change 2007-15, pp. of GDPReal exports contribution, EA18Real imports contribution, EA18
pps.
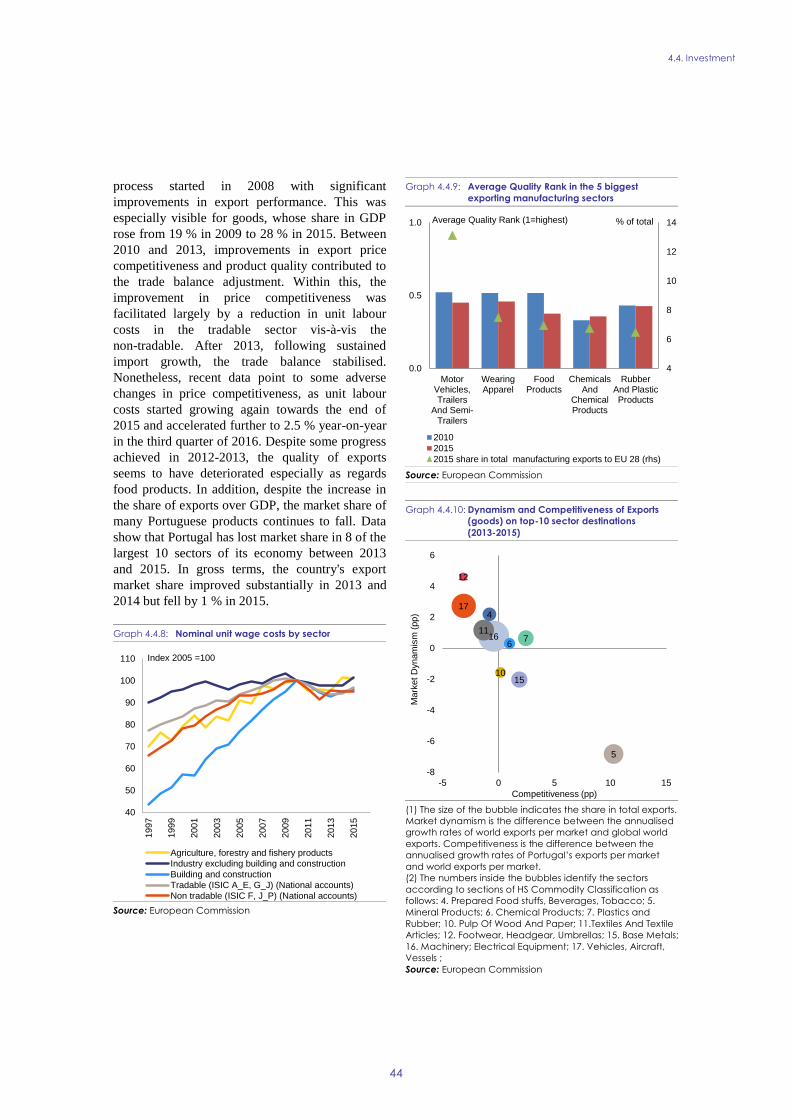
4.4. Investment
44
process started in 2008 with significant
improvements in export performance. This was
especially visible for goods, whose share in GDP
rose from 19 % in 2009 to 28 % in 2015. Between
2010 and 2013, improvements in export price
competitiveness and product quality contributed to
the trade balance adjustment. Within this, the
improvement in price competitiveness was
facilitated largely by a reduction in unit labour
costs in the tradable sector vis-à-vis the
non-tradable. After 2013, following sustained
import growth, the trade balance stabilised.
Nonetheless, recent data point to some adverse
changes in price competitiveness, as unit labour
costs started growing again towards the end of
2015 and accelerated further to 2.5 % year-on-year
in the third quarter of 2016. Despite some progress
achieved in 2012-2013, the quality of exports
seems to have deteriorated especially as regards
food products. In addition, despite the increase in
the share of exports over GDP, the market share of
many Portuguese products continues to fall. Data
show that Portugal has lost market share in 8 of the
largest 10 sectors of its economy between 2013
and 2015. In gross terms, the country's export
market share improved substantially in 2013 and
2014 but fell by 1 % in 2015.
Graph 4.4.8: Nominal unit wage costs by sector
Source: European Commission
Graph 4.4.9: Average Quality Rank in the 5 biggest
exporting manufacturing sectors
Source: European Commission
Graph 4.4.10: Dynamism and Competitiveness of Exports
(goods) on top-10 sector destinations
(2013-2015)
(1) The size of the bubble indicates the share in total exports.
Market dynamism is the difference between the annualised
growth rates of world exports per market and global world
exports. Competitiveness is the difference between the
annualised growth rates of Portugal’s exports per market
and world exports per market.
(2) The numbers inside the bubbles identify the sectors
according to sections of HS Commodity Classification as
follows: 4. Prepared Food stuffs, Beverages, Tobacco; 5.
Mineral Products; 6. Chemical Products; 7. Plastics and
Rubber; 10. Pulp Of Wood And Paper; 11.Textiles And Textile
Articles; 12. Footwear, Headgear, Umbrellas; 15. Base Metals;
16. Machinery; Electrical Equipment; 17. Vehicles, Aircraft,
Vessels ;
Source: European Commission
40
50
60
70
80
90
100
110
1997
1999
2001
2003
2005
2007
2009
2011
2013
2015
Agriculture, forestry and fishery products
Industry excluding building and construction
Building and construction
Tradable (ISIC A_E, G_J) (National accounts)
Non tradable (ISIC F, J_P) (National accounts)
Index 2005 =100
4
6
8
10
12
14
0.0
0.5
1.0
MotorVehicles,Trailers
And Semi-Trailers
WearingApparel
FoodProducts
ChemicalsAnd
ChemicalProducts
RubberAnd PlasticProducts
2010
2015
2015 share in total manufacturing exports to EU 28 (rhs)
% of totalAverage Quality Rank (1=highest)
16
17
11
5
15
7
4
6
10
12
-8
-6
-4
-2
0
2
4
6
-5 0 5 10 15
Mark
et D
ynam
ism
(pp)
Competitiveness (pp)
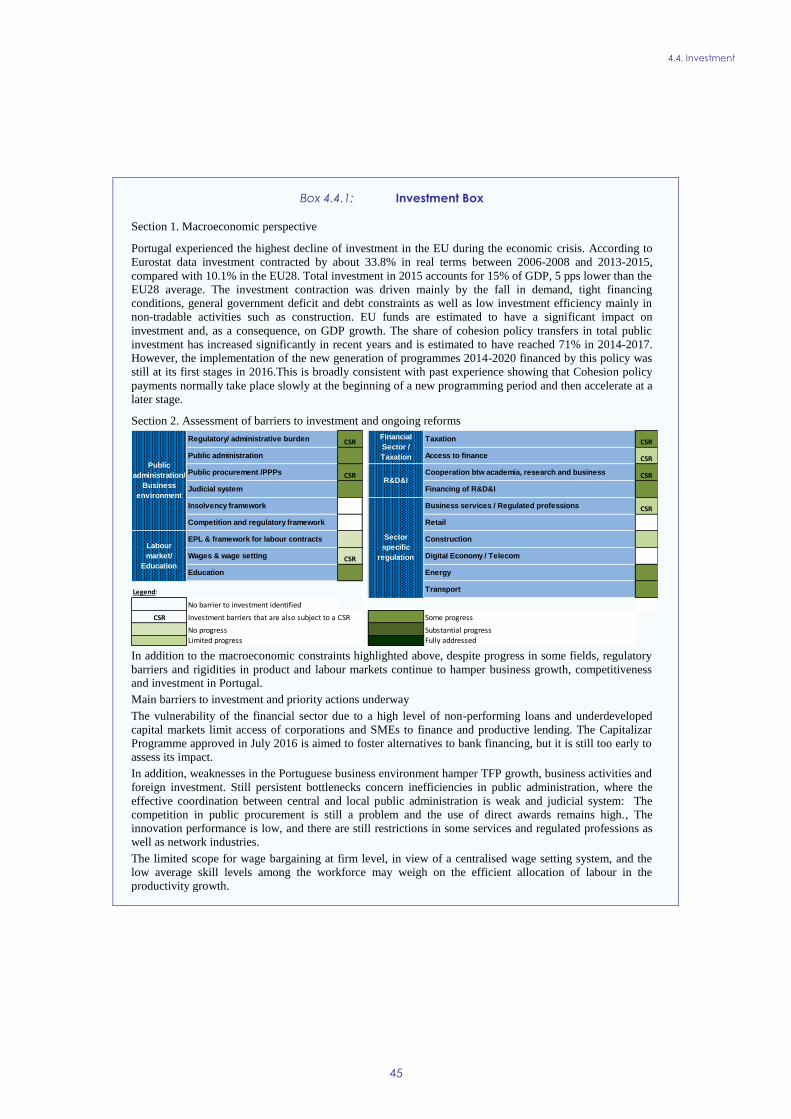
4.4. Investment
45
Box 4.4.1: Investment Box
Section 1. Macroeconomic perspective
Portugal experienced the highest decline of investment in the EU during the economic crisis. According to
Eurostat data investment contracted by about 33.8% in real terms between 2006-2008 and 2013-2015,
compared with 10.1% in the EU28. Total investment in 2015 accounts for 15% of GDP, 5 pps lower than the
EU28 average. The investment contraction was driven mainly by the fall in demand, tight financing
conditions, general government deficit and debt constraints as well as low investment efficiency mainly in
non-tradable activities such as construction. EU funds are estimated to have a significant impact on
investment and, as a consequence, on GDP growth. The share of cohesion policy transfers in total public
investment has increased significantly in recent years and is estimated to have reached 71% in 2014-2017.
However, the implementation of the new generation of programmes 2014-2020 financed by this policy was
still at its first stages in 2016.This is broadly consistent with past experience showing that Cohesion policy
payments normally take place slowly at the beginning of a new programming period and then accelerate at a
later stage.
Section 2. Assessment of barriers to investment and ongoing reforms
In addition to the macroeconomic constraints highlighted above, despite progress in some fields, regulatory
barriers and rigidities in product and labour markets continue to hamper business growth, competitiveness and investment in Portugal.
Main barriers to investment and priority actions underway
The vulnerability of the financial sector due to a high level of non-performing loans and underdeveloped
capital markets limit access of corporations and SMEs to finance and productive lending. The Capitalizar
Programme approved in July 2016 is aimed to foster alternatives to bank financing, but it is still too early to
assess its impact.
In addition, weaknesses in the Portuguese business environment hamper TFP growth, business activities and
foreign investment. Still persistent bottlenecks concern inefficiencies in public administration, where the
effective coordination between central and local public administration is weak and judicial system: The
competition in public procurement is still a problem and the use of direct awards remains high., The
innovation performance is low, and there are still restrictions in some services and regulated professions as
well as network industries.
The limited scope for wage bargaining at firm level, in view of a centralised wage setting system, and the
low average skill levels among the workforce may weigh on the efficient allocation of labour in the
productivity growth.
Regulatory/ administrative burden CSR Taxation CSR
Public administration Access to finance CSR
Public procurement /PPPs CSR Cooperation btw academia, research and business CSR
Judicial system Financing of R&D&I
Insolvency framework Business services / Regulated professions CSR
Competition and regulatory framework Retail
EPL & framework for labour contracts Construction
Wages & wage setting CSR Digital Economy / Telecom
Education Energy
Legend: Transport
No barrier to investment identified
CSR Investment barriers that are also subject to a CSR Some progress
No progress Substantial progress
Limited progress Fully addressed
Public
administration/
Business
environment
Financial
Sector /
Taxation
R&D&I
Sector
specific
regulation
Labour
market/
Education
46
4.5.1. R&D AND INNOVATION*
Despite some progress, the economy does not
make the most of its scientific production and
related human resources. R&D intensity fell
from 1.58 % of GDP in 2009 to 1.28 % in 2015,
diverging further from the EU average of 2.04 %
and the national target. The main reason for the
decline was a contraction of business enterprise
R&D expenditures from 0.75 % of GDP in 2009 to
0.60 % in 2015. Public R&D intensity fell after
2009, but there are signs of recovery (2009:
0.69 %; 2015: 0.66 %). This reduction of R&D
investments adversely affected productivity
growth (32
). Portugal has made much progress in
improving its human resources base in science and
technology and its scientific excellence. The
country produces more science and engineering
graduates and has more researchers in the labour
force than the EU average (Eurostat). Highly cited
scientific publications increased from 7.6 % in
2006 to 9.0 % in 2013 but the country still ranks
only 16th
in the EU. However, Portugal ranks low
(around one fifth of the EU average) on
public-private scientific co-publications and patent
applications. This shows that there are difficulties
in developing technological outputs from R&D
activities. Portugal occupies a very low (24th
)
position as regards the Innovation Output
Indicator, which measures the extent to which
ideas from innovative sectors are able to reach the
market. This constrains the transition towards a
more innovation-driven economy.
There is no integrated strategy for cooperation
between academia and business to deliver the
skills and knowledge needed for innovation. The
governance and finance systems of Portuguese
universities do not provide the most efficient
environment for university-business cooperation
and innovation. Career paths in academia are based
mainly on publications, and cooperation with the
private sector or work within it is seen as a career
gap with no impact on career progress (33
). The
tertiary education attainment rate for
30-34-year-olds has risen substantially over the
past decade. Yet the country ranked only 23rd
within the EU in 2015. The high emigration rate of
(32) During the period 2007-2016 total factor productivity has
declined and then registered a small recovery (AMECO). (33) The State of University-Business Cooperation in Portugal
(2013).
graduates (see Section 4.3) further reduces the
number actually reaching the labour market.
Moreover, many businesses lack absorption
capacity for the highly educated. For the relatively
few firms in knowledge-intensive sectors that do
have the absorption capacity, universities do not
seem to be supplying enough of the skills needed.
The Digital Skills and Jobs coalition addresses the
issue. The country is among the EUs' worst
performers as regards new computer science
graduates among the 25-34-year-olds (Eurostat).
The increasing demand for ICT professionals is
not being met by the current supply (34
). Firms
perceive universities as being too bureaucratic to
invest in. Companies contract only a small amount
of R&D services from other institutional sectors
and R&D spending financed by national business
enterprises is only 35 % of the EU average.
Additionally, firms do not perceive academic
publications as relevant sources of information for
innovation (FCT, 2013). Nor are they inclined to
take on more qualified human resources such as
PhD holders despite the tax incentives in place for
companies employing PhD holders (35
). The new
diploma ‘Fostering Scientific Employment’
(Decree-Law 57/2016) was adopted in 2016 with
the aim of improving researchers' working
conditions and career prospects. This is important
in a context of highly unstable research careers.
In spite of the efforts made, there is still a lack
of structured coordination between the various
incentives for commercialising research
outputs. Portuguese regional clusters encourage
knowledge and technology transfer between
universities and low-medium technology-intensive
manufacturing industries. The Recognition of
Competitiveness Clusters (Decree 2909/2015)
reshaped cluster policy to instigate public-private
collaborative partnerships and networks (OECD,
2016). But value added in high-tech manufacturing
is only 0.57 % of total value added (EU average
1.69 % 2014 Eurostat). The National Innovation
Agency funds R&D programmes that promote
cooperation between universities, firms and R&D
performing organisations. The National Reform
Programme 2016 also includes a set of initiatives
(34) The study "e-skills in Europe-Portugal" estimates a
shortage of 9.600 ICT specialists in 2016, which may
expand to 15.000 by 2020. (35) In 2015 Portugal ranked only 17th in the EU terms of
Researchers (FTE) employed by business as % of total employment.
4.5. SECTORAL POLICIES
4.5. Sectoral policies
47
to foster knowledge transfer and strengthen the
link between R&D and innovation in companies.
The 2016 programme for modernising and
upgrading polytechnic institutes focuses on
matching R&D activities to regional needs. Tax
credits to business R&D (SIFIDE) rose between
2006 and 2014 (OECD R&D Tax Incentives). Yet
there is no regular and consistent monitoring to
assess whether the initiatives are effective.
Framework conditions are not conducive to an
innovation-friendly environment, as barriers to
competitiveness still persist. Portugal is a
"Moderate Innovator" in the European Innovation
Scoreboard but ranks in the top 10 in terms of
SMEs innovating in-house. The government aims
to foster balanced development of the collaborative
economy showing willingness to accommodate
innovative business models in the regulatory
framework. A framework for short-term rental
activities for tourists has been introduced, and
legislation to enable platforms to provide
passenger transport services is being prepared.
Portugal stands out from the EU average in
entrepreneurial activity, especially in enterprise
birth rates and entrepreneurial intention (36
). This
is in line with the remarkable progress in "Starting
a Business" from the World Bank Doing Business
Report 2016. Nevertheless, business survival rates
are below 50 % reflecting unfavourable framework
conditions for business growth, innovation and
scale-up. High-growth innovative enterprises
(HGIEs) represented only 0.07 % of firms in 2014,
half the EU average and the country dropped 8
positions in the 2016 Global Competitiveness
Report. Firms' technological and managerial
capabilities are still holding back competitiveness,
especially in SMEs (European Commission,
2017c). The National Strategy for
Entrepreneurship (Startup Portugal) launched in
2016 aims to improve the business ecosystem,
provide alternative ways of financing, and promote
the internationalisation of start-ups.
4.5.2. COMPETITION IN PRODUCT AND
SERVICES MARKETS*
Administrative and regulatory barriers still
restrict competition in the market for
professional services. The by-laws regulating
(36) "Framework Conditions for HGIEs" (2017)
certain professions are less ambitious than the
framework law in terms of opening up these
sectors to competition. They also raise concerns as
regards the direct or indirect effect of restricting
competition in the market for professional services
thereby increasing prices, reducing offer choice
and innovation and lowering the overall quality of
services. According to a new indicator developed
by the Commission (37
), the level of restrictiveness
in Portugal is higher than the EU average for civil
engineers, architects, accountants, and tourist
guides. It is lower than the EU average for patent
agents and lawyers, although access to the latter
profession is more tightly restricted than for any
other profession in Portugal. Furthermore, the
business churn (or turnover) rate for legal activities
is lower than both the EU average and the overall
Portuguese economy as a whole, thus pointing to
relatively low dynamism and competition in the
sector. However, according to the national action
plan submitted in the context of the mutual
evaluation exercise, Portugal is not planning any
major reforms of regulated professions. At the
same time, there is an ongoing study by the
National Competition Authority, in cooperation
with the OECD, on the nature and impact of
persistent barriers, the results of which are due in
early 2018. The regulatory burden on service
providers remains high; this includes reforms not
covered in the context of the EU-IMF programme
of financial assistance or agreed upon under that
programme and not yet approved or
implemented (38
). In turn, these regulatory barriers
give rise to lengthy, complex, and expensive
administrative procedures put in place to control
compliance with substantive requirements.
Particular problems in business services stem from
restrictive reserved activities, as well as from legal
form, shareholding, management, multidisciplinary
and advertising restrictions. Corporate groups of
professional companies are banned. Innovation and
investment are stifled.
(37) The European Commission has developed a new composite
indicator on the extent to which most existing barriers restrict access to and the practice of regulated professions.
It is based on data collected from Member States,
complemented by desk research. This new indicator has many similarities with the Commission indicator of barriers
in business services published in 2015, but also differs
from it in certain ways. COM (2016) 820. (38) Such as the reform of legal services, university and
construction services.
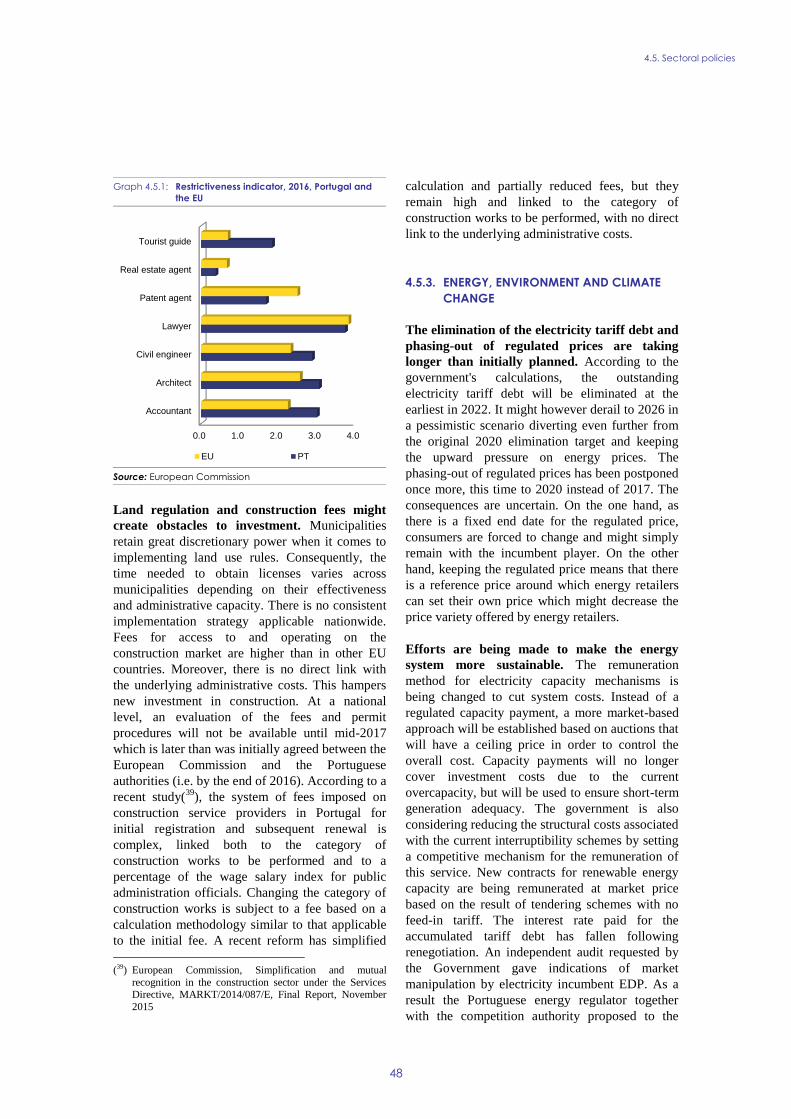
4.5. Sectoral policies
48
Graph 4.5.1: Restrictiveness indicator, 2016, Portugal and
the EU
Source: European Commission
Land regulation and construction fees might
create obstacles to investment. Municipalities
retain great discretionary power when it comes to
implementing land use rules. Consequently, the
time needed to obtain licenses varies across
municipalities depending on their effectiveness
and administrative capacity. There is no consistent
implementation strategy applicable nationwide.
Fees for access to and operating on the
construction market are higher than in other EU
countries. Moreover, there is no direct link with
the underlying administrative costs. This hampers
new investment in construction. At a national
level, an evaluation of the fees and permit
procedures will not be available until mid-2017
which is later than was initially agreed between the
European Commission and the Portuguese
authorities (i.e. by the end of 2016). According to a
recent study(39
), the system of fees imposed on
construction service providers in Portugal for
initial registration and subsequent renewal is
complex, linked both to the category of
construction works to be performed and to a
percentage of the wage salary index for public
administration officials. Changing the category of
construction works is subject to a fee based on a
calculation methodology similar to that applicable
to the initial fee. A recent reform has simplified
(39) European Commission, Simplification and mutual
recognition in the construction sector under the Services Directive, MARKT/2014/087/E, Final Report, November
2015
calculation and partially reduced fees, but they
remain high and linked to the category of
construction works to be performed, with no direct
link to the underlying administrative costs.
4.5.3. ENERGY, ENVIRONMENT AND CLIMATE
CHANGE
The elimination of the electricity tariff debt and
phasing-out of regulated prices are taking
longer than initially planned. According to the
government's calculations, the outstanding
electricity tariff debt will be eliminated at the
earliest in 2022. It might however derail to 2026 in
a pessimistic scenario diverting even further from
the original 2020 elimination target and keeping
the upward pressure on energy prices. The
phasing-out of regulated prices has been postponed
once more, this time to 2020 instead of 2017. The
consequences are uncertain. On the one hand, as
there is a fixed end date for the regulated price,
consumers are forced to change and might simply
remain with the incumbent player. On the other
hand, keeping the regulated price means that there
is a reference price around which energy retailers
can set their own price which might decrease the
price variety offered by energy retailers.
Efforts are being made to make the energy
system more sustainable. The remuneration
method for electricity capacity mechanisms is
being changed to cut system costs. Instead of a
regulated capacity payment, a more market-based
approach will be established based on auctions that
will have a ceiling price in order to control the
overall cost. Capacity payments will no longer
cover investment costs due to the current
overcapacity, but will be used to ensure short-term
generation adequacy. The government is also
considering reducing the structural costs associated
with the current interruptibility schemes by setting
a competitive mechanism for the remuneration of
this service. New contracts for renewable energy
capacity are being remunerated at market price
based on the result of tendering schemes with no
feed-in tariff. The interest rate paid for the
accumulated tariff debt has fallen following
renegotiation. An independent audit requested by
the Government gave indications of market
manipulation by electricity incumbent EDP. As a
result the Portuguese energy regulator together
with the competition authority proposed to the
0.0 1.0 2.0 3.0 4.0
Accountant
Architect
Civil engineer
Lawyer
Patent agent
Real estate agent
Tourist guide
EU PT
4.5. Sectoral policies
49
Government a recuperation of the
overcompensation to guaranteed production of
EDP's hydro-electric power plants. These
measures could help containing energy prices and
improve the functioning of the electricity market.
Nevertheless, they will most likely have a small
impact on the tariff debt reduction. A growing
demand for electricity and decreasing renewable
production cost seem to be the only factors large
enough to front-load the tariff debt elimination
without price increases.
Limited electricity interconnection with the EU
and fossil fuel subsidies remain a barrier to
decrease overcapacity in the energy system. The
Iberian electricity market is well integrated with
price convergence between the two countries as a
result of their market coupling. Electricity
interconnection with the rest of Europe however
remains limited, which poses obstacles to
exporting the overcapacity resulting from growing
renewable production and falling demand. The
transport sector could absorb part of this
production as it currently uses quite a small share
of electricity. The Government is introducing an
open market regulation for an automobile electric
charging network which could be a step in this
direction. Fossil fuels remain the main source of
energy used, which makes it difficult for Portugal
to reduce its energy dependency. The high level of
environmentally harmful subsidies (EHS) in
Portugal also favours fossil-fuel based solutions,
such as company cars and diesel over petrol. In
2016, Portugal had the EU's third largest tax
exemption for diesel compared with petrol and
subsidies to fossil fuels accounted for 0.2 % of
total government expenditure in 2014 (Eurostat).
Fossil fuel subsidies and other EHS hold back the
use of more sustainable energy sources such as
renewables. In doing so, they also stand in the way
of using the existing excess capacity in terms of
electricity production delaying the elimination of
the tariff debt. The measure announced in the 2017
Budget Law intended to increase tax on diesel
while cutting on petrol help reduce EHS. Portugal
is also implementing a Framework for Climate
Policy and a national programme for climate
change for the period 2013-2020.
Waste management impedes more efficient
resource use. Portugal underperforms in terms of
waste management. In 2014 49 % of municipal
waste was landfilled (EU average: 28 %).
Portugal's resource productivity is half the EU
average. The opportunities for waste prevention
and in particular for recycling, that would improve
the resource efficiency and therefor the
competitiveness of the Portuguese economy, are
not fully developed. The waste management tax
also seems to fall short of providing the right
incentives for reducing waste for landfill or
incineration. At the current pace (16 % recycled
and 14 % composted), Portugal would need to
make an extraordinary effort to go from 30 % to
the recycling target of 50 % of municipal waste by
2020.
4.5.4. OTHER NETWORK INDUSTRIES
Performance indicators for Portuguese ports
remain low in international comparison.
Portuguese commercial ports continue to increase
their freight throughput. It totalled 60 million
tonnes of freight in the first three quarters of 2016,
a 5 % increase over the same period in 2015.
Labour productivity increased in 2013 and 2014,
as value added was higher compared to average
personnel costs. This improvement may be a result
of revising the port labour law which aligned it
with the general law. However, Portuguese
commercial ports have not yet managed to exploit
their strategic geographical position to the full.
Their EU share in goods handled is relatively low
even by comparison with ports in neighbouring
countries. Thanks to the 2014 increase port labour
productivity is now higher in Portugal by
comparison with its peers, though it is lagging
behind German and Belgian ports. In international
rankings Portuguese ports are particularly lengthy
in import and export procedures (40
). The quality
of port infrastructure ranks lower than for most of
Portugal's European peers. The elimination of the
port user tax (TUP Carga) did not contribute fully
to reduce port user fees as at least part of the
savings seem to have been absorbed by port
operators. The renegotiation of port concessions
has re-started in the second half of 2016. It could
improve competitiveness and freight throughput if
it genuinely brings down costs for port users not
only for operators. Concession contracts that
provide the correct incentives to maximise
throughput and create capacity to handle a wide
range of cargo sizes may help increase port
(40) Trade by Sea index of the World Bank Doing Business.
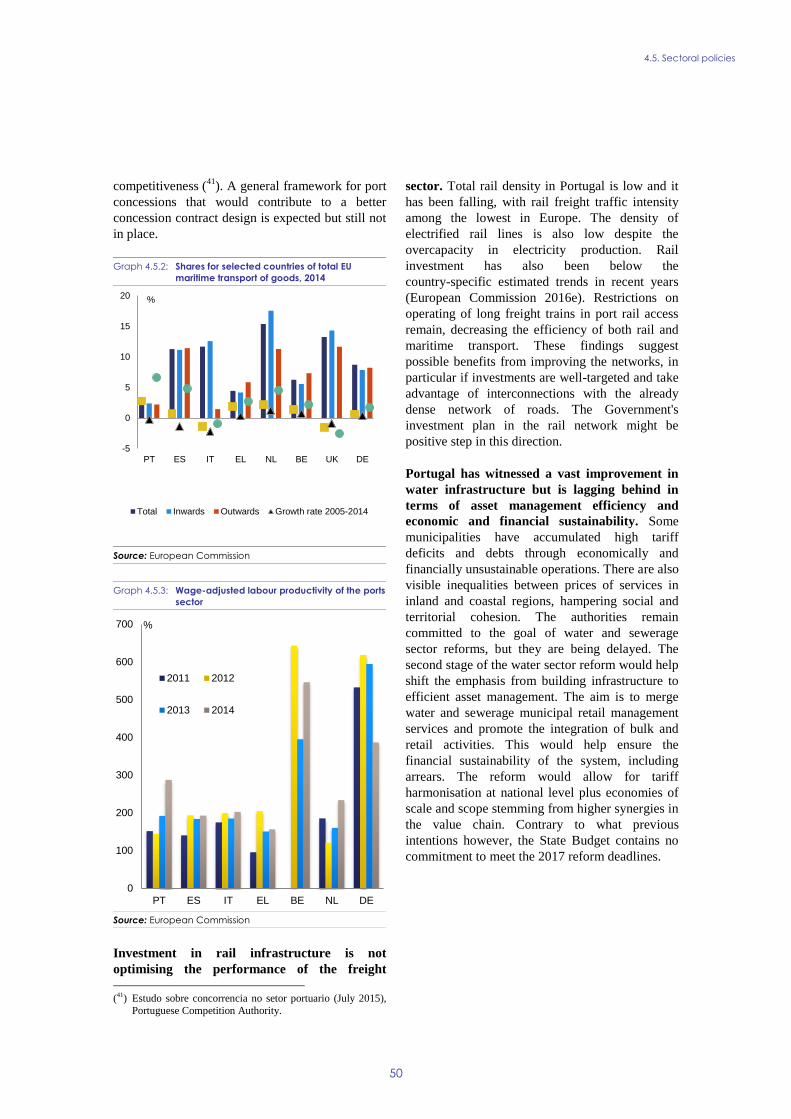
4.5. Sectoral policies
50
competitiveness (41
). A general framework for port
concessions that would contribute to a better
concession contract design is expected but still not
in place.
Graph 4.5.2: Shares for selected countries of total EU
maritime transport of goods, 2014
Source: European Commission
Graph 4.5.3: Wage-adjusted labour productivity of the ports
sector
Source: European Commission
Investment in rail infrastructure is not
optimising the performance of the freight
(41) Estudo sobre concorrencia no setor portuario (July 2015),
Portuguese Competition Authority.
sector. Total rail density in Portugal is low and it
has been falling, with rail freight traffic intensity
among the lowest in Europe. The density of
electrified rail lines is also low despite the
overcapacity in electricity production. Rail
investment has also been below the
country-specific estimated trends in recent years
(European Commission 2016e). Restrictions on
operating of long freight trains in port rail access
remain, decreasing the efficiency of both rail and
maritime transport. These findings suggest
possible benefits from improving the networks, in
particular if investments are well-targeted and take
advantage of interconnections with the already
dense network of roads. The Government's
investment plan in the rail network might be
positive step in this direction.
Portugal has witnessed a vast improvement in
water infrastructure but is lagging behind in
terms of asset management efficiency and
economic and financial sustainability. Some
municipalities have accumulated high tariff
deficits and debts through economically and
financially unsustainable operations. There are also
visible inequalities between prices of services in
inland and coastal regions, hampering social and
territorial cohesion. The authorities remain
committed to the goal of water and sewerage
sector reforms, but they are being delayed. The
second stage of the water sector reform would help
shift the emphasis from building infrastructure to
efficient asset management. The aim is to merge
water and sewerage municipal retail management
services and promote the integration of bulk and
retail activities. This would help ensure the
financial sustainability of the system, including
arrears. The reform would allow for tariff
harmonisation at national level plus economies of
scale and scope stemming from higher synergies in
the value chain. Contrary to what previous
intentions however, the State Budget contains no
commitment to meet the 2017 reform deadlines.
-5
0
5
10
15
20
PT ES IT EL NL BE UK DE
Total Inwards Outwards Growth rate 2005-2014
%
0
100
200
300
400
500
600
700
PT ES IT EL BE NL DE
%
2011 2012
2013 2014
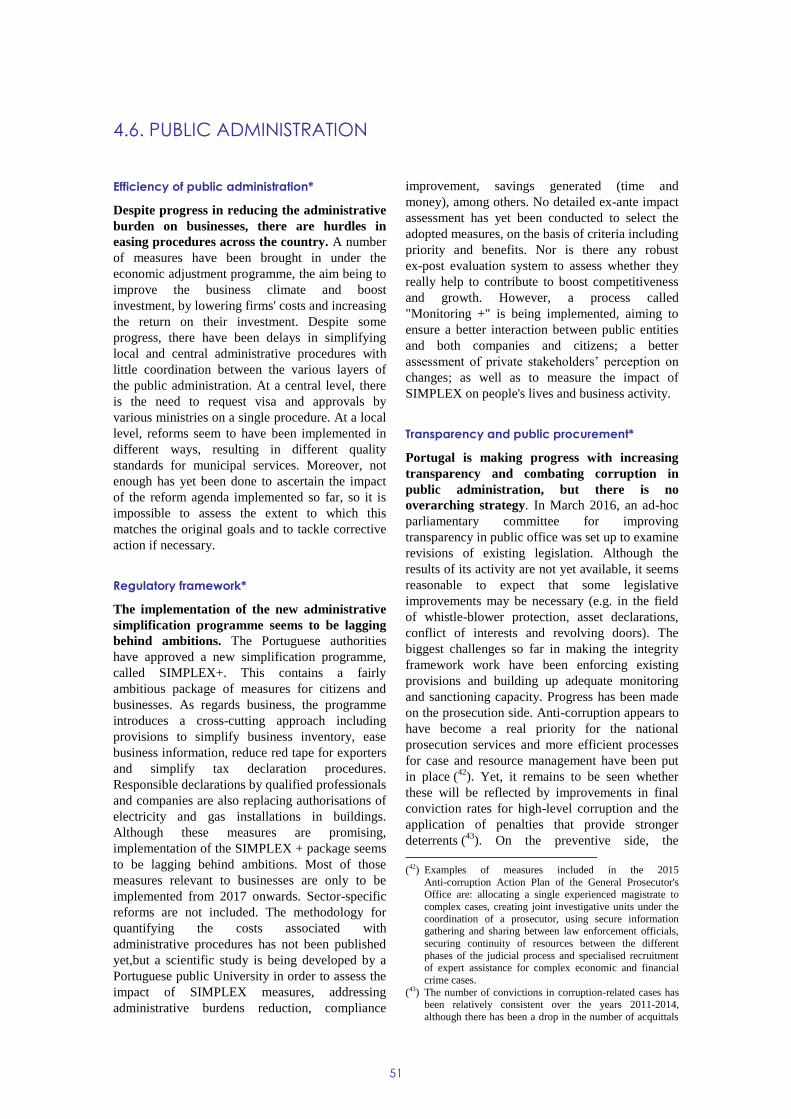
51
Efficiency of public administration*
Despite progress in reducing the administrative
burden on businesses, there are hurdles in
easing procedures across the country. A number
of measures have been brought in under the
economic adjustment programme, the aim being to
improve the business climate and boost
investment, by lowering firms' costs and increasing
the return on their investment. Despite some
progress, there have been delays in simplifying
local and central administrative procedures with
little coordination between the various layers of
the public administration. At a central level, there
is the need to request visa and approvals by
various ministries on a single procedure. At a local
level, reforms seem to have been implemented in
different ways, resulting in different quality
standards for municipal services. Moreover, not
enough has yet been done to ascertain the impact
of the reform agenda implemented so far, so it is
impossible to assess the extent to which this
matches the original goals and to tackle corrective
action if necessary.
Regulatory framework*
The implementation of the new administrative
simplification programme seems to be lagging
behind ambitions. The Portuguese authorities
have approved a new simplification programme,
called SIMPLEX+. This contains a fairly
ambitious package of measures for citizens and
businesses. As regards business, the programme
introduces a cross-cutting approach including
provisions to simplify business inventory, ease
business information, reduce red tape for exporters
and simplify tax declaration procedures.
Responsible declarations by qualified professionals
and companies are also replacing authorisations of
electricity and gas installations in buildings.
Although these measures are promising,
implementation of the SIMPLEX + package seems
to be lagging behind ambitions. Most of those
measures relevant to businesses are only to be
implemented from 2017 onwards. Sector-specific
reforms are not included. The methodology for
quantifying the costs associated with
administrative procedures has not been published
yet,but a scientific study is being developed by a
Portuguese public University in order to assess the
impact of SIMPLEX measures, addressing
administrative burdens reduction, compliance
improvement, savings generated (time and
money), among others. No detailed ex-ante impact
assessment has yet been conducted to select the
adopted measures, on the basis of criteria including
priority and benefits. Nor is there any robust
ex-post evaluation system to assess whether they
really help to contribute to boost competitiveness
and growth. However, a process called
"Monitoring +" is being implemented, aiming to
ensure a better interaction between public entities
and both companies and citizens; a better
assessment of private stakeholders’ perception on
changes; as well as to measure the impact of
SIMPLEX on people's lives and business activity.
Transparency and public procurement*
Portugal is making progress with increasing
transparency and combating corruption in
public administration, but there is no
overarching strategy. In March 2016, an ad-hoc
parliamentary committee for improving
transparency in public office was set up to examine
revisions of existing legislation. Although the
results of its activity are not yet available, it seems
reasonable to expect that some legislative
improvements may be necessary (e.g. in the field
of whistle-blower protection, asset declarations,
conflict of interests and revolving doors). The
biggest challenges so far in making the integrity
framework work have been enforcing existing
provisions and building up adequate monitoring
and sanctioning capacity. Progress has been made
on the prosecution side. Anti-corruption appears to
have become a real priority for the national
prosecution services and more efficient processes
for case and resource management have been put
in place (42
). Yet, it remains to be seen whether
these will be reflected by improvements in final
conviction rates for high-level corruption and the
application of penalties that provide stronger
deterrents (43
). On the preventive side, the
(42) Examples of measures included in the 2015
Anti-corruption Action Plan of the General Prosecutor's Office are: allocating a single experienced magistrate to
complex cases, creating joint investigative units under the
coordination of a prosecutor, using secure information gathering and sharing between law enforcement officials,
securing continuity of resources between the different
phases of the judicial process and specialised recruitment of expert assistance for complex economic and financial
crime cases.
(43) The number of convictions in corruption-related cases has been relatively consistent over the years 2011-2014,
although there has been a drop in the number of acquittals
4.6. PUBLIC ADMINISTRATION
4.6. Public administration
52
corruption prevention plans set up in each public
institution have so far been largely formalistic.
They are not fully adapted to each organisation nor
are they complemented by adequate monitoring.
Transparency and reliability of public
procurement data is improving while the use of
direct awards remains high. The authorities are
making efforts to improve data quality and
reliability in the dedicated online public
procurement platform (BASE). The Institute for
monitoring public procurement (IMPIC) is now
playing a more important role using a more
systematic and automated system to correct data in
BASE. Warnings mechanisms are being
introduced to reduce entry errors and filling
mistakes that, nevertheless, remain significant.
According to the 2015 report on Public
procurement in Portugal, published in November
2016 by IMPIC, e-procurement is well developed
in the country. Nevertheless, the e-procurement
platforms are not yet genuinely interoperable and
the costs for using these platforms appear to be
high for small companies, according to the
Government Computer Systems Administration
(CEGER) which has received a number of
complaints. The authorities have proposed
measures designed to remedy these shortcomings,
within the SIMPLEX + Programme. According to
the 2015 IMPIC report which uses BASE data (44
),
contracting authorities in Portugal often make use
of the direct award procedure. This holds both for
contracts covering goods and services (90.3 %)
and for public works contracts (87.0 %). Portugal
is still in the process of implementing the 2014 EU
Directives on Public Procurement. The relevant
draft legislation includes a number of provisions to
increase the mandatory number of bidders and to
restrict the use of direct award. If effectively set up
as prescribed by the draft legislation, biennial
procurement plans would also be a key tool in
over the same period (from 63 % in 2011 to 30 % in 2014).
The ratio of suspended sentences for corruption-related offences remains high, with 73 % of convictions resulting
in suspended sentences in 2011, 61 % in 2012, 74 % in
2013, and 73 % in 2014. Data available at http://ec.europa.eu/transparency/regexpert/index.cfm?do=g
roupDetail.groupDetailDoc&id=21215&no=2, data from
2014 pending publication.
(44) BASE dataset does not include the totality of awarded
public contracts.
limiting the use of direct awards to exceptional
circumstances.
Ex-ante and ex-post public procurement
controls remain limited. Audit authorities in
Portugal believe that there are deficiencies in the
monitoring and control capacities at the execution
phase of contracts. This applies in particular to
public-private partnerships where contracting
authorities lack the expertise needed to structure,
negotiate and monitor complex contracts. The
mandate of the Ministry of Finance's unit for PPPs
(UTAP) is restricted to public-private partnerships
managed by the central administration. There are
no plans to expand its remit to cover concessions,
regional and local public-private partnerships.
Since April 2016, it has been obligatory for all
local authorities to report all public-private
partnerships and concession contracts to a central
registry set up to map those contracts more
satisfactorily. This exercise is still ongoing. The
Central Purchasing Body (eSPap) has awarded
Framework Agreements that include several
suppliers to increase the transparency and
competition in the public purchase of the
contracting authorities entering into these
agreements. However, in a broader perspective,
Portugal still lacks a comprehensive public
procurement policy covering all layers of the
public administration. To fill this policy gap,
increase openness and avoid collusion in public
tenders, the Portuguese Competition Authority, in
co-operation with eSPap, is making efforts to
disseminate best practices and raise awareness of
public procurement issues within public bodies
However it is doing this in its advocacy capacity
which is non-mandatory.
Judicial system*
The performance of the Portuguese justice
system is still below the EU average. In Portugal
efficiency indicators for civil, commercial and tax
litigation cases remain poor with a negative impact
on business dynamics and attracting foreign direct
investment. The efficiency of the tax and
administrative courts remains challenging in terms
of resolution rate and length of proceedings that
are still long (45
). Weaknesses also remain in the
(45) According to most recent data from the Ministry of Justice,
in 2015, the courts of first instance counted 34 850 new proceedings and, out of them, only 27 810 were completed.
4.6. Public administration
53
enforcement process where claims enforcement
and the capacity to resolving court backlogs are
still below the EU standards (46
). During the
economic adjustment programme, the Portuguese
authorities reformed the corporate insolvency and
restructuring frameworks, resulting in a stronger
focus on firms' recovery rather than their
liquidation by introducing out-of-court insolvency
frameworks (PER and SIREVE). According to the
national statistics from the Ministry of Justice for
Q2-2016, PER proceedings took an average of 4
months and 19 days. The implementation of PER
appears to be in line with the benchmark duration
indicated in the law (a total of 35 procedural days
and 2 or 3 months for negotiations between the
debtor and the creditors). SIREVE frameworks
have raised some doubts about their efficiency. It
still takes up to 40 months to conclude insolvency
court proceedings. To address implementation
shortfalls, the Ministry of Justice published an
initial evaluation of the insolvency tools PER and
SIREVE in May 2016. This also contained a set of
recommendations designed to tackle their
implementation shortfall and inefficiencies. The
availability of judicial statistics remains limited
and they still do not cover tax and administrative
tribunals. The High Council for Tax and
Administrative Courts still produce no statistical
data, which impedes any in-depth analysis of
case-load metrics.
In addition, pending cases amounted to 75 372 at the end of
2015. (46) The proceedings for civil and commercial cases remain
long (lasting on average 17 months) as well as the average
duration of enforcement cases that is still 44 months.
4.6. Public administration
54
Box 4.6.1: Selected highlights
Socially inclusive education: combating school failure in Portugal
Over the past few years, Portugal has set up several successful initiatives to tackle education inequalities,
reduce school failure and raise the average level of basic skills of the population.
A first step was to introduce an "improvement contract" as part of the TEIP programme (Educational
Territories with Priority for Intervention) the third round of the programme launched in 1996, inspired by
the French ZEPs (Priority Intervention Zones). Schools with a large proportion of students at risk of failure,
situated in low-income neighbourhoods, with families living in poor conditions, are entitled to an
“improvement contract” which provides additional funding and support. In addition, these schools are
allowed to recruit their own teachers. They also benefit from special time credits, enabling them to arrange
additional learning activities and more individualised teaching, along with counselling and social support
initiatives. The “More School Success” programme focuses on alternative and innovative classroom
teaching strategies and arrangements. It is an “umbrella” designation introduced in 2009 to provide
institutional support to modelsdeveloped at the regional or local level such as “TurmaMais and “Fenix”.
These projects, which have proven their effectiveness were not initiated by the education authorities but
were developed in schools with the support of education specialists from academia.
The second step was to increase schools’ capacity to draw up policies tailored to local needs which had
often been undermined in the past by a highly centralised education system. Schools' autonomy to design
and implement measures conducive to high-quality learning is already legally established in Portugal.
Introducing autonomy contracts for schools between 2012 and 2015 opened up new opportunities in this
area.
The new National Programme for the Promoting School Success launched in March 2016 was a third step
designed to reinforce schools’ autonomy and expand it to encompass pedagogic programmes with a focus on
teaching and learning issues. The national plan covers local plans drawn-up and implemented by schools
with the support and under the supervision of a national committee of experts. It prioritises prevention with
37% of its measures targeting the 1st stage of basic education (from the first to the fourth year of primary
school) and 35% of those targeting the first year of primary education. Phase 1 of implementation (April
2016) involved training of 160 local trainers working in schools. Phase 2 enabled these local trainers to
support 2 811 headteachers and teachers in developing local plans to tackle school failure, in cooperation
with municipal authorities. Today, 99% of all basic and secondary schools in Portugal have a strategic action
plan in place to promote school success, accounting for 2 936 measures defined by schools and validated by
the programme's committee of experts. In phase 3 which got under way in September 2016 the local plans
will be implemented with the full-time support of 1 294 teachers and involvement of 35 000 teachers
nationwide.
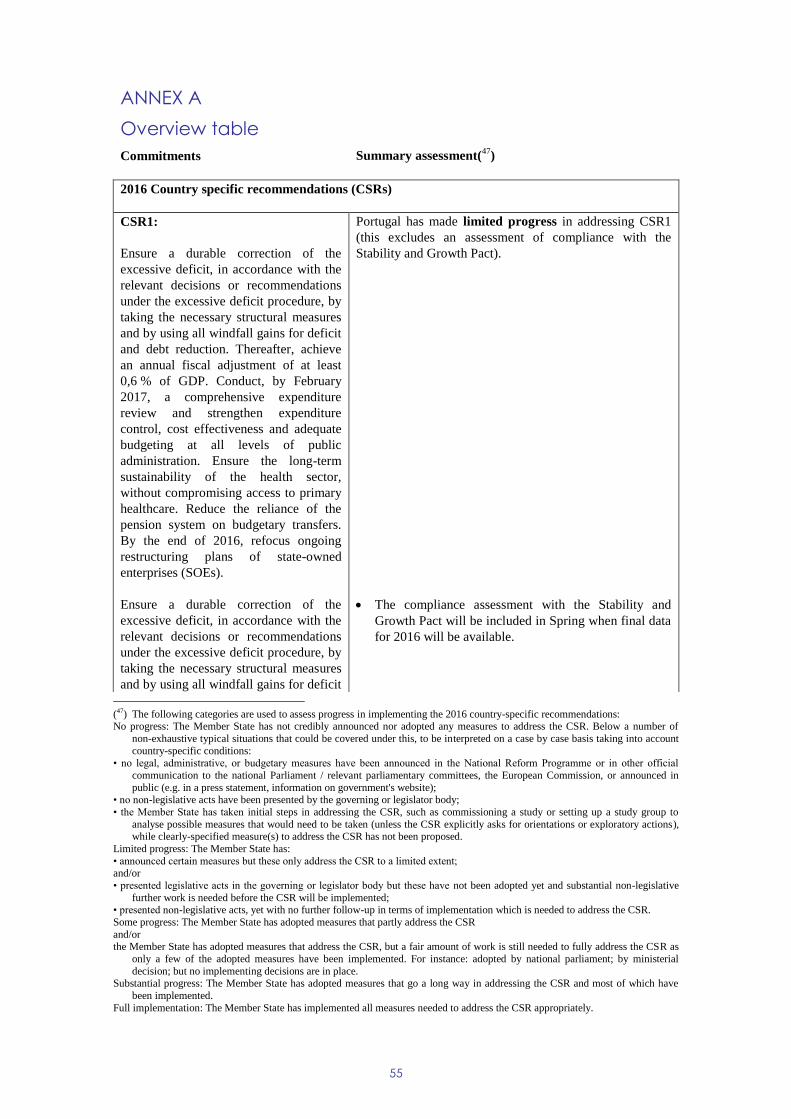
55
2016 Country specific recommendations (CSRs)
CSR1:
Ensure a durable correction of the
excessive deficit, in accordance with the
relevant decisions or recommendations
under the excessive deficit procedure, by
taking the necessary structural measures
and by using all windfall gains for deficit
and debt reduction. Thereafter, achieve
an annual fiscal adjustment of at least
0,6 % of GDP. Conduct, by February
2017, a comprehensive expenditure
review and strengthen expenditure
control, cost effectiveness and adequate
budgeting at all levels of public
administration. Ensure the long-term
sustainability of the health sector,
without compromising access to primary
healthcare. Reduce the reliance of the
pension system on budgetary transfers.
By the end of 2016, refocus ongoing
restructuring plans of state-owned
enterprises (SOEs).
Portugal has made limited progress in addressing CSR1
(this excludes an assessment of compliance with the
Stability and Growth Pact).
Ensure a durable correction of the
excessive deficit, in accordance with the
relevant decisions or recommendations
under the excessive deficit procedure, by
taking the necessary structural measures
and by using all windfall gains for deficit
The compliance assessment with the Stability and
Growth Pact will be included in Spring when final data
for 2016 will be available.
(47) The following categories are used to assess progress in implementing the 2016 country-specific recommendations: No progress: The Member State has not credibly announced nor adopted any measures to address the CSR. Below a number of
non-exhaustive typical situations that could be covered under this, to be interpreted on a case by case basis taking into account
country-specific conditions:
• no legal, administrative, or budgetary measures have been announced in the National Reform Programme or in other official
communication to the national Parliament / relevant parliamentary committees, the European Commission, or announced in
public (e.g. in a press statement, information on government's website); • no non-legislative acts have been presented by the governing or legislator body;
• the Member State has taken initial steps in addressing the CSR, such as commissioning a study or setting up a study group to
analyse possible measures that would need to be taken (unless the CSR explicitly asks for orientations or exploratory actions), while clearly-specified measure(s) to address the CSR has not been proposed.
Limited progress: The Member State has:
• announced certain measures but these only address the CSR to a limited extent; and/or
• presented legislative acts in the governing or legislator body but these have not been adopted yet and substantial non-legislative
further work is needed before the CSR will be implemented; • presented non-legislative acts, yet with no further follow-up in terms of implementation which is needed to address the CSR.
Some progress: The Member State has adopted measures that partly address the CSR
and/or the Member State has adopted measures that address the CSR, but a fair amount of work is still needed to fully address the CSR as
only a few of the adopted measures have been implemented. For instance: adopted by national parliament; by ministerial
decision; but no implementing decisions are in place. Substantial progress: The Member State has adopted measures that go a long way in addressing the CSR and most of which have
been implemented.
Full implementation: The Member State has implemented all measures needed to address the CSR appropriately.
ANNEX A
Overview table
Commitments Summary assessment(47
)
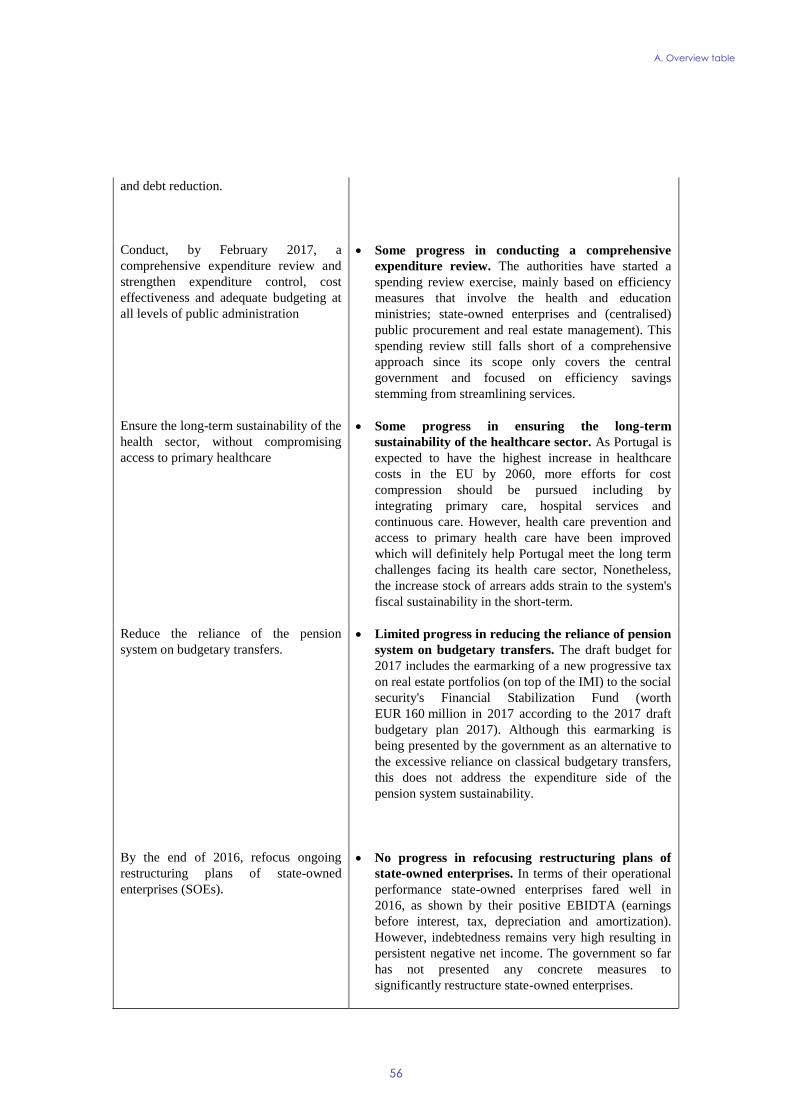
A. Overview table
56
and debt reduction.
Conduct, by February 2017, a
comprehensive expenditure review and
strengthen expenditure control, cost
effectiveness and adequate budgeting at
all levels of public administration
Some progress in conducting a comprehensive
expenditure review. The authorities have started a
spending review exercise, mainly based on efficiency
measures that involve the health and education
ministries; state-owned enterprises and (centralised)
public procurement and real estate management). This
spending review still falls short of a comprehensive
approach since its scope only covers the central
government and focused on efficiency savings
stemming from streamlining services.
Ensure the long-term sustainability of the
health sector, without compromising
access to primary healthcare
Some progress in ensuring the long-term
sustainability of the healthcare sector. As Portugal is
expected to have the highest increase in healthcare
costs in the EU by 2060, more efforts for cost
compression should be pursued including by
integrating primary care, hospital services and
continuous care. However, health care prevention and
access to primary health care have been improved
which will definitely help Portugal meet the long term
challenges facing its health care sector, Nonetheless,
the increase stock of arrears adds strain to the system's
fiscal sustainability in the short-term.
Reduce the reliance of the pension
system on budgetary transfers.
Limited progress in reducing the reliance of pension
system on budgetary transfers. The draft budget for
2017 includes the earmarking of a new progressive tax
on real estate portfolios (on top of the IMI) to the social
security's Financial Stabilization Fund (worth
EUR 160 million in 2017 according to the 2017 draft
budgetary plan 2017). Although this earmarking is
being presented by the government as an alternative to
the excessive reliance on classical budgetary transfers,
this does not address the expenditure side of the
pension system sustainability.
By the end of 2016, refocus ongoing
restructuring plans of state-owned
enterprises (SOEs).
No progress in refocusing restructuring plans of
state-owned enterprises. In terms of their operational
performance state-owned enterprises fared well in
2016, as shown by their positive EBIDTA (earnings
before interest, tax, depreciation and amortization).
However, indebtedness remains very high resulting in
persistent negative net income. The government so far
has not presented any concrete measures to
significantly restructure state-owned enterprises.
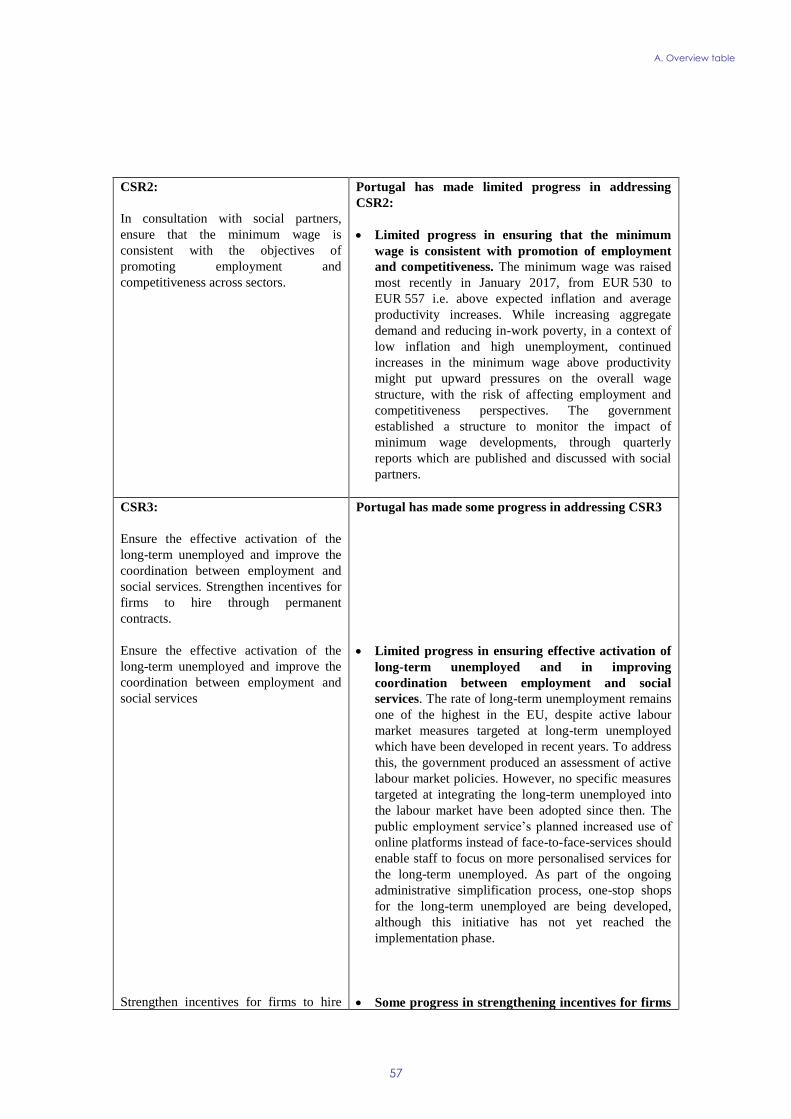
A. Overview table
57
CSR2:
In consultation with social partners,
ensure that the minimum wage is
consistent with the objectives of
promoting employment and
competitiveness across sectors.
Portugal has made limited progress in addressing
CSR2:
Limited progress in ensuring that the minimum
wage is consistent with promotion of employment
and competitiveness. The minimum wage was raised
most recently in January 2017, from EUR 530 to
EUR 557 i.e. above expected inflation and average
productivity increases. While increasing aggregate
demand and reducing in-work poverty, in a context of
low inflation and high unemployment, continued
increases in the minimum wage above productivity
might put upward pressures on the overall wage
structure, with the risk of affecting employment and
competitiveness perspectives. The government
established a structure to monitor the impact of
minimum wage developments, through quarterly
reports which are published and discussed with social
partners.
CSR3:
Ensure the effective activation of the
long-term unemployed and improve the
coordination between employment and
social services. Strengthen incentives for
firms to hire through permanent
contracts.
Portugal has made some progress in addressing CSR3
Ensure the effective activation of the
long-term unemployed and improve the
coordination between employment and
social services
Limited progress in ensuring effective activation of
long-term unemployed and in improving
coordination between employment and social
services. The rate of long-term unemployment remains
one of the highest in the EU, despite active labour
market measures targeted at long-term unemployed
which have been developed in recent years. To address
this, the government produced an assessment of active
labour market policies. However, no specific measures
targeted at integrating the long-term unemployed into
the labour market have been adopted since then. The
public employment service’s planned increased use of
online platforms instead of face-to-face-services should
enable staff to focus on more personalised services for
the long-term unemployed. As part of the ongoing
administrative simplification process, one-stop shops
for the long-term unemployed are being developed,
although this initiative has not yet reached the
implementation phase.
Strengthen incentives for firms to hire Some progress in strengthening incentives for firms
A. Overview table
58
through permanent contracts. to hire through permanent contracts. The
Government redesigned its employment support
programme to promote hiring on open-ended contracts
while restricting the financial support for temporary
contracts to specific cases such as the very long-term
unemployed. However, the expected impact of the new
measure in reducing segmentation is limited in view of
the low number of people to be covered.
CSR4:
Take measures, by October 2016, to
facilitate the cleaning up of the balance
sheets of credit institutions and address
the high level of non-performing loans.
Reduce the debt bias in corporate
taxation and improve the access to
finance for start-ups and small and
medium-sized enterprises via the capital
market.
Portugal has made limited progress in addressing CSR
4
Take measures, by October 2016, to
facilitate the cleaning up of the balance
sheets of credit institutions and address
the high level of non-performing loans
Limited progress in facilitating the clean-up of
credit institutions' balance sheets and addressing
the high level of non-performing loans.
By Resolution of the Council of Ministers N. 42/2016
of 18 August 2016, the government approved the
Capitalizar Programme. Under the programmes's
"corporate restructuring" strand, the government
intends to improve existing mechanisms for
restructuring the balance of viable economic
enterprises and the recovery of credits. The
government is also taking action to revise its
insolvency regime through the following: mechanisms
to control the access to the PER (implementation
period: first quarter of 2017); access of judicial
administrators to the Citius dataset, the IT system to
support the activities of the courts) (fully
implemented); the right of judicial administrators to
directly access the various databases (implementation
planned for the first quarter of 2017); creation of
electronic certificates (expected to be implemented in
the first quarter of 2017); possibility of exemption from
holding a meeting of creditors; changes to the legal
framework to the new registration rules on cross-border
insolvencies and interconnection of registries.
The tax law has been changed to remove disincentives
to write-off. The central bank is conducting additional
supervisory work, including by assessing banks'
capability to manage non-performing loans, The central
bank is also providing guidance to banks on how to
A. Overview table
59
screen different types of non-performing loans, and
how to manage them. They are also considering an
external servicing of loans, although the details have
not been provided as to whether this would entail the
creation of a market of distressed assets. Overall, a
comprehensive strategy appears to be lacking.
Reduce the debt bias in corporate
taxation and
Some progress in reducing the debt bias in
corporate taxation. The 2017 draft budgetary plan
includes broadening the scope of the allowance for
corporate equity (ACE) regime. The regime now
applies to all companies (previously it applied only to
small and medium-sized enterprises) and shareholders
(not only individuals and venture capital investors). In
addition, the allowance has been increased from 5 %
during 4 years to 7 % during 6 years.
improve the access to finance for
start-ups and small and medium-sized
enterprises via the capital market.
Limited progress in improving the access to finance
for start-ups and small and medium-sized
enterprises via the capital market. Under the
Capitalizar Programme, the government has put
forward measures to ease businesses' financing needs.
A new credit line with a mutual guarantee has been
made available and will allow financing to companies
of more than EUR 1 billion in financing for companies.
In parallel, the government has put in place another
programme (Programa Semente) to finance for
start ups and small enterprises in their early stages
(seed capital), helping them to raise equity finance by
offering tax reliefs, for at least two years, to individual
investors who purchase new shares in such companies,
These programmes are expected to improve the
financing of companies in Portugal, provided that they
are swiftly and fully implemented.
CSR5:
Increase transparency and efficiency in
public procurement as regards
public private partnerships and
concessions. By the end of 2016,
improve and accelerate administrative
and licensing procedures, accelerate tax
litigations and reduce regulatory barriers,
especially in business services.
Incentivise cooperation between
universities and the business sector.
Portugal has made some progress in addressing CSR5
Increase transparency and efficiency in
public procurement as regards
public private partnerships and
Some progress in increasing transparency in public
procurement. Transparency and reliability of public
procurement data is improving. The institute for
Monitoring Public Procurement (IMPIC) is moving
A. Overview table
60
concessions from a case by case approach on correcting data in
BASE to a more systematic and automated system.
Access to procurement data by control and prosecution
authorities is not automatic, because of the legal
framework on data protection, which hampers efficient
checks and investigations. By Decree N. 18/2016, the
government has established quarterly monitoring and
reporting procedures related for local and regional
public private partnerships and concessions. The use of
direct awards remains high and there are weaknesses in
the tender procedures due to: (i) insufficient
justification underpinning the recourse to direct
awards; (ii) splitting of contracts; (iii) lack of capacity
and professionalization an (iv) limited checks.
By the end of 2016, improve and
accelerate administrative and licensing
procedures,
Limited progress in improving and accelerating
licensing procedures by the end of 2016. The
SIMPLEX + initiative includes some cross cutting
simplification measures, yet to be implemented, but
progress in enhancing the business environment has
largely stalled in relation to sector specific regulation.
accelerate tax litigations Some progress in accelerating tax litigations by the
end of 2016. The Tax Administration has drawn up a
multiannual plan to combat fraud, improve tax
collection and simplify tax procedures. The 2017 draft
budgetary plan introduced provisions for the tax
authorities to: reduce response time for issuing binding
rulings (Autoridade Tributária) to a maximum of 75
days in all urgent requests, significantly reduce the
deadline for urgent requests; also, assess the possibility
of reducing the costs of urgent binding ruling. Despite
these efforts, the tax courts' clearance rate remains low.
and reduce regulatory barriers, especially
in business services.
Limited progress in reducing regulatory barriers
especially in business services by the end of 2016.
Previous reform efforts targeting the most restrictive
business services, including regulated professions,
were halted and, in some cases, reversed. Restrictions
on corporate groups for professional firms and
restrictive regulation of legal professions (legal form,
shareholding, management, multidisciplinary,
advertising restrictions) set to remain in place.
Incentivise cooperation between
universities and the business sector.
Some progress in incentivising cooperation between
universities and the business sector. New initiatives
announced include the creation of collaborative
laboratories, technological centres for engineering
activities and new business innovation contracts. The
government is currently preparing a revision of the
Higher Education system. The new programme to
modernise and revamp polytechnic institutes focuses
A. Overview table
61
on matching both R&D activities and dual VET
programmes (CTeSPs) with regional needs. The
Innovation Agency (ANI) is working to increase
knowledge and collaborative innovation and has
identified further potential players to bring into the
innovation eco-system (including businesses and
research organizations). It is also pushing for more
collaboration as a priority for further action. However,
there is no overall comprehensive strategy to foster
cooperation between universities and the business
sector: cooperation still relies mostly on isolated
initiatives from specific universities or businesses.
Europe 2020 (national targets and progress)
Employment rate target (20-64 years
old): 75 %
69.1 % (2015). It increased compared to 2014 (67.6 %) but
remains well below the national target for 2020.
R&D target: 3 %
R&D intensity has been declining since 2009. The
situation is particularly worrying for business spending on
R&D, which dropped significantly between 2009 and
2015.
1.28 % (2015)
Greenhouse gas (GHG) emissions target:
-National Greenhouse gas (GHG)
emissions target:
1 % in 2020 compared to 2005 (in
non-ETS sectors)
Portugal’s non-ETS emissions decreased by 24 % between
2005 and 2015. The country has achieved its 2015 target (a
2 % emission reduction) by a 22 pps. gap. According to
the latest national projections based on existing measures,
non-ETS emissions will decrease by 25 % between 2005
and 2020.
The key measures being implemented are the framework
for climate policy (QEPiC - Quadro Estratégico da
Política Climática) and the 2013-2020 national
programme for climate change "Programa Nacional para
as Alterações Climáticas" (PNAC 2020). Portugal is
implementing the 2015 green tax reform that introduced
transport-related fiscal measures for the 2020 horizon,
including carbon tax, higher taxes for vehicles with high
CO2 emission factors and tax incentives (Law 82-D,
2014).
2020 Renewable energy target:
31 %
With a 27.8 % renewable energy share in 2015, Portugal is
above its 2015/2016 interim target of 25.2 % as established
in the Renewable Energy Directive (48
).
(48) Renewable energy shares for 2015 are approximations and not official data, reflecting the available data (04.10.2016). See the
Öko-Institut Report: Study on Technical Assistance in Realisation of the 2016 Report on Renewable Energy, http://ec.europa.eu/energy/en/studies
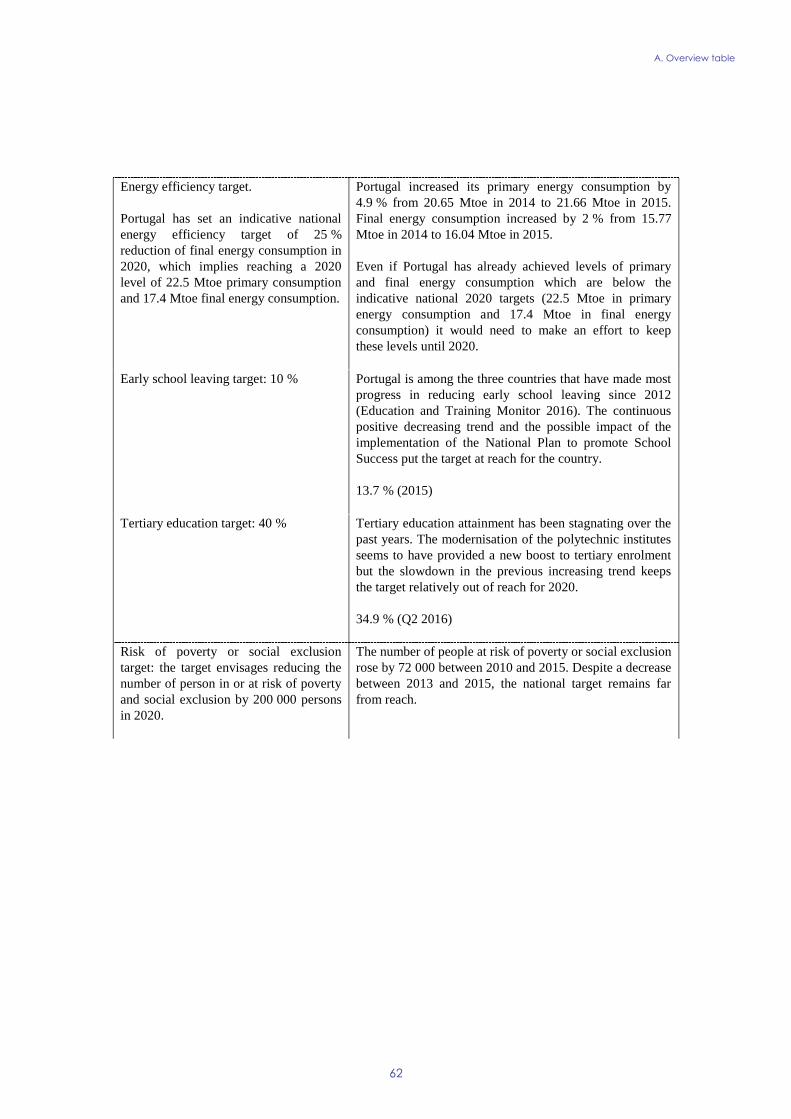
A. Overview table
62
Energy efficiency target.
Portugal has set an indicative national
energy efficiency target of 25 %
reduction of final energy consumption in
2020, which implies reaching a 2020
level of 22.5 Mtoe primary consumption
and 17.4 Mtoe final energy consumption.
Portugal increased its primary energy consumption by
4.9 % from 20.65 Mtoe in 2014 to 21.66 Mtoe in 2015.
Final energy consumption increased by 2 % from 15.77
Mtoe in 2014 to 16.04 Mtoe in 2015.
Even if Portugal has already achieved levels of primary
and final energy consumption which are below the
indicative national 2020 targets (22.5 Mtoe in primary
energy consumption and 17.4 Mtoe in final energy
consumption) it would need to make an effort to keep
these levels until 2020.
Early school leaving target: 10 % Portugal is among the three countries that have made most
progress in reducing early school leaving since 2012
(Education and Training Monitor 2016). The continuous
positive decreasing trend and the possible impact of the
implementation of the National Plan to promote School
Success put the target at reach for the country.
13.7 % (2015)
Tertiary education target: 40 % Tertiary education attainment has been stagnating over the
past years. The modernisation of the polytechnic institutes
seems to have provided a new boost to tertiary enrolment
but the slowdown in the previous increasing trend keeps
the target relatively out of reach for 2020.
34.9 % (Q2 2016)
Risk of poverty or social exclusion
target: the target envisages reducing the
number of person in or at risk of poverty
and social exclusion by 200 000 persons
in 2020.
The number of people at risk of poverty or social exclusion
rose by 72 000 between 2010 and 2015. Despite a decrease
between 2013 and 2015, the national target remains far
from reach.
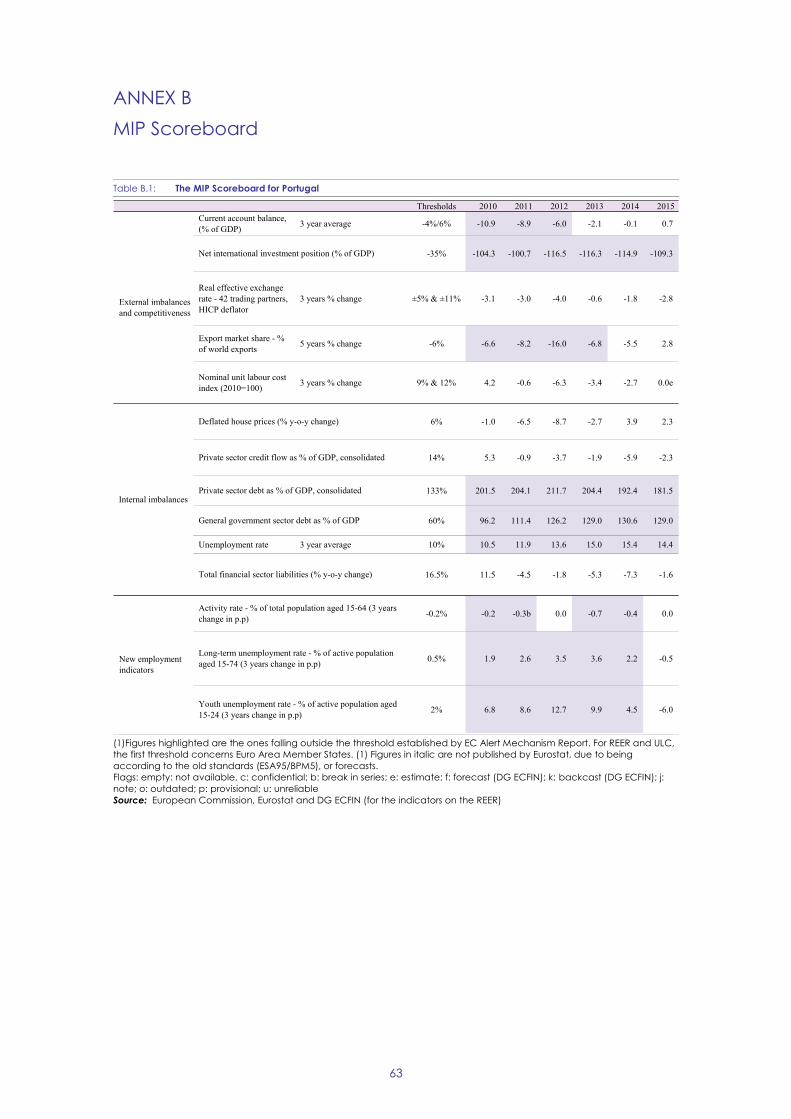
63
ANNEX B
MIP Scoreboard
Table B.1: The MIP Scoreboard for Portugal
(1)Figures highlighted are the ones falling outside the threshold established by EC Alert Mechanism Report. For REER and ULC,
the first threshold concerns Euro Area Member States. (1) Figures in italic are not published by Eurostat, due to being
according to the old standards (ESA95/BPM5), or forecasts.
Flags: empty: not available, c: confidential; b: break in series; e: estimate; f: forecast (DG ECFIN); k: backcast (DG ECFIN); j:
note; o: outdated; p: provisional; u: unreliable
Source: European Commission, Eurostat and DG ECFIN (for the indicators on the REER)
Thresholds 2010 2011 2012 2013 2014 2015
Current account balance,
(% of GDP) 3 year average -4%/6% -10.9 -8.9 -6.0 -2.1 -0.1 0.7
-35% -104.3 -100.7 -116.5 -116.3 -114.9 -109.3
Real effective exchange
rate - 42 trading partners,
HICP deflator
3 years % change ±5% & ±11% -3.1 -3.0 -4.0 -0.6 -1.8 -2.8
Export market share - %
of world exports5 years % change -6% -6.6 -8.2 -16.0 -6.8 -5.5 2.8
Nominal unit labour cost
index (2010=100)3 years % change 9% & 12% 4.2 -0.6 -6.3 -3.4 -2.7 0.0e
6% -1.0 -6.5 -8.7 -2.7 3.9 2.3
14% 5.3 -0.9 -3.7 -1.9 -5.9 -2.3
133% 201.5 204.1 211.7 204.4 192.4 181.5
60% 96.2 111.4 126.2 129.0 130.6 129.0
Unemployment rate 3 year average 10% 10.5 11.9 13.6 15.0 15.4 14.4
16.5% 11.5 -4.5 -1.8 -5.3 -7.3 -1.6
-0.2% -0.2 -0.3b 0.0 -0.7 -0.4 0.0
0.5% 1.9 2.6 3.5 3.6 2.2 -0.5
2% 6.8 8.6 12.7 9.9 4.5 -6.0
Activity rate - % of total population aged 15-64 (3 years
change in p.p)
Long-term unemployment rate - % of active population
aged 15-74 (3 years change in p.p)
Youth unemployment rate - % of active population aged
15-24 (3 years change in p.p)
External imbalances
and competitiveness
New employment
indicators
Net international investment position (% of GDP)
Deflated house prices (% y-o-y change)
Total financial sector liabilities (% y-o-y change)
Private sector credit flow as % of GDP, consolidated
Private sector debt as % of GDP, consolidated
General government sector debt as % of GDP
Internal imbalances
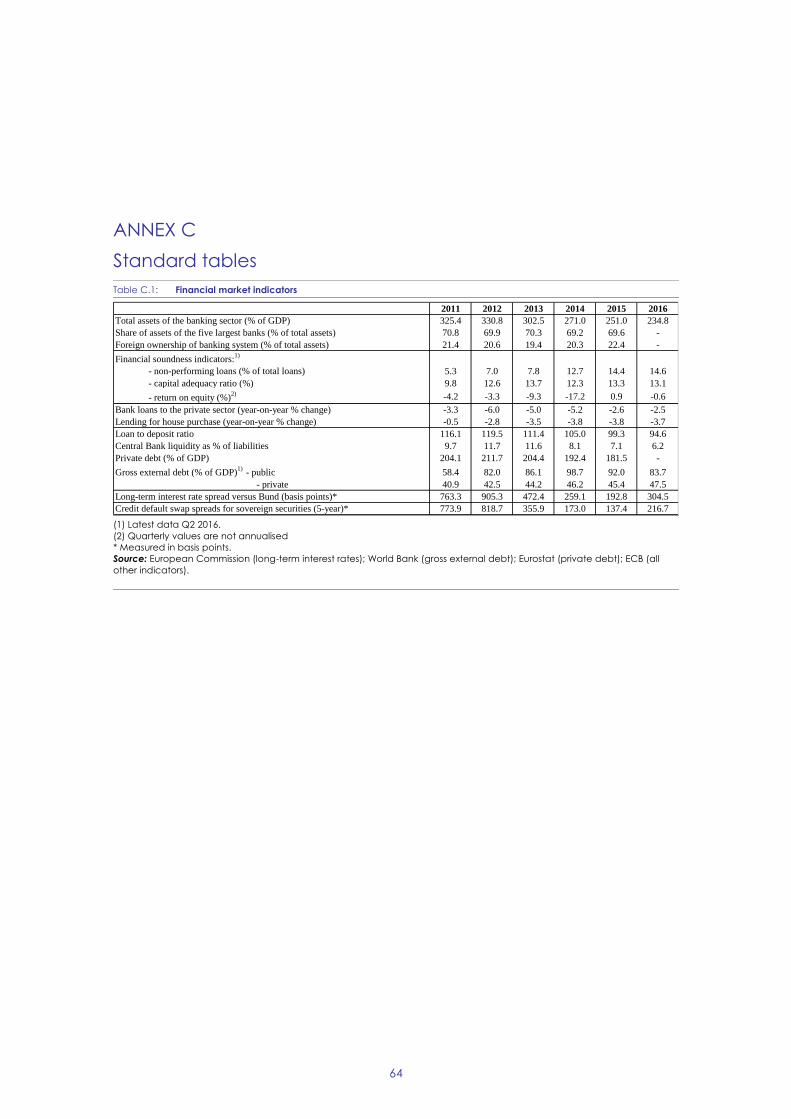
64
ANNEX C
Standard tables
Table C.1: Financial market indicators
(1) Latest data Q2 2016.
(2) Quarterly values are not annualised
* Measured in basis points.
Source: European Commission (long-term interest rates); World Bank (gross external debt); Eurostat (private debt); ECB (all
other indicators).
2011 2012 2013 2014 2015 2016
Total assets of the banking sector (% of GDP) 325.4 330.8 302.5 271.0 251.0 234.8
Share of assets of the five largest banks (% of total assets) 70.8 69.9 70.3 69.2 69.6 -
Foreign ownership of banking system (% of total assets) 21.4 20.6 19.4 20.3 22.4 -
Financial soundness indicators:1)
- non-performing loans (% of total loans) 5.3 7.0 7.8 12.7 14.4 14.6
- capital adequacy ratio (%) 9.8 12.6 13.7 12.3 13.3 13.1
- return on equity (%)2) -4.2 -3.3 -9.3 -17.2 0.9 -0.6
Bank loans to the private sector (year-on-year % change) -3.3 -6.0 -5.0 -5.2 -2.6 -2.5
Lending for house purchase (year-on-year % change) -0.5 -2.8 -3.5 -3.8 -3.8 -3.7
Loan to deposit ratio 116.1 119.5 111.4 105.0 99.3 94.6
Central Bank liquidity as % of liabilities 9.7 11.7 11.6 8.1 7.1 6.2
Private debt (% of GDP) 204.1 211.7 204.4 192.4 181.5 -
Gross external debt (% of GDP)1)
- public 58.4 82.0 86.1 98.7 92.0 83.7
- private 40.9 42.5 44.2 46.2 45.4 47.5
Long-term interest rate spread versus Bund (basis points)* 763.3 905.3 472.4 259.1 192.8 304.5
Credit default swap spreads for sovereign securities (5-year)* 773.9 818.7 355.9 173.0 137.4 216.7
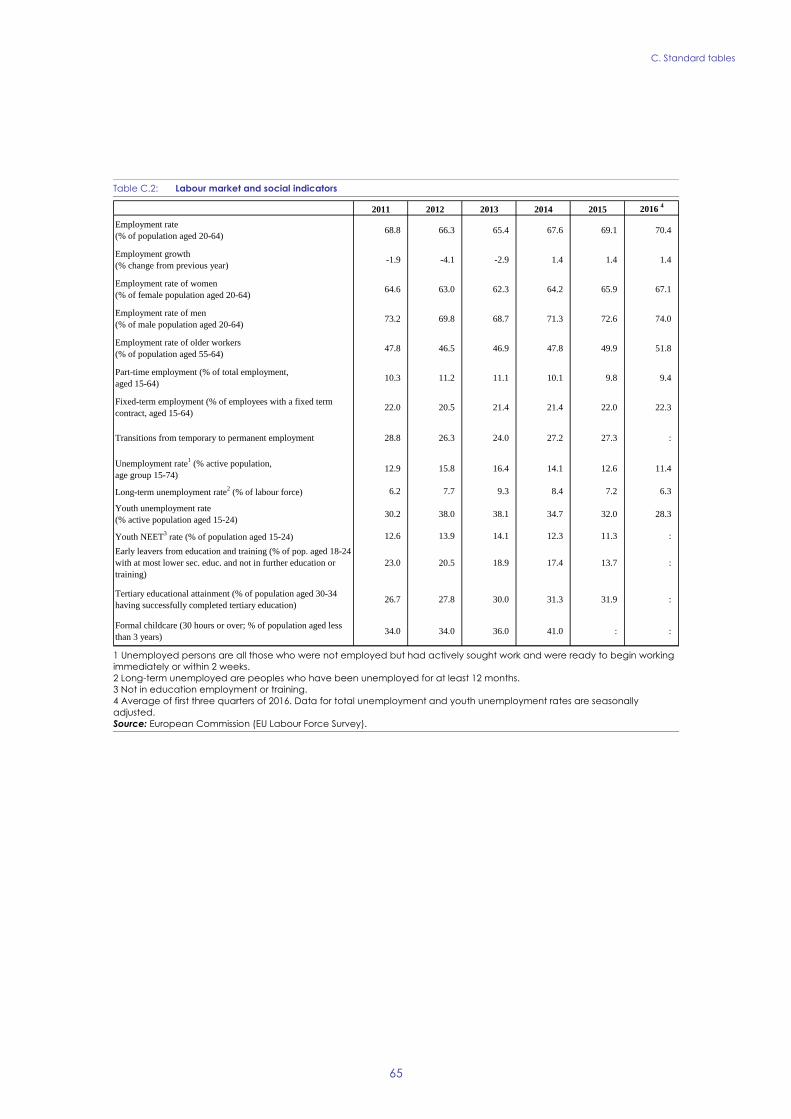
C. Standard tables
65
Table C.2: Labour market and social indicators
1 Unemployed persons are all those who were not employed but had actively sought work and were ready to begin working
immediately or within 2 weeks.
2 Long-term unemployed are peoples who have been unemployed for at least 12 months.
3 Not in education employment or training.
4 Average of first three quarters of 2016. Data for total unemployment and youth unemployment rates are seasonally
adjusted.
Source: European Commission (EU Labour Force Survey).
2011 2012 2013 2014 2015 2016 4
Employment rate
(% of population aged 20-64)68.8 66.3 65.4 67.6 69.1 70.4
Employment growth
(% change from previous year)-1.9 -4.1 -2.9 1.4 1.4 1.4
Employment rate of women
(% of female population aged 20-64)64.6 63.0 62.3 64.2 65.9 67.1
Employment rate of men
(% of male population aged 20-64)73.2 69.8 68.7 71.3 72.6 74.0
Employment rate of older workers
(% of population aged 55-64)47.8 46.5 46.9 47.8 49.9 51.8
Part-time employment (% of total employment,
aged 15-64)10.3 11.2 11.1 10.1 9.8 9.4
Fixed-term employment (% of employees with a fixed term
contract, aged 15-64)22.0 20.5 21.4 21.4 22.0 22.3
Transitions from temporary to permanent employment 28.8 26.3 24.0 27.2 27.3 :
Unemployment rate1 (% active population,
age group 15-74)12.9 15.8 16.4 14.1 12.6 11.4
Long-term unemployment rate2 (% of labour force) 6.2 7.7 9.3 8.4 7.2 6.3
Youth unemployment rate
(% active population aged 15-24)30.2 38.0 38.1 34.7 32.0 28.3
Youth NEET3 rate (% of population aged 15-24) 12.6 13.9 14.1 12.3 11.3 :
Early leavers from education and training (% of pop. aged 18-24
with at most lower sec. educ. and not in further education or
training)
23.0 20.5 18.9 17.4 13.7 :
Tertiary educational attainment (% of population aged 30-34
having successfully completed tertiary education)26.7 27.8 30.0 31.3 31.9 :
Formal childcare (30 hours or over; % of population aged less
than 3 years)34.0 34.0 36.0 41.0 : :
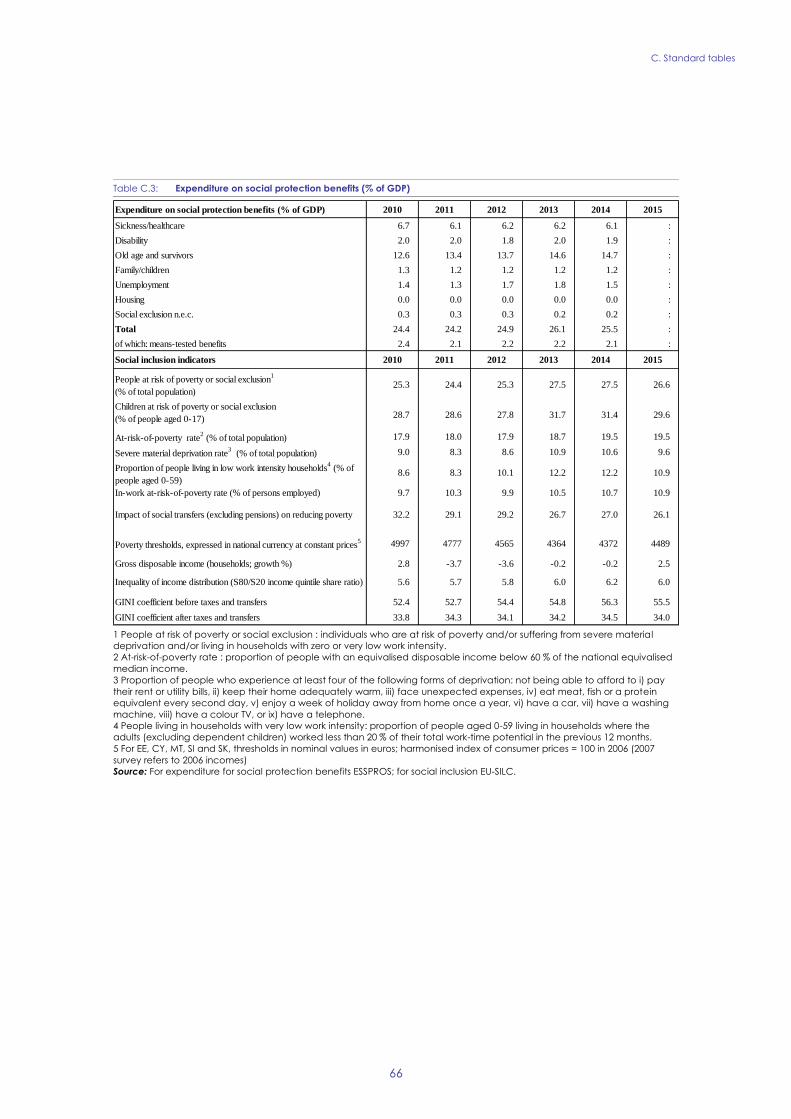
C. Standard tables
66
Table C.3: Expenditure on social protection benefits (% of GDP)
1 People at risk of poverty or social exclusion : individuals who are at risk of poverty and/or suffering from severe material
deprivation and/or living in households with zero or very low work intensity.
2 At-risk-of-poverty rate : proportion of people with an equivalised disposable income below 60 % of the national equivalised
median income.
3 Proportion of people who experience at least four of the following forms of deprivation: not being able to afford to i) pay
their rent or utility bills, ii) keep their home adequately warm, iii) face unexpected expenses, iv) eat meat, fish or a protein
equivalent every second day, v) enjoy a week of holiday away from home once a year, vi) have a car, vii) have a washing
machine, viii) have a colour TV, or ix) have a telephone.
4 People living in households with very low work intensity: proportion of people aged 0-59 living in households where the
adults (excluding dependent children) worked less than 20 % of their total work-time potential in the previous 12 months.
5 For EE, CY, MT, SI and SK, thresholds in nominal values in euros; harmonised index of consumer prices = 100 in 2006 (2007
survey refers to 2006 incomes)
Source: For expenditure for social protection benefits ESSPROS; for social inclusion EU-SILC.
Expenditure on social protection benefits (% of GDP) 2010 2011 2012 2013 2014 2015
Sickness/healthcare 6.7 6.1 6.2 6.2 6.1 :
Disability 2.0 2.0 1.8 2.0 1.9 :
Old age and survivors 12.6 13.4 13.7 14.6 14.7 :
Family/children 1.3 1.2 1.2 1.2 1.2 :
Unemployment 1.4 1.3 1.7 1.8 1.5 :
Housing 0.0 0.0 0.0 0.0 0.0 :
Social exclusion n.e.c. 0.3 0.3 0.3 0.2 0.2 :
Total 24.4 24.2 24.9 26.1 25.5 :
of which: means-tested benefits 2.4 2.1 2.2 2.2 2.1 :
Social inclusion indicators 2010 2011 2012 2013 2014 2015
People at risk of poverty or social exclusion1
(% of total population)25.3 24.4 25.3 27.5 27.5 26.6
Children at risk of poverty or social exclusion
(% of people aged 0-17) 28.7 28.6 27.8 31.7 31.4 29.6
At-risk-of-poverty rate2 (% of total population) 17.9 18.0 17.9 18.7 19.5 19.5
Severe material deprivation rate3 (% of total population) 9.0 8.3 8.6 10.9 10.6 9.6
Proportion of people living in low work intensity households4 (% of
people aged 0-59)8.6 8.3 10.1 12.2 12.2 10.9
In-work at-risk-of-poverty rate (% of persons employed) 9.7 10.3 9.9 10.5 10.7 10.9
Impact of social transfers (excluding pensions) on reducing poverty 32.2 29.1 29.2 26.7 27.0 26.1
Poverty thresholds, expressed in national currency at constant prices5 4997 4777 4565 4364 4372 4489
Gross disposable income (households; growth %) 2.8 -3.7 -3.6 -0.2 -0.2 2.5
Inequality of income distribution (S80/S20 income quintile share ratio) 5.6 5.7 5.8 6.0 6.2 6.0
GINI coefficient before taxes and transfers 52.4 52.7 54.4 54.8 56.3 55.5
GINI coefficient after taxes and transfers 33.8 34.3 34.1 34.2 34.5 34.0
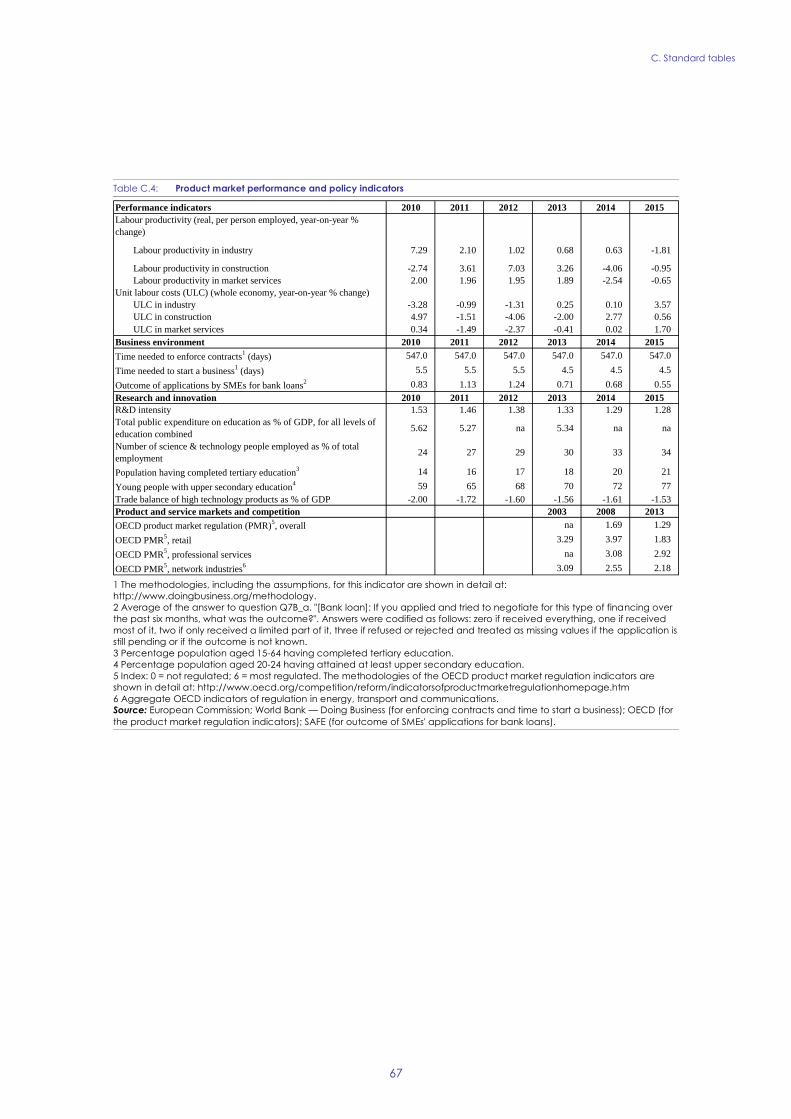
C. Standard tables
67
Table C.4: Product market performance and policy indicators
1 The methodologies, including the assumptions, for this indicator are shown in detail at:
http://www.doingbusiness.org/methodology.
2 Average of the answer to question Q7B_a. "[Bank loan]: If you applied and tried to negotiate for this type of financing over
the past six months, what was the outcome?". Answers were codified as follows: zero if received everything, one if received
most of it, two if only received a limited part of it, three if refused or rejected and treated as missing values if the application is
still pending or if the outcome is not known.
3 Percentage population aged 15-64 having completed tertiary education.
4 Percentage population aged 20-24 having attained at least upper secondary education.
5 Index: 0 = not regulated; 6 = most regulated. The methodologies of the OECD product market regulation indicators are
shown in detail at: http://www.oecd.org/competition/reform/indicatorsofproductmarketregulationhomepage.htm
6 Aggregate OECD indicators of regulation in energy, transport and communications.
Source: European Commission; World Bank — Doing Business (for enforcing contracts and time to start a business); OECD (for
the product market regulation indicators); SAFE (for outcome of SMEs' applications for bank loans).
Performance indicators 2010 2011 2012 2013 2014 2015
Labour productivity (real, per person employed, year-on-year %
change)
Labour productivity in industry 7.29 2.10 1.02 0.68 0.63 -1.81
Labour productivity in construction -2.74 3.61 7.03 3.26 -4.06 -0.95
Labour productivity in market services 2.00 1.96 1.95 1.89 -2.54 -0.65
Unit labour costs (ULC) (whole economy, year-on-year % change)
ULC in industry -3.28 -0.99 -1.31 0.25 0.10 3.57
ULC in construction 4.97 -1.51 -4.06 -2.00 2.77 0.56
ULC in market services 0.34 -1.49 -2.37 -0.41 0.02 1.70
Business environment 2010 2011 2012 2013 2014 2015
Time needed to enforce contracts1 (days) 547.0 547.0 547.0 547.0 547.0 547.0
Time needed to start a business1 (days) 5.5 5.5 5.5 4.5 4.5 4.5
Outcome of applications by SMEs for bank loans2 0.83 1.13 1.24 0.71 0.68 0.55
Research and innovation 2010 2011 2012 2013 2014 2015
R&D intensity 1.53 1.46 1.38 1.33 1.29 1.28
Total public expenditure on education as % of GDP, for all levels of
education combined5.62 5.27 na 5.34 na na
Number of science & technology people employed as % of total
employment24 27 29 30 33 34
Population having completed tertiary education3 14 16 17 18 20 21
Young people with upper secondary education4 59 65 68 70 72 77
Trade balance of high technology products as % of GDP -2.00 -1.72 -1.60 -1.56 -1.61 -1.53
Product and service markets and competition 2003 2008 2013
OECD product market regulation (PMR)5, overall na 1.69 1.29
OECD PMR5, retail 3.29 3.97 1.83
OECD PMR5, professional services na 3.08 2.92
OECD PMR5, network industries
6 3.09 2.55 2.18
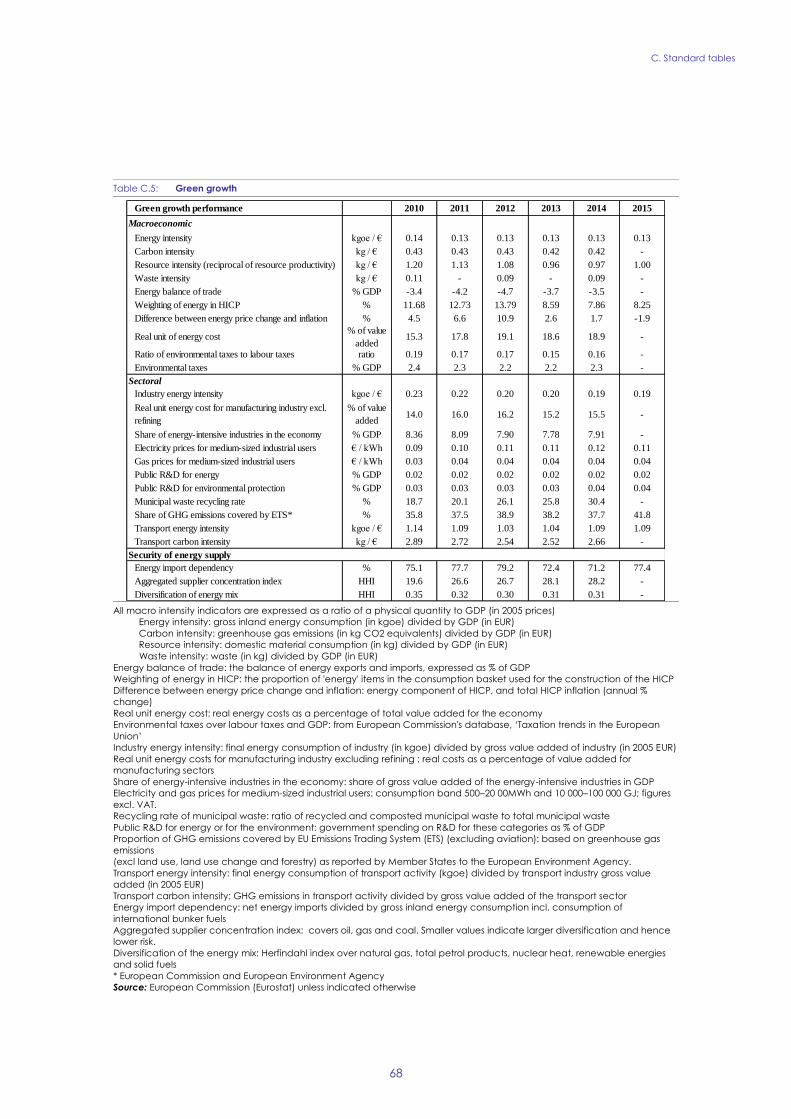
C. Standard tables
68
Table C.5: Green growth
All macro intensity indicators are expressed as a ratio of a physical quantity to GDP (in 2005 prices)
Energy intensity: gross inland energy consumption (in kgoe) divided by GDP (in EUR)
Carbon intensity: greenhouse gas emissions (in kg CO2 equivalents) divided by GDP (in EUR)
Resource intensity: domestic material consumption (in kg) divided by GDP (in EUR)
Waste intensity: waste (in kg) divided by GDP (in EUR)
Energy balance of trade: the balance of energy exports and imports, expressed as % of GDP
Weighting of energy in HICP: the proportion of 'energy' items in the consumption basket used for the construction of the HICP
Difference between energy price change and inflation: energy component of HICP, and total HICP inflation (annual %
change)
Real unit energy cost: real energy costs as a percentage of total value added for the economy
Environmental taxes over labour taxes and GDP: from European Commission's database, ‘Taxation trends in the European
Union’
Industry energy intensity: final energy consumption of industry (in kgoe) divided by gross value added of industry (in 2005 EUR)
Real unit energy costs for manufacturing industry excluding refining : real costs as a percentage of value added for
manufacturing sectors
Share of energy-intensive industries in the economy: share of gross value added of the energy-intensive industries in GDP
Electricity and gas prices for medium-sized industrial users: consumption band 500–20 00MWh and 10 000–100 000 GJ; figures
excl. VAT.
Recycling rate of municipal waste: ratio of recycled and composted municipal waste to total municipal waste
Public R&D for energy or for the environment: government spending on R&D for these categories as % of GDP
Proportion of GHG emissions covered by EU Emissions Trading System (ETS) (excluding aviation): based on greenhouse gas
emissions
(excl land use, land use change and forestry) as reported by Member States to the European Environment Agency.
Transport energy intensity: final energy consumption of transport activity (kgoe) divided by transport industry gross value
added (in 2005 EUR)
Transport carbon intensity: GHG emissions in transport activity divided by gross value added of the transport sector
Energy import dependency: net energy imports divided by gross inland energy consumption incl. consumption of
international bunker fuels
Aggregated supplier concentration index: covers oil, gas and coal. Smaller values indicate larger diversification and hence
lower risk.
Diversification of the energy mix: Herfindahl index over natural gas, total petrol products, nuclear heat, renewable energies
and solid fuels
* European Commission and European Environment Agency
Source: European Commission (Eurostat) unless indicated otherwise
Green growth performance 2010 2011 2012 2013 2014 2015
Macroeconomic
Energy intensity kgoe / € 0.14 0.13 0.13 0.13 0.13 0.13
Carbon intensity kg / € 0.43 0.43 0.43 0.42 0.42 -
Resource intensity (reciprocal of resource productivity) kg / € 1.20 1.13 1.08 0.96 0.97 1.00
Waste intensity kg / € 0.11 - 0.09 - 0.09 -
Energy balance of trade % GDP -3.4 -4.2 -4.7 -3.7 -3.5 -
Weighting of energy in HICP % 11.68 12.73 13.79 8.59 7.86 8.25
Difference between energy price change and inflation % 4.5 6.6 10.9 2.6 1.7 -1.9
Real unit of energy cost% of value
added15.3 17.8 19.1 18.6 18.9 -
Ratio of environmental taxes to labour taxes ratio 0.19 0.17 0.17 0.15 0.16 -
Environmental taxes % GDP 2.4 2.3 2.2 2.2 2.3 -
Sectoral
Industry energy intensity kgoe / € 0.23 0.22 0.20 0.20 0.19 0.19
Real unit energy cost for manufacturing industry excl.
refining
% of value
added14.0 16.0 16.2 15.2 15.5 -
Share of energy-intensive industries in the economy % GDP 8.36 8.09 7.90 7.78 7.91 -
Electricity prices for medium-sized industrial users € / kWh 0.09 0.10 0.11 0.11 0.12 0.11
Gas prices for medium-sized industrial users € / kWh 0.03 0.04 0.04 0.04 0.04 0.04
Public R&D for energy % GDP 0.02 0.02 0.02 0.02 0.02 0.02
Public R&D for environmental protection % GDP 0.03 0.03 0.03 0.03 0.04 0.04
Municipal waste recycling rate % 18.7 20.1 26.1 25.8 30.4 -
Share of GHG emissions covered by ETS* % 35.8 37.5 38.9 38.2 37.7 41.8
Transport energy intensity kgoe / € 1.14 1.09 1.03 1.04 1.09 1.09
Transport carbon intensity kg / € 2.89 2.72 2.54 2.52 2.66 -
Security of energy supply
Energy import dependency % 75.1 77.7 79.2 72.4 71.2 77.4
Aggregated supplier concentration index HHI 19.6 26.6 26.7 28.1 28.2 -
Diversification of energy mix HHI 0.35 0.32 0.30 0.31 0.31 -
69
Arpaia, A. and A. Kiss, (2015), “Analytical Web Note 2/2015 - Benchmarks for the assessment of wage
developments: Spring 2015”, Analytical web note 2/2015, European Commission, Directorate-General
for Employment, Social Affairs and Inclusion. URL:
http://ec.europa.eu/social/BlobServlet?docId=14070&langId=en.
Berkes E, Panizza U. (2012), ''Too Much Finance?'', IMF Working Papers No 161
Canton E., Solera I, (2016), "Greenfield foreign direct investment and structural reforms in Europe: what
factors determine investments?", European Commission, Discussion paper 033. Available at:
http://ec.europa.eu/economy_finance/publications/eedp/pdf/dp033_en.pdf
CASE – Center for Social and Economic Research, Institute for Advances Studies, Study and reports on
the VAT Gap in the EU-28 Member States: 2016 Final report, TAXUD/2015/CC/131, Warsaw, 23
August
Cecchetti, S. G., M. S. Mohanty and F. Zampolli (2011). “The real effects of debt”, BIS Working Papers
No 352; Jean-Louis Arcand J.L.,
ECB (2016), The Household Finance and Consumption Survey, Statistics paper 18, December 2016
Empirica (2014), e-SKILLS in Europe-Country report for Portugal
European Commission (2013 [LMD]), “Labour market developments in Europe 2013”, Directorate-
General for Economic and Financial Affairs, European Economy series, No. 6. URL:
http://ec.europa.eu/economy_finance/publications/european_economy/2013/ee6_en.htm.
European Commission, DG Education and Culture (2013), The State of University-Business Cooperation
in Portugal
European Commission (2015 [ESDE]), “Employment and Social Developments in Europe, 2015”
Directorate-General for Employment, Social Affairs and Inclusion. URL:
http://ec.europa.eu/social/main.jsp?langId=en&catId=89&newsId=2437&furtherNews=yes.
European Commission (2014), Economic adjustment programme for Portugal 2011-2014, Occasional
paper 202. Available at:
http://ec.europa.eu/economy_finance/publications/occasional_paper/2014/pdf/ocp202_en.pdf
European Commission (2015a) Ageing Report 2015.
European Commission (2015b) Fiscal Sustainability Report 2015.
European Commission, (2015c), Rio Country Report – Portugal
European Commission (2015d), Challenges to Member States’ Investment Environments, Staff working
document, available at: http://ec.europa.eu/europe2020/pdf/2016/ags2016_challenges_romania_en.pdf
http://ec.europa.eu/europe2020/pdf/csr2016/cr2016_romania_en.pdf
European Commission (2016), Ex-post evaluation of the economic adjustment programme, Portugal
2011-2014, Institutional paper 040, Available at:
http://ec.europa.eu/economy_finance/publications/eeip/pdf/ip040_en.pdf
European Commission, (2016) Strategic use of public procurement in promoting green, social and
innovation policies: PT country report
REFERENCES
References
70
European Commission (2016), European and investment funds, Country data for Portugal. Available at:
https://cohesiondata.ec.europa.eu/countries/PT
European Commission 2016b. Joint Report on Health Care and Long Term Care Systems and Fiscal
Sustainability – Vol. 2 Country Documents: Health Care Systems, Portugal (2016), prepared by the
Commission (DG ECFIN) and the Economic Policy Committee (Ageing Working Group).
European Commission (2016c), EU Tax Policies: 2016 Scoreboard, Publications Office of the European
Union, Luxembourg.
European Commission (2016d), European Innovation Scoreboard. Available at:
http://ec.europa.eu/growth/industry/innovation/facts-figures/scoreboards_it
European Commission, European Semester thematic factsheet, Anti-corruption, 2016 available at the
following link: https://ec.europa.eu/info/european-semester/thematic-factsheets/public-administration_en.
European Commission (2016a), “Labour Market and Wage Developments in Europe 2016”, Directorate-
General for Employment, Social Affairs and Inclusion, forthcoming.
European Commission (2016b), Education and Training Monitor 2016 — Country Analysis, Portugal,
Publications Office of the European Union, Luxembourg.
European Commission (2016d). Employment and Social Developments in Europe Review 2015,
Publications Office of the European Union, Luxembourg.
European Commission (2016d), Portugal Country Report 2016.
European Commission (2016e), Investment Challenges in Energy, Transport & Digital Markets,
European Economy Institutional Paper 041, November.
European Commission , Taxation Trends in the European Union, 2016 edition, Publications Office of the
European Union, Luxembourg.
European Commission (2017a), Debt Sustainability Monitor 2016
European Commission forthcoming (2017b) Framework Conditions for High Growth Innovative
Enterprises
European Commission, (2017c), Rio Country Report – Portugal
European Commission (2017), Digital Scoreboard 2017
Kiss, A. and A. Vandeplas (2015), “Measuring skills mismatch”, Analytical web note 7/2015, European
Commission, Directorate-General for Employment, Social Affairs and Inclusion. URL:
http://ec.europa.eu/social/main.jsp?catId=738&langId=en&pubId=7860.
National Education Council (2015a), Relatório Técnico, Retenção Escolar nos Ensinos Básico e
Secundário.
National Education Council (2015b), Estado da Educação, 2015 OECD (2012) – Grade Expectations:
How marks and Education Policies Shape Students'Ambitions
OECD (2016), R&D Tax Incentives Indicators

References
71
Portuguese institute for monitoring public procurement (IMPIC) (2016), " Public procurement in Portugal
2015". Available at: http://www.base.gov.pt/Base/pt/Homepage
World Bank (2016). Doing Business 2016: Measuring Regulatory Quality and Efficiency, Washington,
DC: World Bank.
World Economic Forum (2016) , The global competitiveness report 2016-2017, available at:
http://www3.weforum.org/docs/GCR2016-2017/05FullReport/TheGlobalCompetitivenessReport2016-
2017_FINAL.pdf