Embed Size (px)
Citation preview
National Workers Compensation Summit 2015 The integrated Victorian model to workplace injury insurance Clare Amies 25 February 2015
Coverage
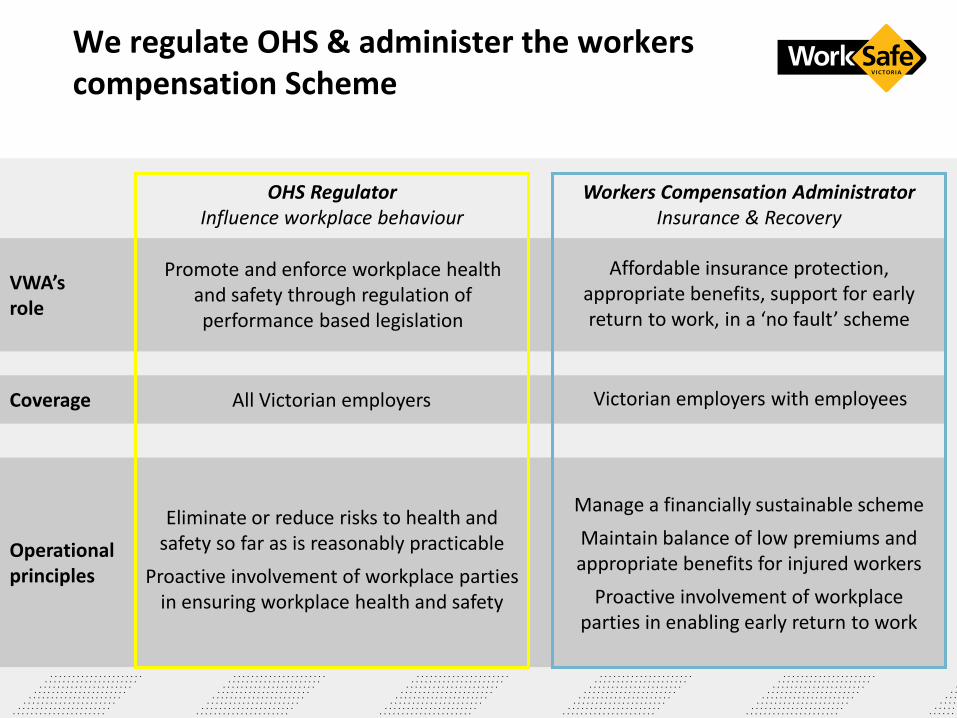
We regulate OHS & administer the workers compensation Scheme
VWA’s role
Promote and enforce workplace health and safety through regulation of performance based legislation
Affordable insurance protection, appropriate benefits, support for early return to work, in a ‘no fault’ scheme
Operational principles
Eliminate or reduce risks to health and safety so far as is reasonably practicable
Proactive involvement of workplace parties in ensuring workplace health and safety
Manage a financially sustainable scheme
Maintain balance of low premiums and appropriate benefits for injured workers
Proactive involvement of workplace parties in enabling early return to work
OHS Regulator Influence workplace behaviour
Workers Compensation Administrator Insurance & Recovery
All Victorian employers Victorian employers with employees
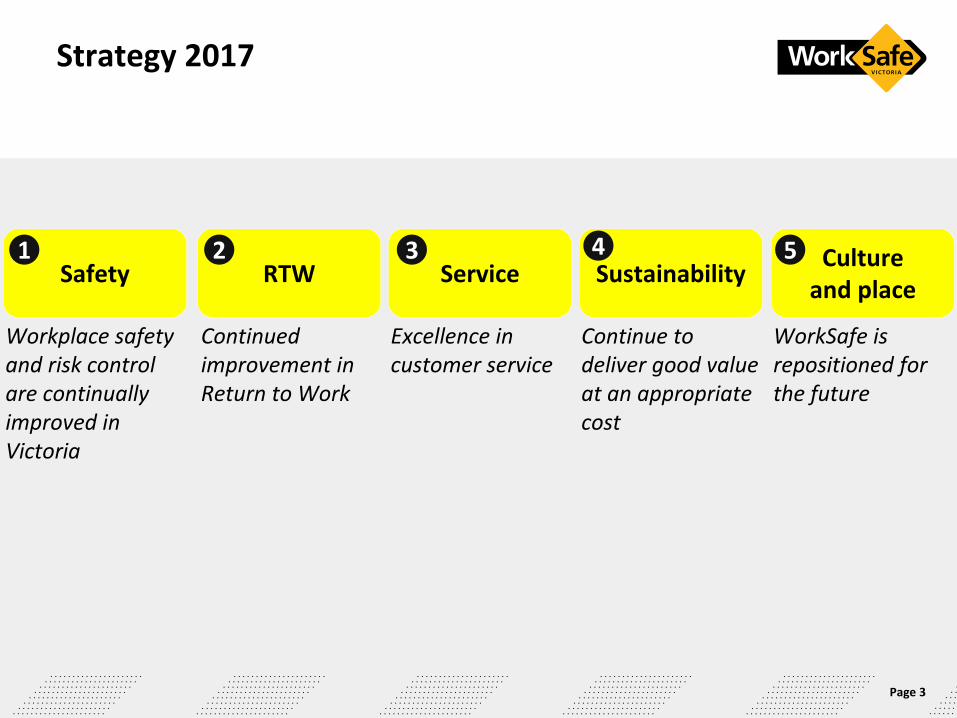
Strategy 2017
Page 3
Safety RTW Service Sustainability Culture
and place
1 2 3 4 5
Workplace safety and risk control are continually improved in Victoria
Continued improvement in Return to Work
Excellence in customer service
Continue to deliver good value at an appropriate cost
WorkSafe is repositioned for the future
Page 4
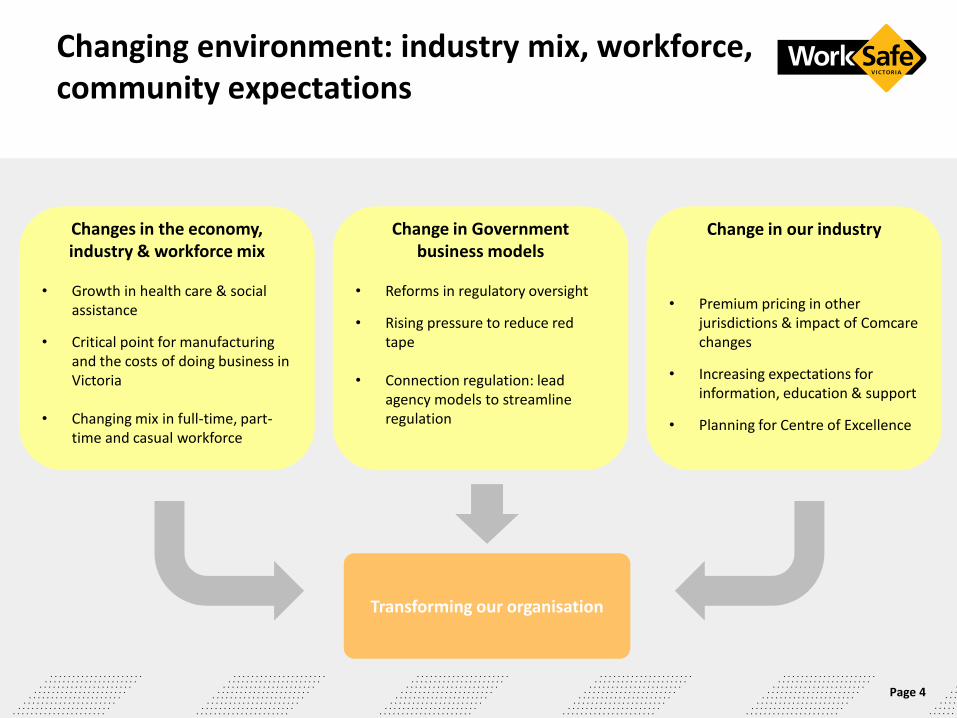
• Growth in health care & social assistance
• Critical point for manufacturing and the costs of doing business in Victoria
• Changing mix in full-time, part-time and casual workforce
• Reforms in regulatory oversight
• Rising pressure to reduce red tape
• Connection regulation: lead agency models to streamline regulation
• Premium pricing in other jurisdictions & impact of Comcare changes
• Increasing expectations for information, education & support
• Planning for Centre of Excellence
Changes in the economy, industry & workforce mix
Change in Government business models
Change in our industry
Transforming our organisation
Changing environment: industry mix, workforce, community expectations
Growing community risk
Casualisation
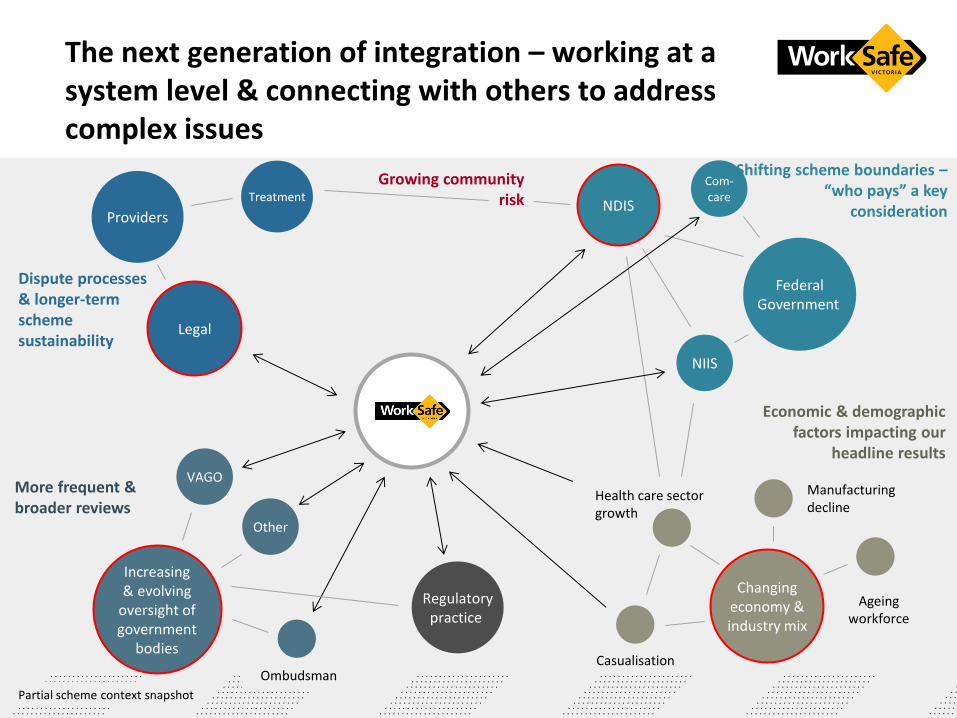
The next generation of integration – working at a system level & connecting with others to address complex issues
Providers
Increasing & evolving
oversight of government
bodies
Federal Government
Changing economy & industry mix
NDIS
NIIS
Treatment
Legal
VAGO Manufacturing decline
Health care sector growth
Ombudsman
Shifting scheme boundaries – “who pays” a key
consideration
Dispute processes & longer-term scheme sustainability
More frequent & broader reviews
Economic & demographic factors impacting our
headline results
Partial scheme context snapshot
Com- care
Other
Ageing workforce
Regulatory practice
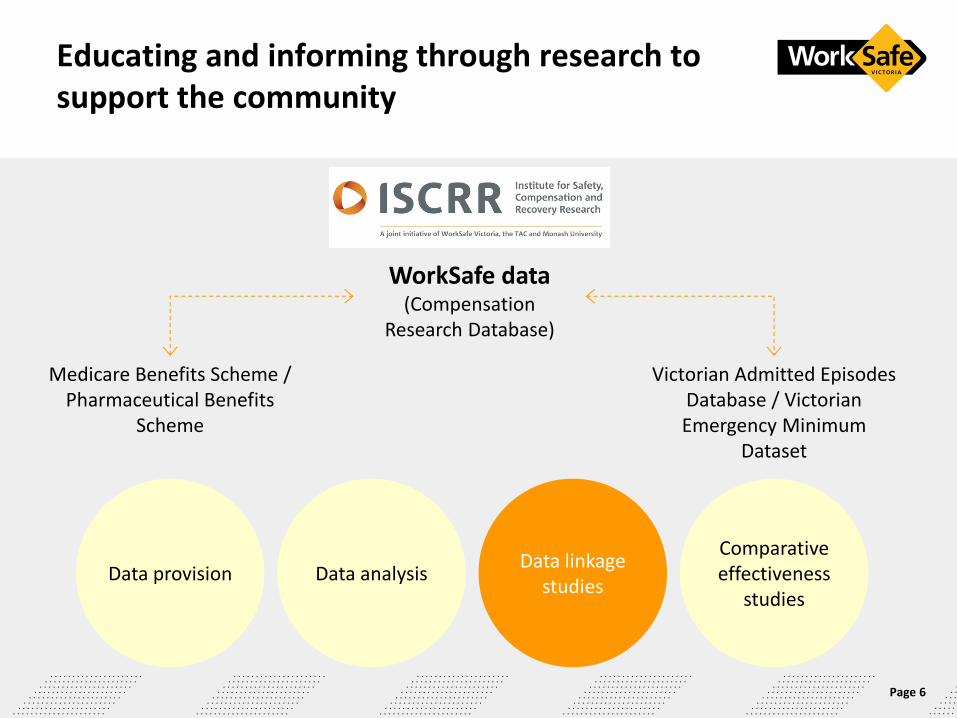
Educating and informing through research to support the community
Page 6
Data provision Data analysis Data linkage
studies
Comparative effectiveness
studies
WorkSafe data (Compensation
Research Database)
Medicare Benefits Scheme / Pharmaceutical Benefits
Scheme
Victorian Admitted Episodes Database / Victorian Emergency Minimum
Dataset
83.3 83.9 83.8
87.1
13
/14
16
/17
tar
get
13
/14
ta
rge
t
12
/13
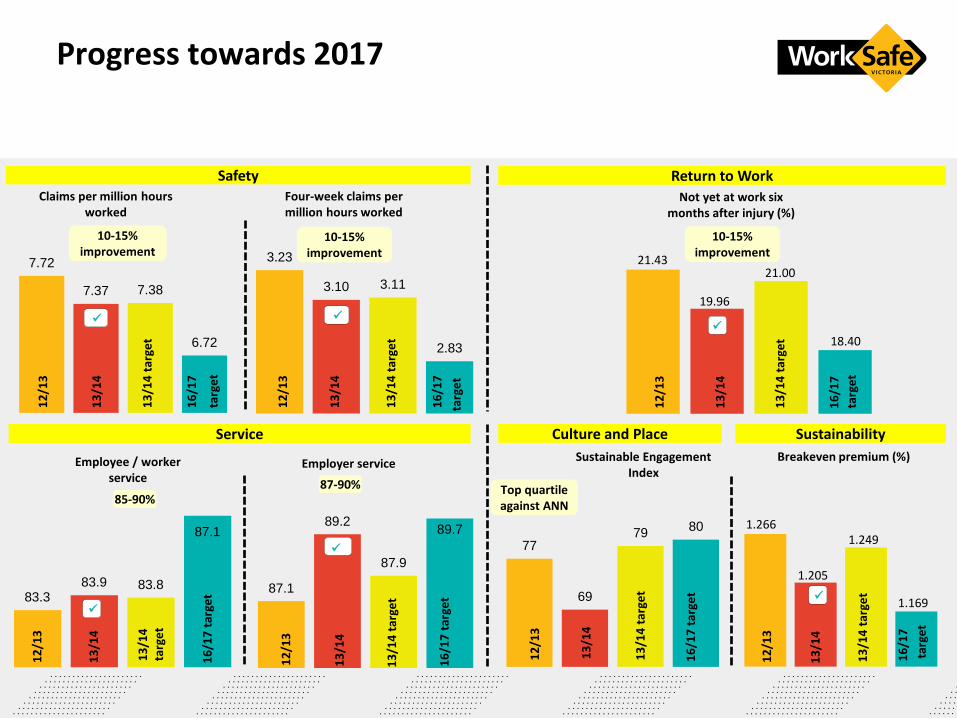
Progress towards 2017
Safety Return to Work
Service
Claims per million hours worked
Four-week claims per million hours worked
Not yet at work six months after injury (%)
Employee / worker service
Employer service
Culture and Place Sustainability
Breakeven premium (%)
12
/13
13
/14
13
/14
tar
get
targ
et
7.72
7.37 7.38
6.72
12
/13
13
/14
13
/14
tar
get
16
/17
targ
et
3.23
3.10 3.11
2.83
12
/13
13
/14
13
/14
tar
get
16
/17
targ
et
87.1
89.2
87.9
89.7
12
/13
13
/14
13
/14
tar
get
16
/17
tar
get
12
/13
13
/14
16
/17
targ
et
13
/14
tar
get
1.266
1.205
1.169
1.249
21.43
19.96
21.00
18.40
85-90% 87-90%
10-15% improvement
Sustainable Engagement Index
77
69
79 80
12
/13
13
/14
13
/14
tar
get
16
/17
tar
get
Top quartile against ANN
10-15% improvement
10-15% improvement
16
/17
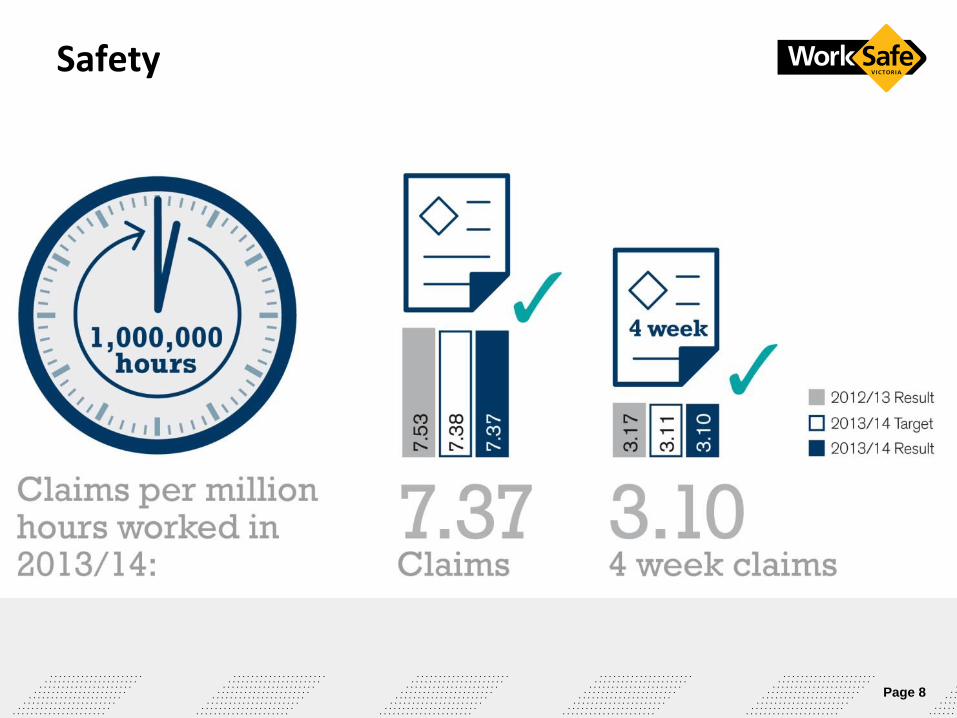
Safety
Graphic with standard and 4 week claims
Page 8
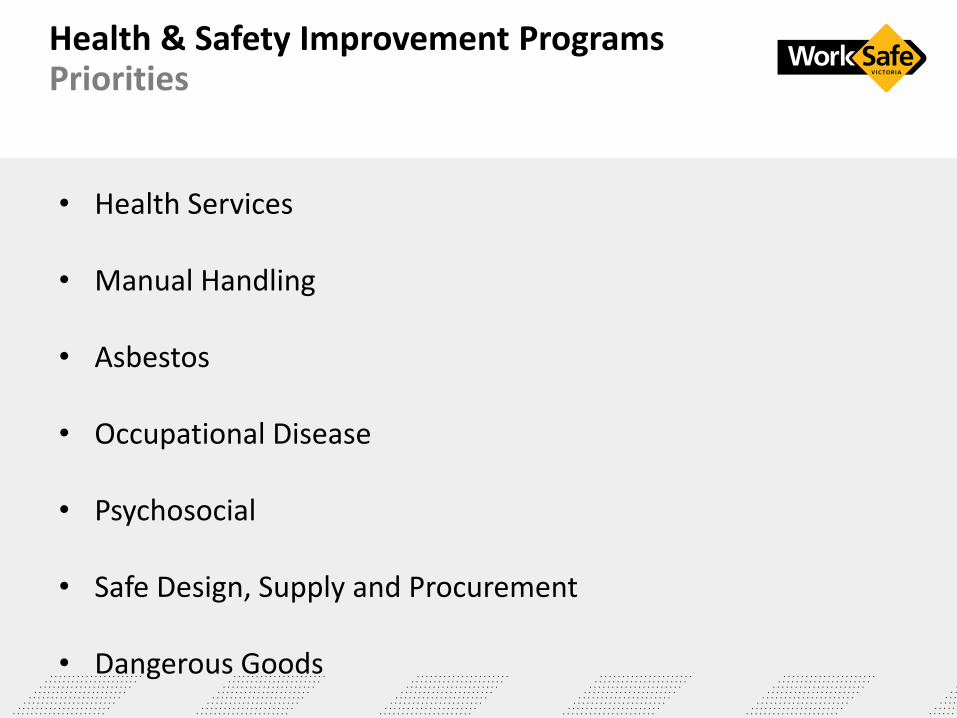
Health & Safety Improvement Programs Priorities
• Health Services
• Manual Handling
• Asbestos
• Occupational Disease
• Psychosocial
• Safe Design, Supply and Procurement
• Dangerous Goods
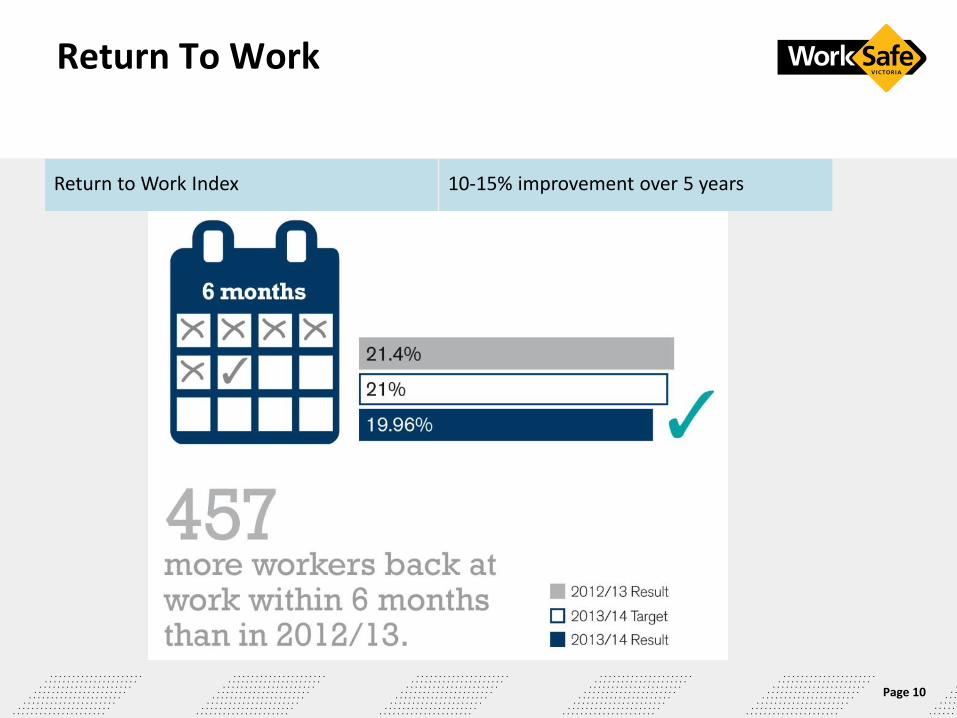
Return To Work
Page 10
Return to Work Index 10-15% improvement over 5 years
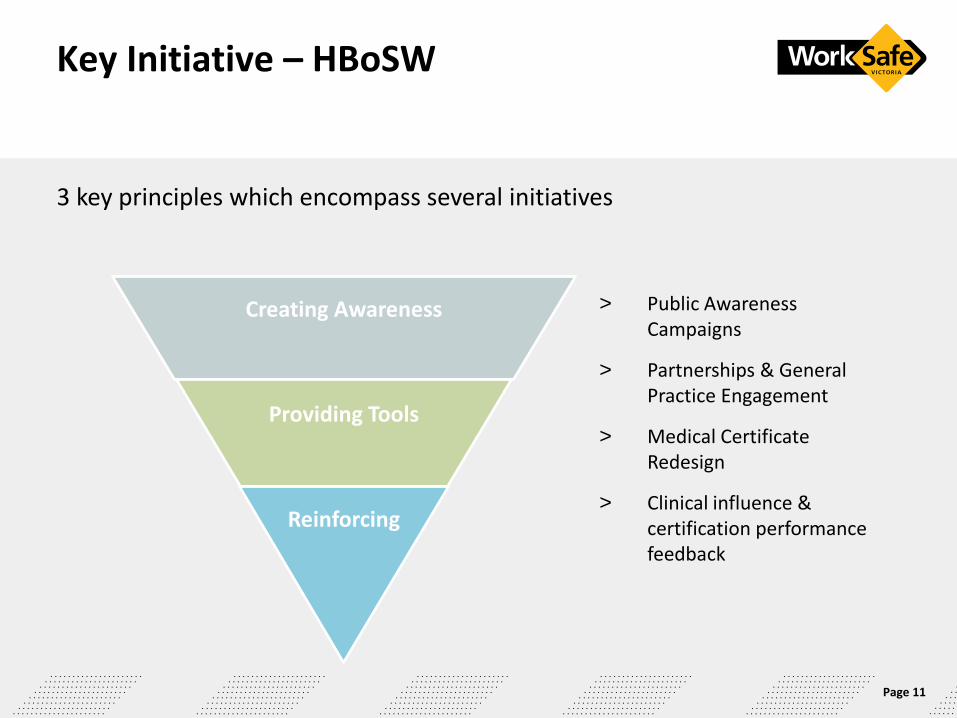
Key Initiative – HBoSW
Page 11
Creating Awareness
Providing Tools
Reinforcing
3 key principles which encompass several initiatives
> Public Awareness Campaigns
> Partnerships & General Practice Engagement
> Medical Certificate Redesign
> Clinical influence & certification performance feedback
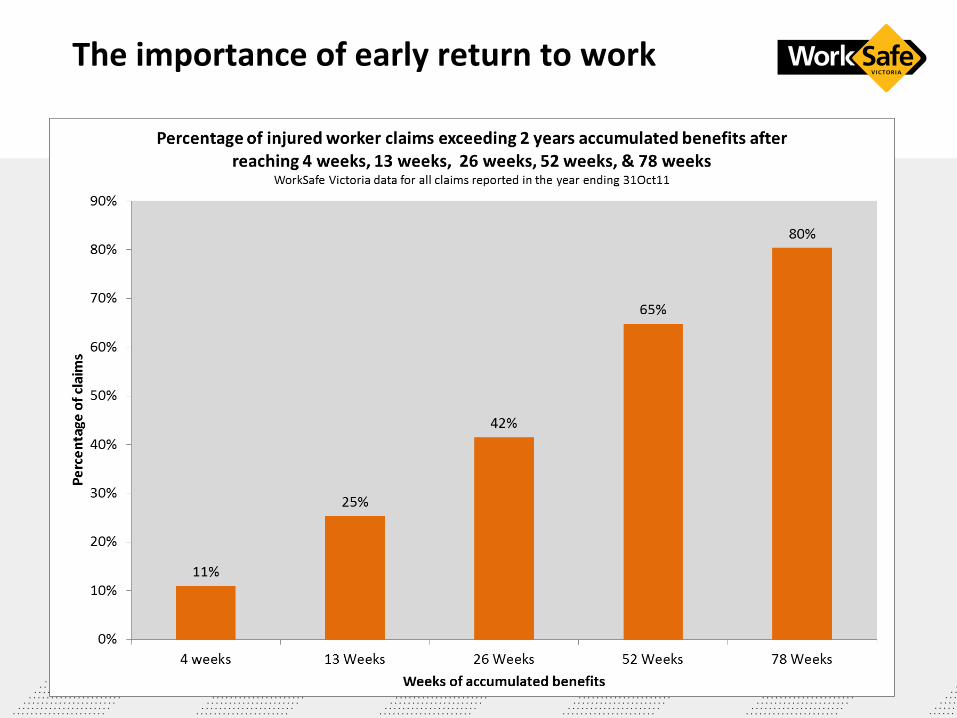
The importance of early return to work
Key Initiative – Better@Work
Page 13
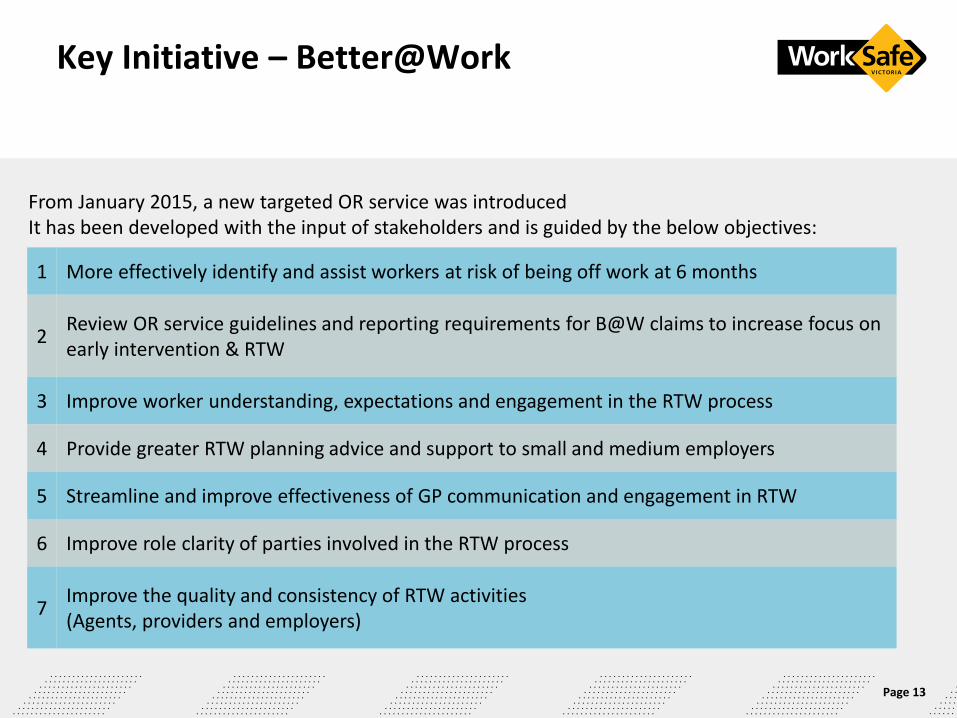
1 More effectively identify and assist workers at risk of being off work at 6 months
2 Review OR service guidelines and reporting requirements for B@W claims to increase focus on early intervention & RTW
3 Improve worker understanding, expectations and engagement in the RTW process
4 Provide greater RTW planning advice and support to small and medium employers
5 Streamline and improve effectiveness of GP communication and engagement in RTW
6 Improve role clarity of parties involved in the RTW process
7 Improve the quality and consistency of RTW activities (Agents, providers and employers)
From January 2015, a new targeted OR service was introduced It has been developed with the input of stakeholders and is guided by the below objectives:
RTW challenges
Page 14
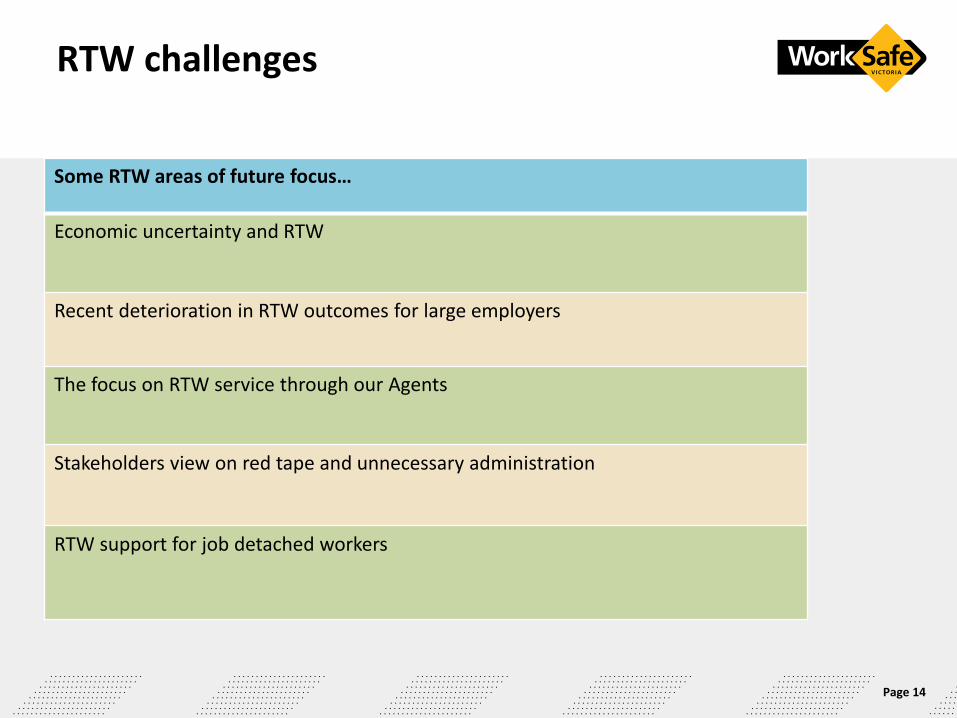
Some RTW areas of future focus…
Economic uncertainty and RTW
Recent deterioration in RTW outcomes for large employers
The focus on RTW service through our Agents
Stakeholders view on red tape and unnecessary administration
RTW support for job detached workers
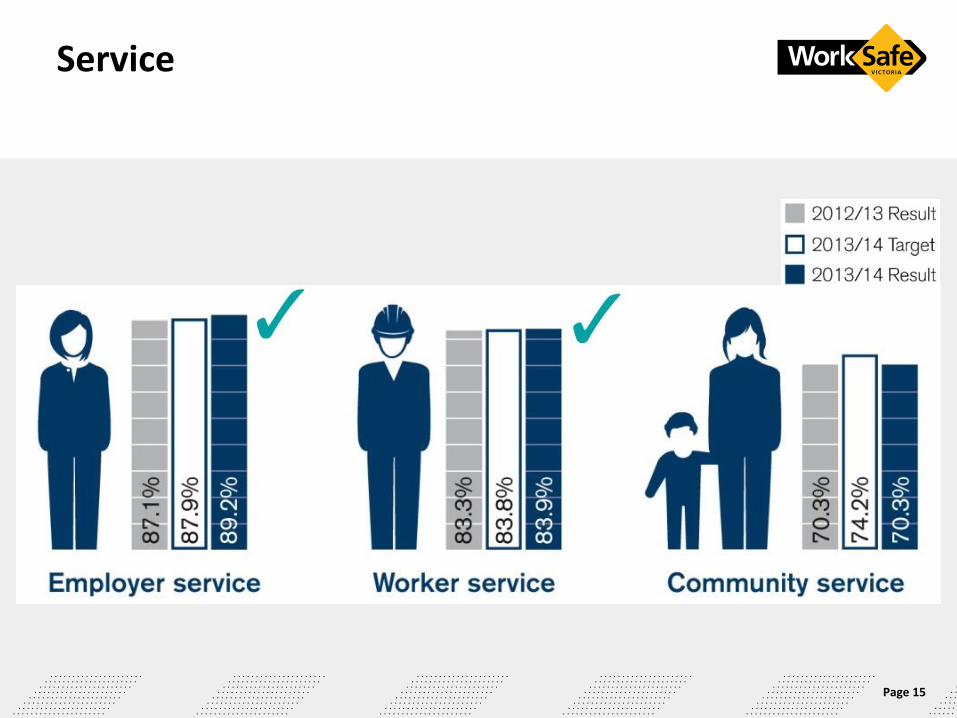
Service
Graphic with Return to Work target
Page 15
Where we are now Service Dimension Surveying
Page 16
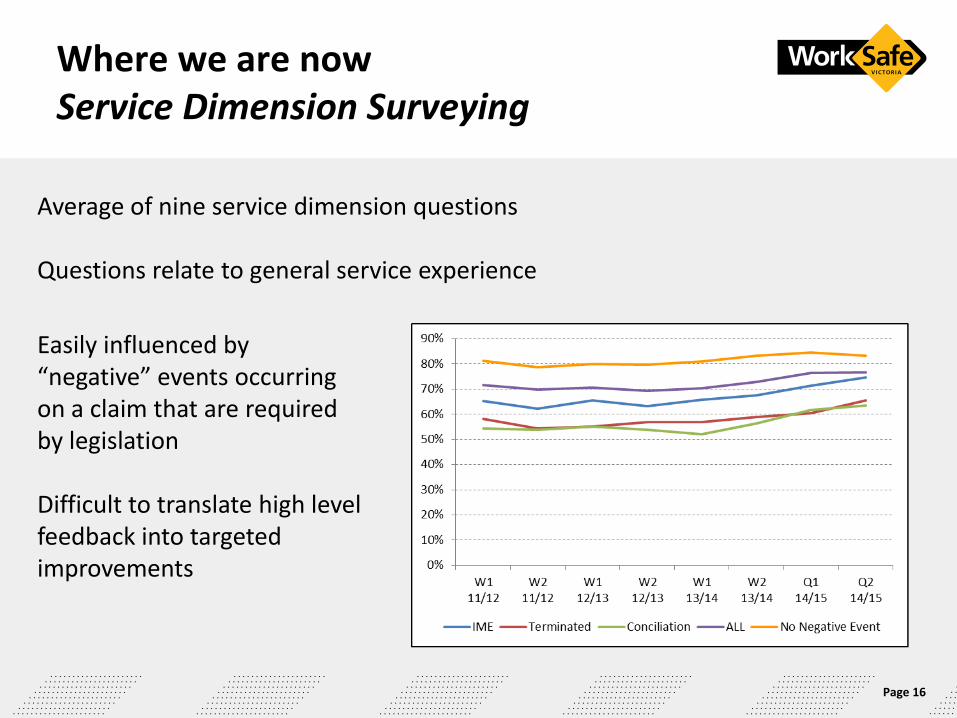
Average of nine service dimension questions Questions relate to general service experience
Easily influenced by “negative” events occurring on a claim that are required by legislation Difficult to translate high level feedback into targeted improvements
Where we are heading Key Events Surveying
Page 17
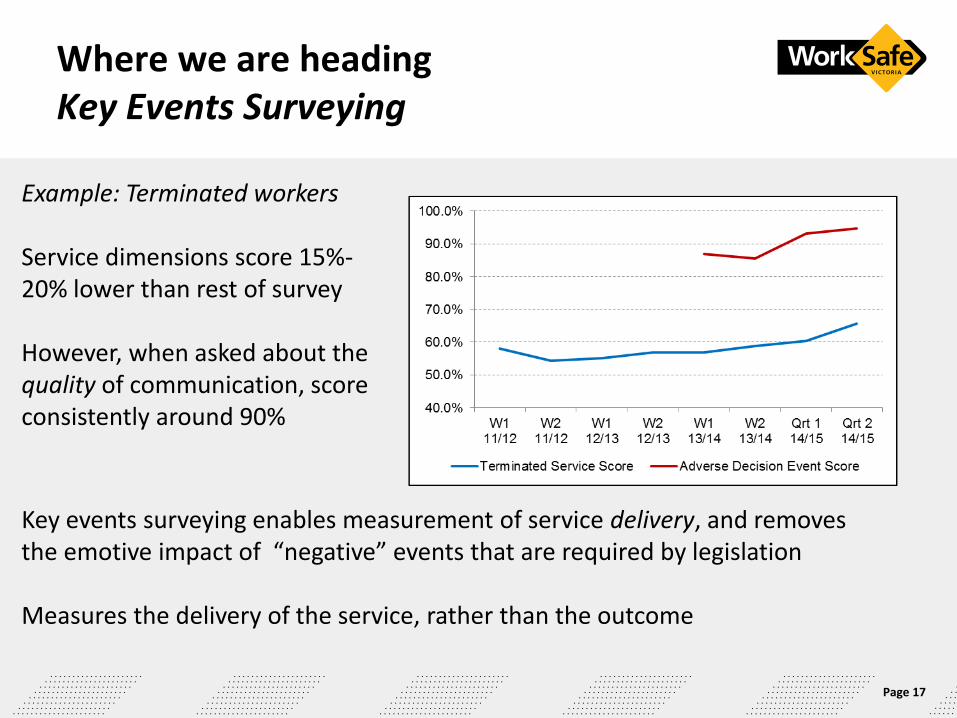
Example: Terminated workers Service dimensions score 15%-20% lower than rest of survey However, when asked about the quality of communication, score consistently around 90%
Key events surveying enables measurement of service delivery, and removes the emotive impact of “negative” events that are required by legislation Measures the delivery of the service, rather than the outcome
Impact of key event surveying Targeted strategies
Page 18
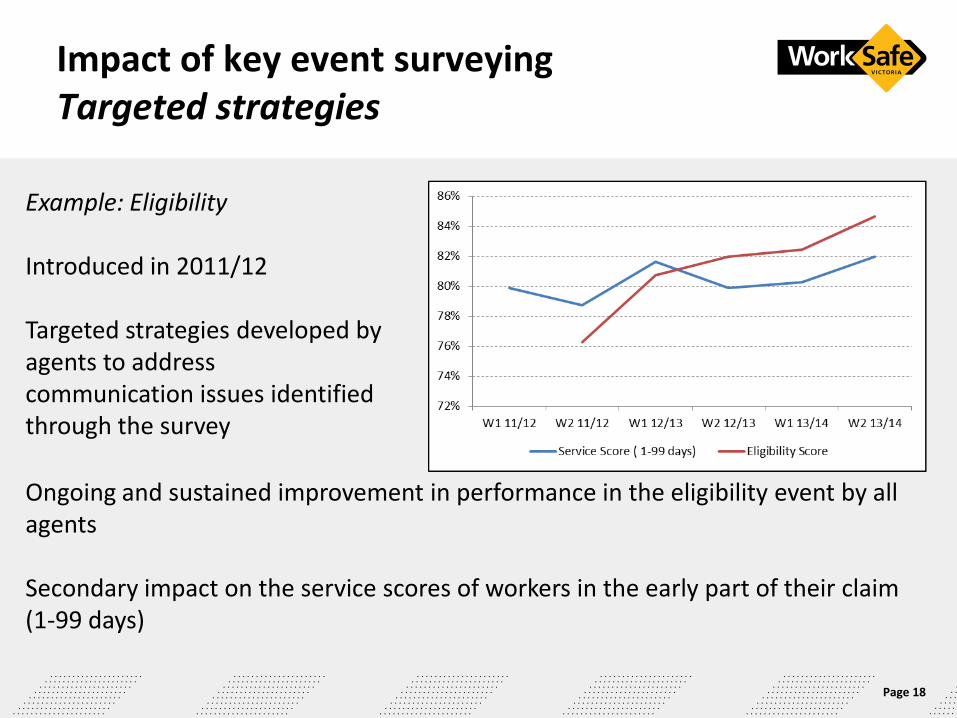
Example: Eligibility Introduced in 2011/12 Targeted strategies developed by agents to address communication issues identified through the survey
Ongoing and sustained improvement in performance in the eligibility event by all agents Secondary impact on the service scores of workers in the early part of their claim (1-99 days)
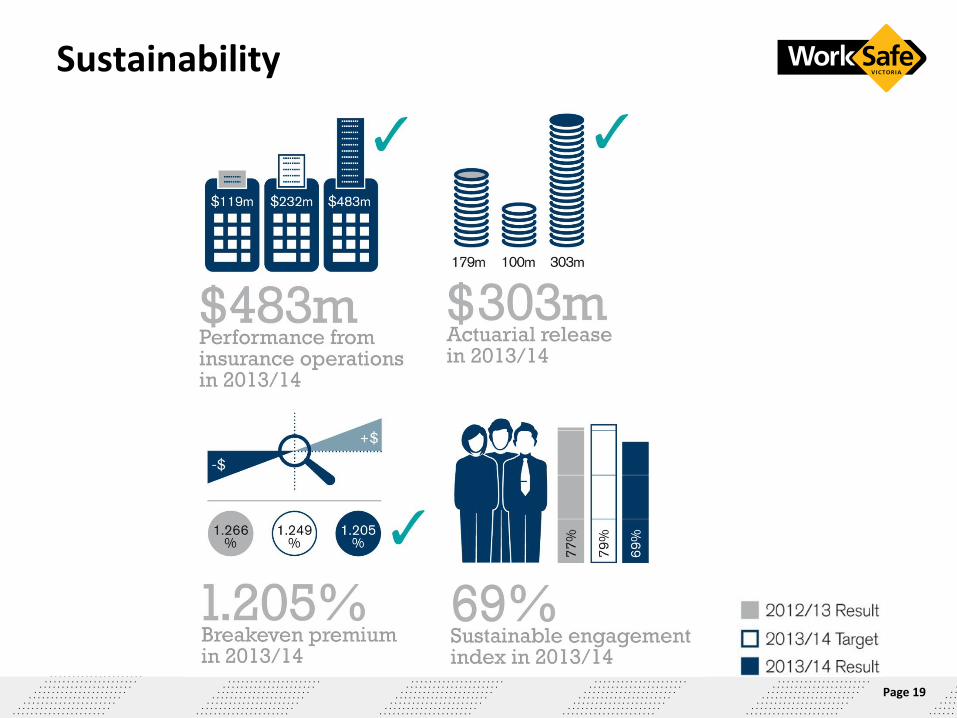
Sustainability
Page 19
Impairment – a strategy of
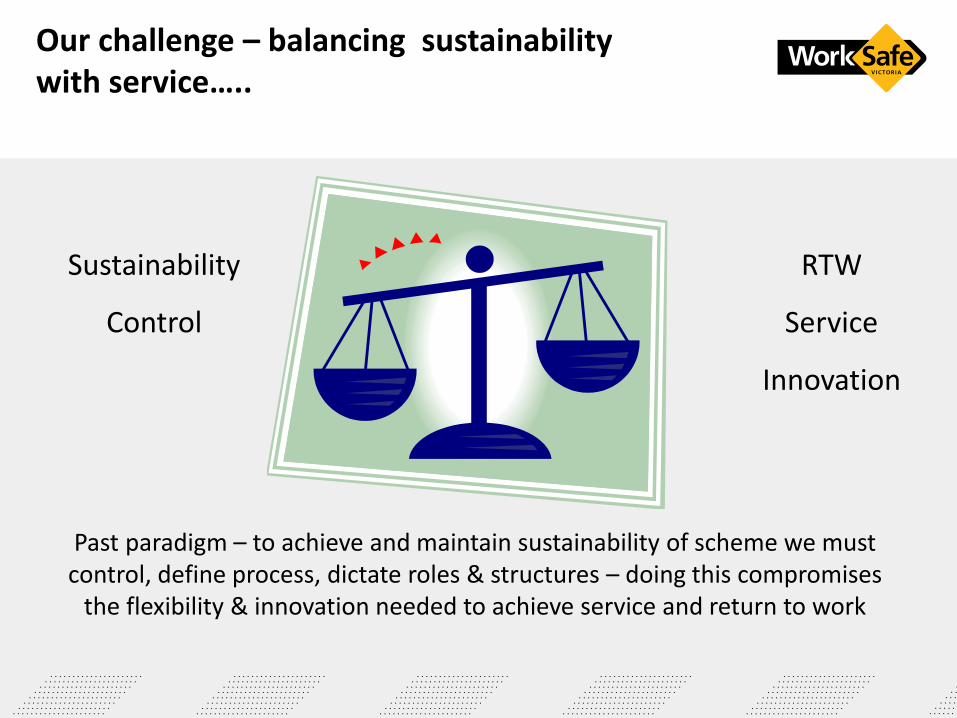
Our challenge – balancing sustainability with service…..
RTW
Service
Innovation
Sustainability
Control
Past paradigm – to achieve and maintain sustainability of scheme we must control, define process, dictate roles & structures – doing this compromises
the flexibility & innovation needed to achieve service and return to work

Thank you
Page 21