Embed Size (px)
Citation preview

Author: Patrick M. Bowen, President & Lead Contact 155 E. Columbus Street, Ste. 220 | Pickerington, Ohio 43147 Phone: (614) 833-9300 | [email protected] www.bowennational.com
City of Asheville
Housing Needs Assessment
Asheville-1
ASHEVILLE
A. Introduction
The focus of this analysis is to assess the market characteristics of, and to determine the housing needs for the city of Asheville, North Carolina. To accomplish this task, Bowen National Research evaluated various socio-economic characteristics, inventoried and analyzed the housing supply (rental and owner/for-sale product), conducted stakeholder interviews, evaluated special needs populations and provided housing gap estimates to help identify the housing needs of the city. To provide a base of comparison, various metrics of Asheville were compared with overall four-county region that includes the counties of Buncombe, Henderson, Madison and Transylvania. A detailed comparison of the city of Asheville in relation with four subject counties is provided in the region analysis portion of the Asheville Overall Housing Needs Assessment.
B. City Overview
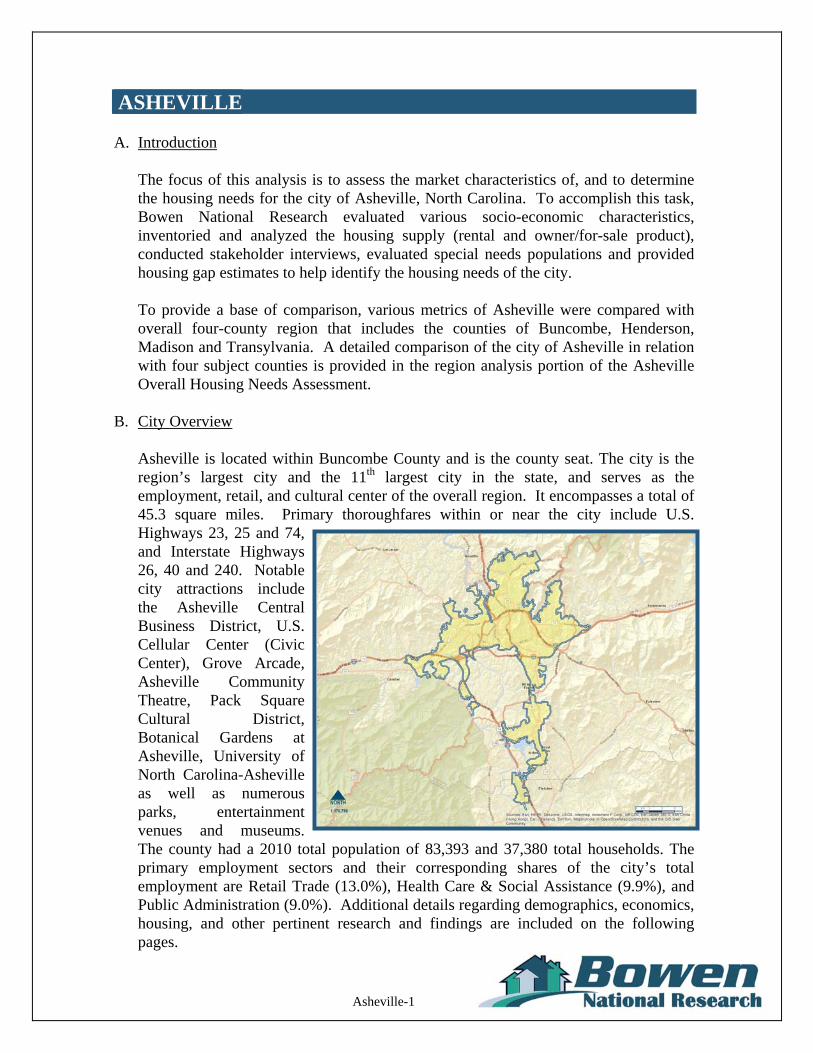
Asheville is located within Buncombe County and is the county seat. The city is the region’s largest city and the 11th largest city in the state, and serves as the employment, retail, and cultural center of the overall region. It encompasses a total of 45.3 square miles. Primary thoroughfares within or near the city include U.S. Highways 23, 25 and 74, and Interstate Highways 26, 40 and 240. Notable city attractions include the Asheville Central Business District, U.S. Cellular Center (Civic Center), Grove Arcade, Asheville Community Theatre, Pack Square Cultural District, Botanical Gardens at Asheville, University of North Carolina-Asheville as well as numerous parks, entertainment venues and museums. The county had a 2010 total population of 83,393 and 37,380 total households. The primary employment sectors and their corresponding shares of the city’s total employment are Retail Trade (13.0%), Health Care & Social Assistance (9.9%), and Public Administration (9.0%). Additional details regarding demographics, economics, housing, and other pertinent research and findings are included on the following pages.
Asheville-2
C. Demographics
This section of the report evaluates key demographic characteristics for Asheville. Through this analysis, unfolding trends and unique conditions are revealed regarding populations and household income data. Demographic comparisons provide insights into the human composition of housing markets. This section is comprised of three major parts: population characteristics, household characteristics, and household income data. Population characteristics describe the qualities of individual people, while household characteristics describe the qualities of people living together in one residence. It is important to note that 2000 and 2010 demographics are based on U.S. Census data (actual count), while 2015 and 2020 data are based on calculated projections provided by ESRI, a nationally recognized demography firm, and the American Community Survey. The accuracy of these projections depends on the realization of certain assumptions:
Economic projections made by secondary sources materialize;
Governmental policies with respect to residential development remain consistent;
Availability of financing for residential development (i.e. mortgages, commercial loans, subsidies, Tax Credits, etc.) remains consistent;
Sufficient housing and infrastructure is provided to support projected population and household growth.
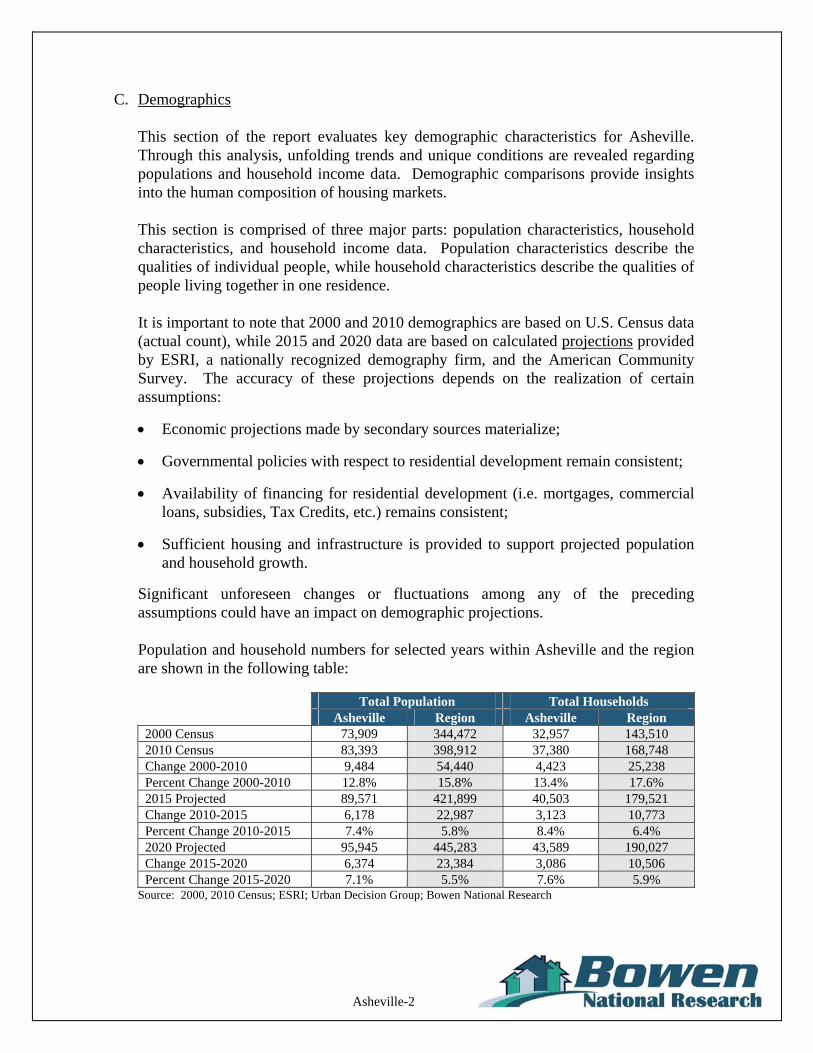
Significant unforeseen changes or fluctuations among any of the preceding assumptions could have an impact on demographic projections. Population and household numbers for selected years within Asheville and the region are shown in the following table:
Total Population Total Households
Asheville Region Asheville Region 2000 Census 73,909 344,472 32,957 143,510 2010 Census 83,393 398,912 37,380 168,748 Change 2000-2010 9,484 54,440 4,423 25,238 Percent Change 2000-2010 12.8% 15.8% 13.4% 17.6% 2015 Projected 89,571 421,899 40,503 179,521 Change 2010-2015 6,178 22,987 3,123 10,773 Percent Change 2010-2015 7.4% 5.8% 8.4% 6.4% 2020 Projected 95,945 445,283 43,589 190,027 Change 2015-2020 6,374 23,384 3,086 10,506 Percent Change 2015-2020 7.1% 5.5% 7.6% 5.9%
Source: 2000, 2010 Census; ESRI; Urban Decision Group; Bowen National Research
Asheville-3
Asheville/Region Population & Household Trends
7.1%7.4%
12.8%
5.5%5.8%
15.8%
7.6%8.4%
13.4%
6.4% 5.9%
17.6%
0.0%
2.0%
4.0%
6.0%
8.0%
10.0%
12.0%
14.0%
16.0%
18.0%
2000-2010 2010-2015 2015-2020
Year
Per
cent
Cha
nge
Asheville Population Region Population Asheville Households Region Households
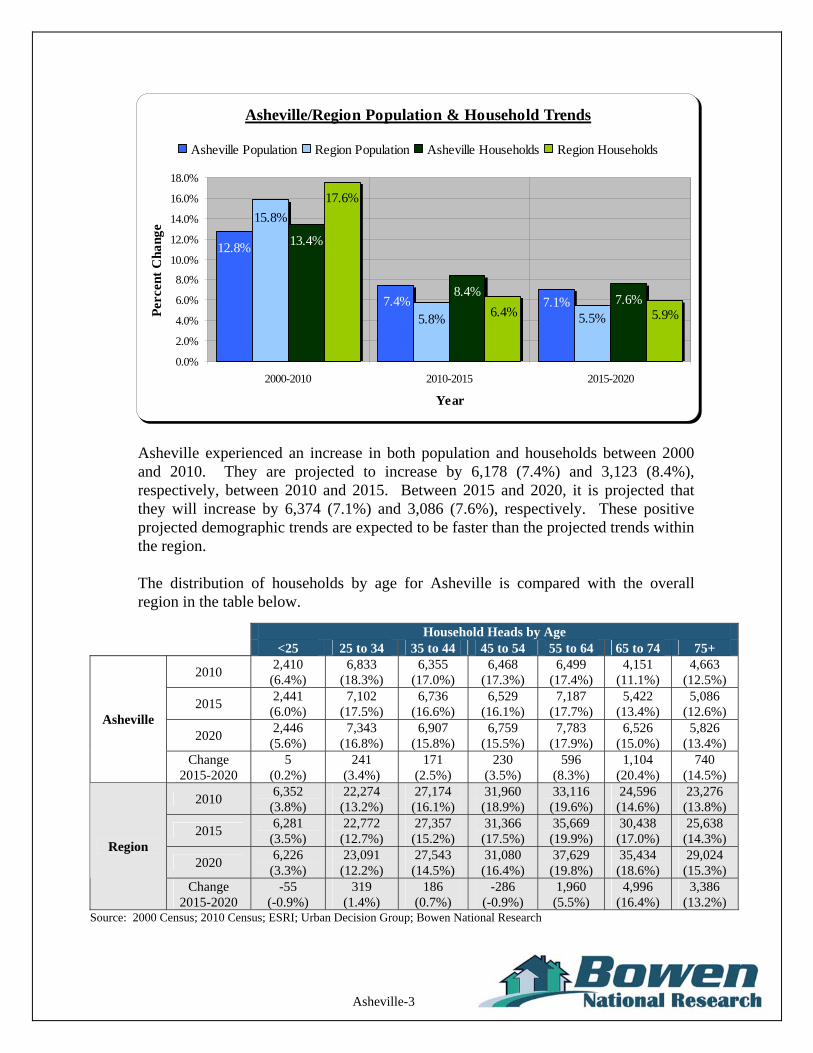
Asheville experienced an increase in both population and households between 2000 and 2010. They are projected to increase by 6,178 (7.4%) and 3,123 (8.4%), respectively, between 2010 and 2015. Between 2015 and 2020, it is projected that they will increase by 6,374 (7.1%) and 3,086 (7.6%), respectively. These positive projected demographic trends are expected to be faster than the projected trends within the region.
The distribution of households by age for Asheville is compared with the overall region in the table below.
Household Heads by Age
<25 25 to 34 35 to 44 45 to 54 55 to 64 65 to 74 75+
2010 2,410
(6.4%) 6,833
(18.3%) 6,355
(17.0%) 6,468
(17.3%) 6,499
(17.4%) 4,151
(11.1%) 4,663
(12.5%)
2015 2,441
(6.0%) 7,102
(17.5%) 6,736
(16.6%) 6,529
(16.1%) 7,187
(17.7%) 5,422
(13.4%) 5,086
(12.6%)
2020 2,446
(5.6%) 7,343
(16.8%) 6,907
(15.8%) 6,759
(15.5%) 7,783
(17.9%) 6,526
(15.0%) 5,826
(13.4%)
Asheville
Change 2015-2020
5 (0.2%)
241 (3.4%)
171 (2.5%)
230 (3.5%)
596 (8.3%)
1,104 (20.4%)
740 (14.5%)
2010 6,352
(3.8%) 22,274
(13.2%) 27,174 (16.1%)
31,960 (18.9%)
33,116 (19.6%)
24,596 (14.6%)
23,276 (13.8%)
2015 6,281
(3.5%) 22,772
(12.7%) 27,357 (15.2%)
31,366 (17.5%)
35,669 (19.9%)
30,438 (17.0%)
25,638 (14.3%)
2020 6,226
(3.3%) 23,091
(12.2%) 27,543 (14.5%)
31,080 (16.4%)
37,629 (19.8%)
35,434 (18.6%)
29,024 (15.3%)
Region
Change 2015-2020
-55 (-0.9%)
319 (1.4%)
186 (0.7%)
-286 (-0.9%)
1,960 (5.5%)
4,996 (16.4%)
3,386 (13.2%)
Source: 2000 Census; 2010 Census; ESRI; Urban Decision Group; Bowen National Research
Asheville-4
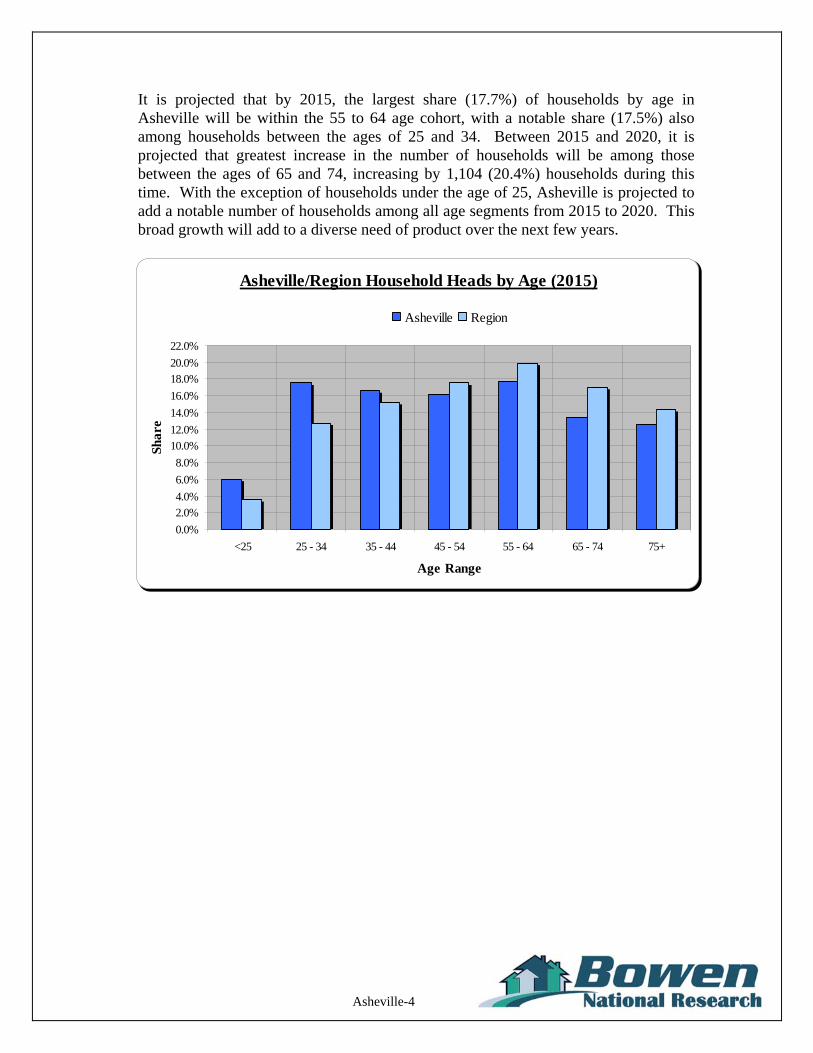
It is projected that by 2015, the largest share (17.7%) of households by age in Asheville will be within the 55 to 64 age cohort, with a notable share (17.5%) also among households between the ages of 25 and 34. Between 2015 and 2020, it is projected that greatest increase in the number of households will be among those between the ages of 65 and 74, increasing by 1,104 (20.4%) households during this time. With the exception of households under the age of 25, Asheville is projected to add a notable number of households among all age segments from 2015 to 2020. This broad growth will add to a diverse need of product over the next few years.
Asheville/Region Household Heads by Age (2015)
0.0%
2.0%
4.0%
6.0%
8.0%
10.0%
12.0%
14.0%
16.0%
18.0%
20.0%
22.0%
<25 25 - 34 35 - 44 45 - 54 55 - 64 65 - 74 75+
Age Range
Shar
e
Asheville Region

Asheville-5
Households by income for selected years are shown in the following table:
Households by Income
<$15,000 $15,000 -
$24,999 $25,000 -
$34,999 $35,000 -
$49,999 $50,000 -
$74,999 $75,000 -
$99,999 $100,000-$149,999 $150,000+ Total
2015 7,403
(18.3%) 4,887
(12.1%) 5,091
(12.6%) 6,234
(15.4%) 7,462
(18.4%) 3,799
(9.4%) 3,508 (8.7%)
2,120 (5.2%)
40,504 (100.0%)
2020 7,775
(17.8%) 5,462
(12.5%) 5,305
(12.2%) 6,705
(15.4%) 8,064
(18.5%) 3,818
(8.8%) 4,060 (9.3%)
2,401 (5.5%)
43,590 (100.0%)
Asheville
Change 372
(5.0%) 574
(11.8%) 214
(4.2%) 471
(7.6%) 602
(8.1%) 19
(0.5%) 552
(15.7%) 281
(13.2%) 3,086
(7.6%)
2015 26,973
(15.0%) 22,124 (12.3%)
23,236 (12.9%)
28,217 (15.7%)
34,090 (19.0%)
19,434 (10.8%)
16,434 (9.2%)
9,012 (5.0%)
179,521 (100.0%)
2020 27,648
(14.5%) 23,576 (12.4%)
24,058 (12.7%)
30,943 (16.3%)
35,461 (18.7%)
20,226 (10.6%)
18,169 (9.6%)
9,954 (5.2%)
190,035 (100.0%)
Region
Change 674
(2.5%) 1,453 (6.6%)
823 (3.5%)
2,725 (9.7%)
1,371 (4.0%)
792 (4.1%)
1,734 (10.6%)
942 (10.5%)
10,514 (5.9%)
Source: 2010 Census; ESRI; Urban Decision Group; Bowen National Research
In 2015, it is projected that approximately 43% of Asheville households will have annual incomes below $35,000, with the largest share (18.4%) of households having incomes between $50,000 and $74,999. It is projected that between 2015 and 2020, most income segments will experience notable growth, with the greatest increase in households by income level expected to occur among those with incomes between $50,000 and $74,999. Based on these demographic projections, it is anticipated that the housing needs by household income segment will be diverse and likely contribute to a broad range of housing product that will be needed to meet the needs of Asheville’s residents.
Asheville/Region Households by Income (2015)
0.0%
2.0%
4.0%
6.0%
8.0%
10.0%
12.0%
14.0%
16.0%
18.0%
20.0%
<$15,000 $15,000 -$24,999
$25,000 -$34,999
$35,000 -$49,999
$50,000 -$74,999
$75,000 -$99,999
$100,000 -$149,999
$150,000+
Household Income
Shar
e
Asheville Region
Asheville-6
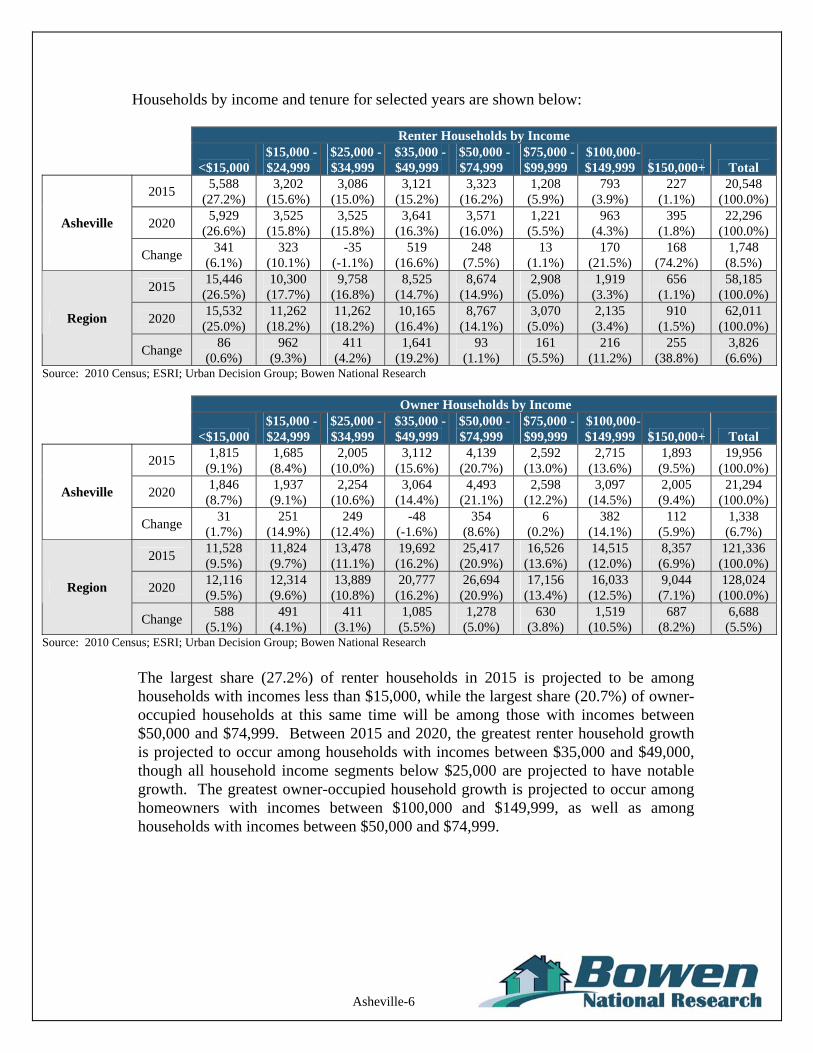
Households by income and tenure for selected years are shown below:
Renter Households by Income
<$15,000 $15,000 -
$24,999 $25,000 -
$34,999 $35,000 -
$49,999 $50,000 -
$74,999 $75,000 -
$99,999 $100,000-$149,999 $150,000+ Total
2015 5,588
(27.2%) 3,202
(15.6%) 3,086
(15.0%) 3,121
(15.2%) 3,323
(16.2%) 1,208
(5.9%) 793
(3.9%) 227
(1.1%) 20,548
(100.0%)
2020 5,929
(26.6%) 3,525
(15.8%) 3,525
(15.8%) 3,641
(16.3%) 3,571
(16.0%) 1,221
(5.5%) 963
(4.3%) 395
(1.8%) 22,296
(100.0%) Asheville
Change 341
(6.1%) 323
(10.1%) -35
(-1.1%) 519
(16.6%) 248
(7.5%) 13
(1.1%) 170
(21.5%) 168
(74.2%) 1,748
(8.5%)
2015 15,446
(26.5%) 10,300 (17.7%)
9,758 (16.8%)
8,525 (14.7%)
8,674 (14.9%)
2,908 (5.0%)
1,919 (3.3%)
656 (1.1%)
58,185 (100.0%)
2020 15,532
(25.0%) 11,262 (18.2%)
11,262 (18.2%)
10,165 (16.4%)
8,767 (14.1%)
3,070 (5.0%)
2,135 (3.4%)
910 (1.5%)
62,011 (100.0%)
Region
Change 86
(0.6%) 962
(9.3%) 411
(4.2%) 1,641
(19.2%) 93
(1.1%) 161
(5.5%) 216
(11.2%) 255
(38.8%) 3,826
(6.6%) Source: 2010 Census; ESRI; Urban Decision Group; Bowen National Research
Owner Households by Income
<$15,000
$15,000 -$24,999
$25,000 -$34,999
$35,000 -$49,999
$50,000 -$74,999
$75,000 - $99,999
$100,000-$149,999 $150,000+ Total
2015 1,815
(9.1%) 1,685 (8.4%)
2,005 (10.0%)
3,112 (15.6%)
4,139 (20.7%)
2,592 (13.0%)
2,715 (13.6%)
1,893 (9.5%)
19,956 (100.0%)
2020 1,846
(8.7%) 1,937 (9.1%)
2,254 (10.6%)
3,064 (14.4%)
4,493 (21.1%)
2,598 (12.2%)
3,097 (14.5%)
2,005 (9.4%)
21,294 (100.0%)
Asheville
Change 31
(1.7%) 251
(14.9%) 249
(12.4%) -48
(-1.6%) 354
(8.6%) 6
(0.2%) 382
(14.1%) 112
(5.9%) 1,338
(6.7%)
2015 11,528 (9.5%)
11,824 (9.7%)
13,478 (11.1%)
19,692 (16.2%)
25,417 (20.9%)
16,526 (13.6%)
14,515 (12.0%)
8,357 (6.9%)
121,336(100.0%)
2020 12,116 (9.5%)
12,314 (9.6%)
13,889 (10.8%)
20,777 (16.2%)
26,694 (20.9%)
17,156 (13.4%)
16,033 (12.5%)
9,044 (7.1%)
128,024(100.0%)
Region
Change 588
(5.1%) 491
(4.1%) 411
(3.1%) 1,085
(5.5%) 1,278 (5.0%)
630 (3.8%)
1,519 (10.5%)
687 (8.2%)
6,688 (5.5%)
Source: 2010 Census; ESRI; Urban Decision Group; Bowen National Research
The largest share (27.2%) of renter households in 2015 is projected to be among households with incomes less than $15,000, while the largest share (20.7%) of owner-occupied households at this same time will be among those with incomes between $50,000 and $74,999. Between 2015 and 2020, the greatest renter household growth is projected to occur among households with incomes between $35,000 and $49,000, though all household income segments below $25,000 are projected to have notable growth. The greatest owner-occupied household growth is projected to occur among homeowners with incomes between $100,000 and $149,999, as well as among households with incomes between $50,000 and $74,999.

Asheville-7
Given the large and growing base of older adult households in the region, it is important to evaluate Asheville’s demographic trends of senior households by income and tenure for 2015 and 2020.
Renter Households Owner Households
2015 2020 2015 2020 Ages 55 and Older Household Income Number Percent Number Percent Number Percent Number Percent
< $15,000 1,656 27.2% 1,781 25.3% 940 9.1% 997 8.8% $15,000 - $24,999 949 15.6% 1,178 16.7% 872 8.4% 1,022 9.0% $25,000 - $34,999 914 15.0% 1,073 15.2% 1,038 10.0% 1,227 10.9% $35,000 - $49,999 925 15.2% 1,206 17.1% 1,611 15.6% 1,795 15.9% $50,000 - $74,999 985 16.2% 1,023 14.5% 2,143 20.7% 2,364 20.9% $75,000 - $99,999 358 5.9% 380 5.4% 1,342 13.0% 1,449 12.8%
$100,000 - $149,999 235 3.9% 280 4.0% 1,406 13.6% 1,515 13.4% $150,000+ 67 1.1% 126 1.8% 980 9.5% 927 8.2%
Total 6,088 100.0% 7,046 100.0% 10,332 100.0% 11,296 100.0% Source: 2010 Census; ESRI; Urban Decision Group; Bowen National Research
Renter Households Owner Households
2015 2020 2015 2020 Ages 62 and Older Household Income Number Percent Number Percent Number Percent Number Percent
< $15,000 1,190 27.2% 1,299 25.3% 666 9.1% 707 8.8% $15,000 - $24,999 682 15.6% 859 16.7% 619 8.4% 724 9.0% $25,000 - $34,999 657 15.0% 782 15.2% 736 10.0% 870 10.9% $35,000 - $49,999 664 15.2% 879 17.1% 1,143 15.6% 1,273 15.9% $50,000 - $74,999 707 16.2% 746 14.5% 1,520 20.7% 1,676 20.9% $75,000 - $99,999 257 5.9% 277 5.4% 952 13.0% 1,027 12.8%
$100,000 - $149,999 169 3.9% 204 4.0% 997 13.6% 1,074 13.4% $150,000+ 48 1.1% 92 1.8% 695 9.5% 657 8.2%
Total 4,374 100.0% 5,137 100.0% 7,328 100.0% 8,009 100.0% Source: 2010 Census; ESRI; Urban Decision Group; Bowen National Research
Renter Households Owner Households
2015 2020 2015 2020 Ages 75 and Older Household Income Number Percent Number Percent Number Percent Number Percent
< $15,000 524 27.2% 542 25.3% 278 9.1% 281 8.8% $15,000 - $24,999 300 15.6% 359 16.7% 258 8.4% 288 9.0% $25,000 - $34,999 289 15.0% 327 15.2% 307 10.0% 346 10.9% $35,000 - $49,999 293 15.2% 367 17.1% 476 15.6% 506 15.9% $50,000 - $74,999 312 16.2% 311 14.5% 634 20.7% 667 20.9% $75,000 - $99,999 113 5.9% 116 5.4% 397 13.0% 409 12.8%
$100,000 - $149,999 74 3.9% 85 4.0% 416 13.6% 427 13.4% $150,000+ 21 1.1% 38 1.8% 290 9.5% 261 8.2%
Total 1,927 100.0% 2,146 100.0% 3,055 100.0% 3,187 100.0% Source: 2010 Census; ESRI; Urban Decision Group; Bowen National Research
Asheville-8
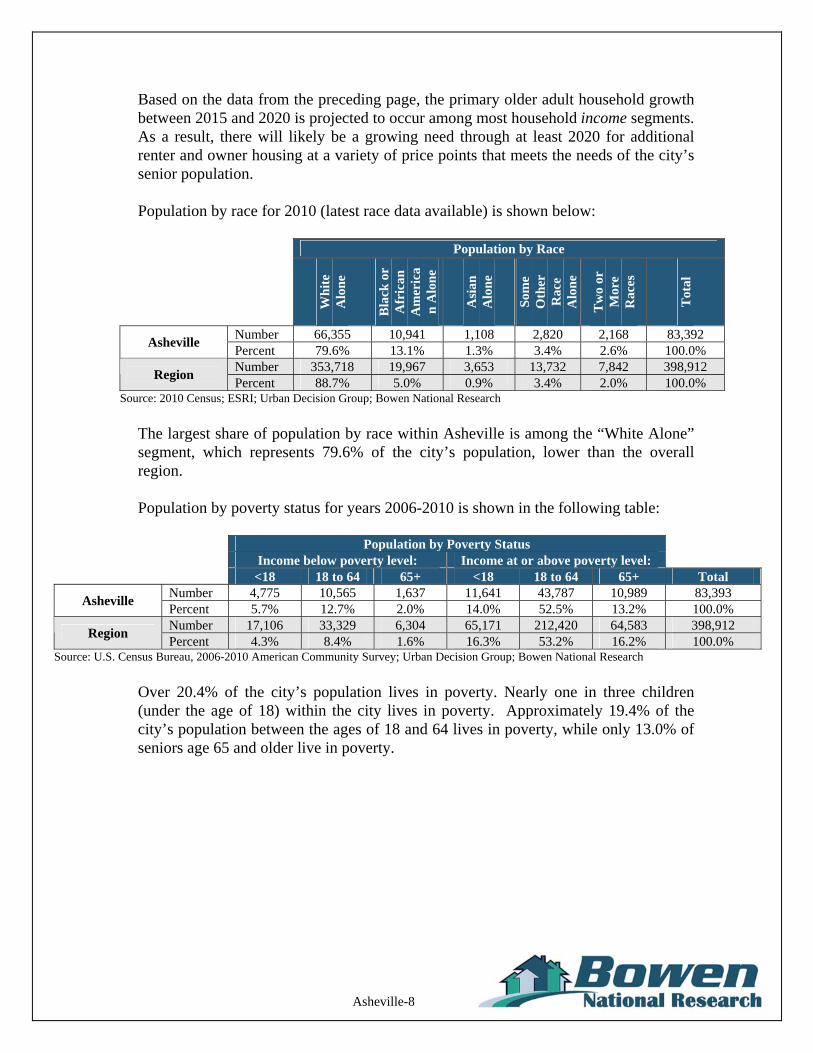
Based on the data from the preceding page, the primary older adult household growth between 2015 and 2020 is projected to occur among most household income segments. As a result, there will likely be a growing need through at least 2020 for additional renter and owner housing at a variety of price points that meets the needs of the city’s senior population. Population by race for 2010 (latest race data available) is shown below:
Population by Race
Wh
ite
Alo
ne
Bla
ck o
r A
fric
an
Am
eric
an
Alo
ne
Asi
an
Alo
ne
Som
e O
ther
R
ace
Alo
ne
Tw
o or
M
ore
Rac
es
Tot
al
Number 66,355 10,941 1,108 2,820 2,168 83,392 Asheville
Percent 79.6% 13.1% 1.3% 3.4% 2.6% 100.0% Number 353,718 19,967 3,653 13,732 7,842 398,912
Region Percent 88.7% 5.0% 0.9% 3.4% 2.0% 100.0%
Source: 2010 Census; ESRI; Urban Decision Group; Bowen National Research
The largest share of population by race within Asheville is among the “White Alone” segment, which represents 79.6% of the city’s population, lower than the overall region. Population by poverty status for years 2006-2010 is shown in the following table:
Population by Poverty Status Income below poverty level: Income at or above poverty level: <18 18 to 64 65+ <18 18 to 64 65+ Total
Number 4,775 10,565 1,637 11,641 43,787 10,989 83,393 Asheville
Percent 5.7% 12.7% 2.0% 14.0% 52.5% 13.2% 100.0% Number 17,106 33,329 6,304 65,171 212,420 64,583 398,912
Region Percent 4.3% 8.4% 1.6% 16.3% 53.2% 16.2% 100.0%
Source: U.S. Census Bureau, 2006-2010 American Community Survey; Urban Decision Group; Bowen National Research
Over 20.4% of the city’s population lives in poverty. Nearly one in three children (under the age of 18) within the city lives in poverty. Approximately 19.4% of the city’s population between the ages of 18 and 64 lives in poverty, while only 13.0% of seniors age 65 and older live in poverty.
Asheville-9
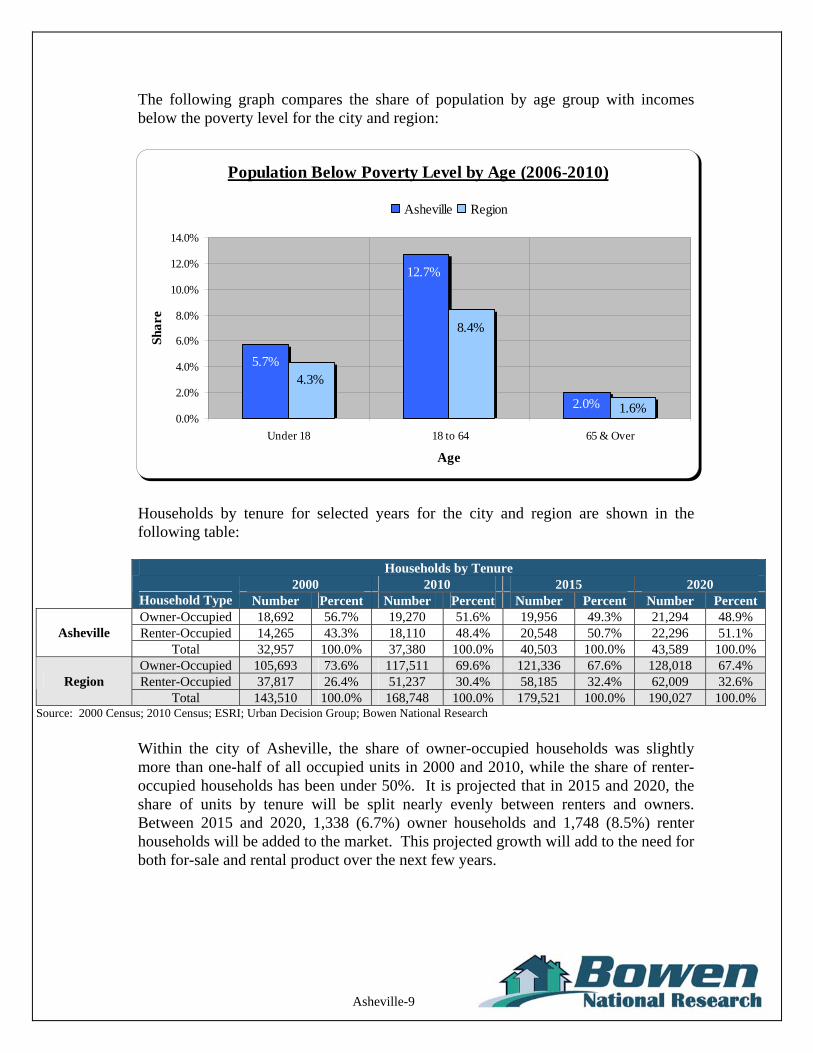
The following graph compares the share of population by age group with incomes below the poverty level for the city and region:
Population Below Poverty Level by Age (2006-2010)
2.0%
5.7%
12.7%
4.3%
1.6%
8.4%
0.0%
2.0%
4.0%
6.0%
8.0%
10.0%
12.0%
14.0%
Under 18 18 to 64 65 & Over
Age
Shar
e
Asheville Region
Households by tenure for selected years for the city and region are shown in the following table:
Households by Tenure 2000 2010 2015 2020
Household Type Number Percent Number Percent Number Percent Number Percent Owner-Occupied 18,692 56.7% 19,270 51.6% 19,956 49.3% 21,294 48.9% Renter-Occupied 14,265 43.3% 18,110 48.4% 20,548 50.7% 22,296 51.1% Asheville
Total 32,957 100.0% 37,380 100.0% 40,503 100.0% 43,589 100.0% Owner-Occupied 105,693 73.6% 117,511 69.6% 121,336 67.6% 128,018 67.4% Renter-Occupied 37,817 26.4% 51,237 30.4% 58,185 32.4% 62,009 32.6% Region
Total 143,510 100.0% 168,748 100.0% 179,521 100.0% 190,027 100.0% Source: 2000 Census; 2010 Census; ESRI; Urban Decision Group; Bowen National Research
Within the city of Asheville, the share of owner-occupied households was slightly more than one-half of all occupied units in 2000 and 2010, while the share of renter-occupied households has been under 50%. It is projected that in 2015 and 2020, the share of units by tenure will be split nearly evenly between renters and owners. Between 2015 and 2020, 1,338 (6.7%) owner households and 1,748 (8.5%) renter households will be added to the market. This projected growth will add to the need for both for-sale and rental product over the next few years.

Asheville-10
The following graph compares household tenure shares for 2000, 2010, 2015 and 2020:
Asheville/Region Households by Tenure
0.0%
10.0%
20.0%
30.0%
40.0%
50.0%
60.0%
70.0%
80.0%
2000 2010 2015 2020
Year
Shar
e
Asheville Owner Region Owner Asheville Renter Region Renter
Renter households by size for selected years are shown in the following table:
Persons Per Renter Household
1-Person 2-Person 3-Person 4-Person 5-Person Total
Median Household
Size
2010 8,081
(44.6%) 5,405
(29.8%) 2,451
(13.5%) 1,324
(7.3%) 850
(4.7%) 18,110
(100.0%) 1.36
2015 9,295
(45.2%) 6,052
(29.5%) 2,789
(13.6%) 1,466
(7.1%) 945
(4.6%) 20,548
(100.0%) 1.32 Asheville
2020 10,207
(45.8%) 6,504
(29.2%) 3,022
(13.6%) 1,561
(7.0%) 1,002 (4.5%)
22,296 (100.0%) 1.29
2010 20,359
(39.7%) 14,680 (28.7%)
7,554 (14.7%)
4,965 (9.7%)
3,679 (7.2%)
51,237 (100.0%) 1.72
2015 23,427
(40.3%) 16,488 (28.3%)
8,593 (14.8%)
5,537 (9.5%)
4,140 (7.1%)
58,185 (100.0%) 1.69
Region
2020 25,224
(40.7%) 17,416 (28.1%)
9,175 (14.8%)
5,806 (9.4%)
4,387 (7.1%)
62,009 (100.0%) 1.66
Source: 2000, 2010 Census; ESRI; Urban Decision Group; Bowen National Research
In 2015, nearly 75% of all renter households have one or two persons. Note that one-person households are projected to experience the greatest growth between 2015 and 2020, increasing by 912, or 9.8%. This coincides with the projected decrease in the median household size from 1.32 in 2010 to 1.29 in 2020.

Asheville-11
The following graph compares renter household size shares for the city and the region in 2015:
Asheville/Region Persons per Renter Household (2015)
4.6%7.1%
13.6%
29.5%
45.2%
7.1%9.5%
14.8%
28.3%
40.3%
0.0%
5.0%
10.0%
15.0%
20.0%
25.0%
30.0%
35.0%
40.0%
45.0%
1-Person 2-Persons 3-Persons 4-Persons 5-Persons
Household Size
Shar
e
Asheville Region
Owner households by size for selected years are shown on the following table:
Persons Per Owner Household
1-Person 2-Person 3-Person 4-Person 5-Person Total
Median Household
Size
2010 5,756
(29.9%) 7,507
(39.0%) 2,891
(15.0%) 2,026
(10.5%) 1,090 (5.7%)
19,270 (100.0%) 2.03
2015 6,101
(30.6%) 7,679
(38.5%) 3,002
(15.0%) 2,057
(10.3%) 1,115 (5.6%)
19,956 (100.0%) 2.01
Asheville
2020 6,629
(31.1%) 8,131
(38.2%) 3,206
(15.1%) 2,154
(10.1%) 1,174 (5.5%)
21,294 (100.0%) 1.99
2010 29,657
(25.2%) 50,304
(42.8%) 17,419 (14.8%)
12,690 (10.8%)
7,441 (6.3%)
117,511 (100.0%) 2.16
2015 31,101
(25.6%) 51,336
(42.3%) 18,195 (15.0%)
12,962 (10.7%)
7,742 (6.4%)
121,336 (100.0%) 2.15
Region
2020 33,231
(26.0%) 53,736
(42.0%) 19,298 (15.1%)
13,538 (10.6%)
8,216 (6.4%)
128,018 (100.0%) 2.15
Source: 2000, 2010 Census; ESRI; Urban Decision Group; Bowen National Research
Generally, one- and two-person owner-occupied households are projected to represent a combined two-thirds of the owner-occupied household base within the city in 2015. At the same time, approximately one-third of all owner households are projected to contain three or more persons. These shares are not expected to change much through 2020.
Asheville-12
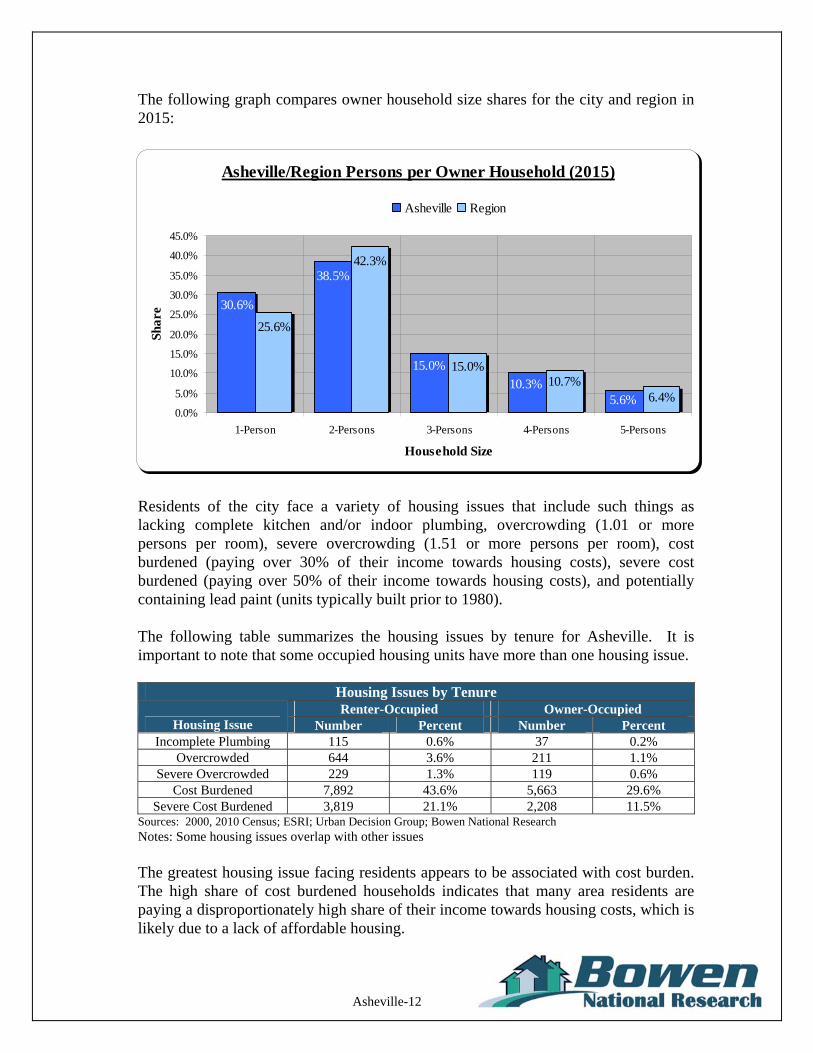
The following graph compares owner household size shares for the city and region in 2015:
Asheville/Region Persons per Owner Household (2015)
5.6%10.3%
15.0%
38.5%
30.6%
6.4%10.7%
15.0%
42.3%
25.6%
0.0%
5.0%
10.0%
15.0%
20.0%
25.0%
30.0%
35.0%
40.0%
45.0%
1-Person 2-Persons 3-Persons 4-Persons 5-Persons
Household Size
Shar
e
Asheville Region
Residents of the city face a variety of housing issues that include such things as lacking complete kitchen and/or indoor plumbing, overcrowding (1.01 or more persons per room), severe overcrowding (1.51 or more persons per room), cost burdened (paying over 30% of their income towards housing costs), severe cost burdened (paying over 50% of their income towards housing costs), and potentially containing lead paint (units typically built prior to 1980). The following table summarizes the housing issues by tenure for Asheville. It is important to note that some occupied housing units have more than one housing issue.
Housing Issues by Tenure Renter-Occupied Owner-Occupied
Housing Issue Number Percent Number Percent Incomplete Plumbing 115 0.6% 37 0.2%
Overcrowded 644 3.6% 211 1.1% Severe Overcrowded 229 1.3% 119 0.6%
Cost Burdened 7,892 43.6% 5,663 29.6% Severe Cost Burdened 3,819 21.1% 2,208 11.5%
Sources: 2000, 2010 Census; ESRI; Urban Decision Group; Bowen National Research Notes: Some housing issues overlap with other issues The greatest housing issue facing residents appears to be associated with cost burden. The high share of cost burdened households indicates that many area residents are paying a disproportionately high share of their income towards housing costs, which is likely due to a lack of affordable housing.
Asheville-13
D. Economics
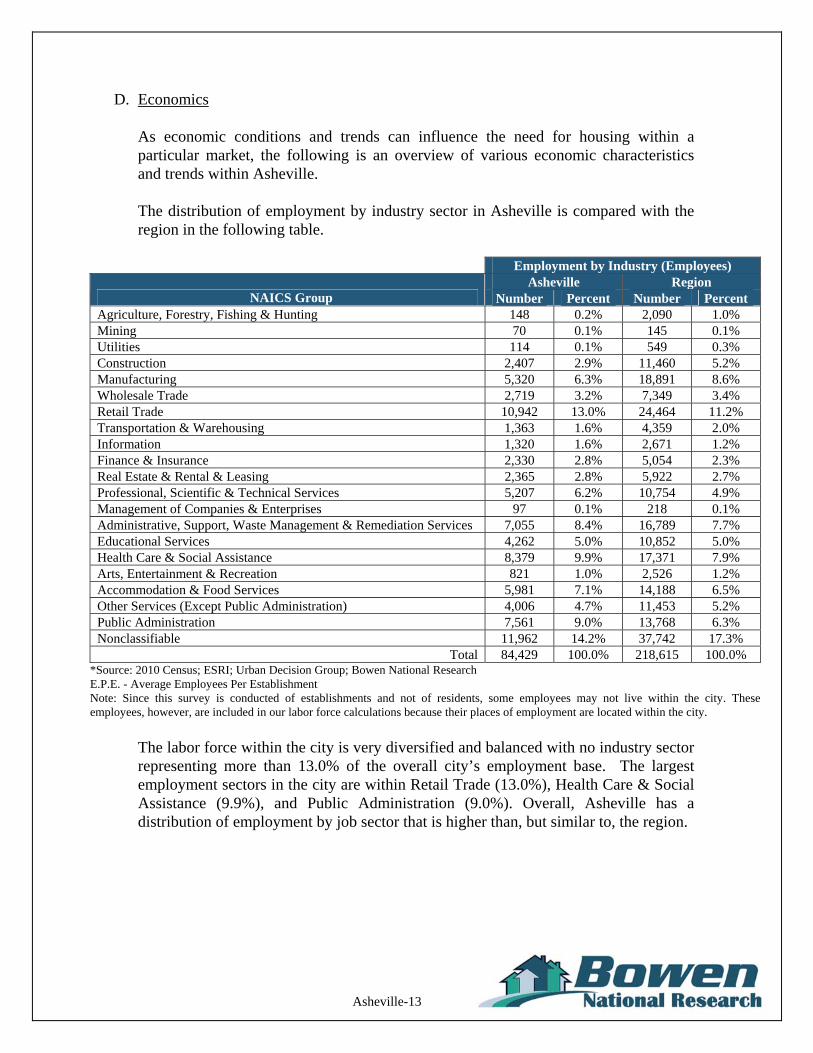
As economic conditions and trends can influence the need for housing within a particular market, the following is an overview of various economic characteristics and trends within Asheville. The distribution of employment by industry sector in Asheville is compared with the region in the following table.
Employment by Industry (Employees) Asheville Region
NAICS Group Number Percent Number Percent Agriculture, Forestry, Fishing & Hunting 148 0.2% 2,090 1.0% Mining 70 0.1% 145 0.1% Utilities 114 0.1% 549 0.3% Construction 2,407 2.9% 11,460 5.2% Manufacturing 5,320 6.3% 18,891 8.6% Wholesale Trade 2,719 3.2% 7,349 3.4% Retail Trade 10,942 13.0% 24,464 11.2% Transportation & Warehousing 1,363 1.6% 4,359 2.0% Information 1,320 1.6% 2,671 1.2% Finance & Insurance 2,330 2.8% 5,054 2.3% Real Estate & Rental & Leasing 2,365 2.8% 5,922 2.7% Professional, Scientific & Technical Services 5,207 6.2% 10,754 4.9% Management of Companies & Enterprises 97 0.1% 218 0.1% Administrative, Support, Waste Management & Remediation Services 7,055 8.4% 16,789 7.7% Educational Services 4,262 5.0% 10,852 5.0% Health Care & Social Assistance 8,379 9.9% 17,371 7.9% Arts, Entertainment & Recreation 821 1.0% 2,526 1.2% Accommodation & Food Services 5,981 7.1% 14,188 6.5% Other Services (Except Public Administration) 4,006 4.7% 11,453 5.2% Public Administration 7,561 9.0% 13,768 6.3% Nonclassifiable 11,962 14.2% 37,742 17.3%
Total 84,429 100.0% 218,615 100.0% *Source: 2010 Census; ESRI; Urban Decision Group; Bowen National Research E.P.E. - Average Employees Per Establishment Note: Since this survey is conducted of establishments and not of residents, some employees may not live within the city. These employees, however, are included in our labor force calculations because their places of employment are located within the city.
The labor force within the city is very diversified and balanced with no industry sector representing more than 13.0% of the overall city’s employment base. The largest employment sectors in the city are within Retail Trade (13.0%), Health Care & Social Assistance (9.9%), and Public Administration (9.0%). Overall, Asheville has a distribution of employment by job sector that is higher than, but similar to, the region.
Asheville-14
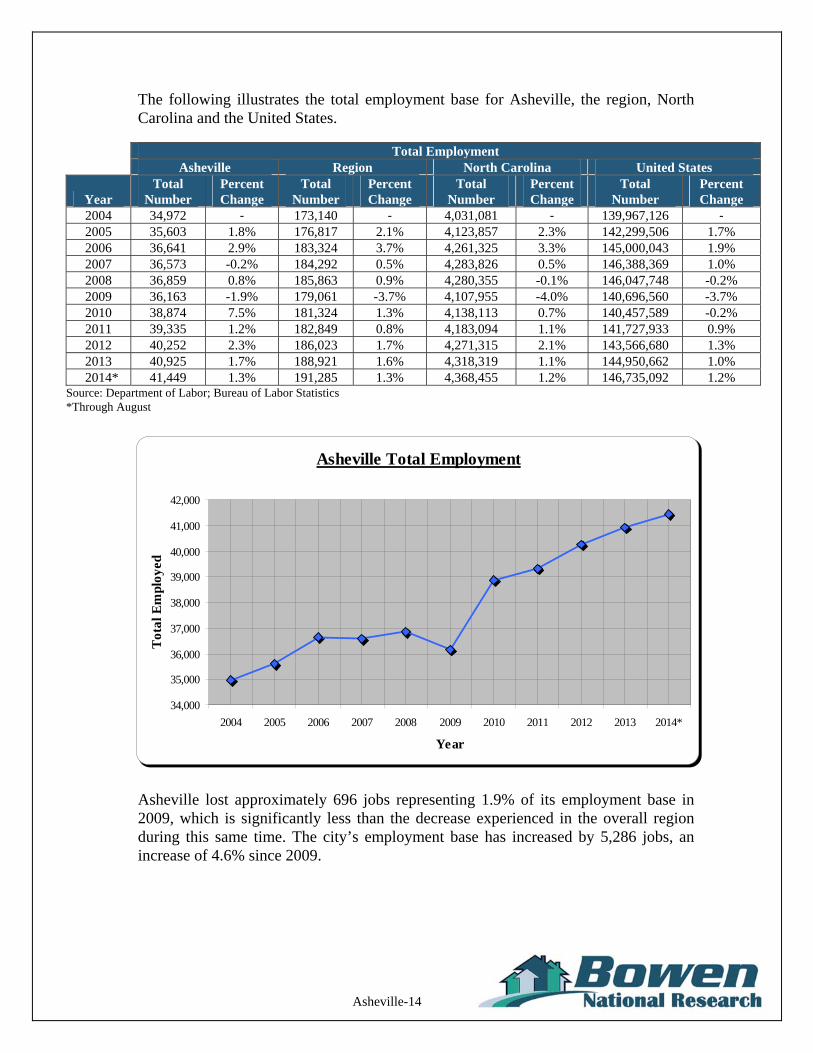
The following illustrates the total employment base for Asheville, the region, North Carolina and the United States.
Total Employment Asheville Region North Carolina United States
Year Total
Number Percent Change
Total Number
Percent Change
Total Number
Percent Change
Total Number
Percent Change
2004 34,972 - 173,140 - 4,031,081 - 139,967,126 - 2005 35,603 1.8% 176,817 2.1% 4,123,857 2.3% 142,299,506 1.7% 2006 36,641 2.9% 183,324 3.7% 4,261,325 3.3% 145,000,043 1.9% 2007 36,573 -0.2% 184,292 0.5% 4,283,826 0.5% 146,388,369 1.0% 2008 36,859 0.8% 185,863 0.9% 4,280,355 -0.1% 146,047,748 -0.2% 2009 36,163 -1.9% 179,061 -3.7% 4,107,955 -4.0% 140,696,560 -3.7% 2010 38,874 7.5% 181,324 1.3% 4,138,113 0.7% 140,457,589 -0.2% 2011 39,335 1.2% 182,849 0.8% 4,183,094 1.1% 141,727,933 0.9% 2012 40,252 2.3% 186,023 1.7% 4,271,315 2.1% 143,566,680 1.3% 2013 40,925 1.7% 188,921 1.6% 4,318,319 1.1% 144,950,662 1.0%
2014* 41,449 1.3% 191,285 1.3% 4,368,455 1.2% 146,735,092 1.2% Source: Department of Labor; Bureau of Labor Statistics *Through August
Asheville Total Employment
34,000
35,000
36,000
37,000
38,000
39,000
40,000
41,000
42,000
2004 2005 2006 2007 2008 2009 2010 2011 2012 2013 2014*
Year
Tot
al E
mpl
oyed
Asheville lost approximately 696 jobs representing 1.9% of its employment base in 2009, which is significantly less than the decrease experienced in the overall region during this same time. The city’s employment base has increased by 5,286 jobs, an increase of 4.6% since 2009.
Asheville-15
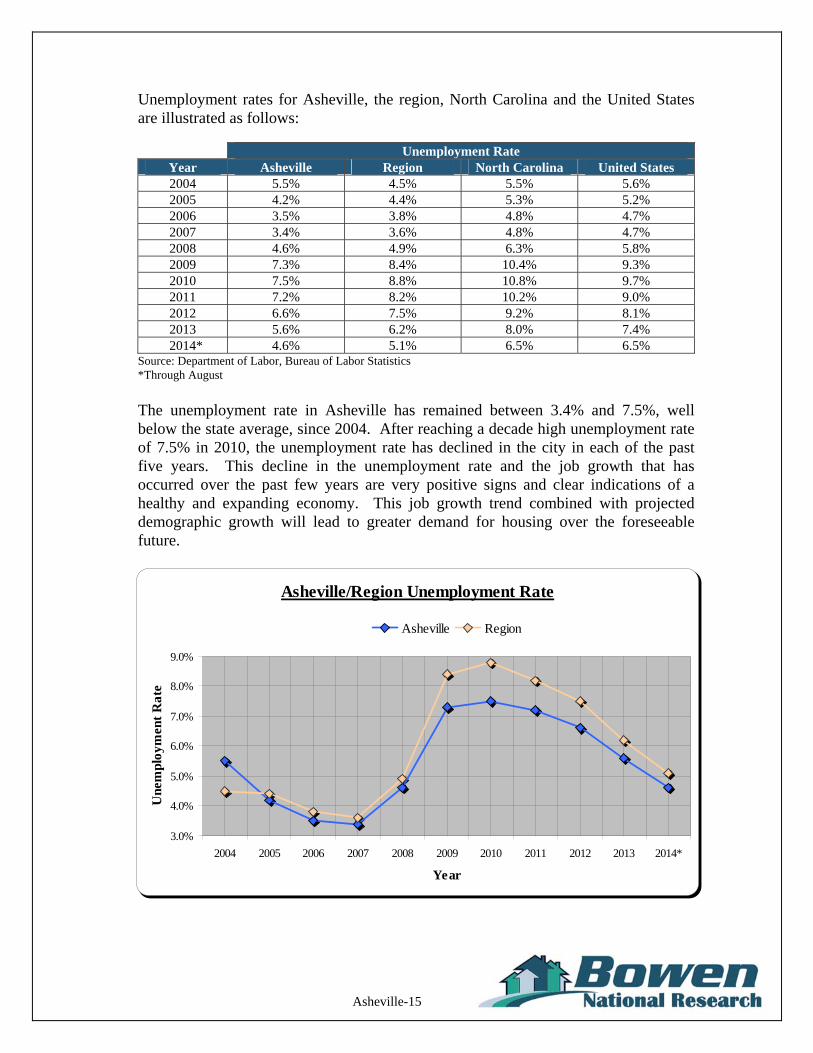
Unemployment rates for Asheville, the region, North Carolina and the United States are illustrated as follows:
Unemployment Rate
Year Asheville Region North Carolina United States 2004 5.5% 4.5% 5.5% 5.6% 2005 4.2% 4.4% 5.3% 5.2% 2006 3.5% 3.8% 4.8% 4.7% 2007 3.4% 3.6% 4.8% 4.7% 2008 4.6% 4.9% 6.3% 5.8% 2009 7.3% 8.4% 10.4% 9.3% 2010 7.5% 8.8% 10.8% 9.7% 2011 7.2% 8.2% 10.2% 9.0% 2012 6.6% 7.5% 9.2% 8.1% 2013 5.6% 6.2% 8.0% 7.4%
2014* 4.6% 5.1% 6.5% 6.5% Source: Department of Labor, Bureau of Labor Statistics *Through August
The unemployment rate in Asheville has remained between 3.4% and 7.5%, well below the state average, since 2004. After reaching a decade high unemployment rate of 7.5% in 2010, the unemployment rate has declined in the city in each of the past five years. This decline in the unemployment rate and the job growth that has occurred over the past few years are very positive signs and clear indications of a healthy and expanding economy. This job growth trend combined with projected demographic growth will lead to greater demand for housing over the foreseeable future.
Asheville/Region Unemployment Rate
3.0%
4.0%
5.0%
6.0%
7.0%
8.0%
9.0%
2004 2005 2006 2007 2008 2009 2010 2011 2012 2013 2014*
Year
Une
mpl
oym
ent
Rat
e
Asheville Region
Asheville-16
The 14 largest employers within the Asheville/Buncombe County are summarized in the following table with the employers headquartered in Asheville denoted with an asterisk (*). The others are located in cities/towns that are in Buncombe County.
Employer Name Business Type
Memorial Mission Hospital* Health Care Buncombe County Board of Education Education
Ingles Markets, Inc.* Grocery Charles George Veterans Administration Medical Center* Federal Government/Health Care
County of Buncombe County Government Walmart Retail/Grocery
City of Asheville* City Government
Eaton Corporation Power Management Company Asheville Buncombe Technical* Education Community CarePartners, Inc.* Health Services
The Biltmore Company* Leisure and Hospitality Omni Hotels Management Corporation* Leisure and Hospitality
Asheville City Schools* Education University of North Carolina, Asheville* Education
Source: ACESSNC, North Carolina Economic Data and Site Information, 2014 1st quarter
According to the representative with the Asheville Chamber of Commerce and Economic Development Coalition of Asheville/Buncombe County, the area economy is healthy and growing. Employment has grown over the past few years at a notable rate and is expected to do so for the foreseeable future. The Downtown Asheville Historic District is reminiscent of late 19th and early 20th century architecture. The downtown draws tourists due to its cultural diversity, preservation efforts and rich heritage. Plans have been made for additional hotels and lodging in the area to accommodate tourists. In April of 2014, owners of the BB&T building in downtown Asheville announced that they will build a 120-room hotel on the site of the current building's parking garage. After the hotel is completed in about 18 months, work will begin on the conversion of the main building into an upscale hotel with 150 to 170 rooms. Six floors with vacation rentals and condominiums for sale will be located above the hotel in the BB&T building. Officials say that the new hotel will be an AC Hotel by Marriott, which is considered an upper moderate tier hotel. The building will be at least nine stories tall and will offer ground-floor retail and parking space. There are at least four other downtown hotel projects in different stages of development. One of the new hotels that opened in 2012 is the Aloft Hotel by the McKibbon Hotel Group. It is a 63,521 square-foot hotel that features 115 loft-style rooms including a third floor outdoor pool and hotel dining. Located along the French Broad River, the River Arts District (RAD) offers artist studios in 22 former factories and historical buildings. There are more than 180 working studios with showrooms and galleries open every day, all year round. The area serves as an employment center within the city.
Asheville-17
In October of 2014, Linemar Corporation announced plans to invest $115 million in its Arden plant near Asheville with plans to add 150 positions. The expansion stems from a new product line for the plant. A building renovation will start this year with hiring expected to begin early 2015.Linamar plans to make transmission gears for the automotive industry at the plant, which now employs about 200 people. GE Aviation, a global leader in jet engine and aircraft system production, hosted a grand opening ceremony on October 15, 2014 at the site of its new advanced composites factory near Asheville. The new 170,000 square-foot facility will be the first in the world to mass produce engine components made of advanced ceramic matrix composite (CMC) materials. The plant’s current workforce of 300 will be expanded by 52 new jobs. Highland Brewing Company announced expansion plans in September 2014 to add 15 jobs and invest $5 million in new equipment and facilities over the next three years. The expansion, which includes tanks and a new bottling line, will increase its brewing capacity to over 60,000 barrels or 828,000 cartons and enable the company to expand their distribution over time. Highland Brewery Company is Asheville’s oldest brewery. BorgWarner, a global technology leader and top automotive industry supplier, announced in May 2014 a plan to expand its turbo systems manufacturing facility in Arden. The expansion will create 154 new engineering and manufacturing jobs in Buncombe County and will invest $55 million in facilities and equipment over the next five years. Also in May 2014, the W.P. Hickman Company announced the expansion of its Asheville-based operations with a $3 million investment in a new production facility. The third generation family-owned and operated company is the premier American manufacturer of metal root edge systems for commercial construction. The company moved its headquarters and manufacturing facilities to the newly renovated facility in Arden. The 80,000 square feet allows the facility to increase its production. The expansion will also enable the company to add additional positions to the existing staff of 52. In February 2014, Sport Hansa LLC, a premier importer and distributor of European outdoor product brands, announced its relocation to Asheville. The firm’s expanded distribution center will allow for continued growth and expansion of product lines that include Helle knives of Norway, Kupika camping dishware of Finland, Montana technical outwear, Terra Nova tents of the United Kingdom, and Wetterlings Axe Works of Sweden. The company is relocating its headquarters and distribution operations from Longmont, Colorado. Also in February 2014, Jacob Holm Industries, a global nonwoven manufacturer, announced the expansion of its manufacturing facility in Candler with over $45.9 million investment in facilities and equipment. The total project could exceed $60 million when it is complete. The investment will bring 66 new positions to
Asheville-18
accommodate the addition of a new product line. The company originally located to Buncombe County in 2005 and currently employs 82 workers. Jacob Holm Industries offers high quality products for personal care, home care, hygiene, packaging and industrial markets. Tourism: According to North Carolina Tourism Department of Commerce, domestic tourism in Buncombe County generated an economic impact of $901.28 million in 2013. This was an 8.04% change from 2012. Also in 2013, Buncombe County ranked 5th in travel impact among North Carolina’s 100 counties. More than 9,700 jobs in Buncombe County were directly attributable to travel and tourism. Travel generated a $190.21 million payroll in 2013. The Buncombe County Tourism Development Authority, through the Tourism Product Development Fund (TPDF), has awarded $15 million for sixteen community tourism projects since 2001 when the occupancy tax rate in Buncombe County was increased from three cents to four cents. The additional cent generates approximately $1.8 million of room tax revenue per year, of which 100 percent is dedicated to the TPDF. The purpose of the TPDF is to provide financial assistance for major tourism projects in order to substantially increase patronage of lodging facilities in Buncombe County. TDPF funds can be awarded to for-profit and non-profit entities as a grant, pledge of debt service or loan guaranty. In October of 2014, the Buncombe County Tourism Development Authority (BCTDA) voted to award five grants, totaling $4,825,000 to five community projects. The grants are made from the TPDF and mark the largest amount awarded since the Fund’s inception in 2001. The recipients of the 2014 funding cycle were: The Enka Center Ball Fields project was awarded $2 million (the largest single
amount ever awarded to one project in the history of the fund) to construct seven new ball fields and facilities in the Enka-Candler area that will enable the region to host traveling youth baseball and college softball tournaments and provide space for local youth sports.
Highland Brewing Company will receive $850,000 for expansion and improvements that will enhance the guest experience, including roof top access, event space and upgraded tour amenities.
The Riverfront Destination Development Project in the city of Asheville was granted $1.8 million for capital improvements along the French Broad River, including a network of visitor amenities such as a Riverfront Arts and Culture Dispensary, pedestrian walkway connections, greenways, boat ramps and train-viewing platform.
Riverlink will receive $25,000 for establishment of commercial-grade river access at the Pearson Bridge to facilitate usage of river experiences and activities.

Asheville-19
The Collider, a project of the Asheville-Buncombe Sustainable Community Initiatives, was awarded $150,000 for creation of a state-of-the-art business and conference facility in downtown which will host primarily mid-week corporate events and leverage the growing demand for expertise from the nearby National Climatic Data Center.
Much of the tourism in Buncombe County is in the Asheville area with one of the biggest tourist attractions being the Biltmore Estate. The Biltmore House, the main house on the estate, is a mansion built by George Washington Vanderbilt II between 1889 and 1895 and it is the largest privately owned house in the United States with 135,280 square feet of living space and 205 rooms. It is still owned by one of Vanderbilt’s descendents and it stands today as one of the most prominent remaining examples of the Gilded Age and English Landscape garden styles in the United States. The Biltmore House was opened to the public in March 1930, then in 1956 the home was opened permanently as a house museum. Visitors can see the 70,000 gallon indoor swimming pool, bowling alley, early 20th century exercise equipment, two-story library, and other rooms filled with artworks, furniture and antiques. The grounds include 75 acres of formal gardens, a winery and the Inn on Biltmore Estate, which is a luxury 210-room hotel. The estate remains a major tourist attraction and has almost one million visitors each year. The estate is owned by the Biltmore Company, which is listed in the top area employers above, and is controlled by Vanderbilt’s grandson. In 1964, the Biltmore Estate was designated a National Historic Landmark.
The Omni Grove Park Inn is a 101 year old historic resort hotel in Asheville. The Inn features 55,000 square feet of event, banquet, convention and meeting space. This includes an 18,000-square-foot Grand Ballroom and an 8,800-square-foot Heritage Ballroom. The inn has 510 guest rooms, 42 meeting rooms and suites, as well as pre-function areas, outdoor terraces, patios and balconies. The resort has been expanded over the years under the direction of the owners, and continues to be a popular tourist attraction. KSL Resorts acquired The Grove Park Inn in 2012 for $120 million. They sold it to Omni Hotels in 2013, and it was renamed The Omni Grove Park Inn and it is one the larger employers in the area. The Omni Grove Park Inn Golf Course is surrounded by the Blue Ridge Mountains and is considered one of the top golf courses in North America. The par-70 course was designed in 1926 out of rolling hills with tree-lined fairways. The course was restored in 2001. Also at the Omni Grove Park Inn, is the Nantahala Outdoor Center, which offers white river rafting, kayak and canoe trips, mountain biking, hiking, climbing and fishing opportunities. There are tour guided and self guided activities and lessons for all of the outdoor activities.
Located next to the Omni Grove Park Inn is the Grovewood Gallery, which showcases 9,000 square feet of handmade American crafts by more than 500 artists. The gallery is known for its second-floor studio furniture collection and outdoor sculpture gardens. The property also includes the Estes-Winn Antique Car Museum, the North Carolina Homespun Museum and the Grovewood Café.

Asheville-20
The downtown area of Asheville is filled with historic buildings, Art Deco architecture, restaurants, bookstores, shops and over 30 art galleries. The Grove Arcade, located downtown, was built in 1920 and features boutiques, craft exhibits, artist galleries and dining for every taste or preference. It also offers live music, tours and an outdoor market. Asheville is in the heart of the Blue Ridge National Heritage Area. Some of the defining landscapes in this National Heritage Area include the deepest gorge in the Eastern United States, Linville Gorge; the oldest river in North America, the New River; the most visited National Park lands in the country, The Great Smoky Mountain National Park and the Blue Ridge Parkway; the highest mountain east of the Rockies, Mt. Mitchell; and America’s largest home, the Biltmore. In addition to the outdoor recreation, art and craft galleries, museums, historic inns and homes, there are many music festivals in the Asheville area. In the summer there are live concerts at the Biltmore Estate. Also in the summer is the Moogfest which is held in Asheville for five days. This festival is most certainly held in Asheville because that is where the Moog Music Factory, which designs and manufactures Moog synthesizers and other electronic instruments, is located. Other music festivals are Festival of Native Peoples held every summer at the Cherokee Indian Fairgrounds; Folkmoot USA, which is a festival of folk music and dance; the Mountain Dance and Folk Festival is also held in July; and Shindig of the Green, which has featured bluegrass song and dance for 4 decades in the summer. In November of each year, the National Gingerbread House Competition is held at the Omni Grove Park Inn and 2015 will be the 22nd year of this popular competition.
WARN (layoff notices): According to the North Carolina Workforce Development website (www.nccommerce.com), there have been no WARN notices of large-scale layoffs or closures reported for the Asheville area since January 2013.
Asheville-21
E. Housing Supply
This housing supply analysis considers both rental and owner for-sale housing. Understanding the historical trends, market performance, characteristics, composition, and current housing choices provide critical information as to current market conditions and future housing potential. The housing data presented and analyzed in this section includes primary data collected directly by Bowen National Research and from secondary data sources including American Community Survey (ACS), U.S. Census housing information and data provided by various government entities and real estate professionals. While there are a variety of housing alternatives offered in Asheville, we focused our analysis on the most common alternatives. The housing structures included in this analysis are:
Rental Housing – Multifamily rentals, typically with three or more units were inventoried and surveyed. Additionally, rentals with fewer than three units, which were classified as non-conventional rentals, were identified and surveyed. Other rentals such as vacation homes, home stays (short-term room rentals), and mobile homes were evaluated.
Owner For-Sale Housing – We identified attached and detached for-sale housing,
which may be part of a planned development or community, as well as attached multifamily housing such as condominiums. Both historical (homes sold between January of 2010 and November of 2014) and available for-sale homes were evaluated.
Senior Care Housing – Facilities providing housing for seniors requiring some level of care, such as independent living, multi-unit assisted housing, adult care homes, and nursing homes, were surveyed and analyzed.
This analysis includes secondary Census housing data, Bowen National Research’s survey of area rental alternatives and senior care facilities, and owner for-sale housing data (both historical sales and available housing alternatives) obtained from secondary data sources (Multiple Listing Service, REALTOR.com, and other on-line sources) and mobile home parks (Bowen National Research and various secondary sources). Finally, we contacted local building and planning departments to determine if any residential units of notable scale were currently planned or under review by local government. Any such units were considered in the housing gap estimates included later in this section.
Asheville-22
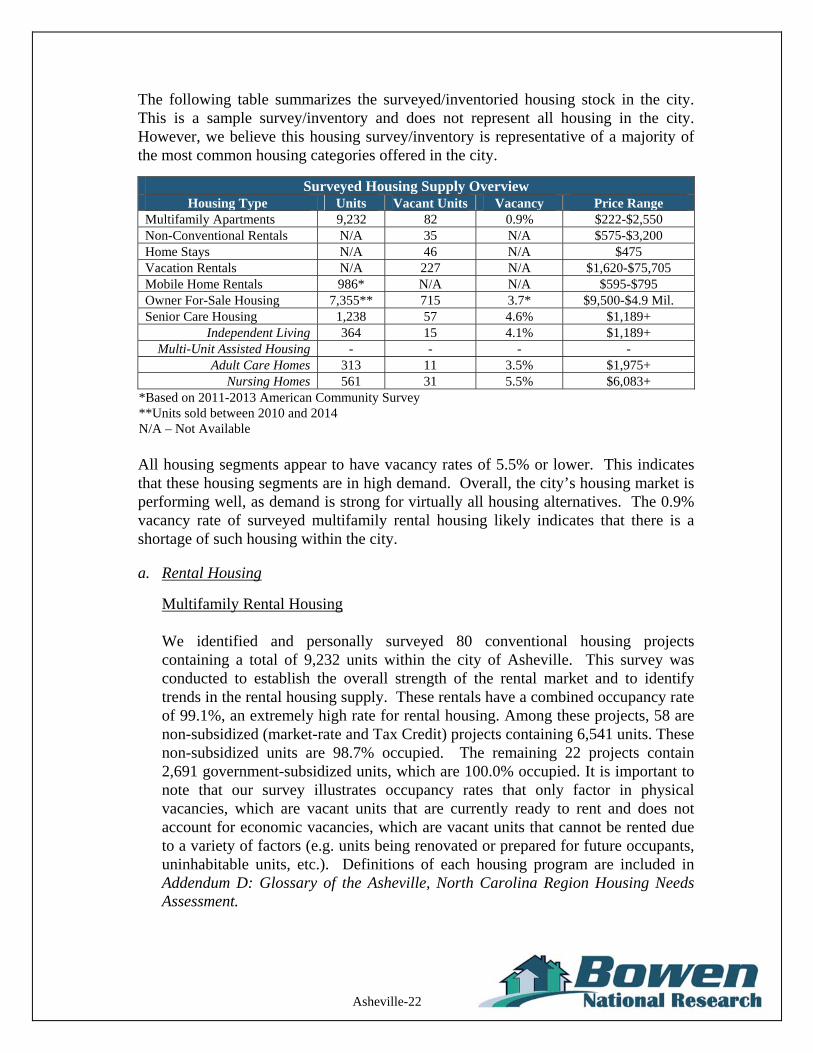
The following table summarizes the surveyed/inventoried housing stock in the city. This is a sample survey/inventory and does not represent all housing in the city. However, we believe this housing survey/inventory is representative of a majority of the most common housing categories offered in the city.
Surveyed Housing Supply Overview Housing Type Units Vacant Units Vacancy Price Range
Multifamily Apartments 9,232 82 0.9% $222-$2,550 Non-Conventional Rentals N/A 35 N/A $575-$3,200 Home Stays N/A 46 N/A $475 Vacation Rentals N/A 227 N/A $1,620-$75,705 Mobile Home Rentals 986* N/A N/A $595-$795 Owner For-Sale Housing 7,355** 715 3.7* $9,500-$4.9 Mil. Senior Care Housing 1,238 57 4.6% $1,189+
Independent Living 364 15 4.1% $1,189+ Multi-Unit Assisted Housing - - - -
Adult Care Homes 313 11 3.5% $1,975+ Nursing Homes 561 31 5.5% $6,083+
*Based on 2011-2013 American Community Survey **Units sold between 2010 and 2014 N/A – Not Available
All housing segments appear to have vacancy rates of 5.5% or lower. This indicates that these housing segments are in high demand. Overall, the city’s housing market is performing well, as demand is strong for virtually all housing alternatives. The 0.9% vacancy rate of surveyed multifamily rental housing likely indicates that there is a shortage of such housing within the city.
a. Rental Housing
Multifamily Rental Housing We identified and personally surveyed 80 conventional housing projects containing a total of 9,232 units within the city of Asheville. This survey was conducted to establish the overall strength of the rental market and to identify trends in the rental housing supply. These rentals have a combined occupancy rate of 99.1%, an extremely high rate for rental housing. Among these projects, 58 are non-subsidized (market-rate and Tax Credit) projects containing 6,541 units. These non-subsidized units are 98.7% occupied. The remaining 22 projects contain 2,691 government-subsidized units, which are 100.0% occupied. It is important to note that our survey illustrates occupancy rates that only factor in physical vacancies, which are vacant units that are currently ready to rent and does not account for economic vacancies, which are vacant units that cannot be rented due to a variety of factors (e.g. units being renovated or prepared for future occupants, uninhabitable units, etc.). Definitions of each housing program are included in Addendum D: Glossary of the Asheville, North Carolina Region Housing Needs Assessment.
Asheville-23
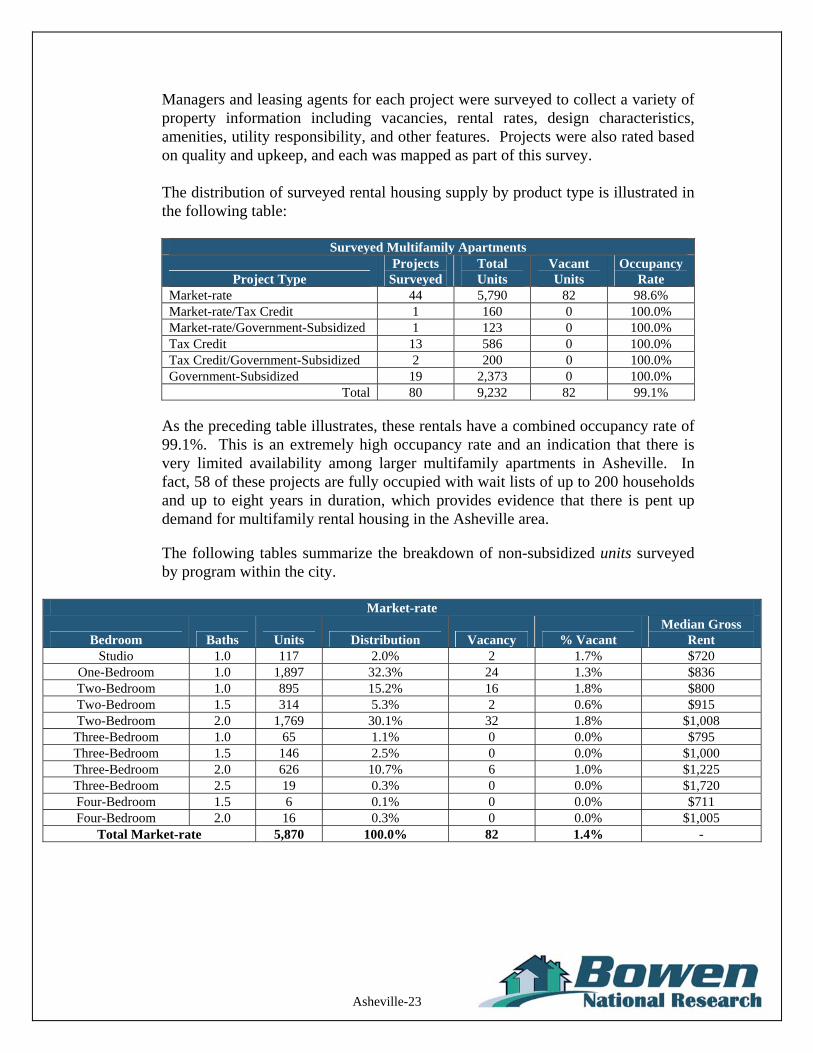
Managers and leasing agents for each project were surveyed to collect a variety of property information including vacancies, rental rates, design characteristics, amenities, utility responsibility, and other features. Projects were also rated based on quality and upkeep, and each was mapped as part of this survey. The distribution of surveyed rental housing supply by product type is illustrated in the following table:
Surveyed Multifamily Apartments
Project Type Projects
Surveyed Total Units
Vacant Units
Occupancy Rate
Market-rate 44 5,790 82 98.6% Market-rate/Tax Credit 1 160 0 100.0% Market-rate/Government-Subsidized 1 123 0 100.0% Tax Credit 13 586 0 100.0% Tax Credit/Government-Subsidized 2 200 0 100.0% Government-Subsidized 19 2,373 0 100.0%
Total 80 9,232 82 99.1%
As the preceding table illustrates, these rentals have a combined occupancy rate of 99.1%. This is an extremely high occupancy rate and an indication that there is very limited availability among larger multifamily apartments in Asheville. In fact, 58 of these projects are fully occupied with wait lists of up to 200 households and up to eight years in duration, which provides evidence that there is pent up demand for multifamily rental housing in the Asheville area. The following tables summarize the breakdown of non-subsidized units surveyed by program within the city.
Market-rate
Bedroom Baths Units Distribution Vacancy % Vacant Median Gross
Rent Studio 1.0 117 2.0% 2 1.7% $720
One-Bedroom 1.0 1,897 32.3% 24 1.3% $836 Two-Bedroom 1.0 895 15.2% 16 1.8% $800 Two-Bedroom 1.5 314 5.3% 2 0.6% $915 Two-Bedroom 2.0 1,769 30.1% 32 1.8% $1,008 Three-Bedroom 1.0 65 1.1% 0 0.0% $795 Three-Bedroom 1.5 146 2.5% 0 0.0% $1,000 Three-Bedroom 2.0 626 10.7% 6 1.0% $1,225 Three-Bedroom 2.5 19 0.3% 0 0.0% $1,720 Four-Bedroom 1.5 6 0.1% 0 0.0% $711 Four-Bedroom 2.0 16 0.3% 0 0.0% $1,005
Total Market-rate 5,870 100.0% 82 1.4% -

Asheville-24
Tax Credit, Non-Subsidized
Bedroom Baths Units Distribution Vacancy % Vacant Median Gross
Rent Studio 1.0 15 2.2% 0 0.0% $222
One-Bedroom 1.0 298 44.4% 0 0.0% $467 Two-Bedroom 1.0 250 37.3% 0 0.0% $536 Three-Bedroom 1.0 58 8.6% 0 0.0% $658 Three-Bedroom 2.0 38 5.7% 0 0.0% $539 Four-Bedroom 1.5 10 1.5% 0 0.0% $706 Four-Bedroom 2.0 2 0.3% 0 0.0% $335
Total Tax Credit 671 100.0% 0 0.0% -
The market-rate units are 98.6% occupied and the Tax Credit units are 100.0% occupied. While both occupancy rates are high, the 100.0% occupancy rate among the Tax Credit units and the wait lists for these units indicate that there is pent-up demand for such units. Median collected rents by bedroom type range from $711 to $720 for the market-rate units and from $222 to $706 for Tax Credit units. It is important to note that very few of the identified multifamily projects offer four-bedroom or larger units. As such, there appear to be no multifamily rental options for larger family households seeking housing within Asheville. As a result, family households seeking four-bedroom rental alternatives in Asheville most likely must choose from non-conventional rentals, which typically have higher rents, fewer amenities and are of lower quality than many multifamily options.
There are 22 multifamily projects that were surveyed in Asheville that operate with a government-subsidy. The distribution of units and vacancies by bedroom type among government-subsidized projects (both with and without Tax Credits) in Asheville is summarized as follows.
Subsidized Tax Credit
Bedroom Baths Units Distribution Vacancy % Vacant One-Bedroom 1.0 37 18.5% 0 0.0% Two-Bedroom 1.0 89 44.5% 0 0.0% Three-Bedroom 1.0 54 27.0% 0 0.0% Four-Bedroom 1.5 20 10.0% 0 0.0%
Total Subsidized Tax Credit 200 100.0% 0 0.0%
Asheville-25
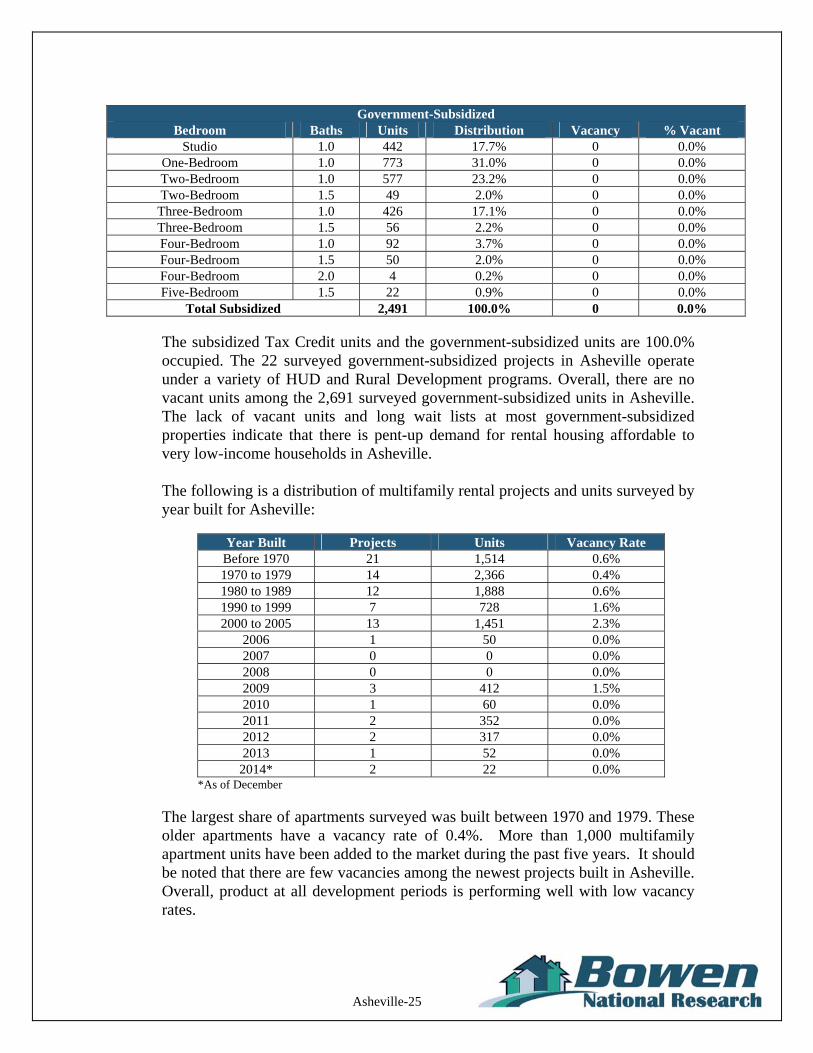
Government-Subsidized
Bedroom Baths Units Distribution Vacancy % Vacant Studio 1.0 442 17.7% 0 0.0%
One-Bedroom 1.0 773 31.0% 0 0.0% Two-Bedroom 1.0 577 23.2% 0 0.0% Two-Bedroom 1.5 49 2.0% 0 0.0% Three-Bedroom 1.0 426 17.1% 0 0.0% Three-Bedroom 1.5 56 2.2% 0 0.0% Four-Bedroom 1.0 92 3.7% 0 0.0% Four-Bedroom 1.5 50 2.0% 0 0.0% Four-Bedroom 2.0 4 0.2% 0 0.0% Five-Bedroom 1.5 22 0.9% 0 0.0%
Total Subsidized 2,491 100.0% 0 0.0%
The subsidized Tax Credit units and the government-subsidized units are 100.0% occupied. The 22 surveyed government-subsidized projects in Asheville operate under a variety of HUD and Rural Development programs. Overall, there are no vacant units among the 2,691 surveyed government-subsidized units in Asheville. The lack of vacant units and long wait lists at most government-subsidized properties indicate that there is pent-up demand for rental housing affordable to very low-income households in Asheville. The following is a distribution of multifamily rental projects and units surveyed by year built for Asheville:
Year Built Projects Units Vacancy Rate Before 1970 21 1,514 0.6% 1970 to 1979 14 2,366 0.4% 1980 to 1989 12 1,888 0.6% 1990 to 1999 7 728 1.6% 2000 to 2005 13 1,451 2.3%
2006 1 50 0.0% 2007 0 0 0.0% 2008 0 0 0.0% 2009 3 412 1.5% 2010 1 60 0.0% 2011 2 352 0.0% 2012 2 317 0.0% 2013 1 52 0.0%
2014* 2 22 0.0% *As of December
The largest share of apartments surveyed was built between 1970 and 1979. These older apartments have a vacancy rate of 0.4%. More than 1,000 multifamily apartment units have been added to the market during the past five years. It should be noted that there are few vacancies among the newest projects built in Asheville. Overall, product at all development periods is performing well with low vacancy rates.
Asheville-26
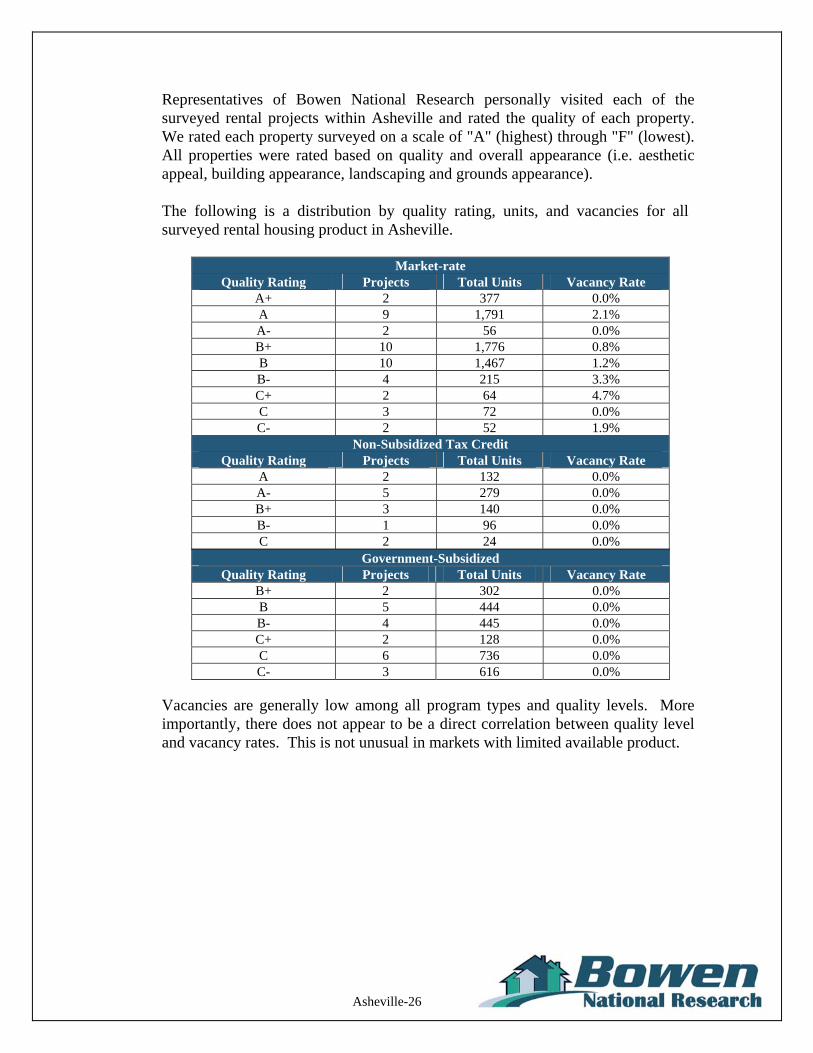
Representatives of Bowen National Research personally visited each of the surveyed rental projects within Asheville and rated the quality of each property. We rated each property surveyed on a scale of "A" (highest) through "F" (lowest). All properties were rated based on quality and overall appearance (i.e. aesthetic appeal, building appearance, landscaping and grounds appearance). The following is a distribution by quality rating, units, and vacancies for all surveyed rental housing product in Asheville.
Market-rate
Quality Rating Projects Total Units Vacancy Rate A+ 2 377 0.0% A 9 1,791 2.1% A- 2 56 0.0% B+ 10 1,776 0.8% B 10 1,467 1.2% B- 4 215 3.3% C+ 2 64 4.7% C 3 72 0.0% C- 2 52 1.9%
Non-Subsidized Tax Credit Quality Rating Projects Total Units Vacancy Rate
A 2 132 0.0% A- 5 279 0.0% B+ 3 140 0.0% B- 1 96 0.0% C 2 24 0.0%
Government-Subsidized Quality Rating Projects Total Units Vacancy Rate
B+ 2 302 0.0% B 5 444 0.0% B- 4 445 0.0% C+ 2 128 0.0% C 6 736 0.0% C- 3 616 0.0%
Vacancies are generally low among all program types and quality levels. More importantly, there does not appear to be a direct correlation between quality level and vacancy rates. This is not unusual in markets with limited available product.
Asheville-27
Non-Conventional Rental Housing
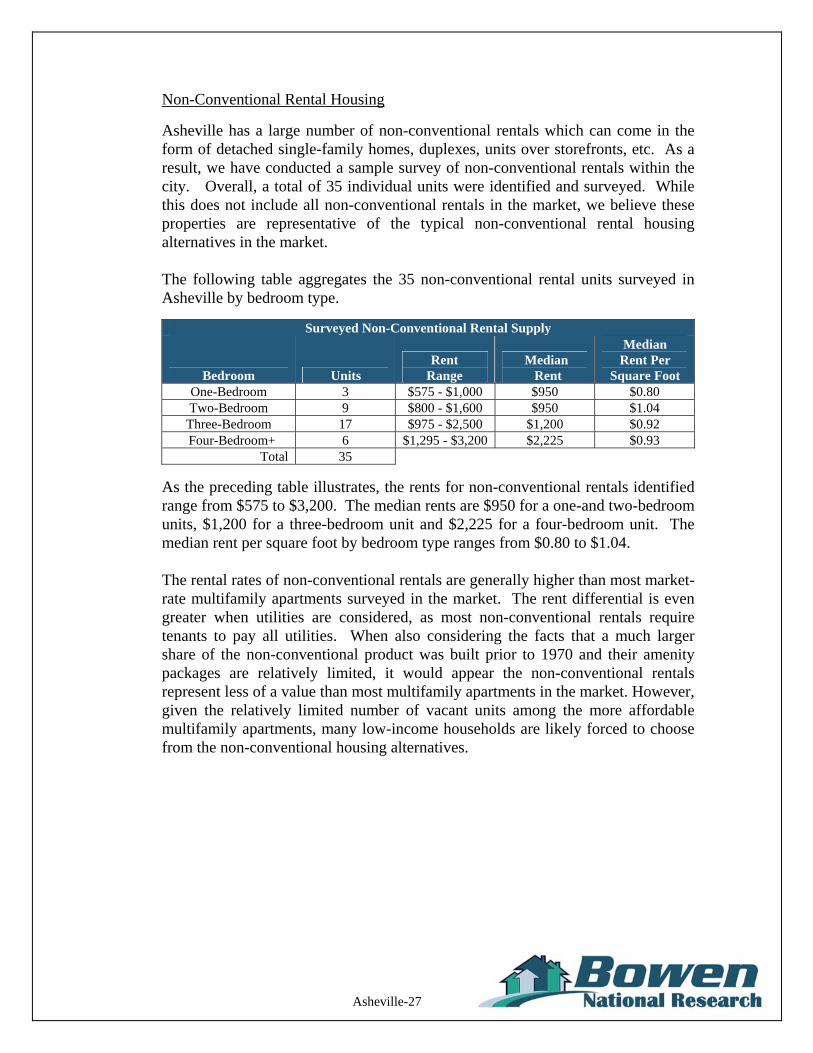
Asheville has a large number of non-conventional rentals which can come in the form of detached single-family homes, duplexes, units over storefronts, etc. As a result, we have conducted a sample survey of non-conventional rentals within the city. Overall, a total of 35 individual units were identified and surveyed. While this does not include all non-conventional rentals in the market, we believe these properties are representative of the typical non-conventional rental housing alternatives in the market. The following table aggregates the 35 non-conventional rental units surveyed in Asheville by bedroom type.
Surveyed Non-Conventional Rental Supply
Bedroom Units Rent
Range Median Rent
Median Rent Per
Square Foot One-Bedroom 3 $575 - $1,000 $950 $0.80 Two-Bedroom 9 $800 - $1,600 $950 $1.04 Three-Bedroom 17 $975 - $2,500 $1,200 $0.92
Four-Bedroom+ 6 $1,295 - $3,200 $2,225 $0.93 Total 35
As the preceding table illustrates, the rents for non-conventional rentals identified range from $575 to $3,200. The median rents are $950 for a one-and two-bedroom units, $1,200 for a three-bedroom unit and $2,225 for a four-bedroom unit. The median rent per square foot by bedroom type ranges from $0.80 to $1.04. The rental rates of non-conventional rentals are generally higher than most market-rate multifamily apartments surveyed in the market. The rent differential is even greater when utilities are considered, as most non-conventional rentals require tenants to pay all utilities. When also considering the facts that a much larger share of the non-conventional product was built prior to 1970 and their amenity packages are relatively limited, it would appear the non-conventional rentals represent less of a value than most multifamily apartments in the market. However, given the relatively limited number of vacant units among the more affordable multifamily apartments, many low-income households are likely forced to choose from the non-conventional housing alternatives.

Asheville-28
Vacation Rental Housing
The city of Asheville has a large number of vacation rentals which can come in the form of cabins, detached single-family homes, condominiums, etc. As a result, we have conducted a sample survey of vacation rentals within the city. Overall, a total of 227 individual units were identified and surveyed. While this does not include all vacation rentals in the market, we believe these properties are representative of the typical vacation rental housing alternatives in the market. The following table aggregates the 277 vacation rental units surveyed in the city by bedroom type.
Surveyed Vacation Rental Supply Bedroom Units Rent Range* Median Rent
One-Bedroom 58 $1,620 - $28,500 $4,575 Two-Bedroom 67 $2,400 - $12,720 $5,250 Three-Bedroom 61 $3,750 - $16,260 $6,300
Four-Bedroom+ 41 $4,320 - $75,705 $10,965 Total 227
Source: www.homeaway.com; Bowen National Research *Monthly Rents (most rentals are rented on a daily or weekly rate, but were converted to a monthly rent for an easier comparison with long-term rentals)
As the preceding table illustrates, the rents for vacation rentals identified range from $1,620 to $75,705. The median rents were $4,575 for a one-bedroom unit, $5,250 for a two-bedroom unit, $6,300 for a three-bedroom unit, and $10,965 for a four-bedroom or larger unit. The rental rates of vacation rentals are significantly higher than most conventional multifamily apartments and non-conventional rentals surveyed in the city. Generally, such rentals are at least four times higher than conventional rentals, essentially eliminating this type of housing as a viable long-term housing alternative to most area renters. However, due to this rent differential, such housing may appeal to owners of traditional, long-term conventional rentals who may want to convert their housing to vacation rentals. This is addressed in the case study portion of the Asheville, North Carolina Region Housing Needs Assessment.
Asheville-29
Home Stay Rentals
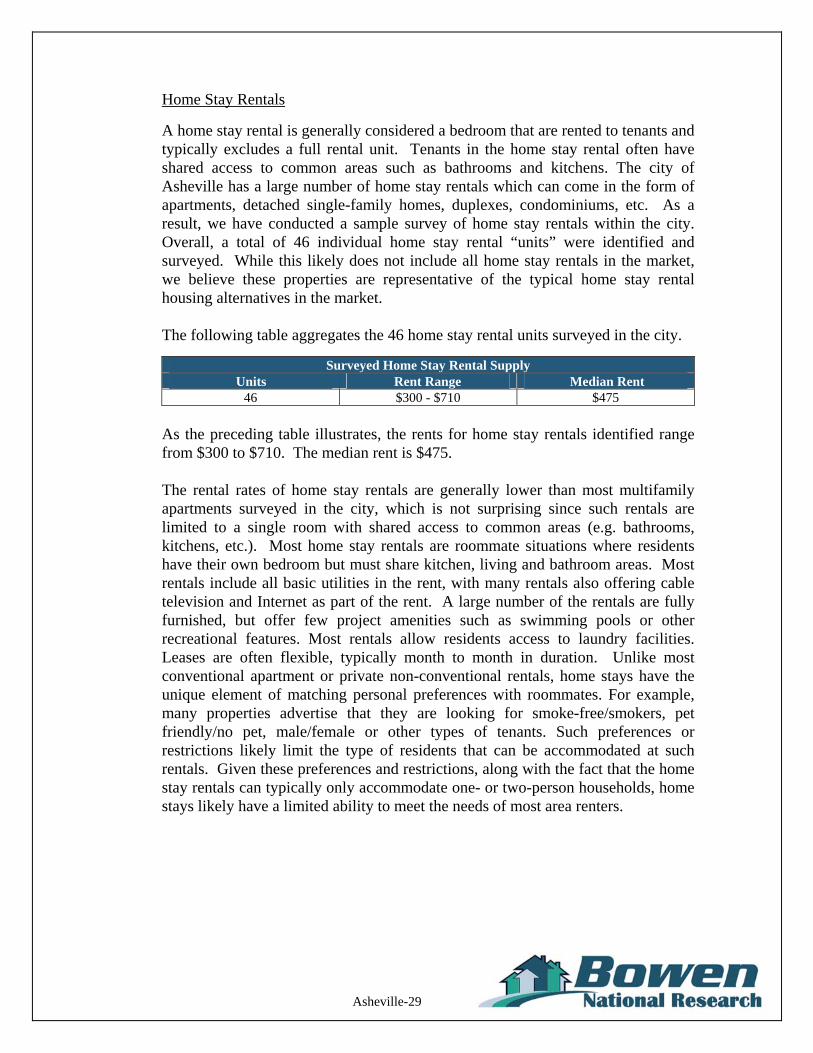
A home stay rental is generally considered a bedroom that are rented to tenants and typically excludes a full rental unit. Tenants in the home stay rental often have shared access to common areas such as bathrooms and kitchens. The city of Asheville has a large number of home stay rentals which can come in the form of apartments, detached single-family homes, duplexes, condominiums, etc. As a result, we have conducted a sample survey of home stay rentals within the city. Overall, a total of 46 individual home stay rental “units” were identified and surveyed. While this likely does not include all home stay rentals in the market, we believe these properties are representative of the typical home stay rental housing alternatives in the market. The following table aggregates the 46 home stay rental units surveyed in the city.
Surveyed Home Stay Rental Supply Units Rent Range Median Rent
46 $300 - $710 $475
As the preceding table illustrates, the rents for home stay rentals identified range from $300 to $710. The median rent is $475. The rental rates of home stay rentals are generally lower than most multifamily apartments surveyed in the city, which is not surprising since such rentals are limited to a single room with shared access to common areas (e.g. bathrooms, kitchens, etc.). Most home stay rentals are roommate situations where residents have their own bedroom but must share kitchen, living and bathroom areas. Most rentals include all basic utilities in the rent, with many rentals also offering cable television and Internet as part of the rent. A large number of the rentals are fully furnished, but offer few project amenities such as swimming pools or other recreational features. Most rentals allow residents access to laundry facilities. Leases are often flexible, typically month to month in duration. Unlike most conventional apartment or private non-conventional rentals, home stays have the unique element of matching personal preferences with roommates. For example, many properties advertise that they are looking for smoke-free/smokers, pet friendly/no pet, male/female or other types of tenants. Such preferences or restrictions likely limit the type of residents that can be accommodated at such rentals. Given these preferences and restrictions, along with the fact that the home stay rentals can typically only accommodate one- or two-person households, home stays likely have a limited ability to meet the needs of most area renters.
Asheville-30
Mobile Home Parks
Bowen National Research identified 34 mobile home parks in Asheville through secondary resources, such as www.mhvillage.com, the county tax department/assessor, and CraigsList. Upon identification of these parks, which is not a comprehensive list, we conducted a sample windshield survey to evaluate the quality of select parks and their neighborhoods, and we attempted to conduct telephone interviews with park operators to gather rental property data. Surveyed park operators stated that lot rents range from $265 to $410 per month. Lot rents vary dependent upon the need for a single-, double- or triple-wide lot. One mobile home park leases mobile homes on the lot as well, ranging from $595 to $795 per month, depending on size. Park operators reported that lot rents and occupancies have increased or stayed the same in recent years. Respondents reported typical occupancy rates of 80% to 90%, with one park reporting a 100% occupancy rate. Park operators commented that the quality varies based on the ownership/management of the park, but that typically the parks are in fair condition. A windshield survey of select mobile home parks in the city yielded “B" to “C-” quality and neighborhood ratings, indicating that these mobile home parks and their neighborhoods are in good to fair condition. When asked if there are any issues or problems associated with operating or maintaining a mobile home park in the area, or what recommendations the respondents may have that the local government could do to aid in mobile home park living, Bowen National Research received a variety of responses. Responses included that the city of Asheville does not allow mobile home parks within the city limits, creating a negative stigma of parks. Better zoning and rules and regulations should be put into place for the maintenance and beautification of mobile home parks, similar to a homeowner’s association. Respondents stated that mobile home living is some of the most affordable to area residents and that more should be done to promote this type of housing.
Asheville-31
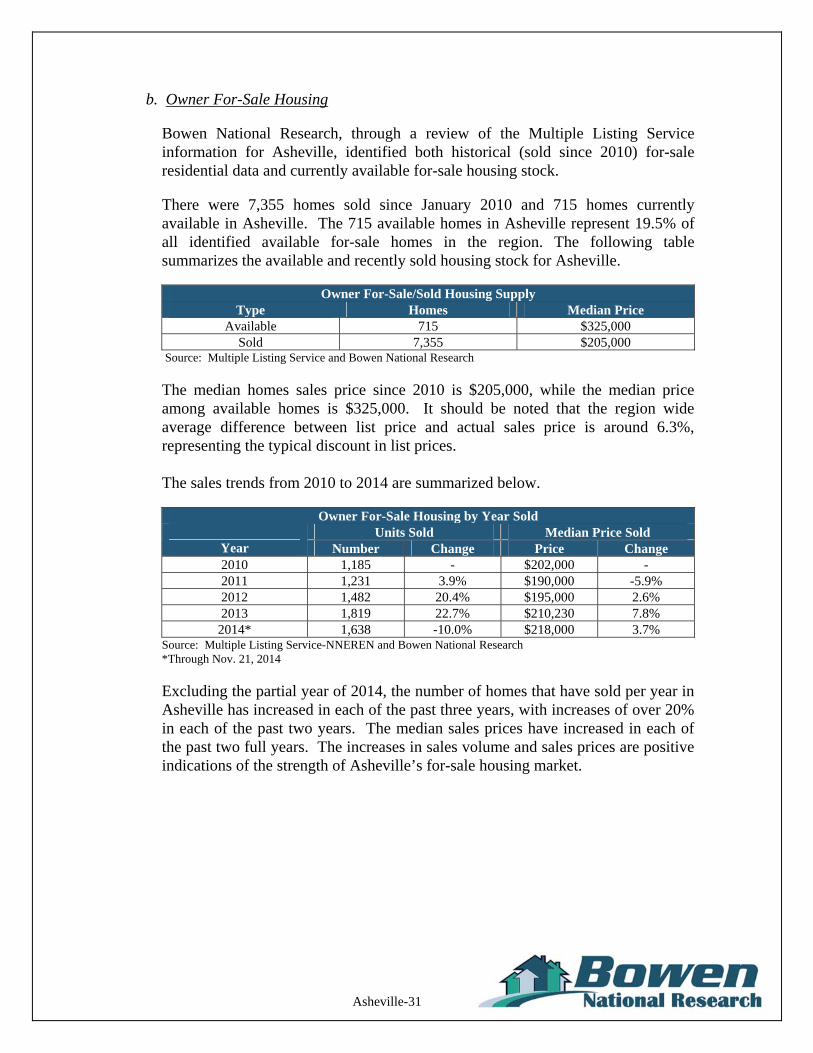
b. Owner For-Sale Housing
Bowen National Research, through a review of the Multiple Listing Service information for Asheville, identified both historical (sold since 2010) for-sale residential data and currently available for-sale housing stock.
There were 7,355 homes sold since January 2010 and 715 homes currently available in Asheville. The 715 available homes in Asheville represent 19.5% of all identified available for-sale homes in the region. The following table summarizes the available and recently sold housing stock for Asheville.
Owner For-Sale/Sold Housing Supply
Type Homes Median Price Available 715 $325,000
Sold 7,355 $205,000 Source: Multiple Listing Service and Bowen National Research
The median homes sales price since 2010 is $205,000, while the median price among available homes is $325,000. It should be noted that the region wide average difference between list price and actual sales price is around 6.3%, representing the typical discount in list prices. The sales trends from 2010 to 2014 are summarized below.
Owner For-Sale Housing by Year Sold
Units Sold Median Price Sold Year Number Change Price Change 2010 1,185 - $202,000 - 2011 1,231 3.9% $190,000 -5.9% 2012 1,482 20.4% $195,000 2.6% 2013 1,819 22.7% $210,230 7.8%
2014* 1,638 -10.0% $218,000 3.7% Source: Multiple Listing Service-NNEREN and Bowen National Research *Through Nov. 21, 2014
Excluding the partial year of 2014, the number of homes that have sold per year in Asheville has increased in each of the past three years, with increases of over 20% in each of the past two years. The median sales prices have increased in each of the past two full years. The increases in sales volume and sales prices are positive indications of the strength of Asheville’s for-sale housing market.

Asheville-32
The following graphs illustrate the overall annual number of homes sold and median sales prices over the past four years for Asheville from 2010 to 2013 (2014 was excluded due to the fact that only partial year data is available):
Asheville Annual Home Sales (2010-2013)
1,1851,231
1,819
1,482
1,150
1,250
1,350
1,450
1,550
1,650
1,750
1,850
2010 2011 2012 2013
Year
Hom
es S
old
Asheville Annual Median Sales Price (2010-2013)
$210,230
$195,000
$190,000
$202,000
$185,000
$190,000
$195,000
$200,000
$205,000
$210,000
$215,000
2010 2011 2012 2013
Year
Pri
ce
Asheville-33
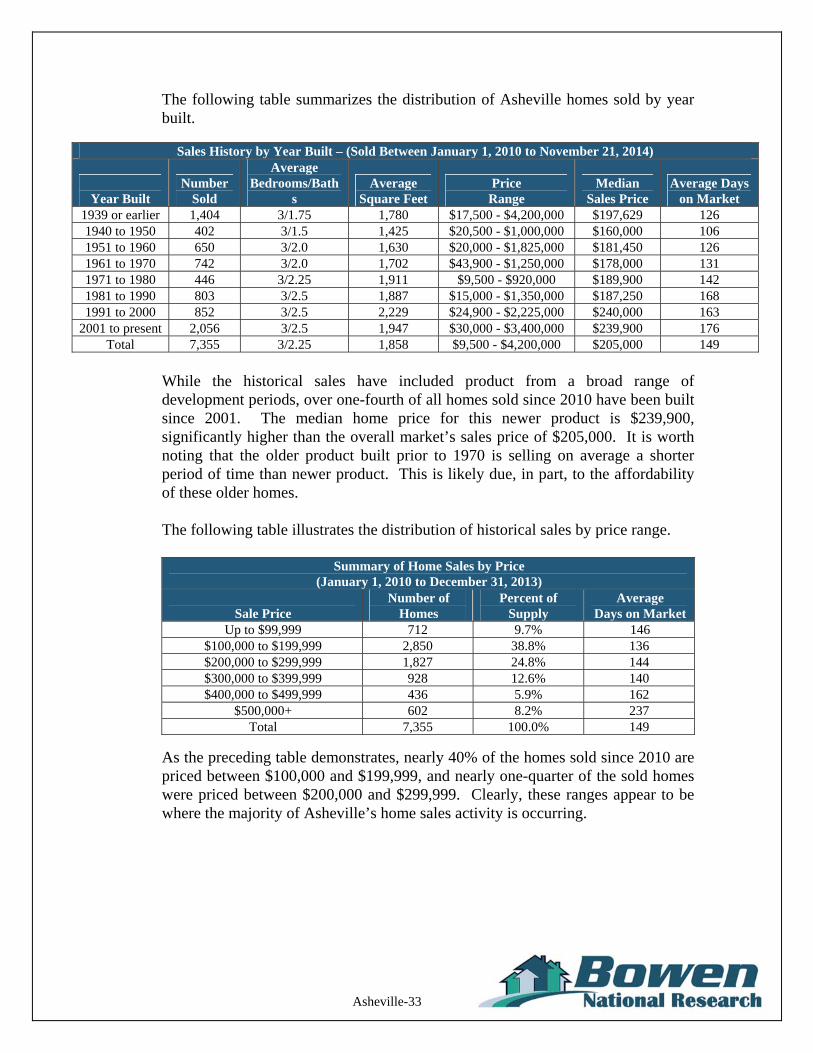
The following table summarizes the distribution of Asheville homes sold by year built.
Sales History by Year Built – (Sold Between January 1, 2010 to November 21, 2014)
Year Built
Number Sold
Average Bedrooms/Bath
s Average
Square Feet Price
Range Median
Sales Price Average Days
on Market 1939 or earlier 1,404 3/1.75 1,780 $17,500 - $4,200,000 $197,629 126 1940 to 1950 402 3/1.5 1,425 $20,500 - $1,000,000 $160,000 106 1951 to 1960 650 3/2.0 1,630 $20,000 - $1,825,000 $181,450 126 1961 to 1970 742 3/2.0 1,702 $43,900 - $1,250,000 $178,000 131 1971 to 1980 446 3/2.25 1,911 $9,500 - $920,000 $189,900 142 1981 to 1990 803 3/2.5 1,887 $15,000 - $1,350,000 $187,250 168 1991 to 2000 852 3/2.5 2,229 $24,900 - $2,225,000 $240,000 163
2001 to present 2,056 3/2.5 1,947 $30,000 - $3,400,000 $239,900 176 Total 7,355 3/2.25 1,858 $9,500 - $4,200,000 $205,000 149
While the historical sales have included product from a broad range of development periods, over one-fourth of all homes sold since 2010 have been built since 2001. The median home price for this newer product is $239,900, significantly higher than the overall market’s sales price of $205,000. It is worth noting that the older product built prior to 1970 is selling on average a shorter period of time than newer product. This is likely due, in part, to the affordability of these older homes. The following table illustrates the distribution of historical sales by price range.
Summary of Home Sales by Price
(January 1, 2010 to December 31, 2013)
Sale Price Number of
Homes Percent of
Supply Average
Days on Market Up to $99,999 712 9.7% 146
$100,000 to $199,999 2,850 38.8% 136 $200,000 to $299,999 1,827 24.8% 144 $300,000 to $399,999 928 12.6% 140 $400,000 to $499,999 436 5.9% 162
$500,000+ 602 8.2% 237 Total 7,355 100.0% 149
As the preceding table demonstrates, nearly 40% of the homes sold since 2010 are priced between $100,000 and $199,999, and nearly one-quarter of the sold homes were priced between $200,000 and $299,999. Clearly, these ranges appear to be where the majority of Asheville’s home sales activity is occurring.
Asheville-34
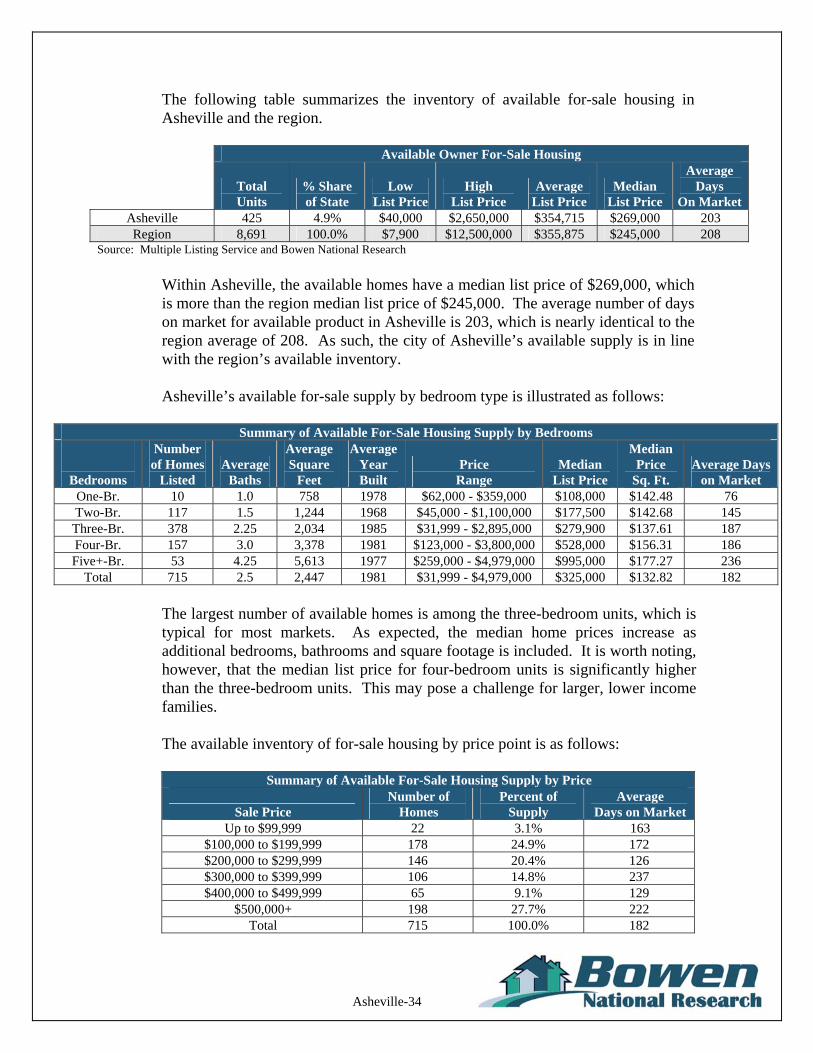
The following table summarizes the inventory of available for-sale housing in Asheville and the region.
Available Owner For-Sale Housing
Total Units
% Share of State
Low List Price
High List Price
Average List Price
Median List Price
Average Days
On MarketAsheville 425 4.9% $40,000 $2,650,000 $354,715 $269,000 203 Region 8,691 100.0% $7,900 $12,500,000 $355,875 $245,000 208
Source: Multiple Listing Service and Bowen National Research
Within Asheville, the available homes have a median list price of $269,000, which is more than the region median list price of $245,000. The average number of days on market for available product in Asheville is 203, which is nearly identical to the region average of 208. As such, the city of Asheville’s available supply is in line with the region’s available inventory. Asheville’s available for-sale supply by bedroom type is illustrated as follows:
Summary of Available For-Sale Housing Supply by Bedrooms
Bedrooms
Number of Homes
Listed Average
Baths
Average Square
Feet
Average Year Built
Price Range
Median List Price
Median Price
Sq. Ft. Average Days
on Market One-Br. 10 1.0 758 1978 $62,000 - $359,000 $108,000 $142.48 76 Two-Br. 117 1.5 1,244 1968 $45,000 - $1,100,000 $177,500 $142.68 145 Three-Br. 378 2.25 2,034 1985 $31,999 - $2,895,000 $279,900 $137.61 187 Four-Br. 157 3.0 3,378 1981 $123,000 - $3,800,000 $528,000 $156.31 186 Five+-Br. 53 4.25 5,613 1977 $259,000 - $4,979,000 $995,000 $177.27 236
Total 715 2.5 2,447 1981 $31,999 - $4,979,000 $325,000 $132.82 182
The largest number of available homes is among the three-bedroom units, which is typical for most markets. As expected, the median home prices increase as additional bedrooms, bathrooms and square footage is included. It is worth noting, however, that the median list price for four-bedroom units is significantly higher than the three-bedroom units. This may pose a challenge for larger, lower income families. The available inventory of for-sale housing by price point is as follows:
Summary of Available For-Sale Housing Supply by Price
Sale Price Number of
Homes Percent of
Supply Average
Days on Market Up to $99,999 22 3.1% 163
$100,000 to $199,999 178 24.9% 172 $200,000 to $299,999 146 20.4% 126 $300,000 to $399,999 106 14.8% 237 $400,000 to $499,999 65 9.1% 129
$500,000+ 198 27.7% 222 Total 715 100.0% 182
Asheville-35
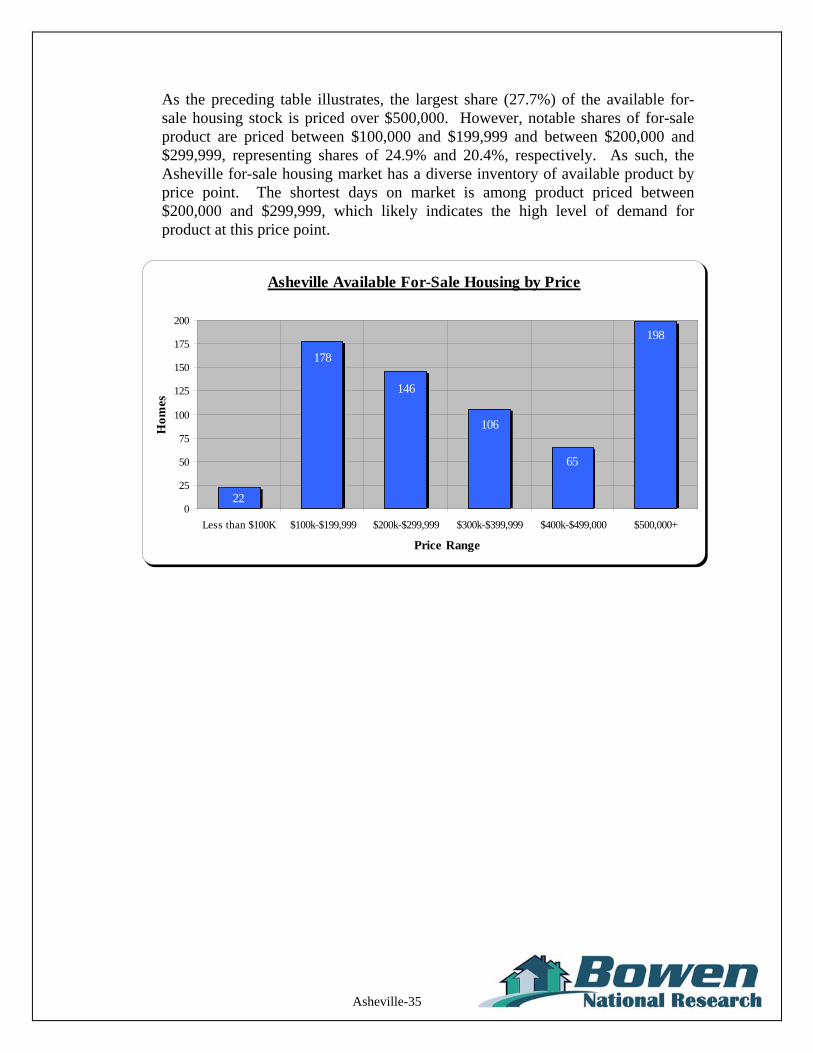
As the preceding table illustrates, the largest share (27.7%) of the available for-sale housing stock is priced over $500,000. However, notable shares of for-sale product are priced between $100,000 and $199,999 and between $200,000 and $299,999, representing shares of 24.9% and 20.4%, respectively. As such, the Asheville for-sale housing market has a diverse inventory of available product by price point. The shortest days on market is among product priced between $200,000 and $299,999, which likely indicates the high level of demand for product at this price point.
Asheville Available For-Sale Housing by Price
198
106
178
22
146
65
0
25
50
75
100
125
150
175
200
Less than $100K $100k-$199,999 $200k-$299,999 $300k-$399,999 $400k-$499,000 $500,000+
Price Range
Hom
es

Asheville-36
c. Senior Care Facilities
The subject city, like areas throughout the country, has a large senior population that requires a variety of senior housing alternatives to meet its diverse needs. Among seniors, generally age 62 or older, some individuals are either seeking a more leisurely lifestyle or need assistance with Activities of Daily Living (ADLs). As part of this analysis, we evaluated four levels of care that typically respond to older adults seeking, or who need, alternatives to their current living environment. They include independent living, multi-unit assisted housing, adult care homes, and nursing care. These housing types, from least assisted to most assisted, are summarized below. Independent Living is a housing alternative that includes a residential unit, typically an apartment or cottage that offers an individual living area, kitchen, and sleeping room. The fees generally include the cost of the rental unit, some utilities, and services such as laundry, housekeeping, transportation, meals, etc. This housing type is also often referred to as congregate care. Physical assistance and medical treatment are not offered at such facilities. Multi-unit Assisted Housing With Services (referred to as multi-unit assisted throughout this report) is a housing alternative that provides unlicensed care services along with the housing. Such housing offers residents the ability to obtain personal care services and nursing services through a home care or hospice agency that visit the subject site to perform such services. Management at the subject project arrange services that correspond to an individualized written care plan. Adult Care Homes are state licensed residences for aged and disabled adults who may require 24-hour supervision and assistance with personal care needs. People in adult care homes typically need a place to live, with some help with personal care (such as dressing, grooming and keeping up with medications), and some limited supervision. Medical care may be provided on occasion but is not routinely needed. Medication may be given by designated, trained staff. This type of facility is very similar to what is commonly referred to as “assisted living.” These facilities generally offer limited care that is designed for seniors who need some assistance with daily activities but do not require nursing care. Nursing Homes provide nursing care and related services for people who need nursing, medical, rehabilitation or other special services. These facilities are licensed by the state and may be certified to participate in the Medicaid and/or Medicare programs. Certain nursing homes may also meet specific standards for sub-acute care or dementia care. We referenced the Medicare.com and North Carolina Division of Health Service Regulation websites for all licensed senior care facilities and cross referenced this list with other senior care facility resources. As such, we believe that we identified most, if not all, licensed facilities in the city.

Asheville-37
Within the city of Asheville, a total of 13 senior care facilities were surveyed containing a total of 1,238 beds. These facilities are representative of the typical housing choices available to seniors requiring special care housing. It should be noted that family adult care homes of six units or less were not included in this inventory. The following table summarizes the surveyed facilities by property type.
Surveyed Senior Care Facilities
Project Type Projects Beds Vacant Vacancy Rate Independent Living 1 364 15 4.1%
Multi-Unit Assisted Housing - - - - Adult Care Homes 6 313 11 3.5%
Nursing Homes 6 561 31 5.5% Total 13 1,238 57 4.6%
The Asheville senior care market is reporting overall vacancy rates between 3.5% (adult care homes) to 5.5% (nursing homes). All of the vacancy rates among surveyed senior housing are relatively low. Overall, demand for senior care housing in the city appears to be strong and indicates that there may be an opportunity to develop additional senior care housing in the city, particularly when considering the projected senior household growth for the next few years. The base monthly fee for independent living units is $1,189 a month, adult care homes start at $1,975, and nursing care facilities have a base monthly fee starting near $6,083. These fees are slightly lower than most senior care housing fees in the region.

Asheville-38
d. Planned & Proposed Residential Development
In order to access housing development potential, we evaluated recent residential building permit activity and identified residential projects in the development pipeline for the city of Asheville. Understanding the number of residential units and the type of housing being considered for development in the city can assist in determining how these projects are expected to meet the housing needs of the area. Based on our interviews with local building and planning representatives, it was determined that there are multiple housing projects planned within the city of Asheville. It should also be noted that there are no large single-family home subdivisions in planned Asheville as there is not much land available for large subdivisions. Most subdivisions appear to be less than 20 lots. These planned developments, by location, are summarized as follows:
Project Name & Location City Units/Lots Type Developer Status
Biltmore Village Apts. Fairview Road Asheville N/A Rental Fairview Land, LLC Under Review
White Oak Apts. 275 Hazel Mill Asheville 104
Rental Garden-Style White Oak Grove, LLC Under Review
Greystone Village Apts. Sardis Road Asheville 108
Rental, Affordable
Winston-Salem Industry for the Blind Under Review
Chrysler Lofts 150 Coxe Ave. Asheville 48
Rental, Market-Rate
Coxe Avenue Properties, LLC Under Review
Dillingham Woods Dillingham rd./Thrones Ln. Asheville 22
For-Sale, Townhomes Hill Ventures, LLC Under Review
Haywood Village 919 Haywood Rd. Asheville 12
For-Sale, Townhomes
Village of Haywood Developers Under Review
182 Cumberland Group Home
182 Cumberland Asheville N/A Supportive
Housing Flynn Christian Fellowship
Homes Under Review Klepper Drive Subdivision
Klepper Drive Asheville 6 For-Sale,
Single-Family N/A Under Review Mountain Song Lane
Subdivision Mountain Song Lane Asheville 2
For-Sale, Single-Family N/A Under Review
Bridle Path Subdivision Bridle Path Asheville 7
For-Sale, Single-Family N/A Under Review
Brynne Drive Subdivision Brynne Drive Asheville 14
For-Sale, Single-Family N/A Under Review
Burk Street Subdivision Burk Street Asheville 10
For-Sale, Single-Family Farmbound Holdings, LLC Under Review
Palisades Apartments 15 Mills Gap Road Asheville 224
Rental, Market-Rate Southwood Realty Under Construction
Givens Gerber Park Apts. 40 Gerber Road Asheville 120
Rental, Affordable Opportunities South, LLC
Begin Construction 3/2015
Carmel Ridge 711 Leichester Way Asheville 80
Rental, Affordable
Greenway Residential Development Under Construction
Retreat at Hunt Hill 32 Ardmion Park Asheville 180
Rental, Market-Rate Kassinger Development Under Construction
Asheville-39
(Continued) Project Name & Location City Units/Lots Type Developer Status
Creekside Apartments II Wesley Drive Asheville 24
Rental, Senior Living Givens Estates Planned
Aventine Apartments Long Shoals Road Asheville 312
Rental, Market-Rate Flournoy Construction Under Construction
Villas at Fallen Spruce 15 Fallen Spruce Asheville 55
Rental, Affordable
Mountain Housing Opportunities Under Construction
Eagle Market Place Apts. 19 Eagle Street Asheville 62
Rental, Affordable
Mountain Housing Opportunities Under Construction
RAD Lofts Roberts St./Clingman Ave. Asheville 209
Rental, Market-Rate Delphi Development
Begin Construction Spring 2014
SFH – Single-Family Homes TH – Townhomes
F. HOUSING GAP ESTIMATES
Bowen National Research conducted housing gap analyses for rental and for-sale housing for the subject city. The housing gap estimates include new household growth, units required for a balanced market, households living in substandard housing (replacement housing), and units in the development pipeline. This estimate is considered a representation of the housing shortage in the market and indicative of the more immediate housing requirements of the market. Our estimates consider four income stratifications. These stratifications include households with incomes of up to 30% of Area Median Household Income (AMHI), households with incomes between 31% and 50% of AMHI, between 51% and 80% of AMHI, and between 80% and 120% of AMHI. This analysis was conducted for family households and seniors (age 55+) separately. This analysis identifies the housing gap (the number of units that could potentially be supported) for the city between 2015 and 2020. Broader housing needs estimates, which include household growth, cost burdened households, households living in substandard housing, and units in the development pipeline, were provided for the overall region and is included in the Asheville, North Carolina Region Housing Needs Assessment. The demand components included in the housing gap estimates for each of the two housing types (rental and for-sale) are listed as follows:
Housing Gap Analysis Components
Rental Housing Owner Housing
Renter Household Growth Owner Household Growth Units Required for a Balanced Market Units Required for a Balanced Market Replacement of Substandard Housing Replacement of Substandard Housing Pipeline Development* Pipeline Development*
*Includes units that lack complete indoor plumbing and overcrowded housing **Units under construction, permitted, planned or proposed

Asheville-40
The demand factors for each housing segment at the various income stratifications are combined. Any product confirmed to be in the development pipeline is deducted from the various demand estimates, yielding a housing gap estimate. This gap analysis is conducted for both renters and owners, as well as for seniors (age 55+) and family households. These gaps represent the number of new households that may need housing and/or the number of existing households that currently live in housing that needs replaced to relieve occupants of such things as overcrowded or substandard housing conditions. It is important to note that because Asheville represents a large portion of Buncombe County and serves as the county seat and the center for employment, entertainment, and culture for the entire county, housing demand within the city of Asheville is impacted by the overall county’s housing supply and demographics. As a result, we have used demographic and housing supply data from Buncombe County in the following housing gap estimates. The data for these estimates can be found in the Buncombe County chapter of the Region Housing Analysis. Rental Housing Gap Analysis
The tables below summarize the rental housing gap estimates by the various income segments for family and senior households.
Rental Housing Gap Estimates – Family Households Percent Of Median Household Income
Demand Component
<30% (<$15,000)
30%-50% ($15,000-$24,999)
50%-80% ($25,000-$34,999)
80%-120% ($35,000-$75,000) Total
New Households (2015-2020) 59 243 19 1,020 1,341 Balanced Market 381 251 260 362 1,254
Substandard Housing 251 166 172 314 903 Development Pipeline -102 -102 -102 -856 -1,162
Total Housing Gap 589 558 349 840 2,336
Rental Housing Gap Estimates – Senior Households
Percent Of Median Household Income
Demand Component <30%
(<$15,000) 30%-50%
($15,000-$24,999) 50%-80%
($25,000-$34,999) 80%-120%
($35,000-$75,000) Total New Households (2015-2020) 118 158 64 515 855
Balanced Market 152 101 91 144 488 Substandard Housing 100 66 60 125 351 Development Pipeline -39 -40 -40 -331 -450
Total Housing Gap 331 285 175 453 1,244
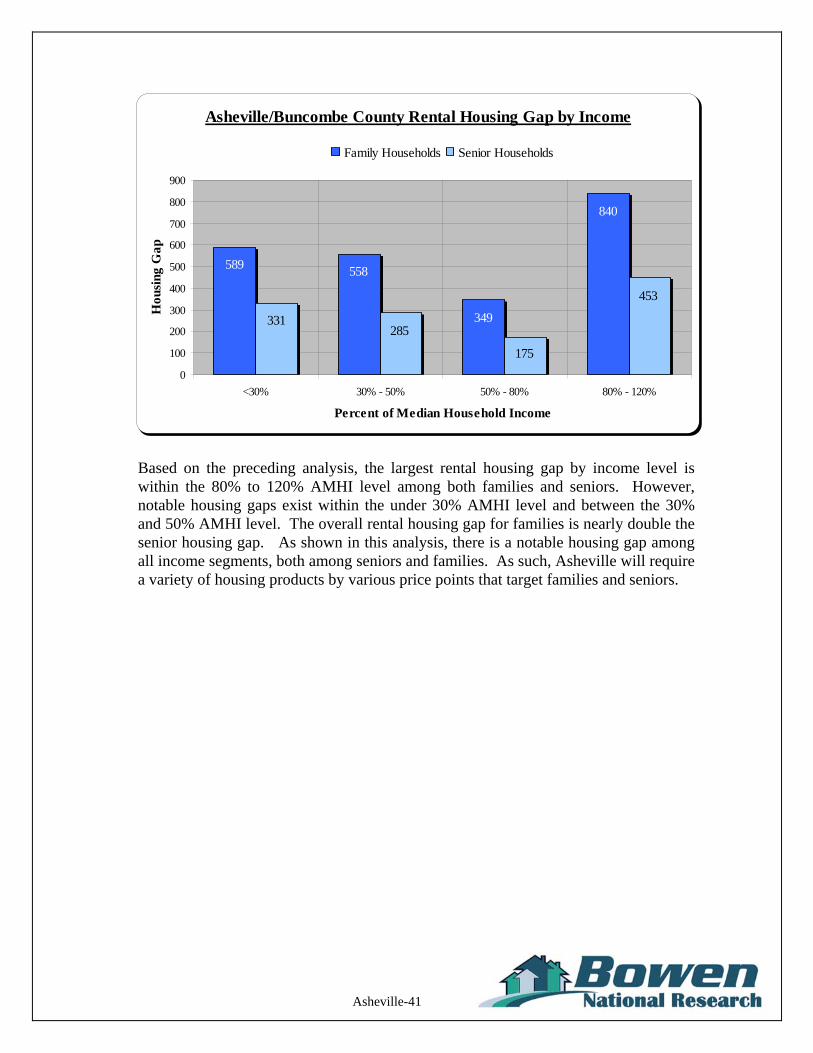
Asheville-41
Asheville/Buncombe County Rental Housing Gap by Income
589 558
349
840
331
175
285
453
0
100
200
300
400
500
600
700
800
900
<30% 30% - 50% 50% - 80% 80% - 120%
Percent of Median Household Income
Hou
sing
Gap
Family Households Senior Households
Based on the preceding analysis, the largest rental housing gap by income level is within the 80% to 120% AMHI level among both families and seniors. However, notable housing gaps exist within the under 30% AMHI level and between the 30% and 50% AMHI level. The overall rental housing gap for families is nearly double the senior housing gap. As shown in this analysis, there is a notable housing gap among all income segments, both among seniors and families. As such, Asheville will require a variety of housing products by various price points that target families and seniors.
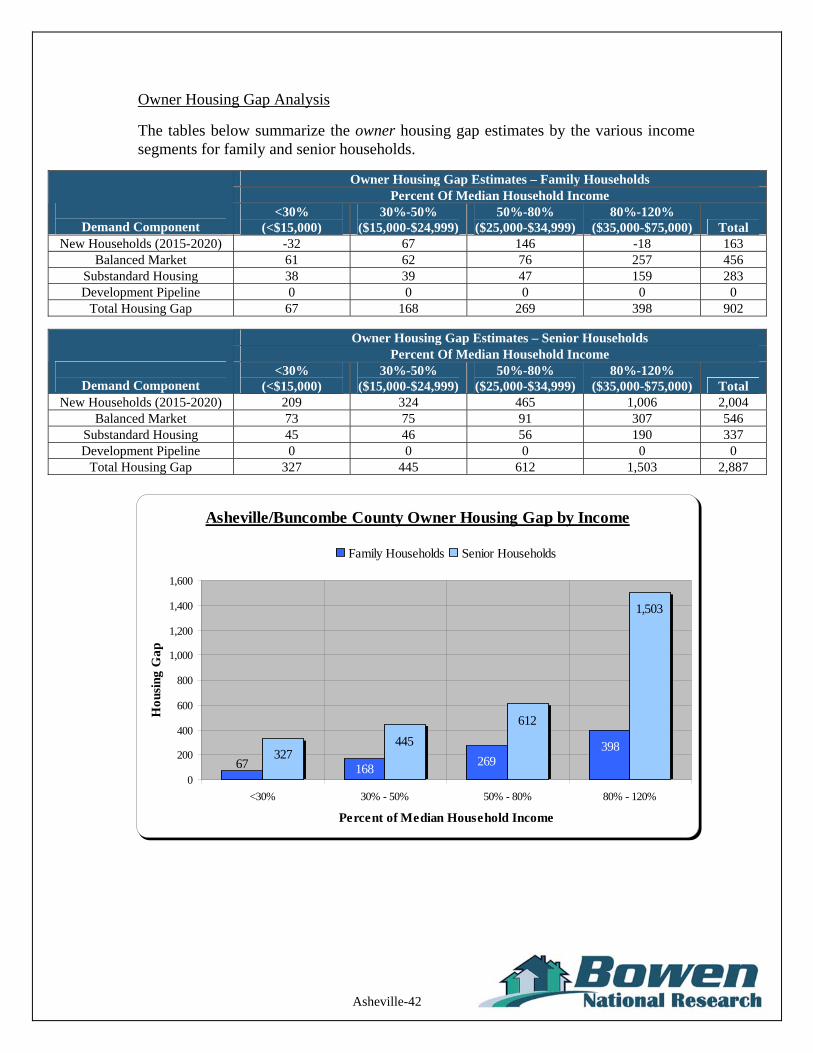
Asheville-42
Owner Housing Gap Analysis
The tables below summarize the owner housing gap estimates by the various income segments for family and senior households.
Owner Housing Gap Estimates – Family Households Percent Of Median Household Income
Demand Component
<30% (<$15,000)
30%-50% ($15,000-$24,999)
50%-80% ($25,000-$34,999)
80%-120% ($35,000-$75,000) Total
New Households (2015-2020) -32 67 146 -18 163 Balanced Market 61 62 76 257 456
Substandard Housing 38 39 47 159 283 Development Pipeline 0 0 0 0 0
Total Housing Gap 67 168 269 398 902
Owner Housing Gap Estimates – Senior Households Percent Of Median Household Income
Demand Component
<30% (<$15,000)
30%-50% ($15,000-$24,999)
50%-80% ($25,000-$34,999)
80%-120% ($35,000-$75,000) Total
New Households (2015-2020) 209 324 465 1,006 2,004 Balanced Market 73 75 91 307 546
Substandard Housing 45 46 56 190 337 Development Pipeline 0 0 0 0 0
Total Housing Gap 327 445 612 1,503 2,887
Asheville/Buncombe County Owner Housing Gap by Income
67398
269168
327
1,503
612
445
0
200
400
600
800
1,000
1,200
1,400
1,600
<30% 30% - 50% 50% - 80% 80% - 120%
Percent of Median Household Income
Hou
sing
Gap
Family Households Senior Households
Asheville-43
As shown in the preceding owner housing gap analysis, while each income segment has a notable housing gap, the greatest housing gap for families and seniors with incomes between 80% and 120% of AMHI. While the housing gap estimates show a larger gap for housing for seniors, this is primarily attributed to seniors aging in place. This likely indicates that many senior households aging in place will ultimately require housing that would enable them to downsize at some point. Senior Care Housing Need Estimates
Senior care housing encompasses a variety of alternatives including multi-unit assisted housing, adult care homes, and nursing homes. Such housing typically serves the needs of seniors requiring some level of care to meet their personal needs, often due to medical or other physical issues. While this study focuses on the housing characteristics and needs of the city of Asheville, demand estimates for senior care housing must take into consideration the entire Buncombe County area, as senior care housing facilities typically draw support from broad areas such as a county. As a result, we have included both the potential demographic support and the existing senior care housing supply (both surveyed and non-surveyed) of the entire Buncombe County area in our demand estimates. The following attempts to quantify the estimated senior care housing need in Asheville/Buncombe County.
Senior Care Housing Need Estimates Senior Care Housing Demand Component Demand Estimates
Elderly Population Age 62 and Older by 2020 66,476 Times Share* of Elderly Population Requiring ADL Assistance X 7.4% Equals Elderly Population Requiring ADL Assistance = 4,919 Plus External Market Support (20%) + 984 Equals Total Senior Care Support Base = 5,903 Less Existing Supply - 3,803 Less Development Pipeline - 123 Potential Senior Care Beds Needed by 2020 = 1,977
ADL – Activities of Daily Living *Share of ADL was based on data provided by the U.S. Centers for Disease Control and Prevention’s Summary Health Statistics for U.S. Population National Health Interview Survey 2011 Based upon age 62 and older population characteristics and trends, and applying the estimated ratio of persons requiring ADL assistance and taking into account the existing and planned senior housing supply, we estimate that there will be 1,977 households with a person requiring assisted services that will not have their needs met by existing or planned senior care facilities by the year 2020. Not all of these estimated households with persons age 62 and older requiring ADL assistance will want to move to a senior care facility, as many may choose home health care services or have their needs taken care of by a family member. Additionally, some will seek senior care housing within the city of Asheville, while others may prefer locations outside of Asheville but within Buncombe County. Regardless, the 1,977 seniors estimated above represent the potential need for additional senior care housing in the city and county.

Asheville-44
G. STAKEHOLDER SURVEY & INTERVIEWS
Associates of Bowen National Research solicited input from nearly more than 40 stakeholders throughout the study region. Their input was provided in the form of an online survey and telephone interviews. Of these respondents, 32 serve the Buncombe County/Asheville area. Considered leaders within their field and active in the community, they represent a wide range of industries, including government, economic development, real estate, and social assistance. The purpose of these interviews was to gather input regarding the need for the type and styles of housing, the income segments housing should target, and if there is a lack of housing or housing assistance within the county/Asheville area. The following is a summary of the key input gathered. Stakeholders were asked is there is a specific area of the county where housing should be developed. Respondents indicated that housing should be developed within the city limits of Asheville, and along major transit corridors or close to transit with access to the downtown for employment. Rental housing was overwhelmingly ranked as the type of housing having the greatest need, followed by housing for the homeless and single-person/young professionals. Respondents indicated that the housing style most needed in the area is apartments, followed by single-family homes and duplex/triplex/ townhome development. Respondents also believe that adaptive reuse should be prioritized over new construction and renovation/revitalization. When asked to rank the need for housing for each income level, respondents evenly ranked incomes of less than $25,000 and incomes between $25,000 and $50,000 as the household segments with the greatest need. The most significant housing issue within the county, as indicated by respondents, was rent burdened/affordability, followed by limited availability, substandard housing, and lack of public transportation. Respondents were asked to prioritize funding types that should be utilized or explored in the county. “Other” homeowner assistance was given the highest priority, followed by “other” rental housing assistance (such as Vouchers) and homebuyer assistance. Respondents indicated that housing development programs that should be explored include emergency repair, and property tax incentives and support for home owners, as well as increased LIHTC and other affordable housing options, such as CDBG funding. When asked what common barriers or obstacles exist as it relates to housing development in the county, the cost of land and availability of land were most commonly cited, followed by financing. Respondents provided various ways to overcome these barriers, including increased collaboration between the local government and developers, creating a land bank, a better zoning and permitting process, improvements to public transit and infrastructure, and tax abatements. One respondent suggested that a committee of both public and private housing professionals should be created that is dedicated to the process of developing affordable housing for all housing sectors.
Asheville-45
If a respondent was knowledgeable about homelessness in the county, they were asked to rank the need for housing for various homeless groups. The most commonly indicated groups were homeless individuals and families. Respondents indicated that the most needed type of housing to serve the homeless population is increased Voucher assistance, followed by emergency shelters and Single Room Occupancy (SRO). The most commonly cited obstacles to developing homeless housing were public perception/NIMBYism, and the high cost and lack of funding for development. Respondents believe that collaboration of homeless services and housing providers is necessary, and homeless housing should be developed closer to transit and job cores to reduce the burden of a family having to maintain a vehicle in order to access their employment. If a respondent was knowledgeable about special needs groups in the county, they were asked to rank the need for housing for various special needs groups. The most commonly indicated groups were persons with mental illness, persons suffering from alcohol/ substance abuse, and persons with physical/developmental disabilities. One group receiving special note by respondents as being in need of housing is domestic violence victims. Respondents believe that transitional housing and group homes would best serve these populations. The lack of community support and funding were cited as the most common obstacles to developing special needs housing. Respondents were asked how frequently they believe area rentals are being rented to vacationers rather than as permanent housing. The majority of respondents (54.0%) believe that this is happening occasionally, while only 19.0% believe this is happening often. The most commonly cited reason as to why this is happening occasionally is the prospect of increased rental income/profit for the owner/landlord. Respondents were asked to what degree they believe individual rooms rented out in the area. More than half (53.0%) believe this is an occasional event, while only 12.0% believe this is happening often. Respondents estimate that a room in the area rents from between $300 and $2,000 per month, with the most commons responses falling in the $300 to $600 per month range. Respondents were asked to rank the importance of having access to public transit for various populations and groups. Respondents ranked renters, special needs groups and low-income households as having the greatest need for proximity to public transit, followed by seniors and families. When asked the farthest distance a resident could live from an access point for public transportation before it becomes inconvenient, typical responses were 0.25 to 0.5 miles for families, 0.25 miles for seniors and 0.25 to 0.5 miles for special needs/homeless. In regard to what strategies the city of Asheville should consider in an effort to reduce transportation cost burdens for residents, respondents ranked providing additional access points to public transit and encouraging residential development near public transit access points as the highest.
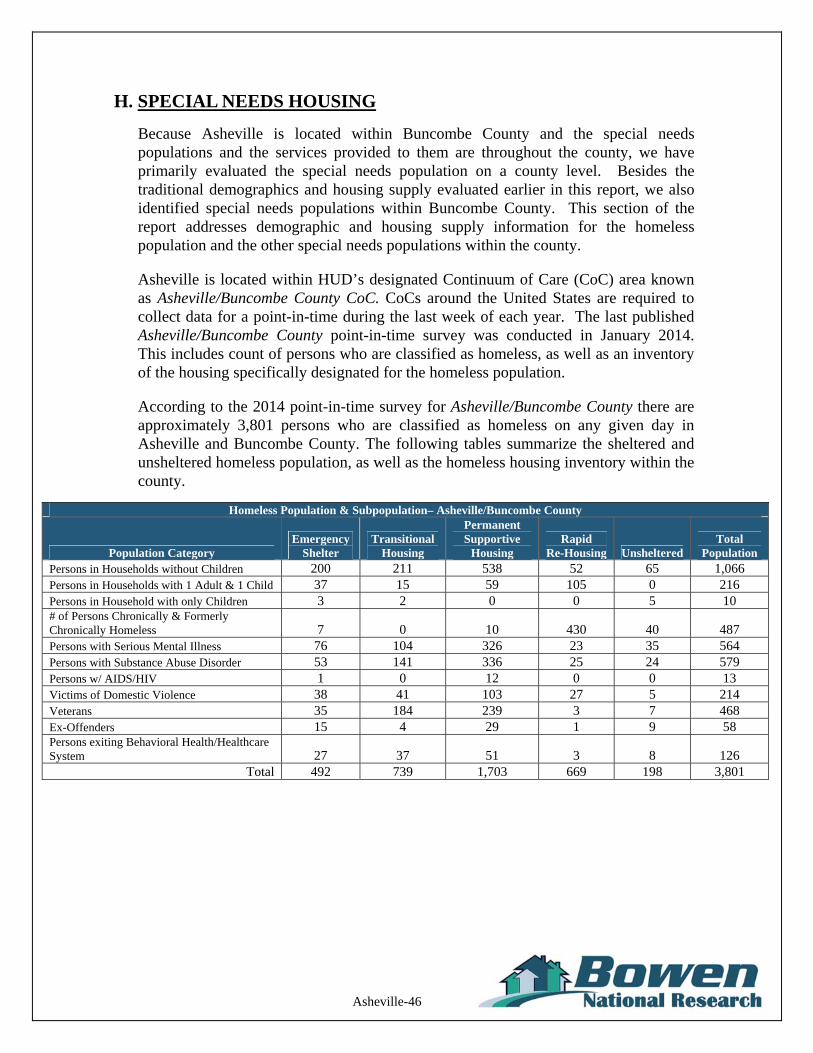
Asheville-46
H. SPECIAL NEEDS HOUSING
Because Asheville is located within Buncombe County and the special needs populations and the services provided to them are throughout the county, we have primarily evaluated the special needs population on a county level. Besides the traditional demographics and housing supply evaluated earlier in this report, we also identified special needs populations within Buncombe County. This section of the report addresses demographic and housing supply information for the homeless population and the other special needs populations within the county. Asheville is located within HUD’s designated Continuum of Care (CoC) area known as Asheville/Buncombe County CoC. CoCs around the United States are required to collect data for a point-in-time during the last week of each year. The last published Asheville/Buncombe County point-in-time survey was conducted in January 2014. This includes count of persons who are classified as homeless, as well as an inventory of the housing specifically designated for the homeless population.
According to the 2014 point-in-time survey for Asheville/Buncombe County there are approximately 3,801 persons who are classified as homeless on any given day in Asheville and Buncombe County. The following tables summarize the sheltered and unsheltered homeless population, as well as the homeless housing inventory within the county.
Homeless Population & Subpopulation– Asheville/Buncombe County
Population Category Emergency
Shelter Transitional
Housing
Permanent Supportive
Housing Rapid
Re-Housing Unsheltered Total
Population Persons in Households without Children 200 211 538 52 65 1,066 Persons in Households with 1 Adult & 1 Child 37 15 59 105 0 216 Persons in Household with only Children 3 2 0 0 5 10 # of Persons Chronically & Formerly Chronically Homeless 7 0 10 430 40 487 Persons with Serious Mental Illness 76 104 326 23 35 564 Persons with Substance Abuse Disorder 53 141 336 25 24 579 Persons w/ AIDS/HIV 1 0 12 0 0 13 Victims of Domestic Violence 38 41 103 27 5 214 Veterans 35 184 239 3 7 468 Ex-Offenders 15 4 29 1 9 58 Persons exiting Behavioral Health/Healthcare System 27 37 51 3 8 126
Total 492 739 1,703 669 198 3,801
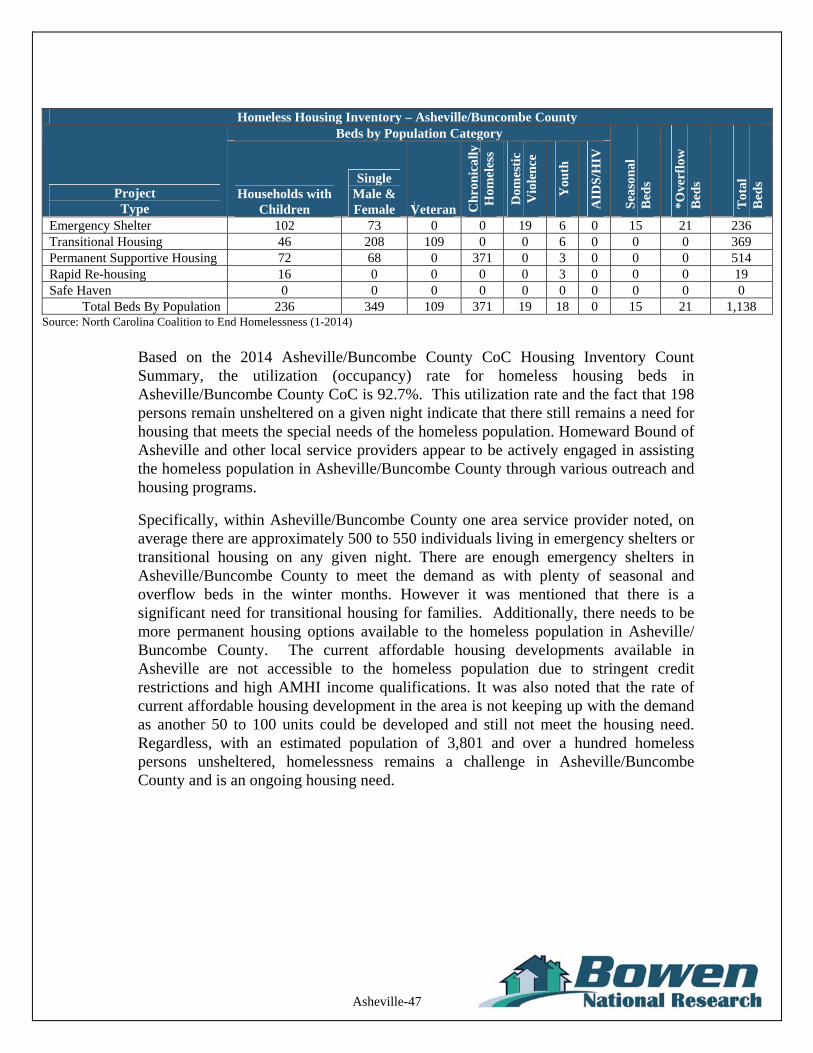
Asheville-47
Homeless Housing Inventory – Asheville/Buncombe County
Beds by Population Category
Project Type
Households with Children
Single Male & Female Veteran C
hro
nic
ally
H
omel
ess
Dom
esti
c V
iole
nce
You
th
AID
S/H
IV
Sea
son
al
Bed
s
*Ove
rflo
w
Bed
s
Tot
al
Bed
s
Emergency Shelter 102 73 0 0 19 6 0 15 21 236 Transitional Housing 46 208 109 0 0 6 0 0 0 369 Permanent Supportive Housing 72 68 0 371 0 3 0 0 0 514 Rapid Re-housing 16 0 0 0 0 3 0 0 0 19 Safe Haven 0 0 0 0 0 0 0 0 0 0
Total Beds By Population 236 349 109 371 19 18 0 15 21 1,138 Source: North Carolina Coalition to End Homelessness (1-2014)
Based on the 2014 Asheville/Buncombe County CoC Housing Inventory Count Summary, the utilization (occupancy) rate for homeless housing beds in Asheville/Buncombe County CoC is 92.7%. This utilization rate and the fact that 198 persons remain unsheltered on a given night indicate that there still remains a need for housing that meets the special needs of the homeless population. Homeward Bound of Asheville and other local service providers appear to be actively engaged in assisting the homeless population in Asheville/Buncombe County through various outreach and housing programs.
Specifically, within Asheville/Buncombe County one area service provider noted, on average there are approximately 500 to 550 individuals living in emergency shelters or transitional housing on any given night. There are enough emergency shelters in Asheville/Buncombe County to meet the demand as with plenty of seasonal and overflow beds in the winter months. However it was mentioned that there is a significant need for transitional housing for families. Additionally, there needs to be more permanent housing options available to the homeless population in Asheville/ Buncombe County. The current affordable housing developments available in Asheville are not accessible to the homeless population due to stringent credit restrictions and high AMHI income qualifications. It was also noted that the rate of current affordable housing development in the area is not keeping up with the demand as another 50 to 100 units could be developed and still not meet the housing need. Regardless, with an estimated population of 3,801 and over a hundred homeless persons unsheltered, homelessness remains a challenge in Asheville/Buncombe County and is an ongoing housing need.
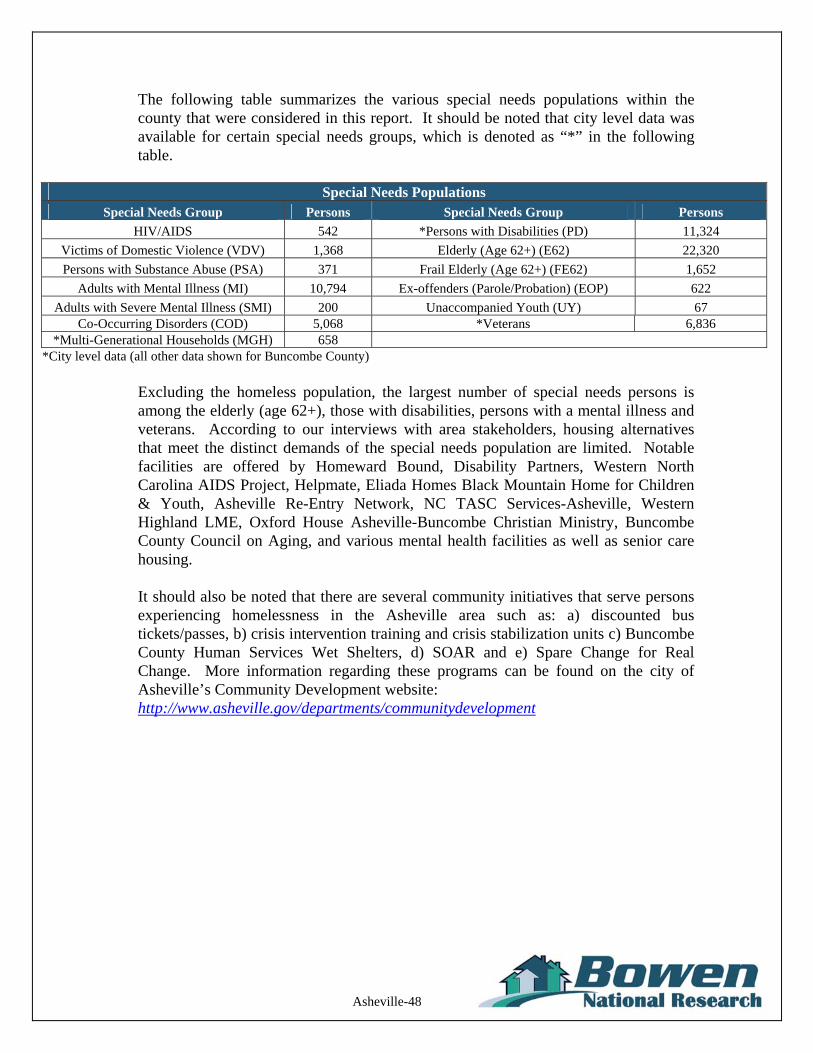
Asheville-48
The following table summarizes the various special needs populations within the county that were considered in this report. It should be noted that city level data was available for certain special needs groups, which is denoted as “*” in the following table.
Special Needs Populations
Special Needs Group Persons Special Needs Group Persons
HIV/AIDS 542 *Persons with Disabilities (PD) 11,324
Victims of Domestic Violence (VDV) 1,368 Elderly (Age 62+) (E62) 22,320
Persons with Substance Abuse (PSA) 371 Frail Elderly (Age 62+) (FE62) 1,652
Adults with Mental Illness (MI) 10,794 Ex-offenders (Parole/Probation) (EOP) 622
Adults with Severe Mental Illness (SMI) 200 Unaccompanied Youth (UY) 67 Co-Occurring Disorders (COD) 5,068 *Veterans 6,836
*Multi-Generational Households (MGH) 658 *City level data (all other data shown for Buncombe County)
Excluding the homeless population, the largest number of special needs persons is among the elderly (age 62+), those with disabilities, persons with a mental illness and veterans. According to our interviews with area stakeholders, housing alternatives that meet the distinct demands of the special needs population are limited. Notable facilities are offered by Homeward Bound, Disability Partners, Western North Carolina AIDS Project, Helpmate, Eliada Homes Black Mountain Home for Children & Youth, Asheville Re-Entry Network, NC TASC Services-Asheville, Western Highland LME, Oxford House Asheville-Buncombe Christian Ministry, Buncombe County Council on Aging, and various mental health facilities as well as senior care housing. It should also be noted that there are several community initiatives that serve persons experiencing homelessness in the Asheville area such as: a) discounted bus tickets/passes, b) crisis intervention training and crisis stabilization units c) Buncombe County Human Services Wet Shelters, d) SOAR and e) Spare Change for Real Change. More information regarding these programs can be found on the city of Asheville’s Community Development website: http://www.asheville.gov/departments/communitydevelopment
Asheville-49
I. Conclusions
Recent city economic trends have been positive and overall demographic trends are projected to be positive within the city of Asheville over the next five years, which are expected to contribute to the continued strength of the housing market within the city during the foreseeable future. Some key findings based on our research of Asheville are summarized as follows: Population & Households – Between 2015 and 2020, the population is projected
to grow by 6,371 (7.1%), which is faster than the growth rate (5.5%) of the overall region. During this same time, household growth of 3,086 (7.6%) is projected to occur in the city, which is also faster than the region’s projected growth rate of 5.9%.
Household Heads by Age –The city’s senior households age 55 and older will
increase by 2,440 (12.1%) between 2015 and 2020, adding to its anticipated need for senior-oriented housing. It is projected that households between the ages of 25 and 54 will increase by approximately 642 (3.1%) households, which will likely lead to a need for additional family-oriented and/or workforce housing.
Households by Income and Tenure – Between 2015 and 2020, the greatest renter
household growth is projected to occur among households with incomes between $35,000 and $49,000, though all household income segments below $25,000 are projected to have notable growth. The greatest owner-occupied household growth is projected to occur among homeowners with incomes between $100,000 and $149,999, as well as among households with incomes between $50,000 and $74,999. As such, the city will have diverse housing needs.
Rental Housing – Asheville has a well-balanced supply of rental alternatives.
However, it is noteworthy that the multifamily rental housing supply is operating at an overall 99.1% occupancy rate, which is very high. More importantly, there are no vacancies among the 3,362 surveyed affordable (Tax Credit and government-subsidized) rental units in the city. This occupancy rate and the long wait lists maintained at these projects indicate that there is pent-up demand for affordable housing in the city. Based on the housing gap estimates, the largest rental housing gap by income level is within the 80% to 120% AMHI level among both families and seniors. However, notable housing gaps exist within the under 30% AMHI level and between the 30% and 50% AMHI level. The overall rental housing gap for families is nearly double the senior housing gap.
Asheville-50
Owner Housing (for-sale) – The number of homes that have sold per year in Asheville has increased in each of the past three years, with increases of over 20% in each of the past two years. The median sales prices have increased in each of the past two full years. The for-sale housing market is considered to be strong. The largest share (27.7%) of the available for-sale housing stock is priced over $500,000. However, notable shares of for-sale product are priced between $100,000 and $199,999 and between $200,000 and $299,999, representing shares of 24.9% and 20.4%, respectively. As such, the Asheville for-sale housing market has a diverse inventory of available product by price point. Based on the housing gap estimates, it appears that the greatest housing gap for owner housing will be for households with incomes between 80% and 120% of AMHI.
Senior Care Facilities – Senior housing reported an overall occupancy rate of
95.4% (4.6% vacant). This is a relatively high occupancy rate. As shown in the housing needs estimates, it is believed that an additional 1,977 senior care beds will be needed to meet the future needs of are seniors. It should be noted that this estimate includes all of Buncombe County.
Special Needs Populations: While there are many special needs populations
within the city that likely require housing assistance, it appears that the largest special needs populations in the city are the elderly (age 62+), those with disabilities, persons with a mental illness and veterans.
J. SOURCES
See the Asheville, North Carolina Region Housing Needs Assessment for a full listing of all sources used in this report.