Embed Size (px)
Citation preview
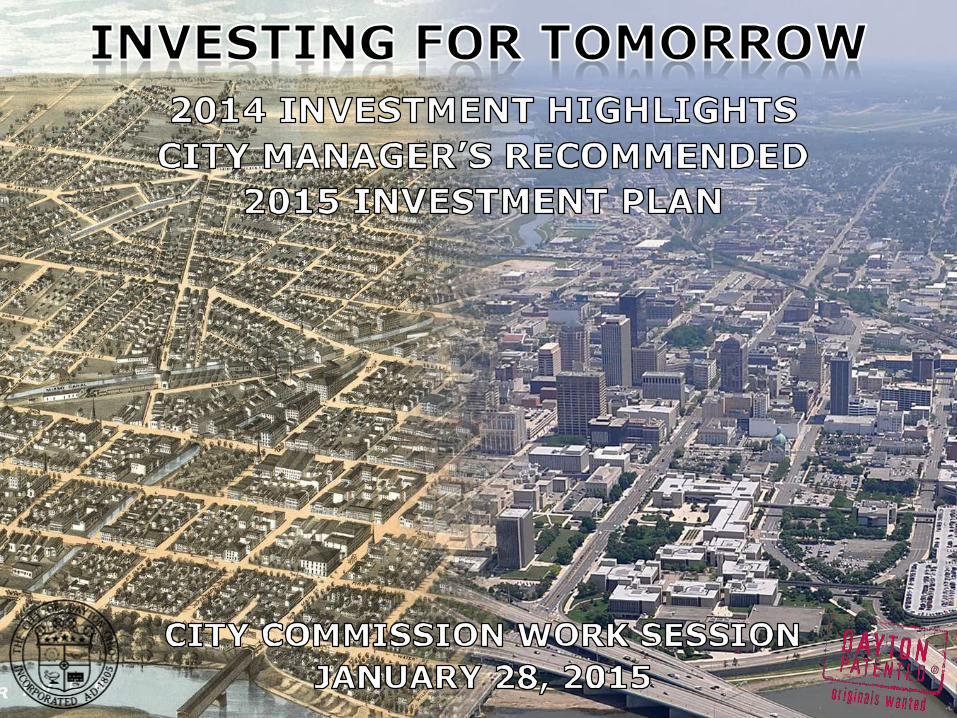
WHAT ARE THE CITY’S INVESTMENTS?
1. Infrastructure, facilities and other improvements that
provide services to the public, usually with benefits to the
community at large as well as the direct user.
Examples: roads, bridges, right-of-way, public parks, police/fire
stations and recreation facilities.
2. Vehicles, equipment, technology and other assets that
allow for the efficient and safe delivery of public services.
Examples: police cruisers, lawn mowers, data servers and radios.
3. Economic and neighborhood development that supports
job creation, neighborhood revitalization and community
satisfaction.
2
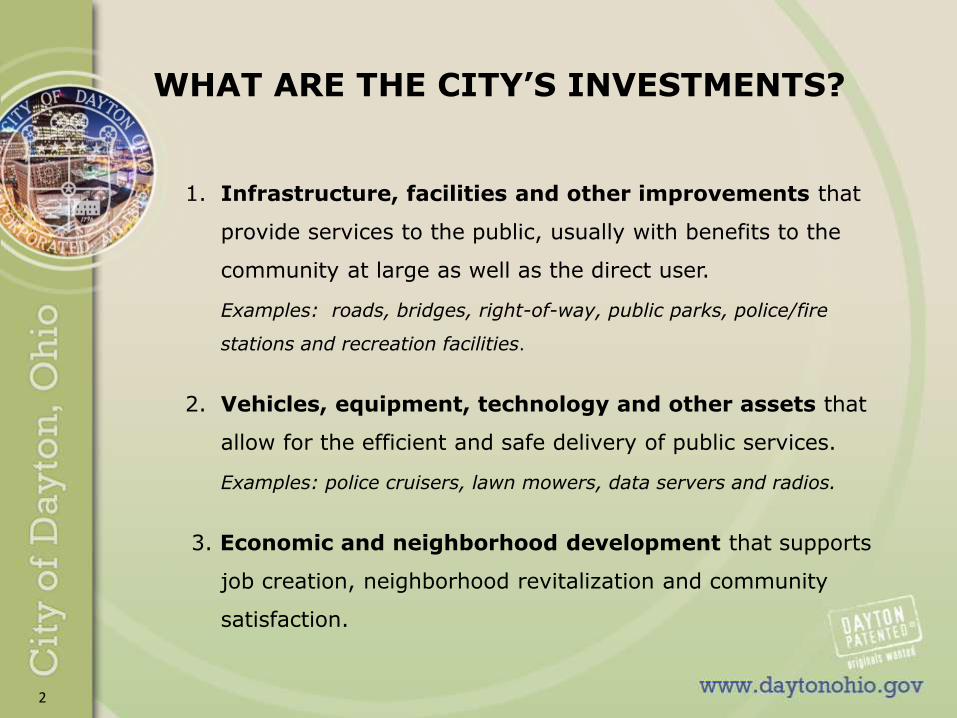
INVESTMENT GOALS
1. Protect People (Safety & Environment)
2. Foster Economic Vitality and Quality of Life in the City
3. Promote Property Values
4. Support and Maintain Service Levels
5. Increase Efficiencies
6. Provide a High Level of Customer Service
7. Meet Legislative Mandates
3
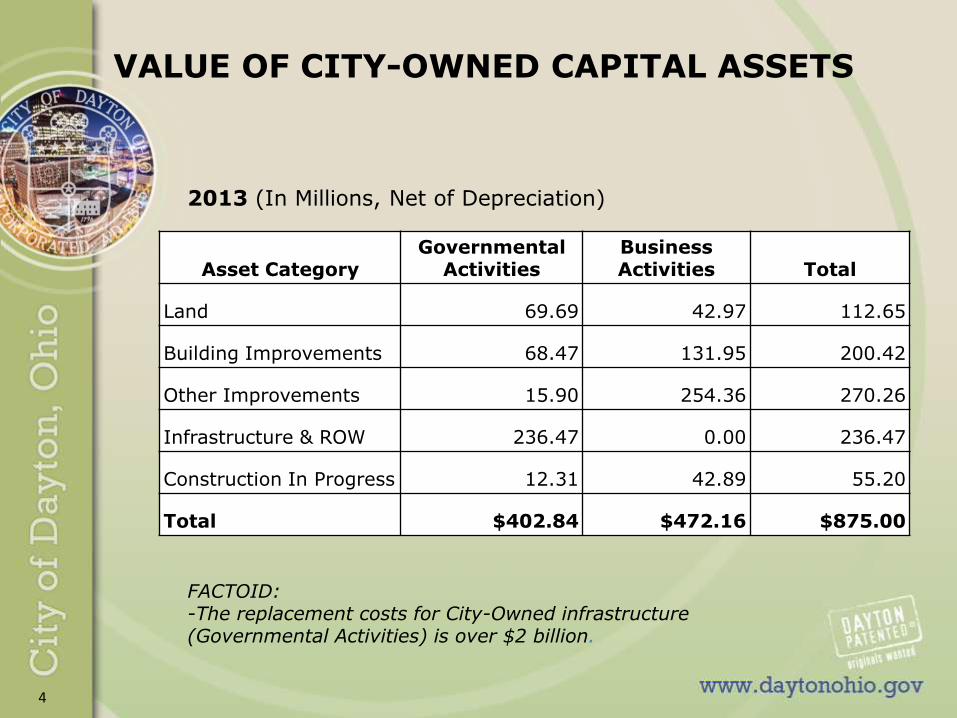
FACTOID:-The replacement costs for City-Owned infrastructure (Governmental Activities) is over $2 billion.
Asset CategoryGovernmental
ActivitiesBusiness Activities Total
Land 69.69 42.97 112.65
Building Improvements 68.47 131.95 200.42
Other Improvements 15.90 254.36 270.26
Infrastructure & ROW 236.47 0.00 236.47
Construction In Progress 12.31 42.89 55.20
Total $402.84 $472.16 $875.00
VALUE OF CITY-OWNED CAPITAL ASSETS
2013 (In Millions, Net of Depreciation)
4
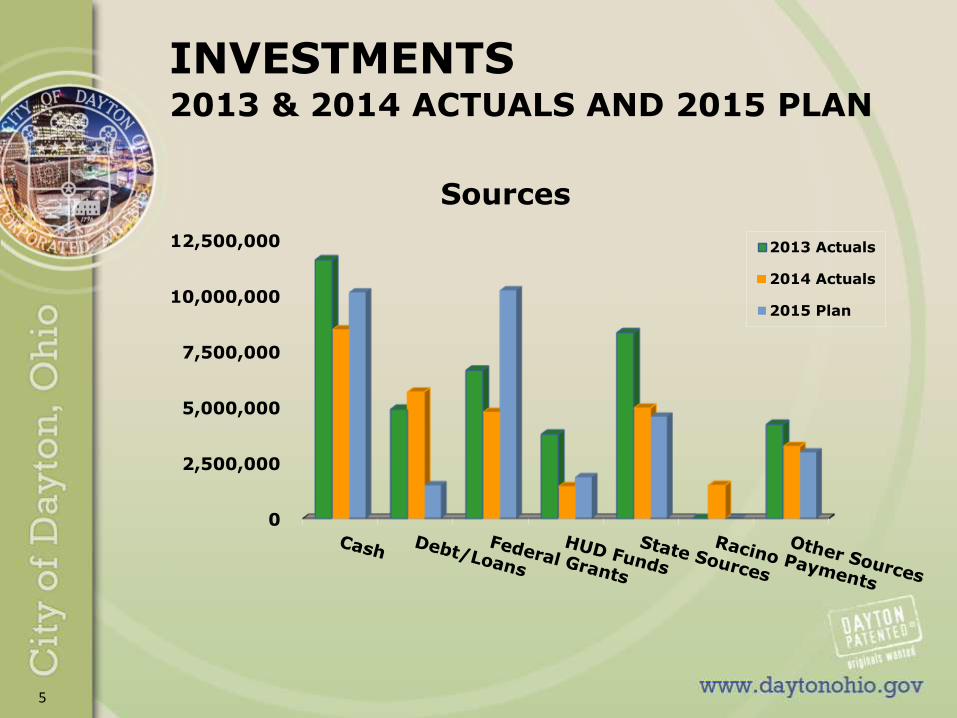
0
2,500,000
5,000,000
7,500,000
10,000,000
12,500,000 2013 Actuals
2014 Actuals
2015 Plan
Sources
INVESTMENTS2013 & 2014 ACTUALS AND 2015 PLAN
5
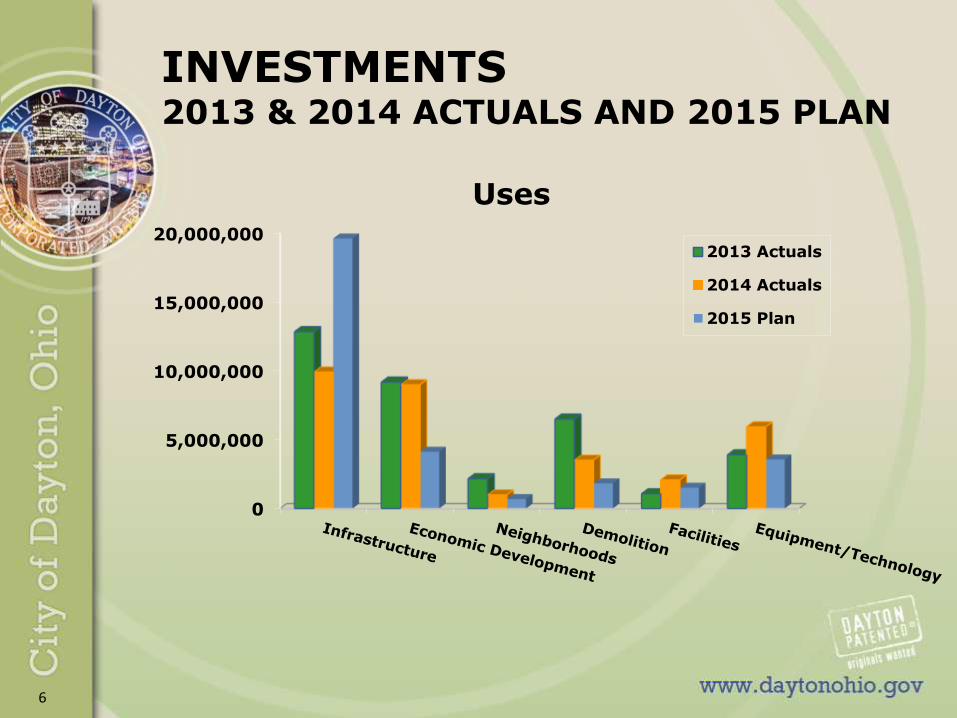
0
5,000,000
10,000,000
15,000,000
20,000,0002013 Actuals
2014 Actuals
2015 Plan
Uses
INVESTMENTS2013 & 2014 ACTUALS AND 2015 PLAN
6
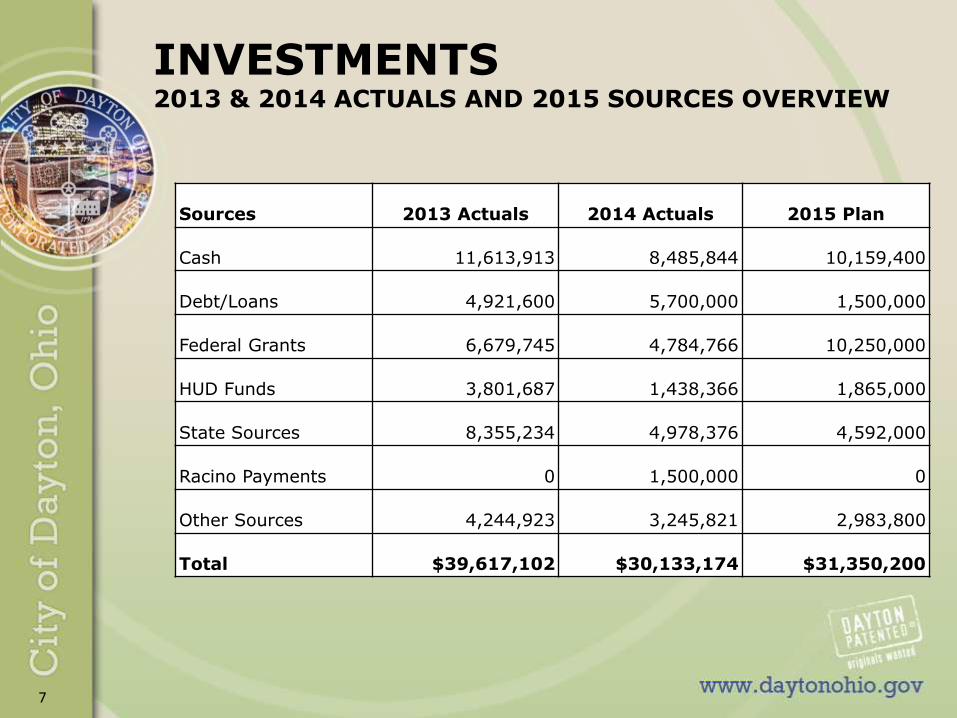
INVESTMENTS2013 & 2014 ACTUALS AND 2015 SOURCES OVERVIEW
Sources 2013 Actuals 2014 Actuals 2015 Plan
Cash 11,613,913 8,485,844 10,159,400
Debt/Loans 4,921,600 5,700,000 1,500,000
Federal Grants 6,679,745 4,784,766 10,250,000
HUD Funds 3,801,687 1,438,366 1,865,000
State Sources 8,355,234 4,978,376 4,592,000
Racino Payments 0 1,500,000 0
Other Sources 4,244,923 3,245,821 2,983,800
Total $39,617,102 $30,133,174 $31,350,200
7
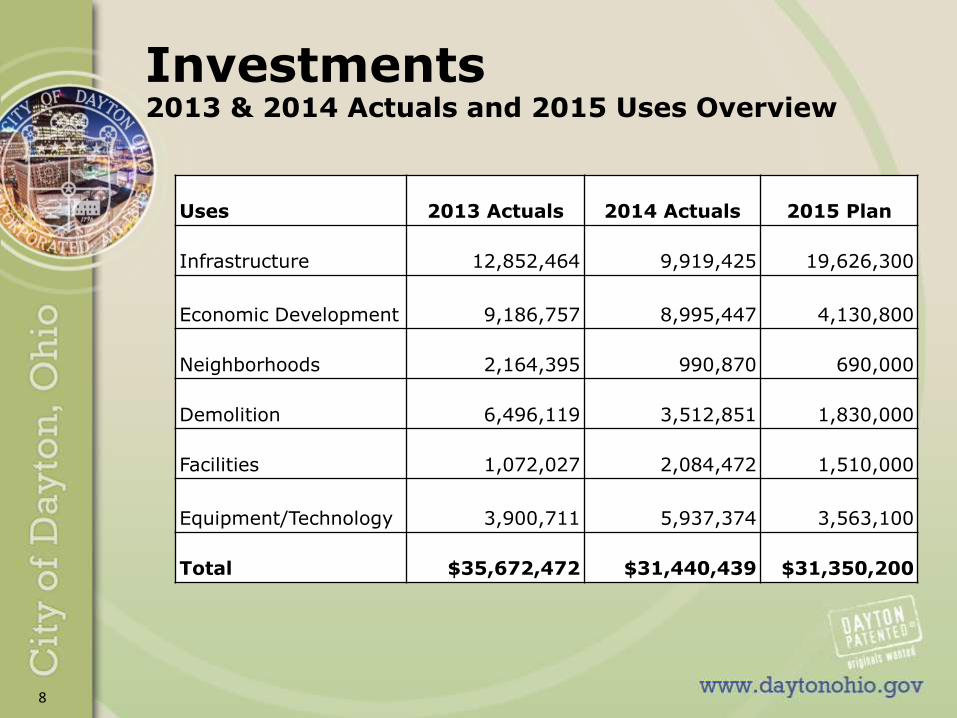
Investments2013 & 2014 Actuals and 2015 Uses Overview
Uses 2013 Actuals 2014 Actuals 2015 Plan
Infrastructure 12,852,464 9,919,425 19,626,300
Economic Development 9,186,757 8,995,447 4,130,800
Neighborhoods 2,164,395 990,870 690,000
Demolition 6,496,119 3,512,851 1,830,000
Facilities 1,072,027 2,084,472 1,510,000
Equipment/Technology 3,900,711 5,937,374 3,563,100
Total $35,672,472 $31,440,439 $31,350,200
8
2014 INVESTMENT HIGHLIGHTS
9
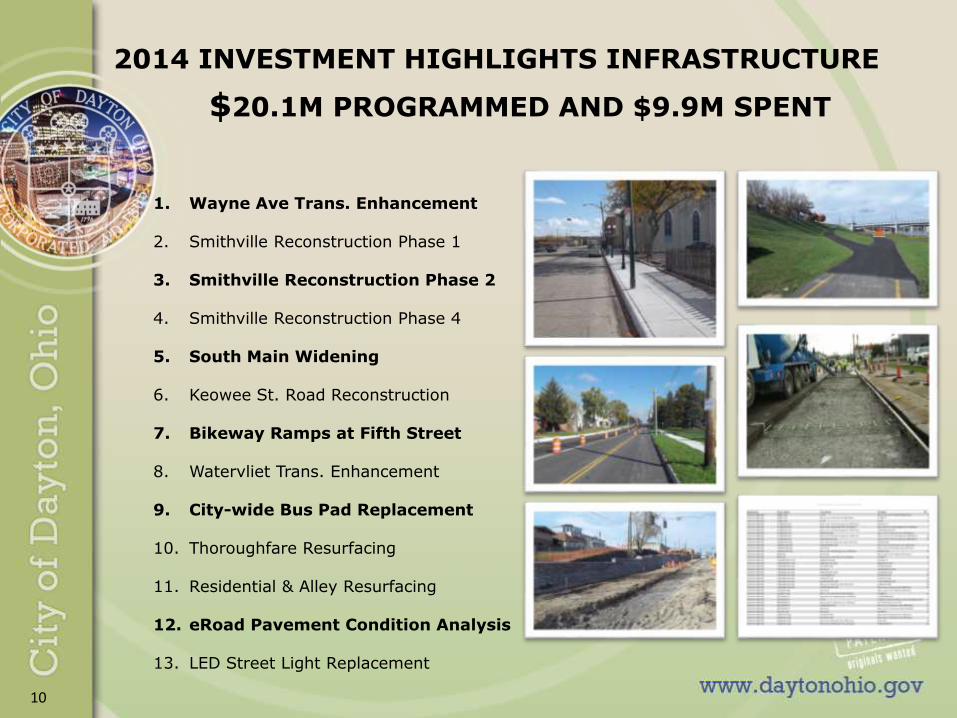
2014 INVESTMENT HIGHLIGHTS INFRASTRUCTURE
$20.1M PROGRAMMED AND $9.9M SPENT
1. Wayne Ave Trans. Enhancement
2. Smithville Reconstruction Phase 1
3. Smithville Reconstruction Phase 2
4. Smithville Reconstruction Phase 4
5. South Main Widening
6. Keowee St. Road Reconstruction
7. Bikeway Ramps at Fifth Street
8. Watervliet Trans. Enhancement
9. City-wide Bus Pad Replacement
10. Thoroughfare Resurfacing
11. Residential & Alley Resurfacing
12. eRoad Pavement Condition Analysis
13. LED Street Light Replacement
10
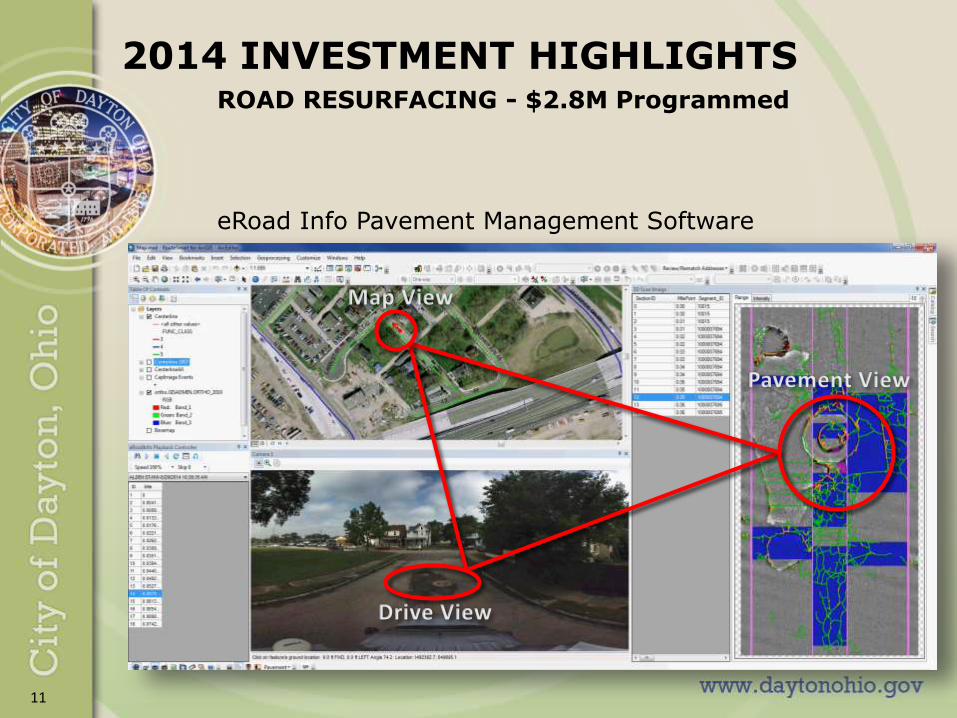
eRoad Info Pavement Management Software
2014 INVESTMENT HIGHLIGHTS ROAD RESURFACING - $2.8M Programmed
11
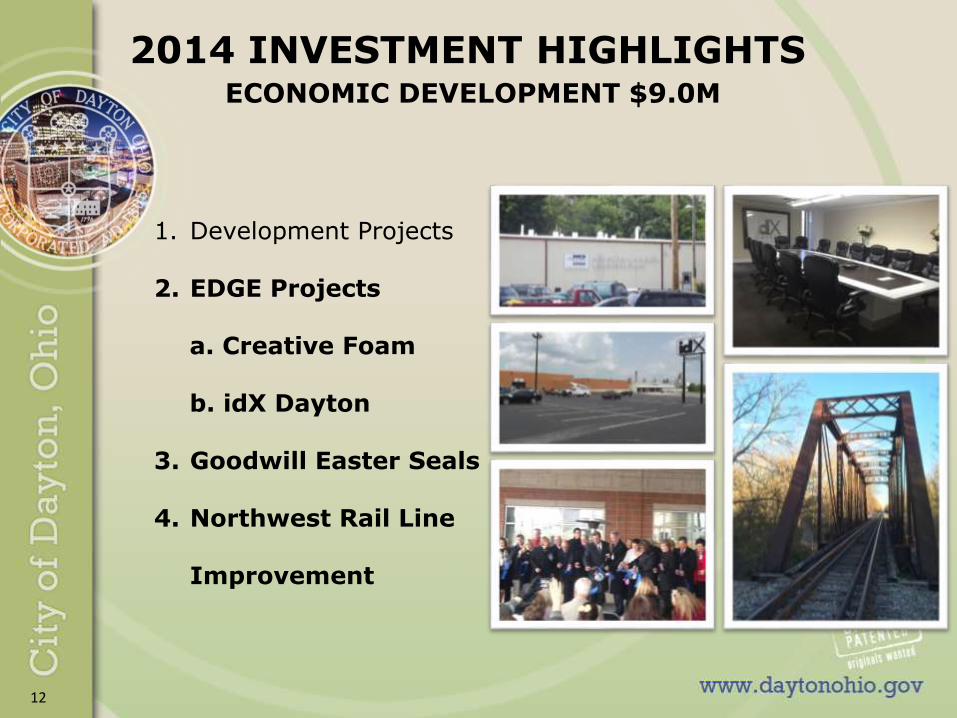
2014 INVESTMENT HIGHLIGHTSECONOMIC DEVELOPMENT $9.0M
1. Development Projects
2. EDGE Projects
a. Creative Foam
b. idX Dayton
3. Goodwill Easter Seals
4. Northwest Rail Line
Improvement
12
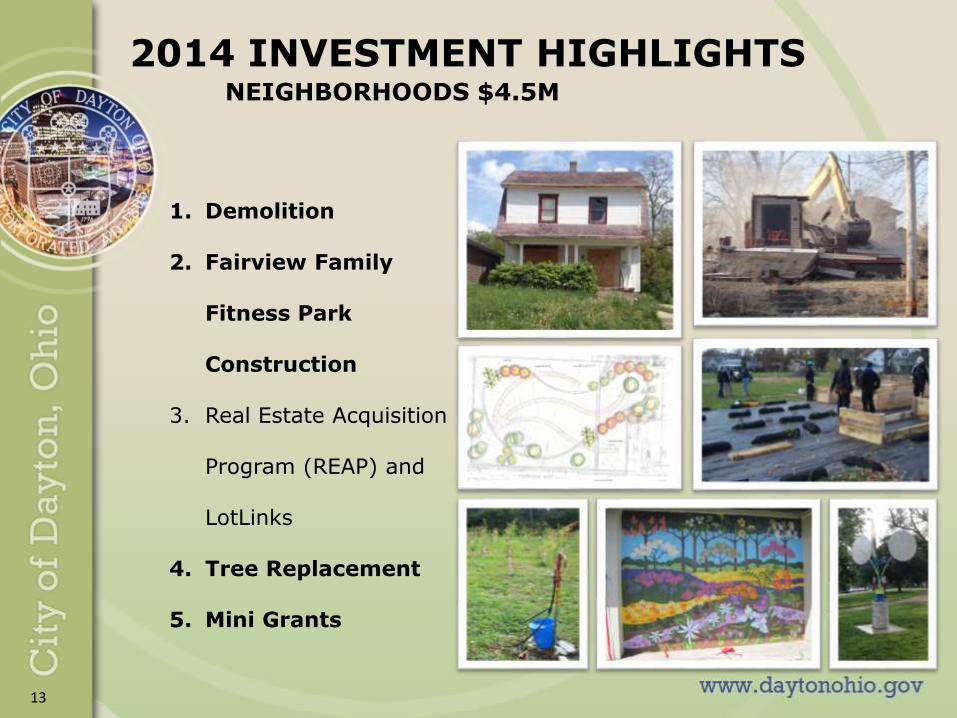
2014 INVESTMENT HIGHLIGHTSNEIGHBORHOODS $4.5M
1. Demolition
2. Fairview Family
Fitness Park
Construction
3. Real Estate Acquisition
Program (REAP) and
LotLinks
4. Tree Replacement
5. Mini Grants
13
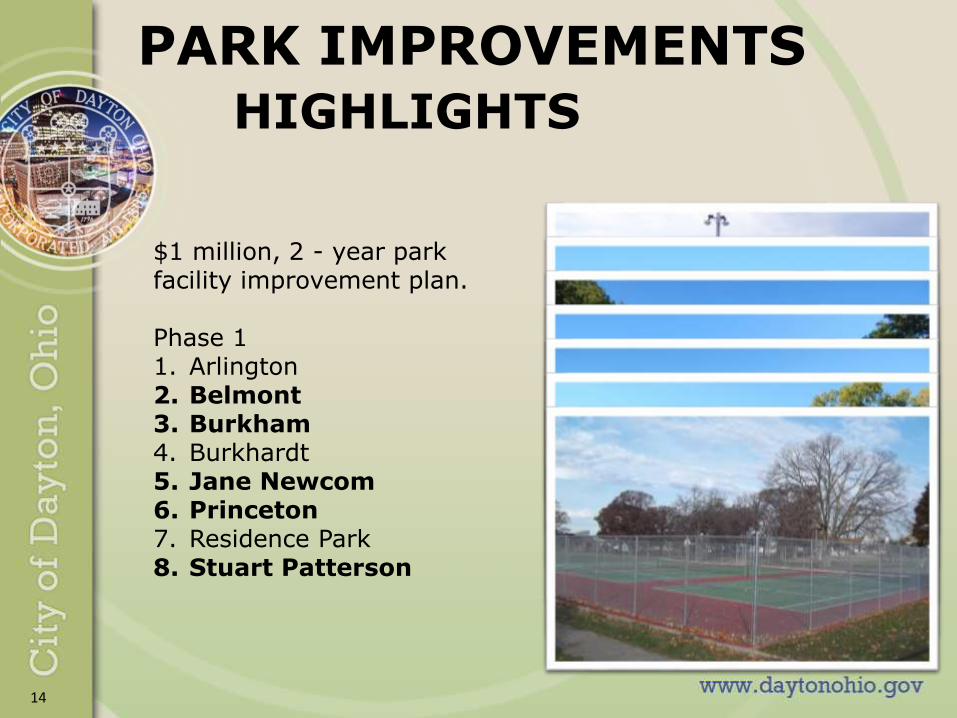
PARK IMPROVEMENTS HIGHLIGHTS
$1 million, 2 - year park facility improvement plan.
Phase 11. Arlington2. Belmont3. Burkham4. Burkhardt5. Jane Newcom6. Princeton7. Residence Park8. Stuart Patterson
14
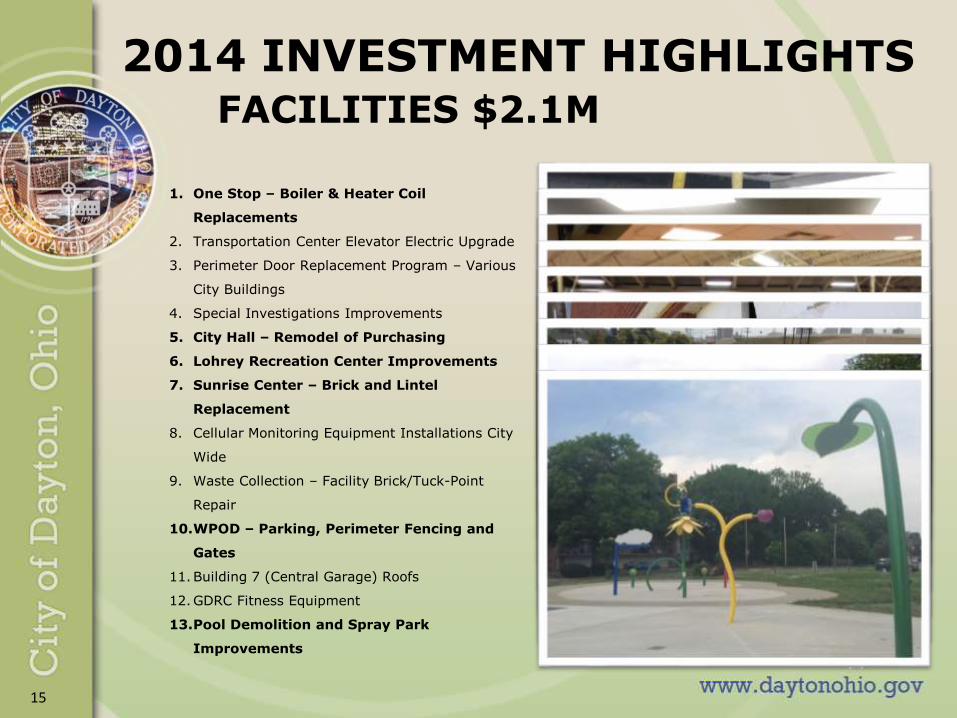
1. One Stop – Boiler & Heater Coil
Replacements
2. Transportation Center Elevator Electric Upgrade
3. Perimeter Door Replacement Program – Various
City Buildings
4. Special Investigations Improvements
5. City Hall – Remodel of Purchasing
6. Lohrey Recreation Center Improvements
7. Sunrise Center – Brick and Lintel
Replacement
8. Cellular Monitoring Equipment Installations City
Wide
9. Waste Collection – Facility Brick/Tuck-Point
Repair
10.WPOD – Parking, Perimeter Fencing and
Gates
11.Building 7 (Central Garage) Roofs
12.GDRC Fitness Equipment
13.Pool Demolition and Spray Park
Improvements
2014 INVESTMENT HIGHLIGHTSFACILITIES $2.1M
15
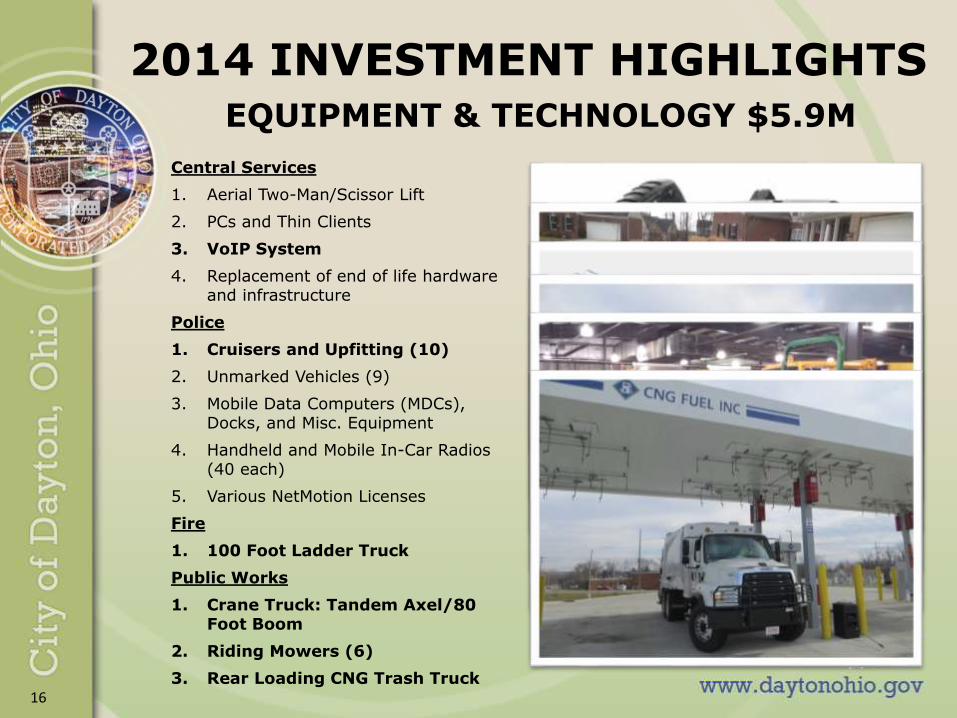
2014 INVESTMENT HIGHLIGHTSEQUIPMENT & TECHNOLOGY $5.9M
Central Services
1. Aerial Two-Man/Scissor Lift
2. PCs and Thin Clients
3. VoIP System
4. Replacement of end of life hardware and infrastructure
Police
1. Cruisers and Upfitting (10)
2. Unmarked Vehicles (9)
3. Mobile Data Computers (MDCs), Docks, and Misc. Equipment
4. Handheld and Mobile In-Car Radios (40 each)
5. Various NetMotion Licenses
Fire
1. 100 Foot Ladder Truck
Public Works
1. Crane Truck: Tandem Axel/80 Foot Boom
2. Riding Mowers (6)
3. Rear Loading CNG Trash Truck 16
2015 RECOMMENDED INVESTMENTS
17
2015 INVESTMENT PLANCASH AND DEBT
Cash Investments -- $10.2M:
1. $7.6M Sourced from 2015 General Fund Budget
2. $1.6M from 2014 Year-End General Fund Transfers
3. $1.0M Prior Year Funds
G.O. Debt and OPWC Loans -- $1.5M:
1. Over Last 3-Years Shifted 0.5 Mills to Bond Retirement
2. $1M Issued in 2012 for Pool Renovations
3. $500,000 in 0% OPWC Loans
18
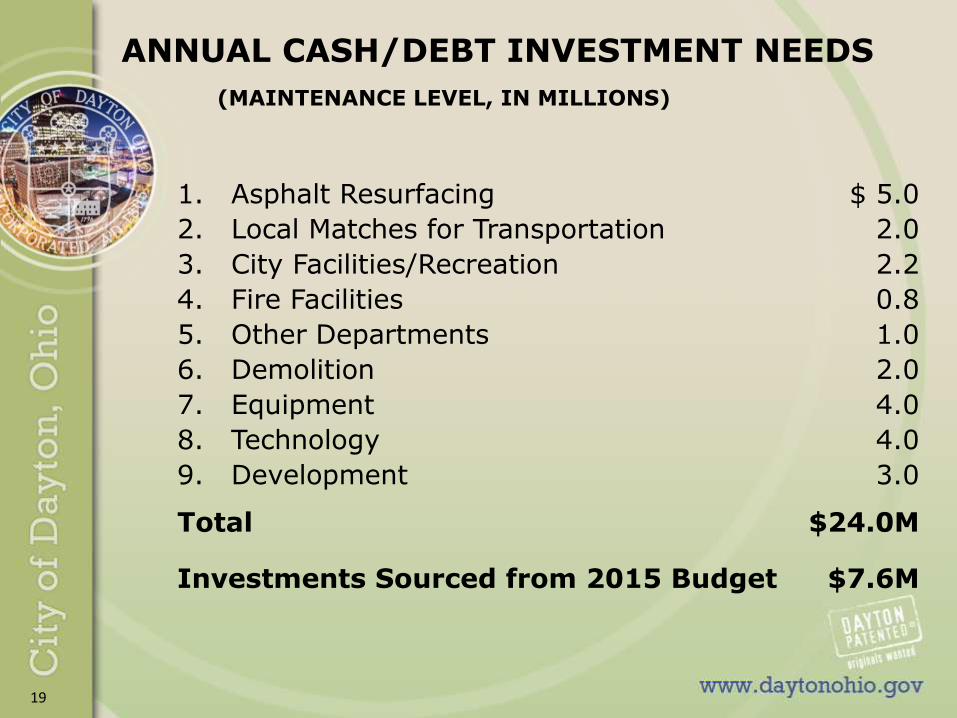
ANNUAL CASH/DEBT INVESTMENT NEEDS
(MAINTENANCE LEVEL, IN MILLIONS)
1. Asphalt Resurfacing $ 5.0
2. Local Matches for Transportation 2.0
3. City Facilities/Recreation 2.2
4. Fire Facilities 0.8
5. Other Departments 1.0
6. Demolition 2.0
7. Equipment 4.0
8. Technology 4.0
9. Development 3.0
Total $24.0M
Investments Sourced from 2015 Budget $7.6M
19
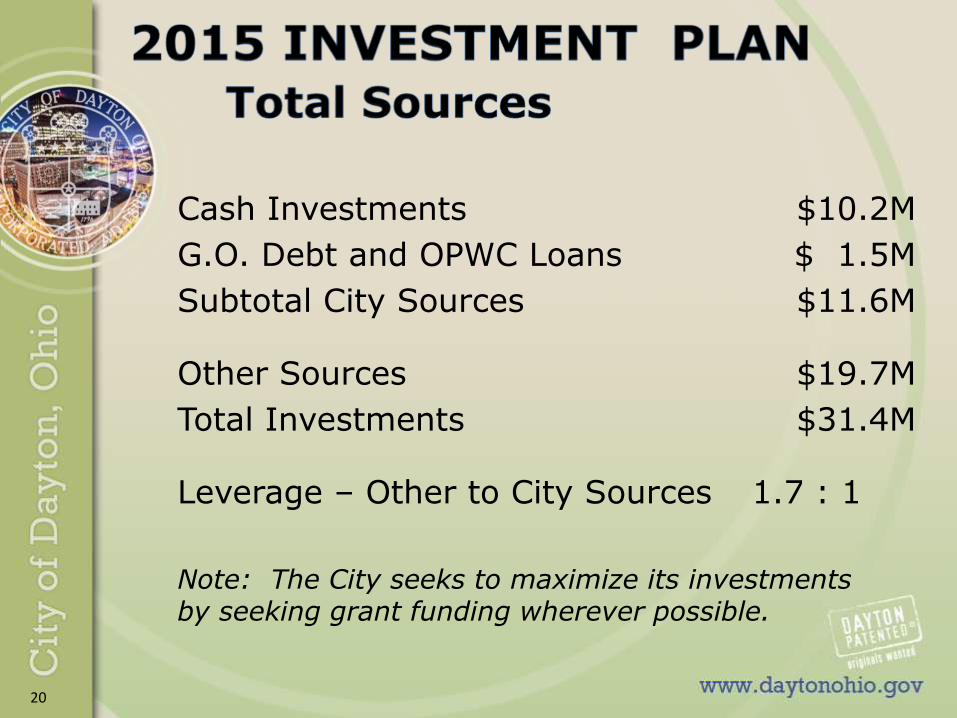
Cash Investments $10.2M
G.O. Debt and OPWC Loans $ 1.5M
Subtotal City Sources $11.6M
Other Sources $19.7M
Total Investments $31.4M
Leverage – Other to City Sources 1.7 : 1
Note: The City seeks to maximize its investmentsby seeking grant funding wherever possible.
20
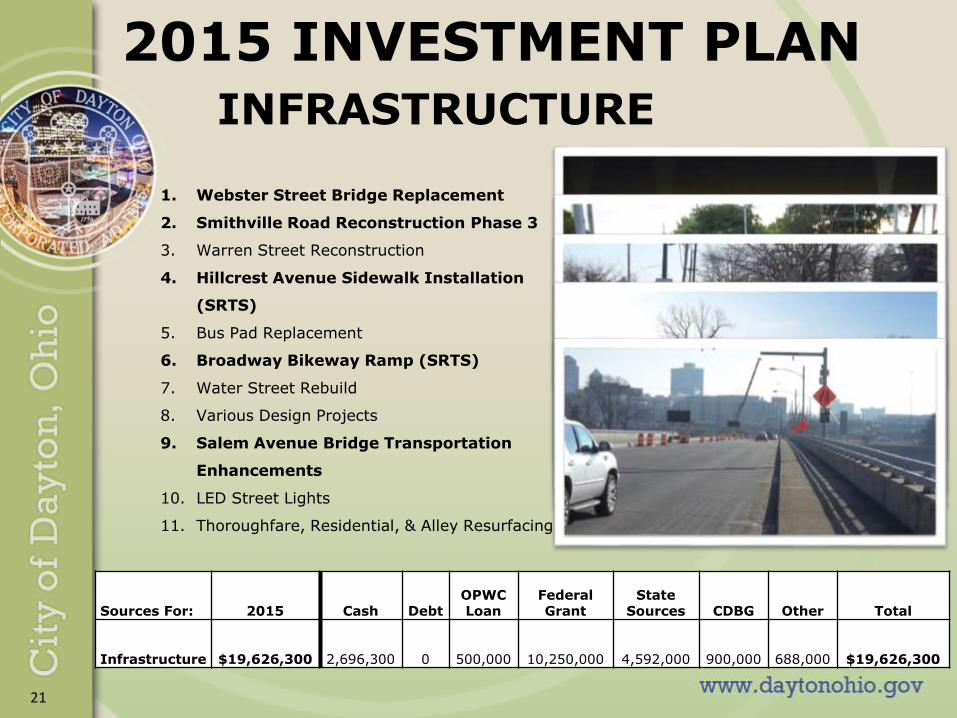
2015 INVESTMENT PLAN INFRASTRUCTURE
1. Webster Street Bridge Replacement
2. Smithville Road Reconstruction Phase 3
3. Warren Street Reconstruction
4. Hillcrest Avenue Sidewalk Installation
(SRTS)
5. Bus Pad Replacement
6. Broadway Bikeway Ramp (SRTS)
7. Water Street Rebuild
8. Various Design Projects
9. Salem Avenue Bridge Transportation
Enhancements
10. LED Street Lights
11. Thoroughfare, Residential, & Alley Resurfacing
Sources For: 2015 Cash DebtOPWC Loan
Federal Grant
State Sources CDBG Other Total
Infrastructure $19,626,300 2,696,300 0 500,000 10,250,000 4,592,000 900,000 688,000 $19,626,300
21
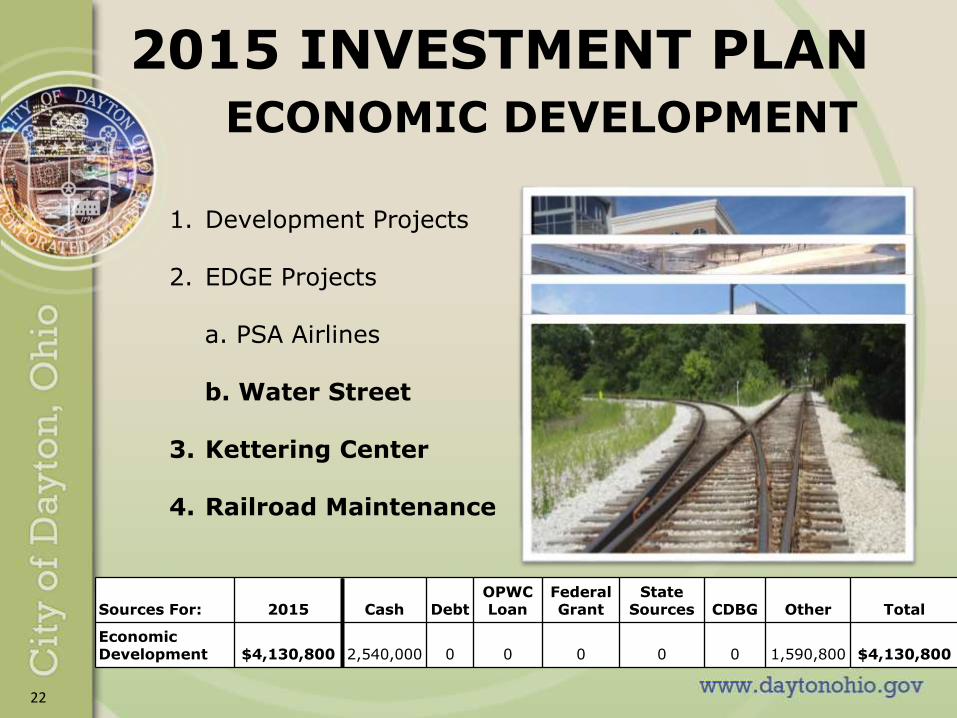
2015 INVESTMENT PLAN ECONOMIC DEVELOPMENT
1. Development Projects
2. EDGE Projects
a. PSA Airlines
b. Water Street
3. Kettering Center
4. Railroad Maintenance
Sources For: 2015 Cash DebtOPWC Loan
Federal Grant
State Sources CDBG Other Total
Economic Development $4,130,800 2,540,000 0 0 0 0 0 1,590,800 $4,130,800
22
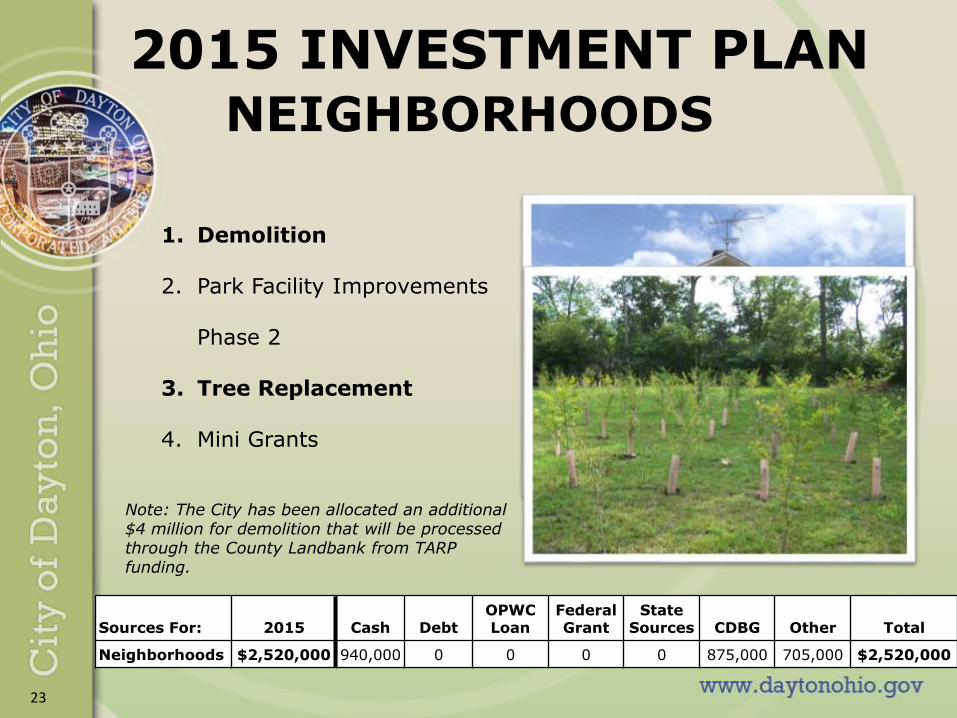
2015 INVESTMENT PLAN NEIGHBORHOODS
Note: The City has been allocated an additional $4 million for demolition that will be processed through the County Landbank from TARP funding.
1. Demolition
2. Park Facility Improvements
Phase 2
3. Tree Replacement
4. Mini Grants
Sources For: 2015 Cash DebtOPWC Loan
Federal Grant
State Sources CDBG Other Total
Neighborhoods $2,520,000 940,000 0 0 0 0 875,000 705,000 $2,520,000
23
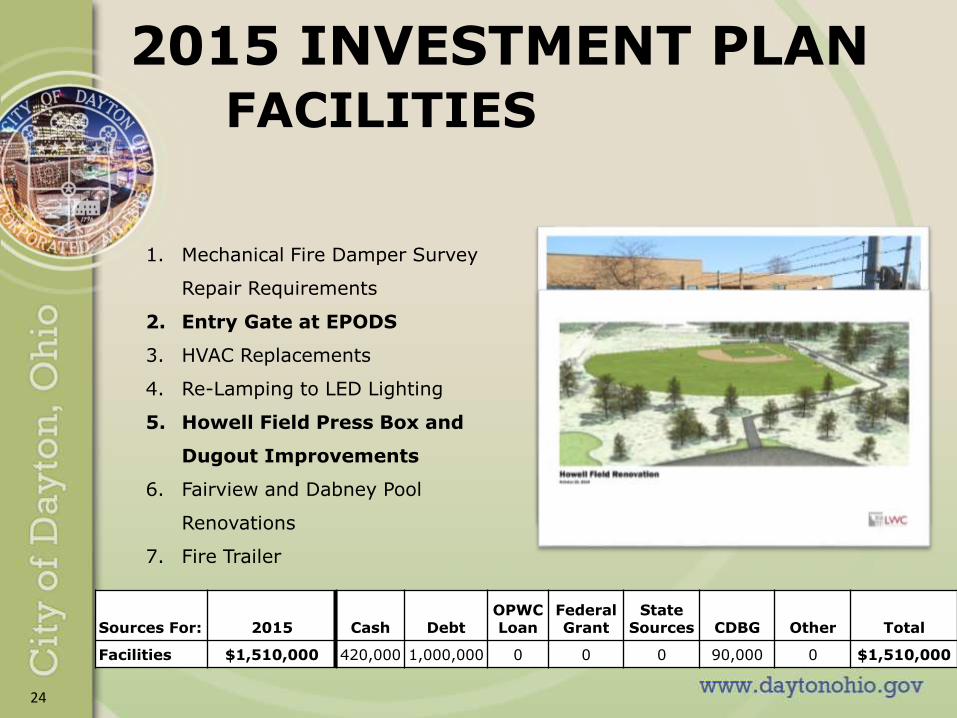
2015 INVESTMENT PLAN FACILITIES
1. Mechanical Fire Damper Survey
Repair Requirements
2. Entry Gate at EPODS
3. HVAC Replacements
4. Re-Lamping to LED Lighting
5. Howell Field Press Box and
Dugout Improvements
6. Fairview and Dabney Pool
Renovations
7. Fire Trailer
Sources For: 2015 Cash DebtOPWC Loan
Federal Grant
State Sources CDBG Other Total
Facilities $1,510,000 420,000 1,000,000 0 0 0 90,000 0 $1,510,000
24
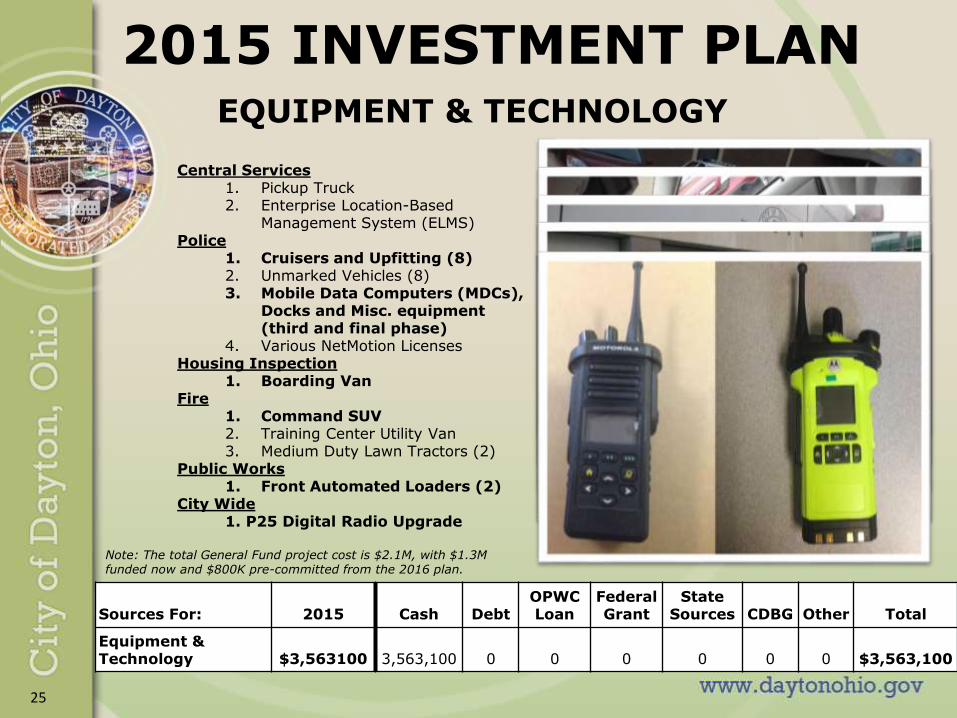
2015 INVESTMENT PLAN EQUIPMENT & TECHNOLOGY
Central Services1. Pickup Truck2. Enterprise Location-Based
Management System (ELMS)Police
1. Cruisers and Upfitting (8)2. Unmarked Vehicles (8)3. Mobile Data Computers (MDCs),
Docks and Misc. equipment (third and final phase)
4. Various NetMotion LicensesHousing Inspection
1. Boarding VanFire
1. Command SUV2. Training Center Utility Van3. Medium Duty Lawn Tractors (2)
Public Works1. Front Automated Loaders (2)
City Wide1. P25 Digital Radio Upgrade
Sources For: 2015 Cash DebtOPWC Loan
Federal Grant
State Sources CDBG Other Total
Equipment & Technology $3,563100 3,563,100 0 0 0 0 0 0 $3,563,100
Note: The total General Fund project cost is $2.1M, with $1.3M funded now and $800K pre-committed from the 2016 plan.
25
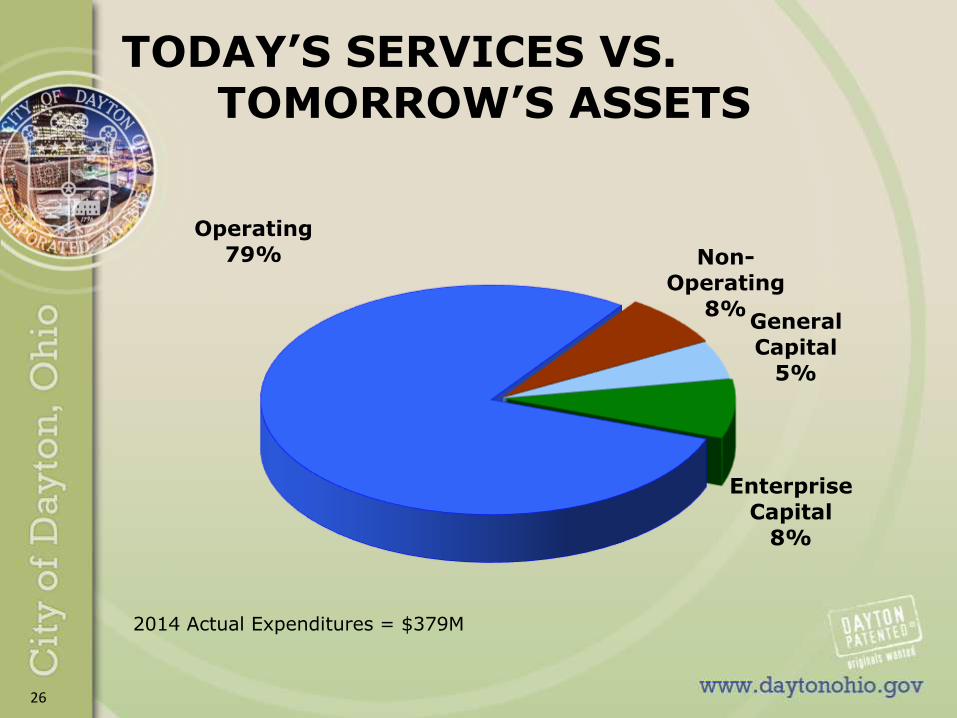
TODAY’S SERVICES VS. TOMORROW’S ASSETS
Operating
79% Non-
Operating
8%General
Capital
5%
Enterprise
Capital
8%
2014 Actual Expenditures = $379M
26
Special Issues
1. Insufficient investment when compared to the City’s asset base.
2. Aging infrastructure and facilities, some with structural problems.
3. Aging equipment, some of which are at end of useful life and are costly to maintain.
4. Inability to keep pace with resurfacing and other routine maintenance resulting in the need for complete reconstruction.
5. Ongoing need for disposal or sale of City assets.
6. Need to identify resources for investments in newer, greener and more high-tech improvements to decrease operating costs and enhance customer service and quality of life.
27
THANK YOU
28
Questions?