Embed Size (px)
Citation preview

Causal Models and Structural
Equations Day 1Equations Day 1
Peter Schmidt

Day 1: Overview
1. Course Overview
2. Notation
3. Philosophy of Science and SEM
4. Differences: Exploratory FA and CFA
2
4. Differences: Exploratory FA and CFA
5. Unidimensionality
6. Measurement Errors
7. Formative and reflective Indicators
8. Summary and Introduction of practical session

Overview of the Course
1st part: Confirmatory factor analysis
2nd part: Full structural equation model
Course procedure: Regular alternation
3
Course procedure: Regular alternation between

Overview: Types of models 1:
Factor (measurement) Model
A
x1
x
e1
e
4
A x2
x3
e2
e3

Overview: Types of models 1:
Formative Indicator Model
A
x1
xe4
5
A x2
x3
e4

Overview: Types of models 1:
Feedback Model
A
x1
x
e1
ee4
6
A x2
x3
e2
e3
e4

Types of Models in the Course
Factor model (measurement model)- Single or simultaneous analyses of the
measurement models
- Exploratory or confirmatory simultaneous factor analysis
- Multiple group comparison, structured means
7
- Multiple group comparison, structured means analyses
- Confirmation, rejection or modification of the models.
- Reflective vs. Formative vs. Feedback indicators

Overview: Types of models 2:
Structural Model
A B
x1y1
e1d1
d3
8
• What are the causal relationships among the
theoretical (latent) variables?
• How strong are these relationships?
• How strong is the stochastic error (d3)?
Ax2
y2 d2e2

Types of Models in the Course
Structural model
- Analysis of the core theory: Is the explication of the
core hypotheses correct?
- MIMIC Model
- Confirmation, rejection or modifications of models
9
- Strictly Confirmatory (SC), Alternative Models (AM),
Model Generating (MG)
- Multiple Group Analysis, moderator and non-linear
effects
- Mediators and indirect effects compared to direct
effects

Overview: General Information about the
SEM approach and using AMOS
ADVANTAGES USING SEM
• Test complex hypotheses involving causal relationships among constructs (latent variables).
• Unifies several multivariate methods into one
10
• Unifies several multivariate methods into one analytic framework.
• Effects of latent variables on each other and on observed variables.
• Possibility: testing alternative hypotheses.

• Multivariate models without latent variables:
regression models, dummy regressions,
variance analyses and covariance analyses.
• Multivariate models with latent variables:
confirmatory factor analysis (CFA), second order
and nth-order factor analysis, MIMIC models,
canonical correlations, MTMM models, and
11
canonical correlations, MTMM models, and
structural equation models (SEM).
• Longitudinal dynamic models: CFA with panel
data, SEM with panel data, autoregressive
models, cross-lagged models, latent growth
curves and differential equations.

Notation: Measurement Model
A
x1
x2
x3
e1
e2
e3
12
latent factor (construct)
indicator (observed variable)
measurement error
unidimensionalrelationship
A
x1
e1

Notation: Measurement ModelParameters
A
x1
x2
e1
e2
1.34.74
1 2.13
.58
13
.74 variance of latent construct
1.34 factor loading (unstandardized)
.58 squared multiple correlation
1 Path coefficient of error
2.13 error-variance
x3 e3

Notation: Measurement Model
• correlation, unidimensional path, feedback
foreign antisemitism
14
foreign
Correlation
Unidimensional path (effect)
Feedback relation
No Relation!!!
SEM and Philosophy of
Science
• Deductive power
• Transformation of substantive theory
• Operationalizations into confirmatory models
15
• Operationalizations into confirmatory models with restrictions to be tested
• Simultaneous test of measurement theory and substantive theory

The methodology provides behavioral
scientists with tools for:
• Stating theories more exactly
• Testing theories more precisely
• Testing alternative theories against each
16
• Testing alternative theories against each other
• Generating a more thorough understanding of observed data.
SEM and Philosophy of Science
Lakatos-Kuhn-Scheme:
- metaphysical Assumptions
- Propositions of Core Theory
17
- Propositions of Core Theory
- Correspondence Rules

Terminology from Philosophy
of science for theory
construction
Terminology of SEM
Core theory composed of
theoretical postulates (deductive nomological explanation, a�b)
Structural model- causal
relations between constructs
Assumptions of the core theory Assumptions of the structural
18
model
Operationalization of theoretical
constructs/dimensions (rules of
correspondence)
Assumptions of
operationalizations (linearity?
Additivity)
Measurement theory- relating
factors to indicators with a set
of assumptions (linearity?
Additivity)

Exploratory Factor Analysis
(orthogonal-no correlation between A1 and A2)
X1=f11A1 + f12A2 + e1
A1 A2f12
19
x1 x2 x3 x4
e1 e2 e3 e4
f11

Exploratory Factor Analysis (oblique – factors are correlated)
1212111 ++= δξλξλ1x
1ξ 2ξ12λ
20
11λ
1x 2x 3x 4x
1δ 2δ 3δ 4δ

Confirmatory Factor Analysis• X4 = f42A2 + 0*A1 + e4
A1 A2
21
x1 x2 x3 x4
e1 e2 e3 e4
x3
e3
f42

Confirmatory Factor Analysis with correlated factors (CFA) of the theory of planned behavior (with a residual correlation-a non random error)
Pbc
PBC1
PBC2
PBC3
e1
e2
e3
22
Subjective
norms
Attitude
NORM1
NORM2
NORM3
Attitu1
Attitu2
Attitu3
e4
e5
e6
e7
e8
e9

Exercise
• Select a theory you are working with
• Select a construct from your theory
• Select some items which measure this construct
23
construct
• Draw a measurement model with the respective indicators and constructs

Unidimensionalitiy
• Assumption: A set of Items is explained by only one underlying dimension/construct
x1 e1
24
A
x1
x2
x3
e1
e2
e3
Types of measurement error
• 1) Random measurement error (e‘s): we can
control for it and estimate it if we have at least
two indicators
• 2) Non-random measurement errors (the
25
• 2) Non-random measurement errors (the
correlations between the random measurement
errors (e‘s), e.g. social desirability, method
effect): we can control for them and estimate
them if we have at least three indicators, and we
can partly control for them and estimate them
when we have two indicators
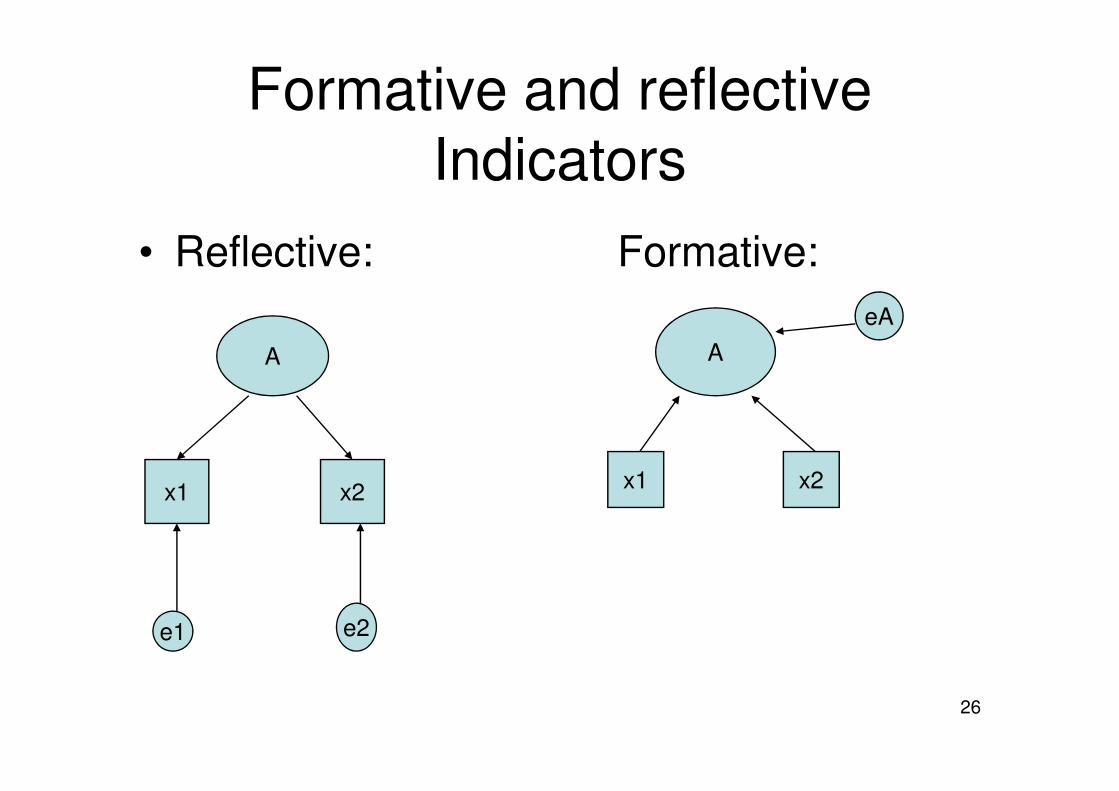
Formative and reflective
Indicators
• Reflective: Formative:
A A
eA
26
x1 x2
e1 e2
x1 x2

Summary and Lab Session:
Core theory: Path diagram of the theoretical
assumptions:
Age, gender,
education
27
Conformity/Tradition
Allowing immigrants
into the country
Universalism/
Benevolence

Hypotheses:
SH1) The higher the importance of conformity and
tradition, the lower the support for allowing
immigrants into the country.
SH2) The higher the importance of universalism
28
SH2) The higher the importance of universalism
and benevolence, the higher the support for
allowing immigrants into the country.

HEitem2e2
11
item1e11
SDitem2e4
item1e311
1
STitem2e6
item1e511
1
UNBE
item2e8
item1e7
11
1
item3e91
item4e101
item5e111
Measurement
model for 7 values
in the ESS
29
COTRitem2e13
item1e12
11
1
SECitem2e17
item1e1611
1
POACitem2e19
item1e18
11
1
item5e11
item3e141
item4e151
item3e201
item4e211

Core theory: Path diagram of the theoretical assumptions (Round 2):
P O A C
im p r i c h
e 1 0
1
1
i p r s p o t
e 1 11
i p s h a b t
e 1 21
i p s u c e s
e 1 31
H E
i p g d t im
e 1 4
1
1
i m p f u n
e 1 51
S T
im p d i f f e 1 611
i p a d v n t e 1 71
i p s t r g ve 2 11
E x 2 : S C F A in t h e N e th e r la n d s , v a lu e s E S S R 2
30
U N B E
i p e q o p t e 11
1
i p u d r s t e 21
i m p e n v e 31
i p h l p p l e 41
T R C O
i p m o d s t
e 6
1
1i m p t r a d
e 7
1i p f r u l e
e 8
1i p b h p r p
e 9
1
S D
ip c r t i v e 1 81 1
im p f r e e e 1 91
S E Cim p s a f ee 2 0
11
i p s t r g ve 2 1
i p l y l f r e 51

An additional research question:
To what extent are the values as proposed to be measured by Shalom Schwartz (1992) equivalent across the three countries Netherlands, Belgium and
31
countries Netherlands, Belgium and Luxembourg?
And across a larger set of countries from the ESS?
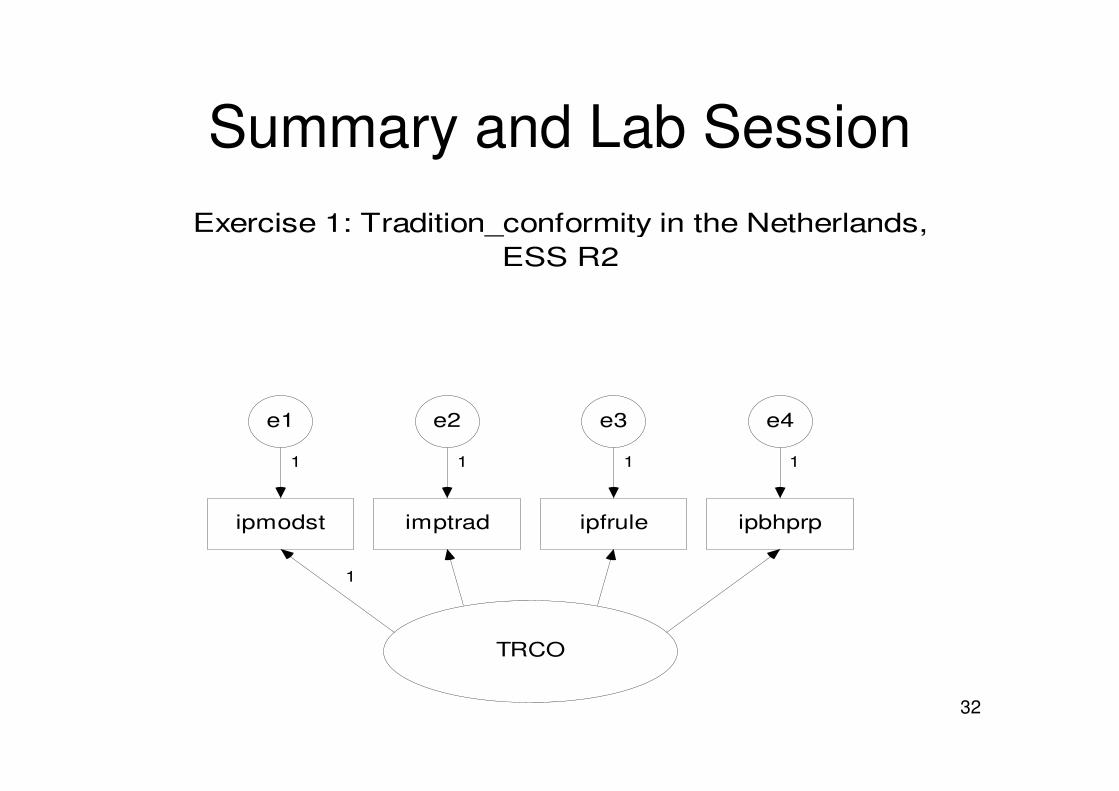
Summary and Lab Session
Exercise 1: Tradition_conformity in the Netherlands,
ESS R2
32
TRCO
ipmodst
e1
1
1
imptrad
e2
1
ipfrule
e3
1
ipbhprp
e4
1

Summary and Lab Session:
The Data
The data we will use in the course:
ESS 2004-2005, focusing on the value questions
33
Sample Size:
• The Netherlands: N = 1,881
• Belgium: N = 1,778
• Luxembourg: N = 1,635
• Total sample size: N=5,294

Syntax for generating the
Correlation Matrix
CORRELATIONS
/VARIABLES=selected variables
/PRINT=TWOTAIL SIG
/STATISTICS DESCRIPTIVES
/MISSING=PAIRWISE
34
/matrix out (SPSS-file.sav).
���� Example:
CORRELATIONS
/VARIABLES=ipmodst imptrad ipfrule ipbhprp
/PRINT=TWOTAIL SIG
/STATISTICS DESCRIPTIVES
/MISSING=PAIRWISE
/matrix out (cov_nl.sav).


![Inferring causal phenotype networks using structural equation … · 2013-07-02 · 1. Structural equation models Structural Equation Models [3,4] provide a general sta-tistical modeling](https://img.pdfslide.us/doc/110x75/5f3262f0f69d6162f26e46ed/inferring-causal-phenotype-networks-using-structural-equation-2013-07-02-1-structural.jpg)


![A Critical View of the Structural Causal ModelThe algorithm learns three networks in a way that mimics arXiv:2002.10007v1 [cs.LG] 23 Feb 2020 A Critical View of the Structural Causal](https://img.pdfslide.us/doc/110x75/60b67f3bc5411138e05aa567/a-critical-view-of-the-structural-causal-model-the-algorithm-learns-three-networks.jpg)